Article

Hydraulic Traits in Populus simonii Carr. at Stands of Categorized Ages in a Semi-Arid Area of Western Liaoning, Northeast China

1
College of Forestry, Shenyang Agricultural University, Shenyang 110866, China
2
Key Laboratory for Silviculture of Liaoning Province, Shenyang Agricultural University, Shenyang 110866, China
3
Northeast Institute of Geography and Agroecology, Chinese Academy of Sciences, Changchun 130000, China
*
Author to whom correspondence should be addressed.
Forests 2023, 14(9), 1759; https://doi.org/10.3390/f14091759
Submission received: 24 July 2023 / Revised: 18 August 2023 / Accepted: 28 August 2023 / Published: 30 August 2023
(This article belongs to the Section Forest Hydrology)

Abstract

:
Poplar plantations can acclimate to drought stress in semi-arid areas, where the variation of stand age may result in varied water adaptation strategies presented as hydrodynamic performance. In this study, nine mature Populus simonii Carr. individuals were targeted as sampling objects in plantations characterized to three stand ages: young (9 yr), middle-aged (17 yr), and near-mature (29 yr) stages in a semi-arid area of western Liaoning, Northeast China. Hydraulic traits were investigated as parameters of leaf pressure-volume curves, xylem embolism vulnerability curves, hydraulic structure, and wood density (WD). Results showed that osmotic potential (Ψtlp) and relative water content at the turgor loss point and cell-wall bulk elastic modulus were lowest in middle-aged stands (−2.19 MPa; 86.71%; 13.75 MPa). Stem and leaf-specific hydraulic conductivity (Ks and LSC) were all the highest in middle-aged stands. Xylem embolism vulnerability (P50) and lethal water potential of trees (P88) increased with the growth of stand age. Young stands faced minimal risk of hydraulic failure according to the stomatal safety margin (SSMtlp, Ψtlp minus P50), which was consistent with the comprehensive evaluation results of the principal component analysis. WD was related to P88 (R2 = 0.51; p < 0.05). P50 was related to drought avoidance traits Ψtlp (r = 0.76; p < 0.05) but not to xylem efficiency (Ks). Overall, WD can be an excellent proxy for hydraulic safety monitoring. Young and middle-aged Populus simonii populations are more adaptable to drought conditions than near-mature populations, and near-mature stands should receive intermediate cuttings to avoid exposure to drought stress.

1. Introduction

In recent years, persistent climate change has led to more frequent, longer-lasting, and more intense drought events [1,2]. This can cause widespread plant dieback and even death [3,4]. Drought can impose severe effects on the structure and function of forests [5]. Therefore, it is necessary to evaluate the environmental adaptability of different stand ages under drought conditions. It is of great significance to maintain the sustainable management of plantation forests.
Plantations are an important forest type globally due to their irreplaceable functions in restoring forest ecosystem structure and slowing down possible consequences caused by global climate change [6,7,8]. Poplar is one of the most widespread tree species in the world, mainly distributed in the northern temperate zone, spanning from 22° to 70° N and up to 4800 m above sea level [9]. It has a relatively fast growth rate and high adaptability to abiotic and biotic stresses [10]. It is also a principal plantation species established with the aim of ecological protection in three major northern regions of China (North China, Northeast China, and Northwest China). In recent years, however, poplar plantations used for windbreak and sand fixation have experienced extensive degradation and mortality [11]. Xylem water potential decline breaks the water column in the plant and allows air to enter the vessels, hinders water transport, and leads to hydraulic dysfunction of trees, which was considered to be a main cause of poplar plantation dieback and death [12,13]. This made xylem embolism vulnerability (P50, xylem water potential at 50% loss of conductivity) and angiosperm death threshold (P88, xylem water potential at 88% loss of conductivity) the key physiological parameters for indicating plant mortality and assessing drought tolerance [14,15,16,17]. Some scholars found that P50 was positively correlated with tree age; that is, the older the tree, the greater the mortality risk [18]. Conversely, it has been suggested that young trees are more sensitive to drought [19,20]. Some studies have even suggested that middle-aged trees have a higher survival rate [21]. At present, the relationship between tree mortality and tree age is still highly controversial. Studies on the relationship between the two are mainly concentrated in the fields of forest surveys, dendrochronology, and remote sensing [22,23,24]. It has been found that drought-exposed trees undergo a series of morphological and structural changes and physiological and biochemical responses to adapt to stress [25,26,27]. Hydrodynamic properties were considered to be a set of fatal traits reflecting the environmental adaptability of trees [28,29]. These parameters can also be closely related to the rate of mortality plants face during drought stress [30,31,32,33]. However, they have rarely been applied to studies of different stand ages.
In addition to xylem embolism resistance, water potential at the turgor loss point (Ψtlp) was another central dimension for evaluating drought adaptation in trees in hydrodynamic studies [34]. Trees with a lower Ψtlp can have a stronger drought tolerance, which was also considered to be one of the most relevant mechanisms accounting for drought adaptation [35]. The mortality risk of drought-stressed trees cannot be accurately assessed using a single indicator [36]. The hydraulic safety margin (HSM) and stomatal safety margin (SSM) have also been used to predict tree mortality in recent years [14,37,38]. Studies have shown that SSM can be a better predictor of plant mortality risk in drought [39]. However, the changes associated with these hydrodynamic parameters have not been well revealed in poplar plantations of different stand ages. However, the changes associated with these hydraulic parameters in poplar plantations of different ages have not been well revealed. Therefore, it is important to assess the environmental adaptability of poplar plantations with different ages in drought using hydrodynamic properties. This is conducive to improving the management of forests and maintaining the stability of forest ecosystems.
In addition, it was put forth a “safety-efficiency” tradeoff law between P50 and stem-specific conductance (Ks) in trees. Wider xylem vessels are conducive to water transport while increasing the risk of embolism, which is an important finding in plant hydraulics studies [40]. Poplar is one of the tree species most susceptible to water scarcity, and its drought resistance and mortality risk are most likely related to water delivery efficiency [41]. To our knowledge, there is little understanding of this tradeoff law among parameters assessing drought tolerance, safety, and efficiency.
Drought tolerance and vulnerability to drought-induced mortality of trees can be well understood by studying their hydraulic traits. However, methods for the determination of hydraulic traits are too cumbersome, with several technical challenges unsolved. Therefore, wood density (WD) is not only an easily measured parameter but also a crucial indicator of drought tolerance in woody plants [15]. WD has been identified to be associated with P50 in both interspecific and intraspecific studies in temperate regions. Thus, it is often used as a proxy for xylem embolism resistance [42,43]. Tree species with large WD are generally more resistant to drought-induced xylem embolism and have lower mortality [44,45]. However, the prediction of WD for mortality risk has only been tested in a few species. Further validation is needed on whether it applies to risk prediction across different stand ages. Poplar, a fast-growing species with tall trees, is more difficult to sample, and determining the availability of wood density will make it easier to assess the risk of forest mortality.
In this study, Populus simonii Carr. was tested as the target species, which is also a major tree species in planted protection forests in the semi-arid region of western Liaoning Province, China. We evaluated the environmental adaptability (including drought tolerance and mortality risk) of different stand ages and determined the correlations among hydraulic traits by measuring the hydraulic traits of individual trees in young, middle-aged, and near-mature stands of Populus simonii. We hypothesized that (1) the environmental adaptability of different stand ages was different, (2) there was a tradeoff relationship between drought tolerance and hydraulic safety and efficiency of Populus simonii, and (3) WD can replace hydraulic traits that are difficult to measure.

2. Materials and Methods

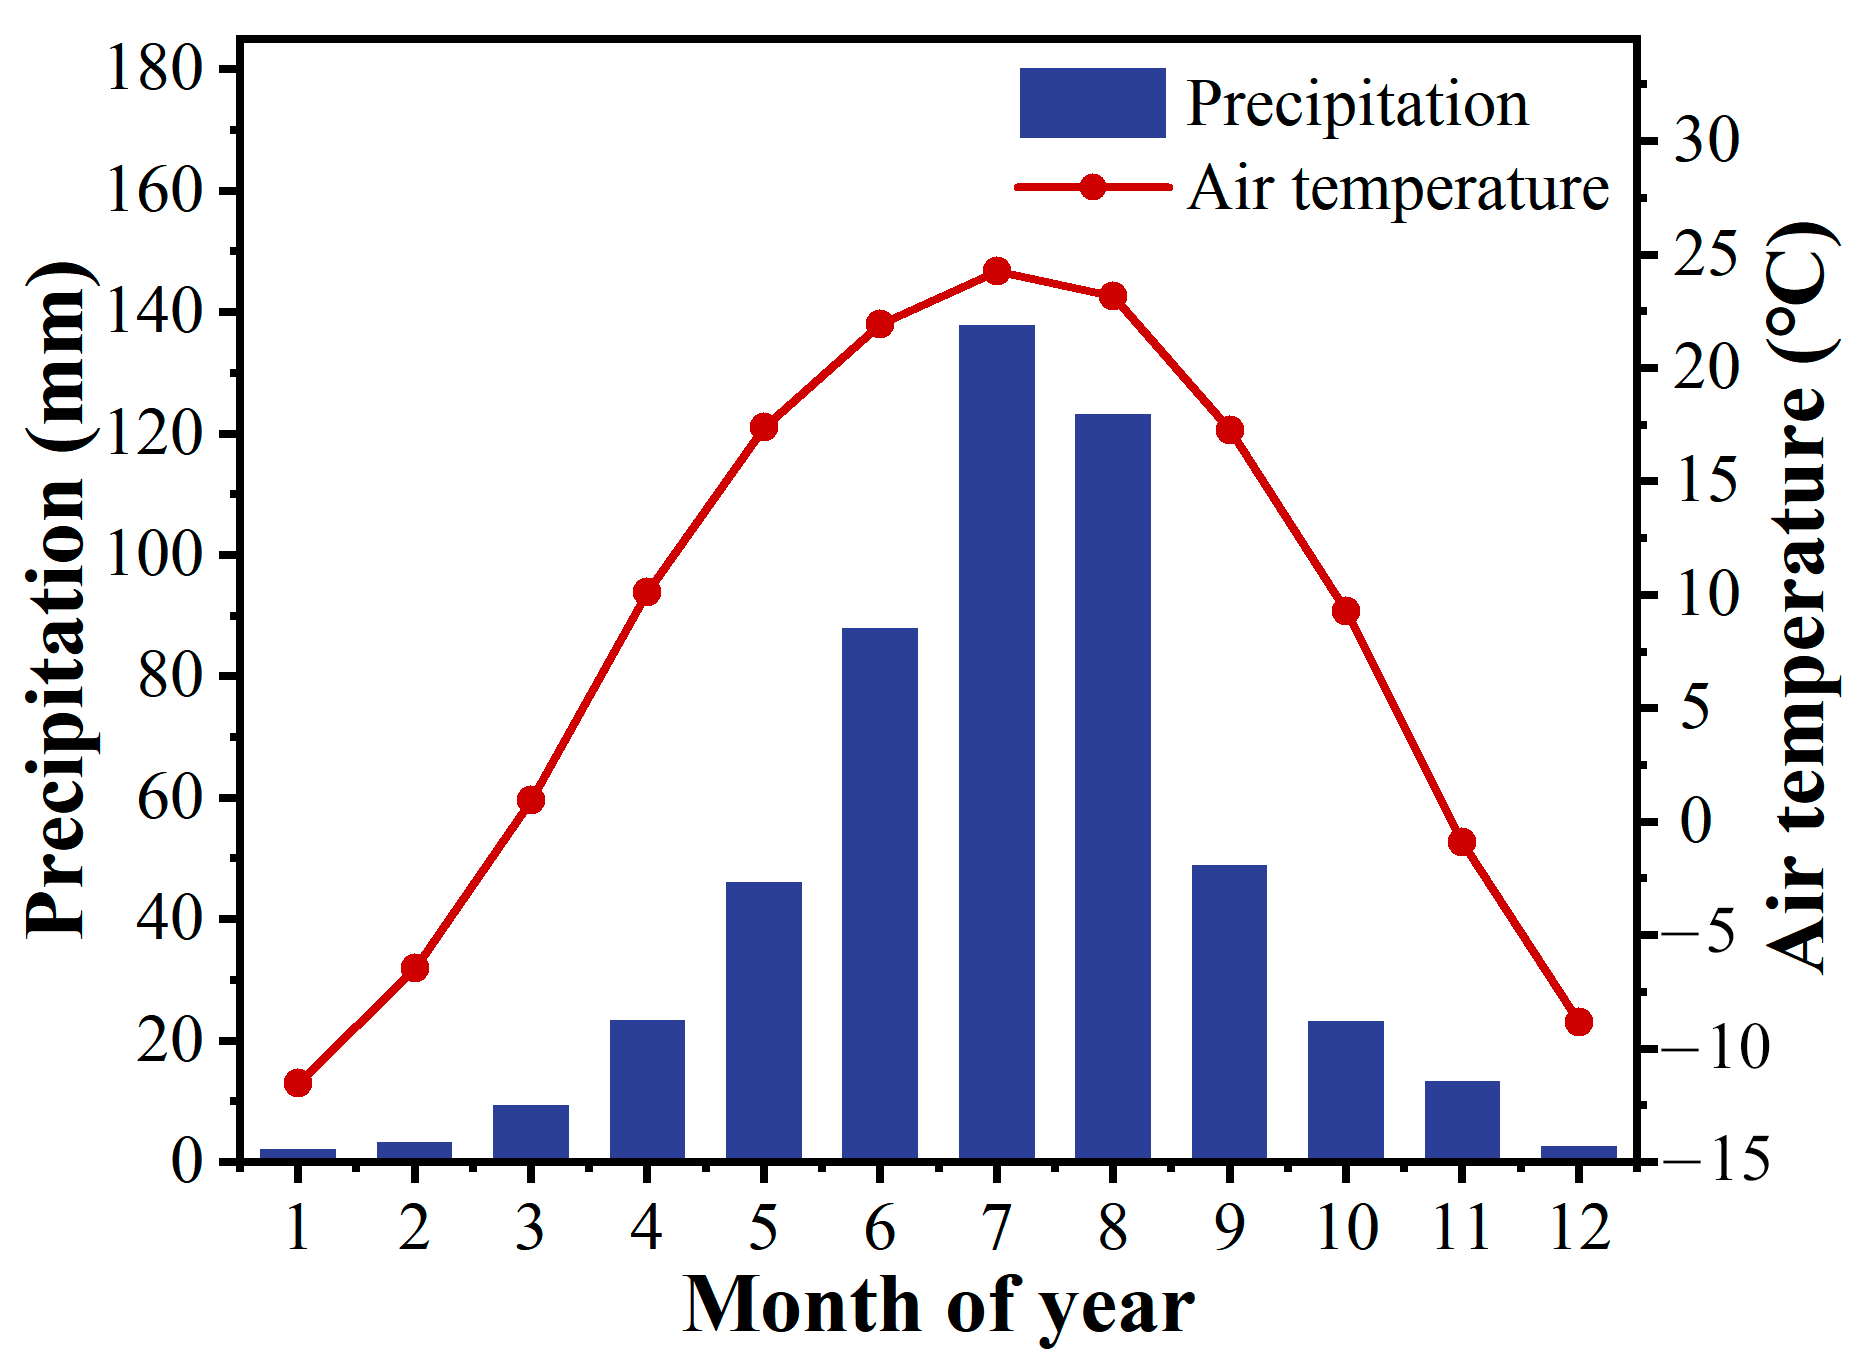
2.1. Site Description

The study was conducted in an experimental forest farm of Shenyang Agricultural University, Aer Township, Zhangwu County, a semi-arid area of western Liaoning, at the southeastern edge of Horqin Sandy Land, a warm-temperate sub-humid climate zone mainly characterized by aridity and windy conditions. According to meteorological data, the average annual temperature was 5.7 °C, and the average temperature of the highest and lowest months was 24.3 °C (July) and −11.5 °C (January), respectively. The average annual rainfall was about 500 mm, and the annual evaporation was about 1500 mm. The rainfall season was not evenly distributed, with 80% of the annual rainfall concentrated in June, July, and August (Figure 1). Soils were characterized to be mainly aeolian sandy, but there were also meadow soil, charcoal soil, and paddy soil types. The vegetation was mainly grassland vegetation, and the xerophytes were dominant. Representative plants were Populus simonii, Acer truncatum Bunge, Ulmus pumila Linn., Crataegus pinnatifida Bunge, etc.

2.2. Experimental Materials

This study was conducted in August 2022, using artificially planted Populus simonii in the experimental forest farm of Shenyang Agricultural University (122°31′~122°33′ E, 42°47′~42°49′ N) (Figure 2) in Aer Township, Zhangwu County, a semi-arid region. According to the national forestry industry standard [46] (Table S1), the age classes of poplar plantations in the north were classified into three plots of young, middle-aged and near-mature Populus simonii plantations with the same stand conditions, all with an area of 30 × 30 m (three stands were pure plantations with a density of 500 trees/hm2 in all cases, age was obtained from local plantation data and growth cone sampling). Three large trees were selected as sample trees in each plot, and their tree height, diameter at breast height, crown width, and soil water content in the understory were measured by height meter, breast dimension rules, tape measure, and TDR soil water meter (Table 1). The leaves used to measure the pressure-volume curves were derived from the upper layer of the southern canopy of each sample tree, which was located in the same direction and at the same height as the large branches used to measure the xylem embolism vulnerability curves.

2.3. Leaf Pressure-Volume Curves

The natural drying method [47] was used for measuring the leaf pressure-volume curves. Measures were commenced at 4:00 a.m. and persisted to 6:00 a.m. on a sunny day. Three branches were collected from each age-class sample tree, placed in water, and shaded to saturate them with water. When it reached saturation, one well-grown and healthy leaf was collected from each branch, dried off, and weighed on an analytical balance for the saturated fresh weight (Wsat), and the initial water potential was immediately measured with a portable plant water potential meter. The leaves were removed and placed on the experimental bench to allow them to lose water naturally. After a period of 5–20 min, the above-mentioned measurement procedure was repeated, and leaf weight (Wi) and corresponding water potential (Ψleaf) were measured until the water potential no longer decreased. Thereafter, the leaves were dried in an oven at 75 °C for 48 h and weighed for dry mass (Wd). This process should pay attention to whether the leaves were broken and the end of the dry weight measurement to weigh all the fragments. The relative water content was calculated using Equation (1) as follows:
R W C = W i W d W s a t W d × 100 %

2.4. Xylem Embolism Vulnerability Curves

Xylem embolism was induced by bench dewatering [48,49]. Before the curve determination, the maximum vessel length was determined by the air injection method [50], which ranged from 120 to 175 cm for all three stand ages of Populus simonii. It was ensured that the branches obtained from the sample tree collected for measuring xylem embolism vulnerability curves were larger than the maximum vessel length and were forked to avoid embolism caused by artificial cutting [39]. From 4:00 to 6:00 a.m., three large branches were taken from the upper layer of the southern canopy of each sample tree, and the sampling length was about three meters (greater than 1.5 times the maximum vessel length). The cutting ends of the branches were wrapped with wet, moist towels, placed in two layers of black plastic bags, and sealed to the laboratory (the journey time was within 30 min). On arrival at the laboratory, the branches were recut underwater, the cut ends were submerged, and the remaining parts were wrapped in black plastic bags and rehydrated for 24 h before measurement. After rehydration, the branches were removed, the cut end was wrapped with glue and sealing film, and the branches were placed on the experimental table to dry naturally at different times. Before measurement, the branches were completely wrapped with black plastic bags for light-proof treatment so that the water balance of the whole branch was at least 1 h. After equilibrium, the leaf water potential was measured instead of the xylem water potential. After the measurement of the water potential, the tip of the branch was placed underwater for cutting, and the xylem tension was released in the water for 10 min to avoid cutting artifacts [51]. Then, the branch was cut close to the base and at a distance of about 30 cm from the branch to be measured. The whole section was submerged in water, and the stem segment was slowly trimmed from both ends to the measurement size (10–15 cm), and the direction was marked. The bark was peeled from both ends of the stem segment to be measured (about 1 cm in length) and wrapped with parafilm. The stem segment handling and the connection process with the hydraulic conduction device were carried out underwater, a step that provided even more protection to avoid artificial influence. The rinse solution was a degassed 20 mmol/L pure KCl water solution. Initial hydraulic conductivity (Ki) was first determined at a pressure of 5 KPa (the hydrostatic pressure generated by the hydraulic head), which is equal to the ratio of the water flow through the stem segment to the pressure gradient causing the water flow in that stem segment. Then, the segment was washed at 175 KPa for 20 min to remove the xylem embolism. The flushed stem segment was equilibrated under water for 10 min and then connected to a hydraulic conduction device to measure its maximum hydraulic conductivity (Kmax). The above measurement procedure was repeated for branches with different lengths of drying time, and xylem embolism vulnerability curves were established using the percentage of hydraulic conductivity loss (PLC) and the corresponding water potential. PLC was calculated using Equation (2) as follows:
P L C = K m a x K i K m a x × 100 %
The sigmoid function (Equation (3)) was used to fit the curve [52], and the formula is as follows:
P L C = 100 1 + e [ a ( Ψ b ) ]
where Ψ is the water potential. The P50 (xylem water potential at 50% loss of conductivity) and P88 (xylem water potential at 88% loss of conductivity) values were obtained from the fitted curves.
In this study, SSMtlp was measured to further evaluate the hydraulic safety risk faced by trees. The turgor loss point was closely related to stomatal closure [53], Ψtlp was used in this study instead of the water potential at stomatal closure, and SSMtlp was calculated using Equation (4) as follows:
S S M t l p = Ψ t l p P 50

2.5. Hydraulic Structure and Wood Density

After the branches collected in 2.4 arrived at the laboratory, one branch from each sample tree was taken to measure Ki, and the measurement method was the same as that in 2.4. After measuring Ki, the length of the stem segment and the diameter of sapwood at both ends were measured by vernier calipers to obtain the cross-sectional area of sapwood (As), and the leaves at the end of the stem segment were dried and weighed as dry weight (M). Stem-specific conductivity (Ks), leaf-specific conductivity (LSC), and Huber value (Hv) were expressed as Ki/As, Ki/M, and As/M, respectively.
The sample was taken from the middle of the current branch. The bark and pith were removed from 1–2 cm long stem segments and immersed in water to absorb water for saturation. The saturated volume was determined by the water displacement method [54] and then dried at 75 °C for 48 h to measure the dry weight. WD was expressed as the ratio of dry weight of stem segments to fresh volume.

2.6. Data Analysis

One-way ANOVA was used to compare the differences in hydraulic traits among different stand ages (p < 0.05), and Pearson correlation analysis was used to test the correlation between hydraulic traits (p < 0.05). Principal component analysis (PCA) was used to comprehensively evaluate the environmental adaptability of different forest ages, and the specific methods were as follows:
(1)
Determine the positive and negative relationship between each index and environmental adaptability. The index with a positive relationship retained the original data, and the index with a negative relationship divided the original data by 1 as the data of principal component analysis; that is, homogenization. Thus, the consistency of the evaluation indicators (the larger the value, the better) was ensured.
(2)
The homogenized data were standardized in SPSS.26 to eliminate the influence of indicators of different properties and dimensions on the results of the comprehensive evaluation process.
(3)
Principal component analysis was performed on the standardized data in SPSS.26. Multiple principal components (PC1, PC2, etc.) were selected according to the principle of cumulative contribution rate greater than or equal to 80% and eigenvalue greater than 1. The principal component formula (Equation (5)) can be obtained by multiplying the standardized data with each factor score:
P C i = A i X 1 + B i X 2 + C i X 3 + D i X 4 + E i X 5 + F i X 6 + G i X 7
where i represented the number of the selected principal component, Ai, Bi, Ci, Di, Ei, Fi, and Gi represented the coefficients of the factor scores in the principal component i, and X1, X2, X3, X4, X5, X6, X7 represented the standardized data values of each index.
(4)
The comprehensive scoring model (Equation (6)) was constructed as follows:
P C = a P C 1 + b P C 2 + + z P C i
where a, b, and z represent the proportion of the contribution rate of each principal component in the cumulative contribution rate. The higher the composite score value, the better the environmental adaptability.
In addition, leaf pressure-volume curve parameters and xylem embolism vulnerability curve parameters for each stand age were averaged from the three sample trees.

3. Results

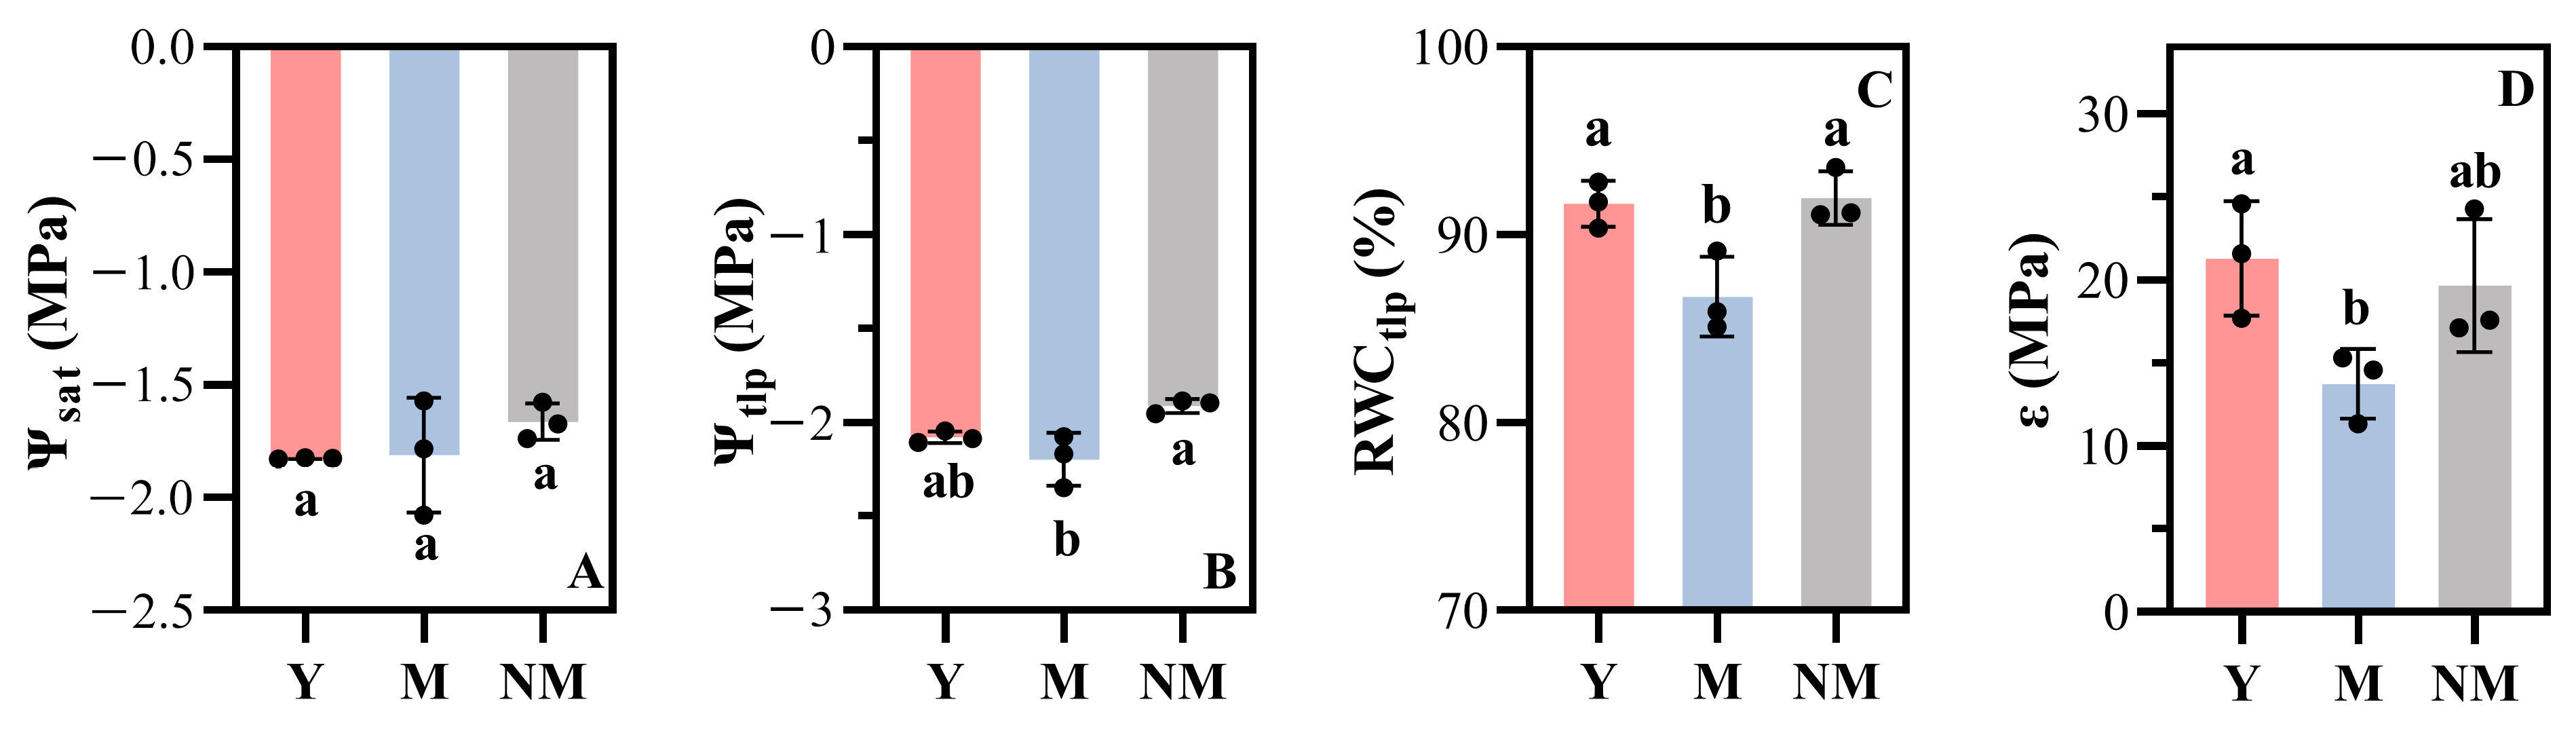
3.1. Pressure-Volume Curves

Four pressure-volume parameters for three stand ages, Ψsat, Ψtlp, RWCtlp, and ε, were obtained from the pressure-volume curves (Figure 3 and Figure S1). The results showed that there was no significant difference in Ψsat among different stand ages (Figure 3A). Ψtlp was the water potential at initial plasmolysis, which showed the ability of the leaf to maintain cell turgor during drought, and the smaller the value, the stronger the ability to maintain turgor. The Ψtlp of middle-aged populations was −2.19 MPa, which was significantly lower than −1.91 MPa of near-mature populations (p < 0.05), but both of them were not different from −2.08 MPa of young stands (Table 2, Figure 3B). RWCtlp was the relative water content at initial plasmolysis, and a lower value indicated that cell turgor can be maintained under low relative water content conditions, that is, more drought tolerant. The RWCtlp was 91.64%, 86.71%, and 91.94% for the young, middle-aged, and near-mature stands, respectively (Table 2), with no significant difference between the young and near-mature stands, but both were higher than the middle-aged stands (p < 0.05, Figure 3C), indicating that middle-aged stands could still maintain cell turgor at lower RWCtlp and were more drought tolerance. The higher the value of ε, the lower the cell wall elasticity. The ε was 21.27 MPa in the young stands, which was significantly higher than that in middle-aged stands (13.75 MPa, p < 0.05) but not different from that in near-mature stands (Table 2, Figure 3D).

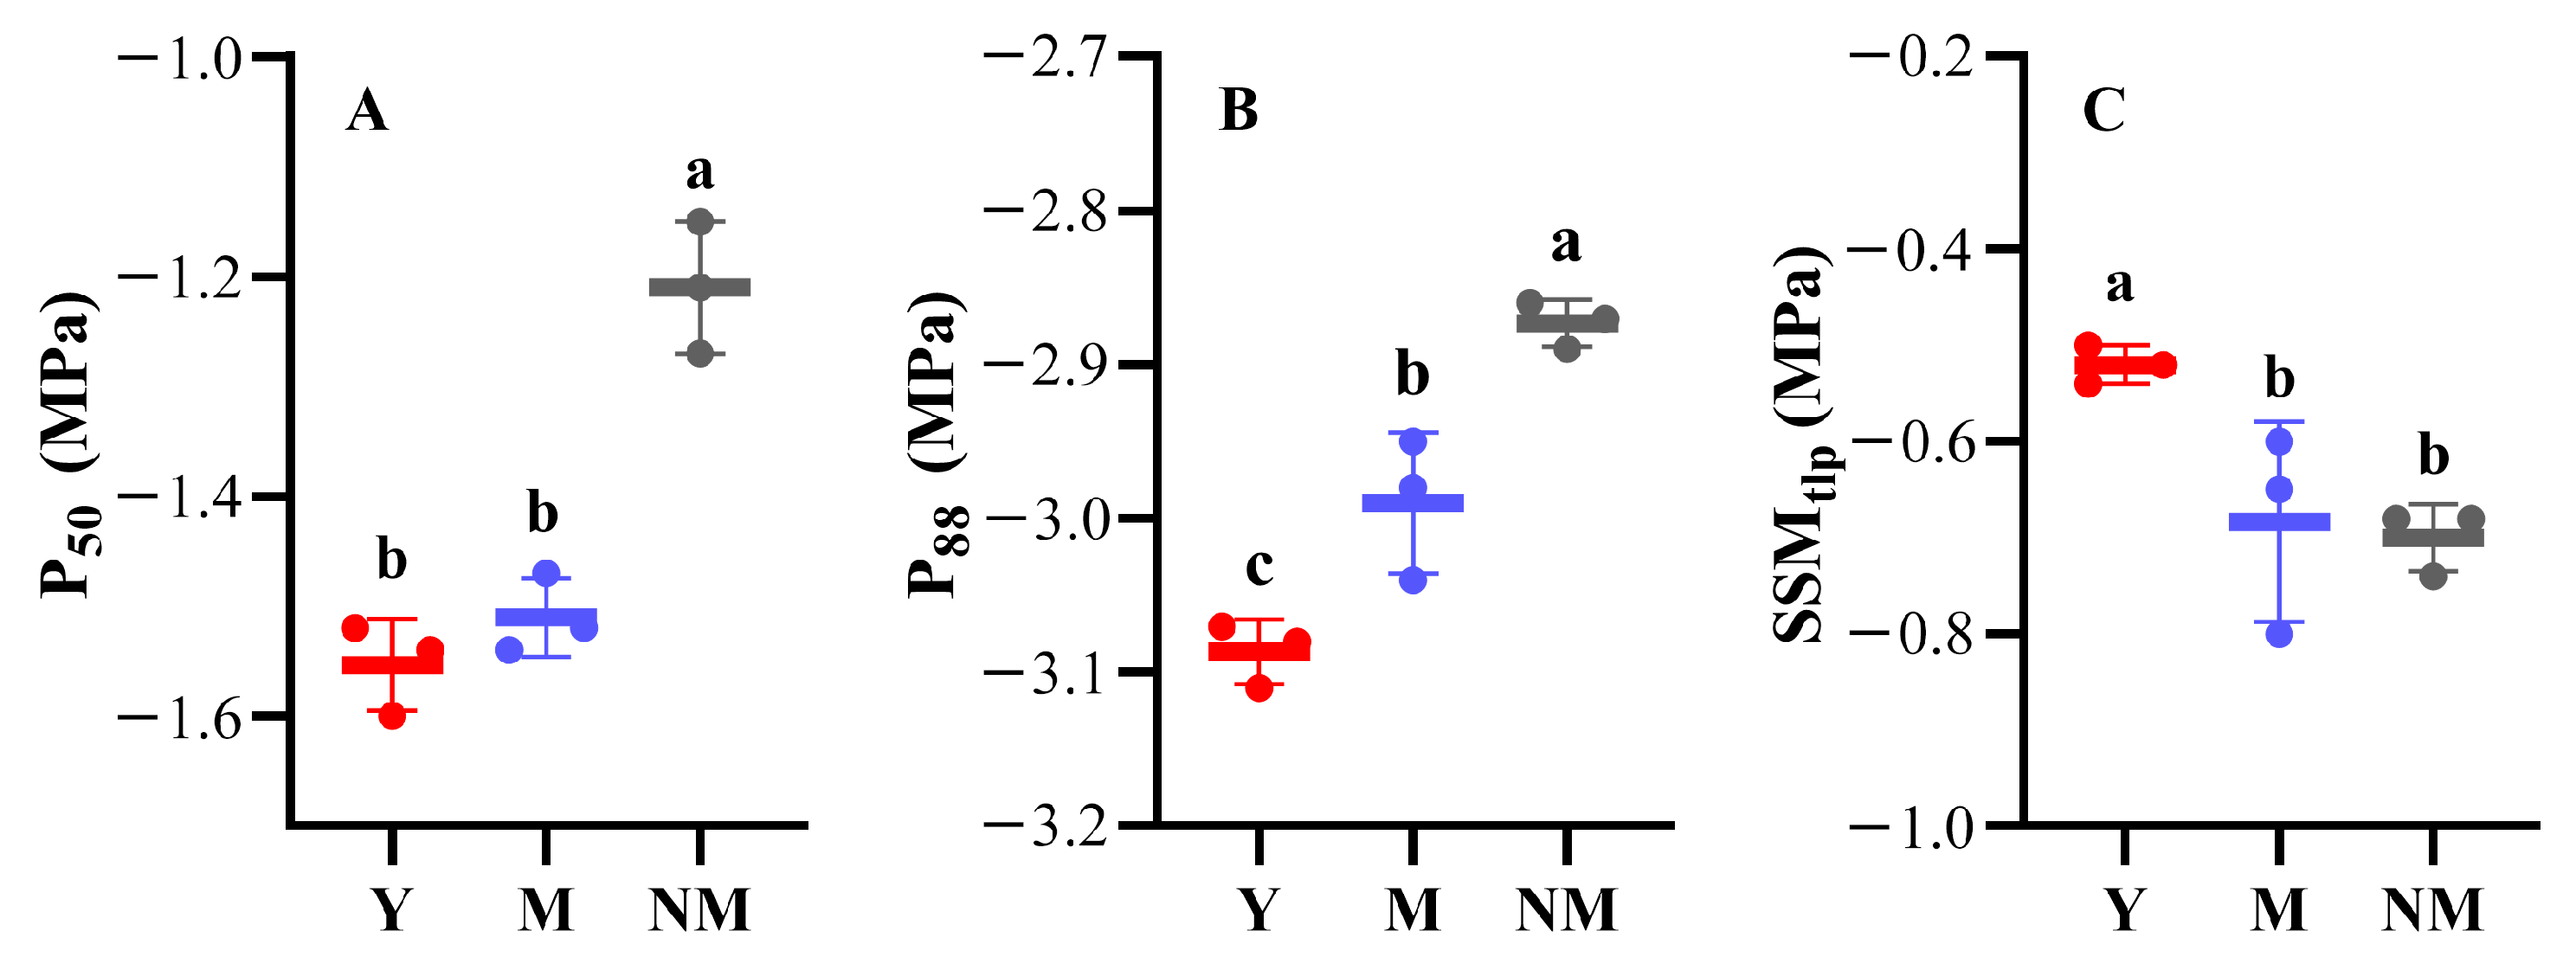
3.2. Xxylem Embolism Vulnerability Curves

Xylem embolism vulnerability, quantified by water potential at 50% loss of hydraulic conductivity (P50), differed significantly across stand ages (Figure S2). The P50 values of the young and middle-aged stands were −1.55 ± 0.04 MPa and −1.51 ± 0.04 MPa, respectively, which were significantly lower than that of the near-mature stands (−1.21 ± 0.06 MPa) (Table 2, Figure 4A). Water potential at 88% loss of hydraulic conductivity (P88), commonly used to represent the angiosperm death margin, also showed significant stand age variation. The P88 of young, middle-aged, and near-mature stands were −3.09 ± 0.02 MPa, −2.99 ± 0.05 MPa, and −2.87 ± 0.02 MPa, respectively, and young and middle-aged stands were lower than near-mature stands (p < 0.05) (Table 2, Figure 4B), suggesting that the young and middle-aged stands were more likely to survive than the near-mature stands. In addition, the difference between Ψtlp and P50 represented SSMtlp, which was used to describe the coordination between leaf cell turgor and hydraulic capacity. It was demonstrated that the SSMtlp of young stands was greater than that of middle-aged and near-mature stands, and both were negative in the presented experiment (Figure 4C).

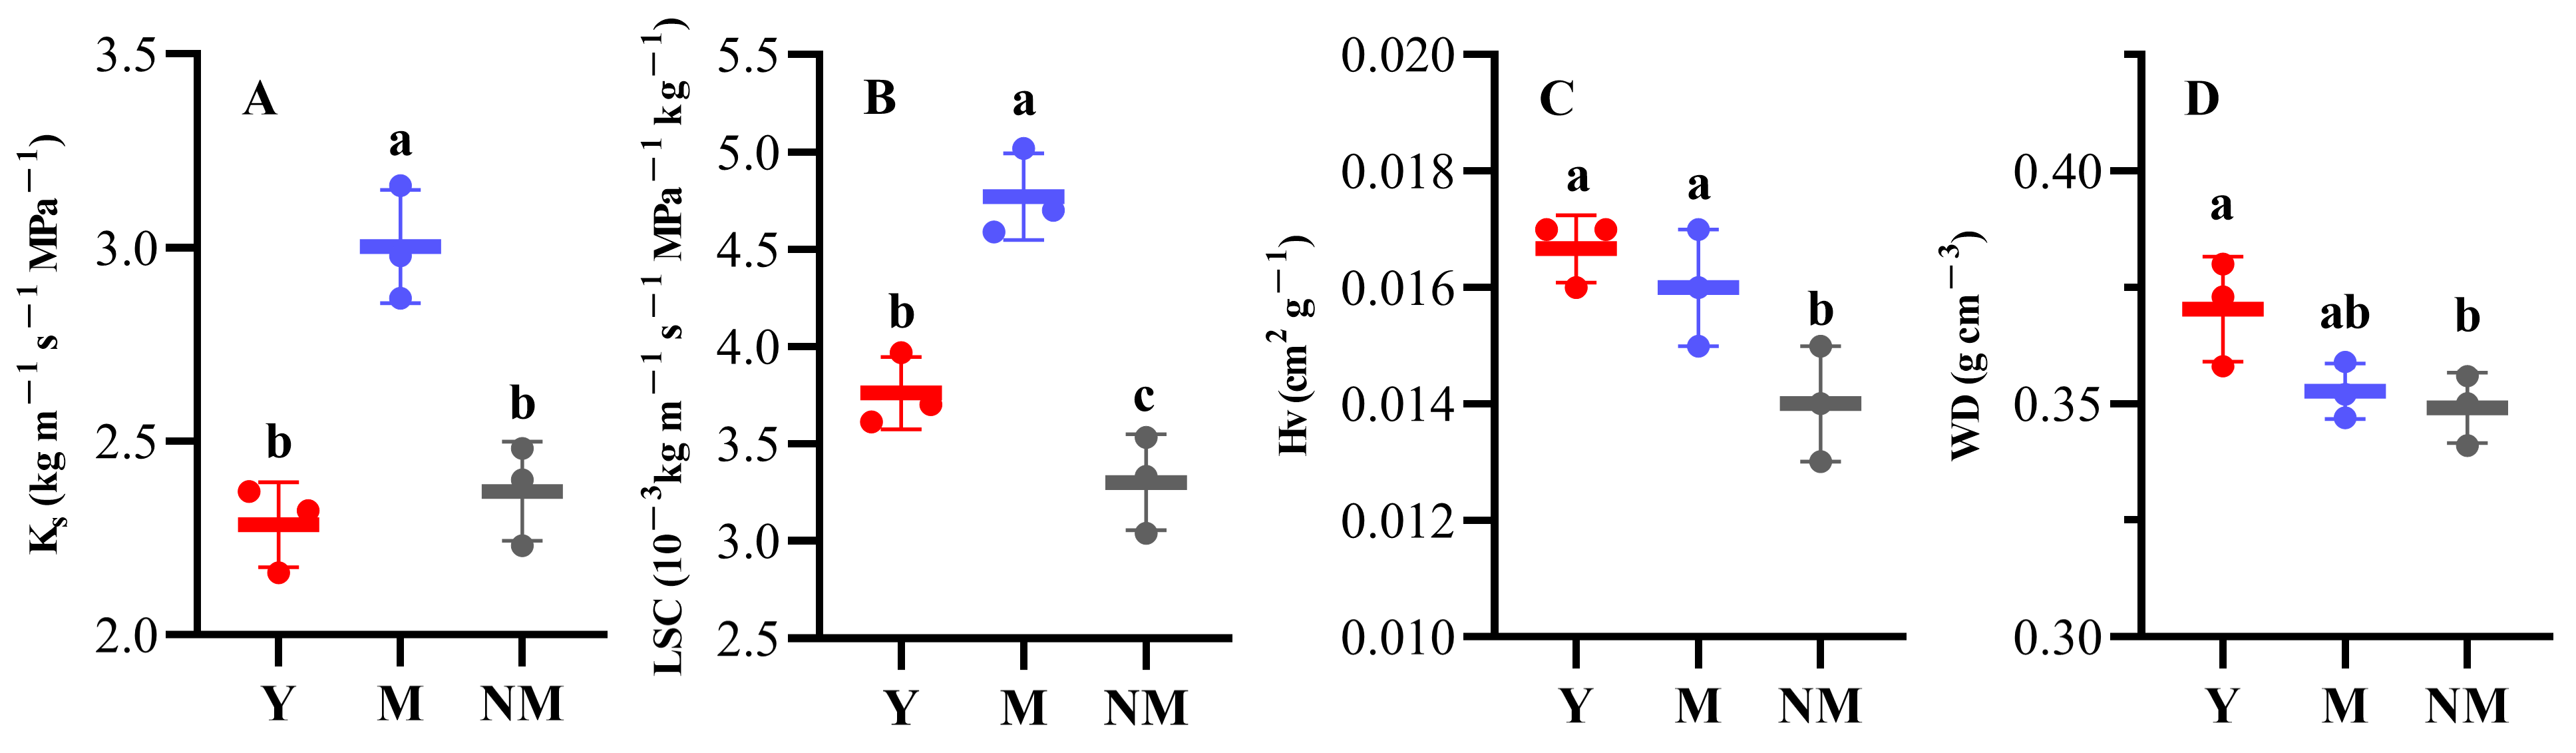
3.3. Hydraulic Structure and Wood Density

The hydraulic structure parameters, including Ks, LSC, and Hv, were measured in the different stand ages of Populus simonii in this study (Table S2). Ks, a measure of xylem water transport efficiency, was higher in middle-aged (3.0 kg m−1 s−1 MPa−1) than in young (2.28 kg m−1 s−1 MPa−1) and near-mature (2.37 kg m−1 s−1 MPa−1) stands, but there was no significant difference between young and near-mature stands (Table 2, Figure 5A). LSC, a useful measure of the hydraulic sufficiency of the stem to supply water to leaves distal to the stem, showed significant age-class differences, that is, middle-aged > young > near-mature populations (Figure 5B), indicating that the leaves of middle-aged stands had better water supply and could obtain water preferentially in drought. Hv represented the amount of stem tissue input supplying water per unit of leaf dry weight. The results showed that near-mature stands were lower than the young and middle-aged stands, but there was no significant difference between the latter two (Figure 5C). In addition, we found that WD decreased gradually with the increase of stand age, which were 0.37, 0.353, and 0.349 g cm−3, respectively (Table 2), and WD in the young stands was significantly greater than that in the near-mature stands (p < 0.05, Figure 5D).

3.4. Tradeoff of Drought Tolerance-Safety-Efficiency

Pressure-volume curve parameters were used as indicators of drought tolerance. Xylem embolism vulnerability curve parameters were used to indicate hydraulic safety and hydraulic structure, as Ks and LSC were commonly used to represent the xylem water transport efficiency and leaf water supply efficiency. In terms of drought tolerance and safety tradeoff, Ψtlp was positively correlated with P50 (r = 0.76; p < 0.05). The P88, SSMtlp, and pressure-volume curve parameters were not significantly correlated, but P50 and P88 were negatively correlated with Hv. This further reflected the association between drought tolerance and xylem embolism resistance. In terms of the tradeoff between drought tolerance and efficiency, Ψtlp was correlated with LSC (r = −0.84; p < 0.01), RWCtlp and Ks, LSC, ε and Ks were significantly negatively correlated (Figure 6). WD was significantly correlated with P88 (Figure 7). However, no tradeoff relationship between hydraulic safety and hydraulic efficiency was found in this study.

3.5. Comprehensive Evaluation of Environmental Adaptability

Environmental adaptability was the result of multiple factors and a single indicator, as the evaluation basis had limitations. Therefore, we used principal component analysis (PCA) to comprehensively evaluate the adaptability of the three stand ages to drought environment from the two core dimensions of drought tolerance and hydraulic safety. PCA showed that only the eigenvalues of the first two principal components were greater than 1, which could explain 49.431% and 36.415% of variance variation, respectively, and the cumulative variance contribution rate reached 85.846% (Figure 8, Table S3), which exceeded 85% and contained most of the information of the original variables. Therefore, only the first two principal components were used as the basis for the comprehensive evaluation. Ψtlp, P50, Ψsat, and P88 were responsible for the first principal component (PC1), with values of 0.945, 0.948, 0.728, and 0.74, respectively. The second principal component (PC2) was mainly composed of ε, SSMtlp, and RWCtlp (Figure 8, Table S3). The selected principal components were comprehensively analyzed to construct the comprehensive principal component PC = 0.58PC1 + 0.42PC2. The results showed that the composite scores of young, middle-aged, and near-mature stands were 2.244, 0.388, and −2.631, respectively (Table 3). Therefore, environmental adaptability was the strongest in young populations and the worst in near-mature populations.

4. Discussion

4.1. Drought Tolerance and Xylem Embolism Resistance

The pressure-volume curve parameters could reflect the water regulation ability of plants to a certain extent and were considered classic indicators for evaluating the drought tolerance of plants. In this study, Ψtlp tended to increase with increasing stand age, and RWCtlp and ε tended to decrease and then increase, which was inconsistent with the results of Zuo [55]. The reason for this difference can be due to the selection of stand ages and different local stand conditions. The results of both studies found that Ψsat, RWCtlp, and ε were not significantly different between the young and near-mature stands. Trees of young stands had small vessel diameters and low water transfer efficiency, while near-mature stands had large vessel diameters but also increased the risk of xylem embolism [56], which resulted in poor leaf water supply in both stands. It also explains why Ψsat, RWCtlp, and ε did not differ significantly between the two stand ages. Ψtlp was considered to be the most relevant indicator of drought tolerance [57], with differences between different stand ages in Ψtlp, which was greatest in near-mature stands, indicating that they had the worst ability to maintain cell turgor and the weakest drought tolerance in drought. It has been found that Ψtlp was influenced by Ψsat [58,59]. A study also confirmed that Ψtlp was positively correlated with Ψsat (r = 0.78, p < 0.05), suggesting that high Ψsat was the main driving force of high Ψtlp and low drought tolerance in near-mature stands. Furthermore, it has also been proposed that high Ψsat would cause a significant increase in RWCtlp while causing a rise in Ψtlp, and high ε helped cells maintain high RWCtlp at low Ψtlp [60], which was further verified in this study.
Xylem embolism resistance was a core content in the study of drought tolerance in trees and was one of the key traits to predict drought tolerance in tree species [29]. P50 was commonly used to indicate xylem embolism vulnerability, namely safety, in angiosperms, where the water potential below the P50 and water transport function will be severely impaired [61]. P88 was the angiosperm mortality threshold, below which trees will not recover. We found that the P50 of the young, middle-aged, and near-mature stands were −1.55 MPa, −1.51 MPa, and −1.21 MPa, respectively, which was consistent with the previous study that the P50 of poplar was between −1 MPa and −2.5 MPa [62]. In this study, both P50 and P88 tended to increase with increasing stand age, indicating that older stands are more susceptible to xylem embolism and face a higher mortality risk. The main reason may be that the increase in stand age of fast-growing species causes an increase in tree height, and taller individuals have greater hydraulic resistance while increasing water transport distance, therefore, face a higher risk of hydraulic failure and mortality [13]. However, Rowland et al. [18] found that tree age was positively correlated with P50, and Bittencourt et al. [63] supplemented the data on this basis. Results were consistent with this study, where the correlation disappeared after the removal of some tree species. These suggest that the effect of tree age on P50 is strongly dependent on tree species, and this view has also been confirmed in the study by Benson et al. [64]. Anderegg et al. [3] found that species with high xylem embolism resistance also have high mortality, possibly due to unreasonable coordination between the stomatal and xylem embolism. In this study, to improve the accuracy of the evaluation results, SSMtlp, the difference between water potential at stomatal closure and P50, was included in the evaluation indicators. This was mainly used to reflect the coordination ability between stomata and hydraulics [38]. Since stomatal closure was closely related to the turgor pressure loss point, Ψtlp was used as a proxy indicator of water potential at stomatal closure in this study [65]. The largest SSMtlp was found in young stands, implying that they had the strongest coordination between leaf cell turgor and xylem embolism to effectively avoid hydraulic failure and had the highest survival rate in drought, which was consistent with the predicted results of P50 and P88. The results also found that SSMtlp was −0.52, −0.68, and −0.70 for the young, middle-aged, and near-mature stands, respectively, indicating that the leaf cell turgor loss points all occurred after xylem embolization. As can be seen in Table 2, Ψtlp was between P50 and P88. Therefore, we suggest that Populus simonii may avoid death due to severe xylem embolism by regulating leaf turgor.
Understanding drought tolerance and predicting the mortality risk of trees in semi-arid and arid regions was of great significance for rational forest management under the background of future continuous climate change. Studies have found that large trees played a key role in forest ecosystems, especially in carbon storage, but were the most vulnerable to growth and survival in drought and had the highest mortality rate compared to small trees [66,67], which was consistent with the comprehensive evaluation results in this study, both suggesting that the environmental adaptability of stands decreased with the increase of stand age. This result also validates our first hypothesis. Therefore, it is necessary to adopt scientific and reasonable forest management measures for stands that are too old and at high risk of mortality to maximize forest ecosystem service functions.

4.2. Tradeoff of Drought Tolerance-Safety-Efficiency

Ks and LSC were commonly used to represent xylem water transport efficiency and leaf water supply efficiency. LSC is mainly calculated by leaf area, but we found in the literature that it was also feasible to calculate LSC by leaf dry weight [68]. Due to the presence of partial curls in the leaves at the end of stem segments of Populus simonii, there may be errors in using leaf area measurements. Therefore, we used leaf dry weight calculation in our study (Table S2). In terms of the tradeoff between safety and efficiency, a large number of studies have shown a significant tradeoff between water transport efficiency and hydraulic safety [17], but Santiago et al. [69] found that there was no correlation between safety and efficiency, which is consistent with the results of the present study, suggesting that high xylem embolism resistance does not necessarily come at the expense of water transport efficiency. This differs from our second hypothesis, that there is a tradeoff between safety and efficiency. It has been found that xylem water transport efficiency is related to vessel size, vessel lumen ratio, vessel connectivity, and ion-mediated striatal membrane ultrastructure [70,71,72]. Xylem embolism had no significant correlation with vessel size, especially diameter and wall thickness, but was closely related to the connectivity between vessel networks [73]. Therefore, differences in structural characteristics and different modes of action may be the main reason for the independent variation and absence of tradeoff between hydraulic safety and water transport efficiency.
From the tradeoff relationship between efficiency and drought tolerance, we found that Ψtlp, RWCtlp, ε were negatively correlated with LSC and Ks. These indicate that leaf osmotic regulation was related to water transport efficiency, and high water transport efficiency was beneficial to leaf tolerance and delay dehydration; that is, the stands with higher water transport efficiency were more tolerant to drought, which is generally consistent with the findings of Santiago et al. [69]. High water transport efficiency provided a larger water capacity, which increased water stored in the tree and provided water recharge for transpiration during drought, acting as a buffer [74,75], which may be associated with leaf tolerance and delayed dehydration.
In terms of the tradeoff between drought tolerance and safety, according to the results of a global meta-analysis, Hv in the hydraulic structure was directly proportional to the drought tolerance of tree species [76]. Results of this study showed that Hv was significantly higher in young and middle-aged stands than in near-mature stands. Hence, near-mature stands had the lowest drought tolerance among all plantation ages. The results of correlation analysis showed that P50 was positively correlated with Ψtlp, and P50 and P88 were negatively correlated with Hv, which was consistent with the research results of Peters et al. [77], suggesting that hydraulic safety was related to the ability to maintain cell turgor pressure and the amount of stem input per unit leaf dry weight. Christoffersen et al. [78] proposed that there was a tradeoff between drought tolerance (water capacity) and hydraulic safety, indicating that high water capacity reduced the harm to the xylem from a sharp drop in water potential and improved hydraulic safety of the xylem, which further showed that hydraulic safety was positively correlated with drought tolerance. However, the way of action may be different.

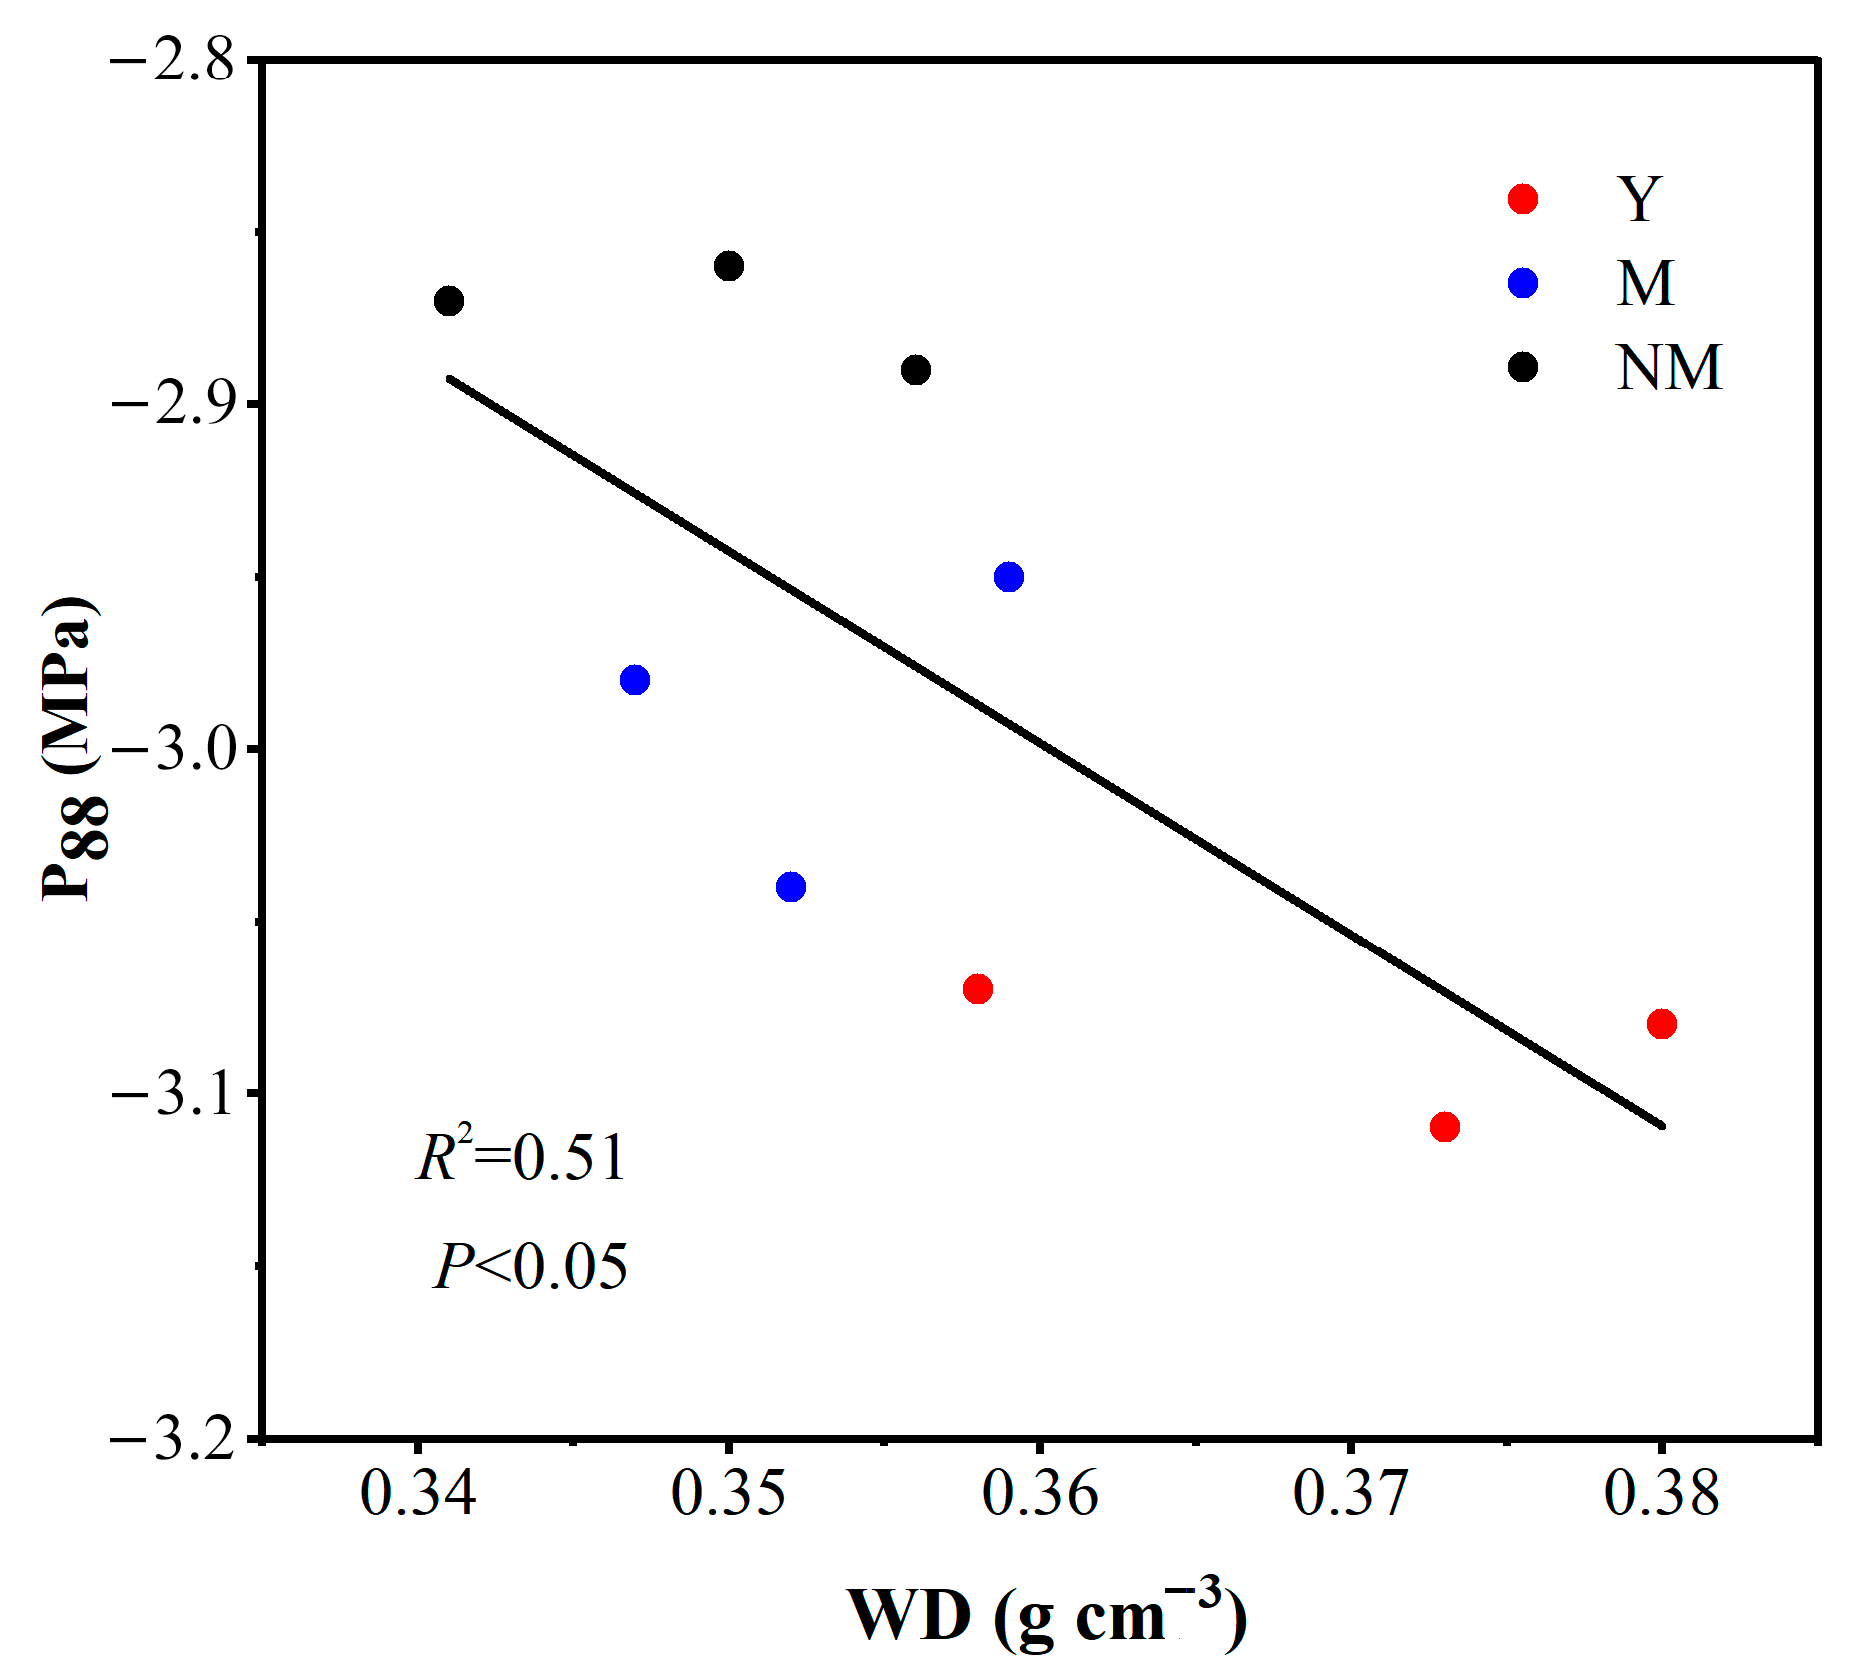
4.3. Analysis of WD as a Proxy Indicator of Hydraulic Properties

Carvalho et al. [79] analyzed the anatomical structure of the xylem of 39 plants in semi-arid areas and found that WD was determined by the fiber fraction, parenchyma, and vessel area, which accounted for 50%, 31%, and 19%, respectively, with the fiber fraction including fiber wall and fiber internal lumen. Vessel diameter increased with increasing tree size [80,81], thereby increasing the spatial proportion of the vessel area while also reducing the proportion of the fiber fraction. WD was positively correlated with the fiber wall and the lumen within the fiber. Therefore, the decrease in the fiber fraction directly led to a decrease in WD, which is consistent with the results of this study showing that WD gradually becomes smaller with increasing stand age.
Lachenbruch and McCulloh [82] suggested that WD is a property that depends on the distribution of wood volume in different tissues and is related to anatomical or chemical properties but not directly related to hydraulic traits. Hydraulic efficiency is mainly related to the properties of the vessel [83,84] but largely independent of the fiber wall and fiber internal lumen, which explains why WD and hydraulic efficiency were not correlated in this study. Previous studies have proved that WD is an excellent indicator for predicting interspecific hydraulic safety [15]. It was also found that WD was significantly correlated with P88 among different stand ages of the same species in this study. This is consistent with our third hypothesis. Therefore, WD, an easily obtained morphological characteristic, could be used as a proxy indicator of hydraulic safety to indicate the mortality risk of different tree species or different stand ages.

5. Conclusions

This study of the hydraulic traits of three stand ages of Populus simonii in the semi-arid region of western Liaoning, China, found that the drought tolerance and hydraulic safety of near-mature forests were poorer. However, due to the limitations of single index evaluation, we used principal component analysis to comprehensively evaluate the drought tolerance (leaf pressure-volume curve parameters) and hydraulic safety (P50, P88, SSMtlp) of different stand ages. We found that the environmental adaptability declined with the increase of the stand age and that the near-mature stands had the poorest adaptive ability. This suggests that near-mature stands may be the first to face the risk of mortality in the context of continued climate change in the future. There were tradeoffs between drought tolerance and water delivery efficiency and hydraulic safety, but there was no tradeoff between hydraulic safety and water delivery efficiency. More importantly, WD can be used as a meaningful proxy for hydraulic safety, which, to some extent, strengthens the understanding and prediction of tree mortality. In conclusion, we suggested that WD should be included in the forest monitoring system, and intermediate cuttings should be carried out to reduce the competition of trees in near-mature stands for water to avoid experiencing drought stress and maximize forest ecosystem service functions.

Supplementary Materials

The following supporting information can be downloaded at https://www.mdpi.com/article/10.3390/f14091759/s1. Table S1: Age classification standard of Poplar plantation shelterbelts in northern China; Table S2: Hydraulic structure and embolism degree of Populus simonii stands at different ages; Table S3: Principal components analysis (PCA) loading and interpretation variances of parameters of pressure-volume curves and xylem embolism vulnerability curves of three stand ages in Populus simonii; Figure S1: Pressure-volume curves of leaves in young stand (A), middle-aged stand (B) and near mature stand (C). The black solid circles represent the values before the turgor loss point, and the hollow circles represent the data after the turgor loss point; Figure S2: Xylem embolism vulnerability curves in young, middle-aged, near-mature Populus simonii populations. The black dotted and solid lines represent xylem water potential at 50% loss of conductivity (P50) and xylem water potential at 88% loss of conductivity (P88), respectively, and colored shading indicates 95% confidence intervals.

Author Contributions

Conceptualization, P.L. and H.W.; Formal analysis, S.H. and Y.Z.; writing—original draft, W.H.; data curation, W.H.; writing—review and editing, Y.W. and W.H. All authors have read and agreed to the published version of the manuscript.

Funding

This research was funded by the Science and Technology Program of Liaoning Province (2021JH2/10200007).

Data Availability Statement

Not applicable.

Acknowledgments

We would like to thank the staff of the experimental forest farm of Shenyang Agricultural University, Aer Township, Zhangwu County, Fuxin City, Liaoning Province, for assisting us in taking samples. We also thank Zewen Dong and Yu Wang for their help in the hydropotential measurement.

Conflicts of Interest

The authors declare no conflict of interest.

References

  1. Qiao, Y.; Jiang, Y.; Zhang, C. Contribution of karst ecological restoration engineering to Vegetation Greening in Southwest China during recent decade. Ecol. Indic. 2021, 121, 107081. [Google Scholar] [CrossRef]
  2. Trenberth, K.E.; Dai, A.G.; Schrier, G.V.D.; Jones, P.D.; Barichivich, J.; Briffa, K.R.; Sheffield, J. Global warming and changes in drought. Nat. Clim. Chang. 2014, 4, 17–22. [Google Scholar] [CrossRef]
  3. Anderegg, W.R.L.; Anderegg, L.D.L.; Kerr, K.L.; Trugman, A.T. Widespread drought-induced tree mortality at dry range edges indicates that climate stress exceeds species’ compensating mechanisms. Glob. Chang. Biol. 2019, 25, 3793–3802. [Google Scholar] [CrossRef]
  4. Bauman, D.; Fortunel, C.; Delhaye, G.; Malhi, Y.; Cernusak, L.A.; Bentley, L.P.; Rifai, S.W.; Aguirre-Gutierrez, J.; Menor, I.O.; Phillips, O.L.; et al. Tropical tree mortality has increased with rising atmospheric water stress. Nature 2022, 608, 528–533. [Google Scholar] [CrossRef]
  5. Wang, Y.Q.; Song, H.Q.; Chen, Y.J.; Fu, P.L.; Zhang, J.L.; Cao, K.F.; Zhu, S.D. Hydraulic determinants of drought-induced tree mortality and changes in tree abundance between two tropical forests with different water availability. Agric. For. Meteorol. 2023, 331, 109329. [Google Scholar] [CrossRef]
  6. Poplars and Other Fast-Growing Trees—Renewable Resources for Future Green Economies. Available online: http://www.fao.org/forestry/ipc2016/en (accessed on 15 April 2023).
  7. Kumar, R.; Bhatnagar, P.R.; Kakade, V.; Dobhal, S. Tree Plantation and soil water conservation enhances climate resilience and carbon sequestration of agro ecosystem in semi-arid degraded ravine lands. Agric. For. Meteorol. 2020, 282, 107857. [Google Scholar] [CrossRef]
  8. National Forestry and Grassland Administration. China Forest Resources Report; China Standard Press: Beijing, China, 2019. [Google Scholar]
  9. Xi, B.Y.; Clothier, B.; Coleman, M.; Duan, J.; Hu, W.; Li, D.D.; Di, N.; Liu, Y.; Fu, J.Y.; Li, J.S.; et al. Irrigation management in poplar (Populus spp.) plantations: A review. For. Ecol. Manag. 2021, 494, 119330. [Google Scholar] [CrossRef]
  10. Sun, S.J.; He, C.X.; Qiu, L.F.; Li, C.Y.; Zhang, J.S.; Meng, P. Stable isotope analysis reveals prolonged drought stress in Poplar plantation mortality of the three-north shelter forest in northern China. Agric. For. Meteorol. 2018, 252, 39–48. [Google Scholar] [CrossRef]
  11. Zheng, C.Y.; Xu, Z.Q.; Ma, C.M.; Sun, S.J.; Yan, T.F. The factors influencing the poplar shelterbelt degradation in the Bashang Plateau of northwest Hebei Province. For. Resour. Manag. 2018, 9–15. [Google Scholar] [CrossRef]
  12. Ji, Y.H.; Zhou, G.S.; Li, Z.S.; Wang, S.D.; Zhou, H.L.; Song, X.Y. Triggers of widespread dieback and mortality of poplar (Populus spp.) plantations across northern China. J. Arid. Environ. 2020, 174, 104076. [Google Scholar] [CrossRef]
  13. Fang, L.D.; Ning, Q.R.; Guo, J.J.; Gong, X.W.; Zhu, J.J.; Hao, G.Y. Hydraulic limitation underlies the dieback of Populus pseudo-simonii trees in water-limited areas of northern China. For. Ecol. Manag. 2021, 483, 118764. [Google Scholar] [CrossRef]
  14. Choat, B.; Jansen, S.; Brodribb, T.J.; Cochard, H.; Delzon, S.; Bhaskar, R.; Bucci, S.J.; Feild, T.S.; Gleason, S.M.; Hacke, U.G.; et al. Global convergence in the vulnerability of forests to drought. Nature 2012, 491, 752–755. [Google Scholar] [CrossRef] [PubMed]
  15. Liang, X.Y.; Ye, Q.; Liu, H.; Brodribb, T.J. Wood density predicts mortality threshold for diverse trees. New Phytol. 2021, 229, 3053–3057. [Google Scholar] [CrossRef] [PubMed]
  16. Brodribb, T.J.; McAdam, S.A.; Carins, M.M.R. Xylem and stomata, coordinated through time and space. Plant Cell Environ. 2017, 40, 872–880. [Google Scholar] [CrossRef] [PubMed]
  17. Han, H.; Xi, B.Y.; Wang, Y.; Feng, J.C.; Li, X.M.; Tissue, D.T. Lack of phenotypic plasticity in leaf hydraulics for 10 woody species common to urban forests of North China. Tree Physiol. 2022, 42, 1203–1215. [Google Scholar] [CrossRef] [PubMed]
  18. Rowland, L.; da Costa, A.C.; Galbraith, D.R.; Oliveira, R.S.; Binks, O.J.; Oliveira, A.A.R.; Pullen, A.M.; Doughty, C.E.; Metcalfe, D.B.; Vasconcelos, S.S.; et al. Death from drought in tropical forests is triggered by hydraulics not carbon starvation. Nature 2015, 528, 119–122. [Google Scholar] [CrossRef]
  19. Liu, Z.H.; Jia, G.D.; Yu, X.X.; Lu, W.W.; Sun, L.B.; Wang, Y.S.; Baheti, Z. Morphological trait as a determining factor for Populus simonii Carr. to survive from drought in semi-arid region. Agric. Water Manag. 2021, 253, 106943. [Google Scholar] [CrossRef]
  20. Giardina, F.; Konings, A.G.; Kennedy, D.; Alemohammad, S.H.; Oliveira, R.S.; Uriarte, M.; Gentine, P. Tall Amazonian forests are less sensitive to precipitation variability. Nat. Geosci. 2018, 11, 405–409. [Google Scholar] [CrossRef]
  21. Klockow, P.A.; Edgar, C.B.; Moore, G.W.; Vogel, J.G. Southern pines are resistant to mortality from an exceptional drought in east Texas. Front. For. Glob. Chang. 2020, 3, 23. [Google Scholar] [CrossRef]
  22. Bennett, A.C.; McDowell, N.G.; Allen, C.D.; Anderson-Teixeira, K.J. Larger trees suffer most during drought in forests worldwide. Nat. Plants 2015, 1, 15139. [Google Scholar] [CrossRef]
  23. Lucas-Borja, M.E.; Bose, A.K.; Andivia, E.; Candel-Perez, D.; Plaza-Alvarez, P.A.; Linares, J.C. Assessing Tree Drought Resistance and Climate-Growth Relationships under Different Tree Age Classes in a Pinus nigra Arn. ssp. salzmannii Forest. Forests 2021, 12, 1161. [Google Scholar] [CrossRef]
  24. Ma, T.X.; Liang, Y.; Li, Z.Y.; Liu, Z.H.; Liu, B.; Wu, M.M.; Lau, M.K.; Fang, Y.T. Age-related patterns and climatic driving factors of drought-induced forest mortality in Northeast China. Agric. For. Meteorol. 2023, 332, 109360. [Google Scholar] [CrossRef]
  25. Akram, M.A.; Zhang, Y.; Wang, X.; Shrestha, N.; Malik, K.; Khan, I.; Ma, W.; Sun, Y.; Li, F.; Ran, J.; et al. Phylogenetic independence in the variations in leaf functional traits among different plant life forms in an arid environment. J. Plant Physiol. 2022, 272, 153671. [Google Scholar] [CrossRef] [PubMed]
  26. Akram, M.A.; Wang, X.; Shrestha, N.; Zhang, Y.; Sun, Y.; Yao, S.; Li, J.; Hou, Q.; Hu, W.; Ran, J.; et al. Variations and driving factors of leaf functional traits in the dominant desert plant species along an environmental gradient in the drylands of China. Sci. Total Environ. 2023, 897, 165394. [Google Scholar] [CrossRef]
  27. McDowell, N.; Pockman, W.T.; Allen, C.D.; Breshears, D.D.; Cobb, N.; Kolb, T.; Plaut, J.; Sperry, J.; West, A.; Williams, D.G.; et al. Mechanisms of plant survival and mortality during drought: Why do some plants survive while others succumb to drought? New Phytol. 2008, 178, 719–739. [Google Scholar] [CrossRef]
  28. Powell, T.L.; Wheeler, J.K.; de Oliveira, A.A.R.; da Costa, A.C.L.; Saleska, S.R.; Meir, P.; Moorcroft, P.R. Differences in xylem and leaf hydraulic traits explain differences in drought tolerance among mature Amazon rainforest trees. Glob. Chang. Biol. 2017, 23, 4280–4293. [Google Scholar] [CrossRef]
  29. Brodribb, T.J.; Powers, J.; Cochard, H.; Choat, B. Hanging by a thread? Forests and drought. Science 2020, 368, 261–266. [Google Scholar] [CrossRef]
  30. Meir, P.; Mencuccini, M.; Dewar, R.C. Drought-related tree mortality: Addressing the gaps in understanding and prediction. New Phytol. 2015, 207, 28–33. [Google Scholar] [CrossRef]
  31. Anderegg, W.R.L.; Klein, T.; Bartlett, M.; Sack, L.; Pellegrini, A.F.A.; Choat, B.; Jansen, S. Meta-analysis reveals that hydraulic traits explain cross-species patterns of drought-induced tree mortality across the globe. Proc. Natl. Acad. Sci. USA 2016, 113, 5024–5029. [Google Scholar] [CrossRef]
  32. Venturas, M.D.; MacKinnon, E.D.; Dario, H.L.; Jacobsen, A.L.; Pratt, R.B.; Davis, S.D. Chaparral Shrub Hydraulic Traits, Size, and Life History Types Relate to Species Mortality during California’s Historic Drought of 2014. PLoS ONE 2016, 11, e0159145. [Google Scholar] [CrossRef]
  33. Ferriz, M.; Martin-Benito, D.; Canellas, I.; Gea-Izquierdo, G. Sensitivity to water stress drives differential decline and mortality dynamics of three co-occurring conifers with different drought tolerance. For. Ecol. Manag. 2021, 486, 118964. [Google Scholar] [CrossRef]
  34. Zhu, S.D.; Chen, Y.J.; Ye, Q.; He, P.C.; Liu, H.; Li, R.H.; Fu, P.L.; Jiang, G.F.; Cao, K.F. Leaf turgor loss point is correlated with drought tolerance and leaf carbon economics traits. Tree Physiol. 2018, 38, 658–663. [Google Scholar] [CrossRef] [PubMed]
  35. Williams, C.B.; Reese Næsborg, R.; Dawson, T.E. Coping with gravity: The foliar water relations of giant sequoia. Tree Physiol. 2017, 37, 1312–1326. [Google Scholar] [CrossRef] [PubMed]
  36. Pivovaroff, A.L.; Cook, V.M.W.; Santiago, L.S. Stomatal behavior and stem xylem traits are coordinated for woody plant species under exceptional drought conditions. Plant Cell Environ. 2018, 41, 2617–2626. [Google Scholar] [CrossRef] [PubMed]
  37. Markesteijn, L.; Poorter, L.; Paz, H.; Sack, L.; Bongers, F. Ecological differentiation in xylem cavitation resistance is associated with stem and leaf structural traits. Plant Cell Environ. 2011, 34, 137–148. [Google Scholar] [CrossRef]
  38. Skelton, R.P.; West, A.G.; Dawson, T.E. Predicting plant vulnerability to drought in biodiverse regions using functional traits. Proc. Natl. Acad. Sci. USA 2015, 112, 5744–5749. [Google Scholar] [CrossRef]
  39. Chen, Z.C.; Li, S.; Luan, J.W.; Zhang, Y.T.; Zhu, S.D.; Wan, X.C.; Liu, S.R. Prediction of temperate broadleaf tree species mortality in arid limestone habitats with stomatal safety margins. Tree Physiol. 2019, 39, 1428–1437. [Google Scholar] [CrossRef]
  40. Li, X.; Blackman, C.J.; Choat, B.; Duursma, R.A.; Rymer, P.D.; Medlyn, B.E. Tree hydraulic traits are coordinated and strongly linked to climate-of-origin across a rainfall gradient. Plant Cell Environ. 2018, 41, 646–660. [Google Scholar] [CrossRef]
  41. Xi, B.Y.; Li, G.D.; Bloomberg, M.; Jia, L.M. The effects of subsurface irrigation at different soil water potential thresholds on the growth and transpiration of Populus tomentosa in the North China Plain. Aust. For. 2014, 77, 159–167. [Google Scholar] [CrossRef]
  42. Sabine, R. Wood density as a proxy for vulnerability to cavitation: Size matters. J. Plant Hydraul. 2017, 4, e001. [Google Scholar] [CrossRef]
  43. Savi, T.; Tintner, J.; Da Sois, L.; Grabner, M.; Petit, G.; Rosner, S. The potential of Mid-Infrared spectroscopy for prediction of wood density and vulnerability to embolism in woody angiosperms. Tree Physiol. 2019, 39, 503–510. [Google Scholar] [CrossRef]
  44. De Guzman, M.E.; Acosta-Rangel, A.; Winter, K.; Meinzer, F.C.; Bonal, D.; Santiago, L.S. Hydraulic traits of Neotropical canopy liana and tree species across a broad range of wood density: Implications for predicting drought mortality with models. Tree Physiol. 2021, 41, 24–34. [Google Scholar] [CrossRef] [PubMed]
  45. Greenwood, S.; Ruiz-Benito, P.; Martínez-Vilalta, J.; Lloret, F.; Kitzberger, T.; Allen, C.D.; Fensham, R.; Laughlin, D.C.; Kattge, J.; Bonisch, G.; et al. Tree mortality across biomes is promoted by drought intensity, lower wood density and higher specific leaf area. Ecol. Lett. 2017, 20, 539–553. [Google Scholar] [CrossRef] [PubMed]
  46. National Forestry Administration. Age-Class and Age-Group of Main Tree Species; China Standard Press: Beijng, China, 2017. [Google Scholar]
  47. Tyree, M.T.; Hammel, H.T. The Measurement of the Turgor Pressure and the Water Relations of Plants by the Pressure-bomb Technique. J. Exp. Bot. 1972, 23, 267–282. [Google Scholar] [CrossRef]
  48. Sperry, J.S.; Donnelly, J.R.; Tyree, M.T. A method for measuring hydraulic conductivity and embolism in xylem. Plant Cell Environ. 1988, 11, 35–40. [Google Scholar] [CrossRef]
  49. Cochard, H.; Badel, E.; Herbette, S.; Delzon, S.; Choat, B.; Jansen, S. Methods for measuring plant vulnerability to cavitation: A critical review. J. Exp. Bot. 2013, 64, 4779–4791. [Google Scholar] [CrossRef]
  50. Unawong, W.; Yaemphum, S.; Nathalang, A.; Chen, Y.; Domec, J.C.; Tor-Ngern, P. Variations in leaf water status and drought tolerance of dominant tree species growing in multi-aged tropical forests in Thailand. Sci. Rep. 2022, 12, 6882. [Google Scholar] [CrossRef] [PubMed]
  51. Wheeler, J.K.; Huggett, B.A.; Tofte, A.N.; Rockwell, F.E.; Holbrook, N.M. Cutting xylem under tension or supersaturated with gas can generate PLC and the appearance of rapid recovery from embolism. Plant Cell Environ. 2013, 36, 1938–1949. [Google Scholar] [CrossRef]
  52. Pammenter, N.W.; Vander Willigen, C. A mathematical and statistical analysis of the curves illustrating vulnerability of xylem to cavitation. Tree Physiol. 1998, 18, 589–593. [Google Scholar] [CrossRef]
  53. Martin-StPaul, N.; Delzon, S.; Cochard, H. Plant resistance to drought depends on timely stomatal closure. Ecol. Lett. 2017, 20, 1437–1447. [Google Scholar] [CrossRef]
  54. Petruzzellis, F.; Nardini, A.; Savi, T.; Tonet, V.; Castello, M.; Bacaro, G. Less safety for more efficiency: Water relations and hydraulics of the invasive tree Ailanthus altissima (Mill.) Swingle compared with native Fraxinus ornus L. Tree Physiol. 2019, 39, 76–87. [Google Scholar] [CrossRef]
  55. Zuo, L.X. The Water Use Traits and Simulation for Differentage of Populus simonii in Loess Plateau. Master’s Thesis, Northwest A&F University, Xianyang, China, 2013. [Google Scholar]
  56. Ryan, M.G.; Phillips, N.; Bond, B.J. The hydraulic limitation hypothesis revisited. Plant Cell Environ. 2006, 29, 367–381. [Google Scholar] [CrossRef]
  57. Bartlett, M.K.; Zhang, Y.; Kreidler, N.; Sun, S.W.; Ardy, R.; Cao, K.F.; Sack, L. Global analysis of plasticity in turgor loss point, a key drought tolerance trait. Ecol. Lett. 2014, 17, 1580–1590. [Google Scholar] [CrossRef]
  58. Marechaux, I.; Bartlett, M.K.; Sack, L.; Baraloto, C.; Engel, J.; Joetzjer, E.; Chave, J. Drought tolerance as predicted by leaf water potential at turgor loss point varies strongly across species within an Amazonian forest. Funct. Ecol. 2015, 29, 1268–1277. [Google Scholar] [CrossRef]
  59. Bartlett, M.K.; Scoffoni, C.; Ardy, R.; Zhang, Y.; Sun, S.W.; Cao, K.F.; Sack, L. Rapid determination of comparative drought tolerance traits: Using an osmometer to predict turgor loss point. Methods Ecol. Evol. 2012, 3, 880–888. [Google Scholar] [CrossRef]
  60. Bartlett, M.K.; Scoffoni, C.; Sack, L. The determinants of leaf turgor loss point and prediction of drought tolerance of species and biomes: A global meta-analysis. Ecol. Lett. 2012, 15, 393–405. [Google Scholar] [CrossRef] [PubMed]
  61. Choat, B.; Brodribb, T.J.; Brodersen, C.R.; Duursma, R.A.; Lopez, R.; Medlyn, B.E. Triggers of tree mortality under drought. Nature 2018, 558, 531–539. [Google Scholar] [CrossRef] [PubMed]
  62. Hacke, U. Functional and Ecological Xylem Anatomy, 1st ed.; Springer: Cham, Switzerland, 2015; p. 112. [Google Scholar]
  63. Bittencourt, P.R.L.; Oliveira, R.S.; da Costa, A.C.L.; Giles, A.L.; Coughlin, I.; Costa, P.B.; Bartholomew, D.C.; Ferreira, L.V.; Vasconcelos, S.S.; Barros, F.V.; et al. Amazonia trees have limited capacity to acclimate plant hydraulic properties in response to long-term drought. Glob. Chang. Biol. 2020, 26, 3569–3584. [Google Scholar] [CrossRef] [PubMed]
  64. Benson, M.C.; Miniat, C.F.; Oish, A.C.; Denham, S.O.; Domec, J.C.; Johnson, D.M.; Missik, J.E.; Phillips, R.P.; Wood, J.D.; Novick, K.A. The xylem of anisohydric Quercus alba L. is more vulnerable to embolism than isohydric codominants. Plant Cell Environ. 2022, 45, 329–346. [Google Scholar] [CrossRef] [PubMed]
  65. Hochberg, U.; Rockwell, F.E.; Holbrook, N.M.; Cochard, H. Iso/Anisohydry: A Plant-Environment Interaction Rather Than a Simple Hydraulic Trait. Trends Plant Sci. 2018, 23, 112–120. [Google Scholar] [CrossRef]
  66. McGregor, I.R.; Helcoski, R.; Kunert, N.; Tepley, A.J.; GonzalezAkre, E.B.; Herrmann, V.; Zailaa, J.; Stovall, A.E.L.; Bourg, N.A.; McShea, W.J.; et al. Tree height and leaf drought tolerance traits shape growth responses across droughts in a temperate broadleaf forest. New Phytol. 2021, 231, 601–616. [Google Scholar] [CrossRef]
  67. Ryan, M.G. Tree mortality: Large trees losing out to drought. Nat. Plants 2015, 1, 15150. [Google Scholar] [CrossRef]
  68. Tognetti, R.; Michelozzi, M.; Giovannelli, A. Geographical variation in water relations, hydraulic architecture and terpene composition of Aleppo pine seedlings from Italian provenances. Tree Physiol. 1997, 17, 241–250. [Google Scholar] [CrossRef]
  69. Santiago, L.S.; De Guzman, M.E.; Baraloto, C.; Vogenberg, J.E.; Brodie, M.; Herault, B.; Fortunel, C.; Bonal, D. Coordination and trade-offs among hydraulic safety, efficiency and drought avoidance traits in Amazonian rainforest canopy tree species. New Phytol. 2018, 218, 1015–1024. [Google Scholar] [CrossRef]
  70. Sperry, J.S.; Hacke, U.G.; Pittermann, J. Size and function in conifer tracheids and angiosperm vessels. Am. J. Bot. 2006, 93, 1490–1500. [Google Scholar] [CrossRef] [PubMed]
  71. Zanne, A.E.; Westoby, M.; Falster, D.S.; Ackerly, D.D.; Loarie, S.R.; Arnold, S.E.J.; Coomes, D.A. Angiosperm wood structure: Global patterns in vessel anatomy and their relation to wood density and potential conductivity. Am. J. Bot. 2010, 97, 207–215. [Google Scholar] [CrossRef] [PubMed]
  72. Nardini, A.; Salleo, S.; Jansen, S. More than just a vulnerable pipeline: Xylem physiology in the light of ion-mediated regulation of plant water transport. J. Exp. Bot. 2011, 62, 4701–4718. [Google Scholar] [CrossRef]
  73. Avila, R.T.; Kane, C.N.; Batz, T.A.; Trabi, C.; Damatta, F.M.; Jansen, S.; McAdam, S.A.M. The relative area of vessels in xylem correlates with stem embolism resistance within and between genera. Tree Physiol. 2023, 43, 75–87. [Google Scholar] [CrossRef]
  74. De Guzman, M.E.; Santiago, L.S.; Schnitzer, S.A.; Alvarez-Cansino, L. Trade-offs between water transport capacity and drought resistance in neotropical canopy liana and tree species. Tree Physiol. 2017, 37, 1404–1414. [Google Scholar] [CrossRef] [PubMed]
  75. Pivovaroff, A.L.; Pasquini, S.C.; De Guzman, M.E.; Alstad, K.P.; Stemke, J.; Santiago, L.S. Multiple strategies for drought survival among woody plant species. Funct. Ecol. 2016, 30, 517–526. [Google Scholar] [CrossRef]
  76. Sanchez-Martinez, P.; Martínez-Vilalta, J.; Dexter, K.G.; Segovia, R.A.; Mencuccini, M. Adaptation and coordinated evolution of plant hydraulic traits. Ecol. Lett. 2020, 23, 1599–1610. [Google Scholar] [CrossRef]
  77. Peters, J.M.R.; Lopez, R.; Nolf, M.; Hutley, L.B.; Wardlaw, T.; Cernusak, L.A.; Choat, B. Living on the edge: A continental-scale assessment of forest vulnerability to drought. Glob. Chang. Biol. 2021, 27, 3620–3641. [Google Scholar] [CrossRef] [PubMed]
  78. Christoffersen, B.O.; Gloor, M.; Fauset, S.; Fyllas, N.M.; Galbraith, D.R.; Baker, T.R.; Kruijt, B.; Rowland, L.; Fisher, R.A.; Binks, O.J.; et al. Linking hydraulic traits to tropical forest function in a size-structured and trait-driven model (TFS v. 1-Hydro). Geosci. Model Dev. 2016, 9, 4227–4255. [Google Scholar] [CrossRef]
  79. Carvalho, E.C.D.; Souza, B.C.; Silva, M.S.; Menezes, B.S.; Martins, F.R.; Araujo, F.S.; Soares, A.A. Xylem anatomical traits determine the variation in wood density and water storage of plants in tropical semiarid climate. Flora 2023, 298, 152185. [Google Scholar] [CrossRef]
  80. Carrer, M.; Von, A.G.; Castagneri, D.; Petit, G. Distilling allometric and environmental information from time series of conduit size: The standardization issue and its relationship to tree hydraulic architecture. Tree Physiol. 2015, 35, 27–33. [Google Scholar] [CrossRef]
  81. Rosell, J.A.; Olson, M.E.; Anfodillo, T. Scaling of Xylem Vessel Diameter with Plant Size: Causes, Predictions, and Outstanding Questions. Curr. For. Rep. 2017, 3, 46–59. [Google Scholar] [CrossRef]
  82. Lachenbruch, B.; McCulloh, K.A. Traits, properties, and performance: How woody plants combine hydraulic and mechanical functions in a cell, tissue, or whole plant. New Phytol. 2014, 204, 747–764. [Google Scholar] [CrossRef]
  83. Hoeber, S.; Leuschner, C.; Kohler, L.; Arias-Aguilar, D.; Schuldt, B. The importance of hydraulic conductivity and wood density to growth performance in eight tree species from a tropical semi-dry climate. For. Ecol. Manag. 2014, 330, 126–136. [Google Scholar] [CrossRef]
  84. Janssen, T.A.J.; Holtta, T.; Fleischer, K.; Naudts, K.; Dolman, H. Wood allocation trade-offs between fiber wall, fiber lumen, and axial parenchyma drive drought resistance in neotropical trees. Plant Cell Environ. 2020, 43, 965–980. [Google Scholar] [CrossRef]
Figure 1. Monthly average air temperature and precipitation at the study site averaged for 38 years (1984–2021).
Forests 14 01759 g001
Figure 2. Geographical location of the study area. Y, M, and NM represent the young, middle-aged, and near-mature stands.
Forests 14 01759 g002
Figure 3. Parameters of leaf pressure-volume curves of three stand ages in Populus simonii. (A) Ψsat, the osmotic potential at saturated water content. (B) Ψtlp, the water potential at the turgor loss point. (C) RWCtlp, the relative water content at the turgor loss point. (D) ε, the cell wall elastic modulus. Y, M, and NM represent young, middle-aged, and near-mature stands, respectively. The solid circles represent original values, and different lowercase letters indicate significant differences (p < 0.05). Column height and error bars represent means ± standard deviations.
Forests 14 01759 g003
Figure 4. Parameters of xylem embolism vulnerability curves of three stand ages in Populus simonii. (A) P50, xylem water potential at 50% loss of conductivity. (B) P88, xylem water potential at 88% loss of conductivity. (C) SSMtlp, stomatal safety margin. Y, M, and NM represent young, middle-aged, and near-mature stands, respectively. Solid circles represent original values, and the thick horizontal line and error bars represent means ± standard deviations. Different lowercase letters indicate significant differences (p < 0.05).
Forests 14 01759 g004
Figure 5. Hydraulic structure and wood density of three stand ages in Populus simonii. (A) Ks, stem-specific conductivity. (B) LSC, leaf specific conductivity. (C) Hv, Huber value. (D) WD, wood density. Y, M, and NM represent young, middle-aged, and near-mature stands, respectively. Solid circles represent original values, and the thick horizontal line and error bars represent means ± standard deviations. Different lowercase letters indicate significant differences (p < 0.05).
Forests 14 01759 g005
Figure 6. Correlation of the hydraulic traits of three stand ages in Populus simonii. The number of asterisks indicates different levels of significance, * p < 0.05, ** p < 0.01. Numbers represent correlation coefficients.
Forests 14 01759 g006
Figure 7. Correlation between wood density and P88. Y, M, and NM represent young, middle-aged, and near-mature stands, respectively. Solid circles represent original values. Solid lines indicate the least squares regression lines, and R-values indicate the correlation coefficients.
Forests 14 01759 g007
Figure 8. Principal components analysis (PCA) of the parameters of the pressure-volume curves and xylem embolism vulnerability curves of the three stand ages in Populus simonii. Red, blue, and grey solid circles represent young, middle-aged, and near-mature stands, respectively. PC1 in the axis labels represents the first principal component, PC2 represents the second principal component, and percentage represents the variance explained by the axis.
Forests 14 01759 g008
Table 1. Basic information of Populus simonii Carr. in three stand age sample trees.
Stand AgeAge (yr)Height (m)DBH (cm)P (m)SWC (%)
Y99.50 ± 0.1918.14 ± 0.564.04 ± 0.718.02 ± 0.77
M1713.29 ± 0.6028.17 ± 0.385.56 ± 0.588.12 ± 1.82
NM2917.28 ± 1.0740.76 ± 0.857.52 ± 0.947.76 ± 1.13
Y, M, and NM represent young, middle-aged, and near-mature stands, respectively. DBH, diameter at breast height; P, crown diameter; SWC, soil water content. The values are mean ± standard deviations (n = 3).
Table 2. Hydraulic traits and wood density of three stand ages in Populus simonii.
IndicatorsStand Age
YMNM
Ψsat (MPa)−1.82 ± 0.00−1.81 ± 0.26−1.66 ± 0.08
Ψtlp (MPa)2.07 ± 0.03−2.19 ± 0.14−1.91 ± 0.04
RWCtlp (%)91.64 ± 1.2286.71 ± 2.1391.94 ± 1.43
ε (MPa)21.27 ± 3.4413.75 ± 2.1019.65 ± 3.99
P50 (MPa)−1.55 ± 0.04−1.51 ± 0.04−1.21 ± 0.06
P88 (MPa)−3.09 ± 0.02−2.99 ± 0.05−2.87 ± 0.02
SSMtlp (MPa)−0.52 ± 0.02−0.68 ± 0.10−0.70 ± 0.03
Ks (kg m−1 s−1 MPa−1)2.28 ± 0.113.00 ± 0.152.37 ± 0.13
LSC (10−3 kg m−1 s−1 MPa−1 kg−1)3.80 ± 0.1874.80 ± 0.2233.30 ± 0.246
Hv (cm2 g−1)0.0170 ± 0.000.0160 ± 0.000.0140 ± 0.00
WD (g cm−3)0.370 ± 0.0110.353 ± 0.0060.349 ± 0.008
Y, M, and NM represent young, middle-aged, and near-mature stands, respectively. Ψsat, the osmotic potential at saturated water content; Ψtlp, the water potential at the turgor loss point; RWCtlp, the relative water content at the turgor loss point; ε, the cell wall elastic modulus; P50, xylem embolism vulnerability; P88, angiosperm death threshold; SSMtlp, stomatal safety margin; Ks, stem specific conductivity; LSC, leaf specific conductivity; Hv, Huber value; WD, wood density. The values are mean ± standard deviations (n = 3).
Table 3. Comprehensive scores of environmental adaptability of the three stand ages in Populus simonii.
Stand AgePC1PC2PCComprehensive Ranking
Y1.9202.6832.2441
M2.380−2.3170.3882
NM−4.301−0.365−2.6313
Y, M, and NM represent young, middle-aged, and near-mature stands, respectively. PC1 represents the first principal component score, PC2 represents the second principal component score, and PC represents the composite principal component score.
Disclaimer/Publisher’s Note: The statements, opinions and data contained in all publications are solely those of the individual author(s) and contributor(s) and not of MDPI and/or the editor(s). MDPI and/or the editor(s) disclaim responsibility for any injury to people or property resulting from any ideas, methods, instructions or products referred to in the content.

