Article

The Effect of Atmospheric Carbon Dioxide Concentration on the Growth and Chlorophyll Fluorescence Characteristics of Hazelnut Leaves under Cadmium Stress

College of Horticulture, Jilin Agricultural University, Changchun 130118, China
*
Author to whom correspondence should be addressed.
These authors contributed equally to this work.
Forests 2023, 14(9), 1791; https://doi.org/10.3390/f14091791
Submission received: 31 July 2023 / Revised: 26 August 2023 / Accepted: 29 August 2023 / Published: 1 September 2023
(This article belongs to the Special Issue Advances in Plant Photosynthesis under Climate Change)

Abstract

:
To understand the response of hazelnut to the increased concentration of carbon dioxide (CO2) under cadmium (Cd) pollution stress, this paper used an artificial open top chamber to control the CO2 concentration (at 370 and 750 μmol·mol−1) and to study the effects of an elevated CO2 concentration on the growth and photosynthetic capacity of hazelnut leaves under different levels of Cd stress. The results showed that the increase in atmospheric CO2 concentration has a tendency to alleviate the inhibition of plant growth caused by Cd. The net photosynthetic rate rose significantly, although the transpiration rate and stomatal conductance of hazelnut leaves decreased slightly with the rise in CO2 concentration. The rise in CO2 concentration had no significant effect on the activity of the photosystem Ⅱ (PSII) reaction center in hazelnut leaves. Under Cd stress conditions, the rise in CO2 concentration significantly enhanced the PSII hazelnut leaves’ photochemical activity, which promotes the PSII receptor’s electron transfer capacity side and alleviates the degree of damage to the oxygen-evolving complex and the thylakoid membrane of the PSII donor side. The number of active reaction centers per unit area of hazelnut leaves, and the proportion of energy absorbed by PSII that is used for photosynthetic electron transfer, increased under severe stress conditions, which in turn reduced the energy proportion that was used for heat dissipation, providing CO2’s effective fixation energy in the dark reaction. In conclusion, the rise in the CO2 concentration enhances hazelnut’s heavy metal resistance by improving the PSII function under Cd stress conditions.

1. Introduction

At present, due to the combustion of fossil fuels and the change of land use types, the sedimentation rate of atmospheric carbon dioxide (CO2) concentration and nitrogen (N) have reached their highest ever recorded rates and are still increasing. The atmospheric CO2 concentration has increased from 315 μmol/mol in 1959 to a current concentration of approximately 385 μmol/mol, with a growth rate of 1.9 μmol/mol per year. The atmospheric CO2 concentration is predicted to increase to 540–970 μmol/mol by 2100 [1]. Such a high CO2 concentration is bound to have a great impact on tree growth and the carbon pool of forests. Numerous CO2 enrichments, nutrient addition experiments, and meta-analyses have shown that high CO2 concentrations have resulted in significant fertilization effects [2,3,4,5]. Among them, a high concentration of CO2 can promote plant photosynthesis, thereby improving forest productivity. However, some studies showed that despite the general increase in atmospheric CO2 concentration, global tree growth and forest carbon pool did not significantly increase, suggesting that other factors, such as Cd stress and environmental pollution, may hinder the stimulation of CO2 concentration on forest carbon storage in many regions [6,7,8,9]. Therefore, previous studies face limitations because (1) many studies were focused on single factors (the increase in atmospheric CO2 concentration or the impact of heavy metals), while few studies investigated dual or multiple factors, and (2) many studies have focused on forests polluted by heavy metals in tropical, subtropical, temperate, and cold regions, with little attention paid to economically important trees stressed by heavy metals. With the rapid increase in the global atmospheric CO2 concentration, heavy metal pollution of the soil has also become a global environmental problem, which has caused serious damage, especially in rapidly industrialized and urbanized areas. In Northeast China, heavy metal pollution in forest ecosystems has expanded from downtown areas to suburbs and remote mountainous locations, and the contents of lead (Pb), cadmium (Cd), and zinc (Zn) far exceed critical values for plant damage and soil background [1,9,10]. Considering the fact that complex factors coexist, an increasing number of researchers believe that well-designed multi-factor composite experiments are essential to accurately predict the dynamics of vegetation carbon use [7,11,12,13].
Hazelnut (Corylus spp.) is an important economic tree species in Northeast China, with high practical value. Hazelnuts are rich in nutrients and contains high contents of fat, protein, vitamins, and mineral elements [14]. The nutrient content of hazelnuts is twice that of bread and 1.5 times that of pork. In addition, the oil content of hazelnuts is approximately 54%, which is 2–3 times that of soybean, and it is the raw material used for the production of edible oil and various industrial oils. In addition, it also has medicinal values. Unsaturated fatty acids and vitamin E, which can prevent cardiovascular and cerebrovascular diseases, delay aging, prevent vascular sclerosis, and moisturize skin, are abundant in hazelnuts. Moreover, hazelnuts contain the anti-cancer chemical taxol, which can treat and prevent cancer. The content of trace elements, such as magnesium, calcium, and potassium, in hazelnuts is very high; thus, the long-term consumption of the nut can be beneficial to blood pressure regulation. Hazelnut plays an important role in the control of deserts and the conversion of farmland to forests [14]. Hazelnut trees have developed roots and strong adaptability; therefore, they are excellent resources for wind prevention and sand fixation, prevention of water and soil loss, and conversion of farmland to forests. However, the northeast region of China has the densest population, heaviest industry, and largest urban distribution in the country, which is affected by frequent and continuous human activities [15,16,17,18]. Environmental problems, such as intensified salinization of soil, and increasingly serious heavy metal and organic matter pollution, are occurring in this region. Cd is one of the most toxic heavy metals widely existing in the environment, and is particularly toxic to plants [18,19,20].
Therefore, in this paper, we used open top chamber (OTC) experiments to explore the impact of an elevated CO2 concentration on the growth of hazelnut under Cd pollution conditions. Our findings provide a scientific basis for vegetation restoration and management of cadmium-contaminated land.

2. Materials and Methods

2.1. Experimental Materials

The experiments were conducted in the Soil Science Experimental of Jilin Agricultural University in 2022. One-year-old hazelnut seedlings were selected and cultivated for another one year. High-quality, healthy seedlings were selected based on their strong root system (more than eight to ten lignified roots longer than 20 cm and rich in fibrous roots), vigorous stem, and plump buds, with an overall height of 80–130 cm.
Root trimming and soaking: Before planting, the root system of the seedlings was trimmed to 10–13 cm. The roots were soaked for 30 min before planting. The roots of the prepared seedlings were placed into a hole, allowing the root system to be spread out. The roots were covered with soil (topsoil backfill) after the seedlings were appropriately placed. The seedlings were gently firmed in by stepping on the soil. Immediately after planting, the seedlings were thoroughly irrigated, and the soil was covered with plastic film to seal the soil and preserve moisture retention to improve the survival rate of seedlings.
Routine management of trees: Soil loosening and timely weeding was conducted in combination with field management. During the growth period, weeding was performed three to four times to maintain a weed-free plantation. To determine whether topdressing should be applied, the status of soil fertility was determined. Topdressing was generally not applied in the year of field planting; however, if topdressing was necessary, a small amount of nitrogen fertilizer was applied in mid-July (30–50 g per plant). Once the seedlings had survived, the plastic film was removed. Irrigation was applied when the temperature was high in late May, and drainage was carried out in a timely manner in case of waterlogging. Before freezing in winter, seedlings were irrigated once, and the roots were mounded up to prevent damage due to cold, with a mound height of about 30 cm.
Soil management: Tillage was conducted to keep the soil loose and free of weeds. In some cases, grass was allowed to grow between rows. If there was no intercropping of other crops between rows, rotary tillage was applied three to four times on flat land with a rotary cultivator. If grass was allowed to grow, weeding was performed three to four times with a brush cutter.
Fertilization management: Topdressing according to the soil fertility status was applied in the second and third years of growth. Each year, the seedlings were fertilized two to three times using the following fertilization scheme: topdressing with 200–300 g nitrogen fertilizer once or twice per plant from April to May; topdressing 150–200 g N, P, K compound fertilizer once or twice per plant from June to July. Urea was used in nitrogen fertilizer (N content 46%); Phosphorus fertilizer application contained Potassium dihydrogen phosphate (P2O5 content 52%, K2O content 34%); and potassium fertilizer application consisted of potassium sulfide (K2O content 52%).

2.2. Experimental Design

In this study, a near-natural method using an OTC was adopted. The OTC was composed of a base, a chamber, and an inflation system, and was cylindrical. The base was a brick-wall structure with a diameter of 3 m and a height of 0.7 m. The chamber was fixed onto the base by stainless steel poles and was wound and reinforced by wire mesh. The chamber was enclosed with transparent PVC film. The inflation system was composed of an interconnected CO2 cylinder, a CO2 flowmeter, PVC pipe, and a blower. A PVC pipe surrounded the chamber, and the pipe had a 0.3 cm diameter hole every 30 cm on the side facing the center of the chamber. The soil in the chamber came from the plantation and the order of soil layers (0–10, 10–30, and 30–60 cm) was maintained during the transfer process. The concentration was 370 μmol/mol, and the concentration of the CO2 treatment was set to 750 μmol/mol. Since the annual sedimentation of Cd in the atmosphere is very low, Cd in the soil primarily comes from metal mines and sewage irrigation; therefore, the Cd treatment was set at 10 kg Cd/(hm2·a), which is characterized as weak and Cd pollution, respectively.
The experiments included four treatments: control (CK), 10 kg Cd (Cd) treatment, Cd and CO2 (Cd + CO2) treatment, and CK and CO2 (CK + CO2) treatment. Five replicates were conducted for each treatment, yielding 20 OTCs in total. The CO2 concentration in the chamber was controlled at 750 μmol/mol by the surrounding perforated rubber pipe and the CO2 heating flow valve inside the growth chamber. The fumigation time was 8:00–17:00. In the control, the Cd solution was replaced by the same amount of deionized water. Seedlings were planted in August 2022, and they were experimentally treated in September 2022 after adapting and growing stably in the OTCs.

2.3. Determination of Experimental Parameters

Growth parameter determination: Fifteen plants with the same growth trend were selected for further analysis. Plant phenotypic characteristics were leaves and measurements, including leaf length and the last fully expanded leaf’s width. A scanner (DS-50000, EPSON, Suwa City, Japan) was used to scan the hazelnut’s leaves, and the leaf area coefficients of 0.75 were obtained through image processing. The leaf area (leaf length × leaf width × 0.75) was also calculated. The water on the surface of the plant was absorbed with filter paper, and the fresh weight was determined with an analytic balance. The samples were subsequently placed in an oven at a temperature of 10.5 °C for a duration of 30 min in order to eliminate any moisture. Additionally, the samples were heated at 80 °C until reaching a stable weight in order to ascertain the weight when completely dried.
Determination of photosynthetic gas exchange parameters: Under different durations of Cd stress, the last fully expanded leaf of hazelnut seedlings was selected in each treatment. A concentration of 370 μmol·mol−1 CO2 was fixed by CO2 steel cylinders, and the light intensity (Photon Flux Density, PFD) was set to 1000 μmol·m−2·s−1 using the built-in light source of the instrument. The photosynthetic gas exchange parameters were obtained using the Li-6800 photosynthetic system (Lincoln, NE, USA). The net photosynthetic rate (Pn), stomatal conductance (Gs), transpiration rate (Tr), and intercellular CO2 concentration (Ci) of hazelnut leaves in different treatments were measured, and each measurement (five separate samples) was repeated five times.
Determination of chlorophyll fluorescence kinetics (OJIP) curve: We chose the final fully grown leaf from hazelnut seedlings that were subjected to various treatments. Each leaf was exposed to darkness for 30 min using a dark adaptation clip. The plant efficiency analyzer (Handy PEA, Hansatech, King’s Lynn, UK) was used to measure the OJIP curves of the leaves after the darkness adaptation period. The average value of the five replicates was used to plot the OJIP curve.
The relative variable fluorescence VJ of point J on the VO-P curve (2 ms), the relative variable fluorescence VK of point K on the VO-J curve (0.3 ms), and the relative variable fluorescence VL of point L on the VO-K curve (0.15 ms) were obtained. A JIP-test analysis was conducted on the OJIP curve to obtain various parameters. These parameters are the maximum photochemical efficiency of PSII (Fv/Fm), performance index of PSII based on absorption (PIABS), performance index of electron flux to the final PSI electron acceptors, i.e., of both PSII and PSI (PItotal), and the number of active response centers per unit area (RC/CSm). JIP-test analysis of OJIP curves was performed using the method described by Strasser et al. [6].

2.4. Data Analysis

Statistical analyses were conducted using Excel 2007 and SPSS 23.0 software. Two-way analysis of variance (ANOVA) was employed to compare the variations among different data sets.

3. Results

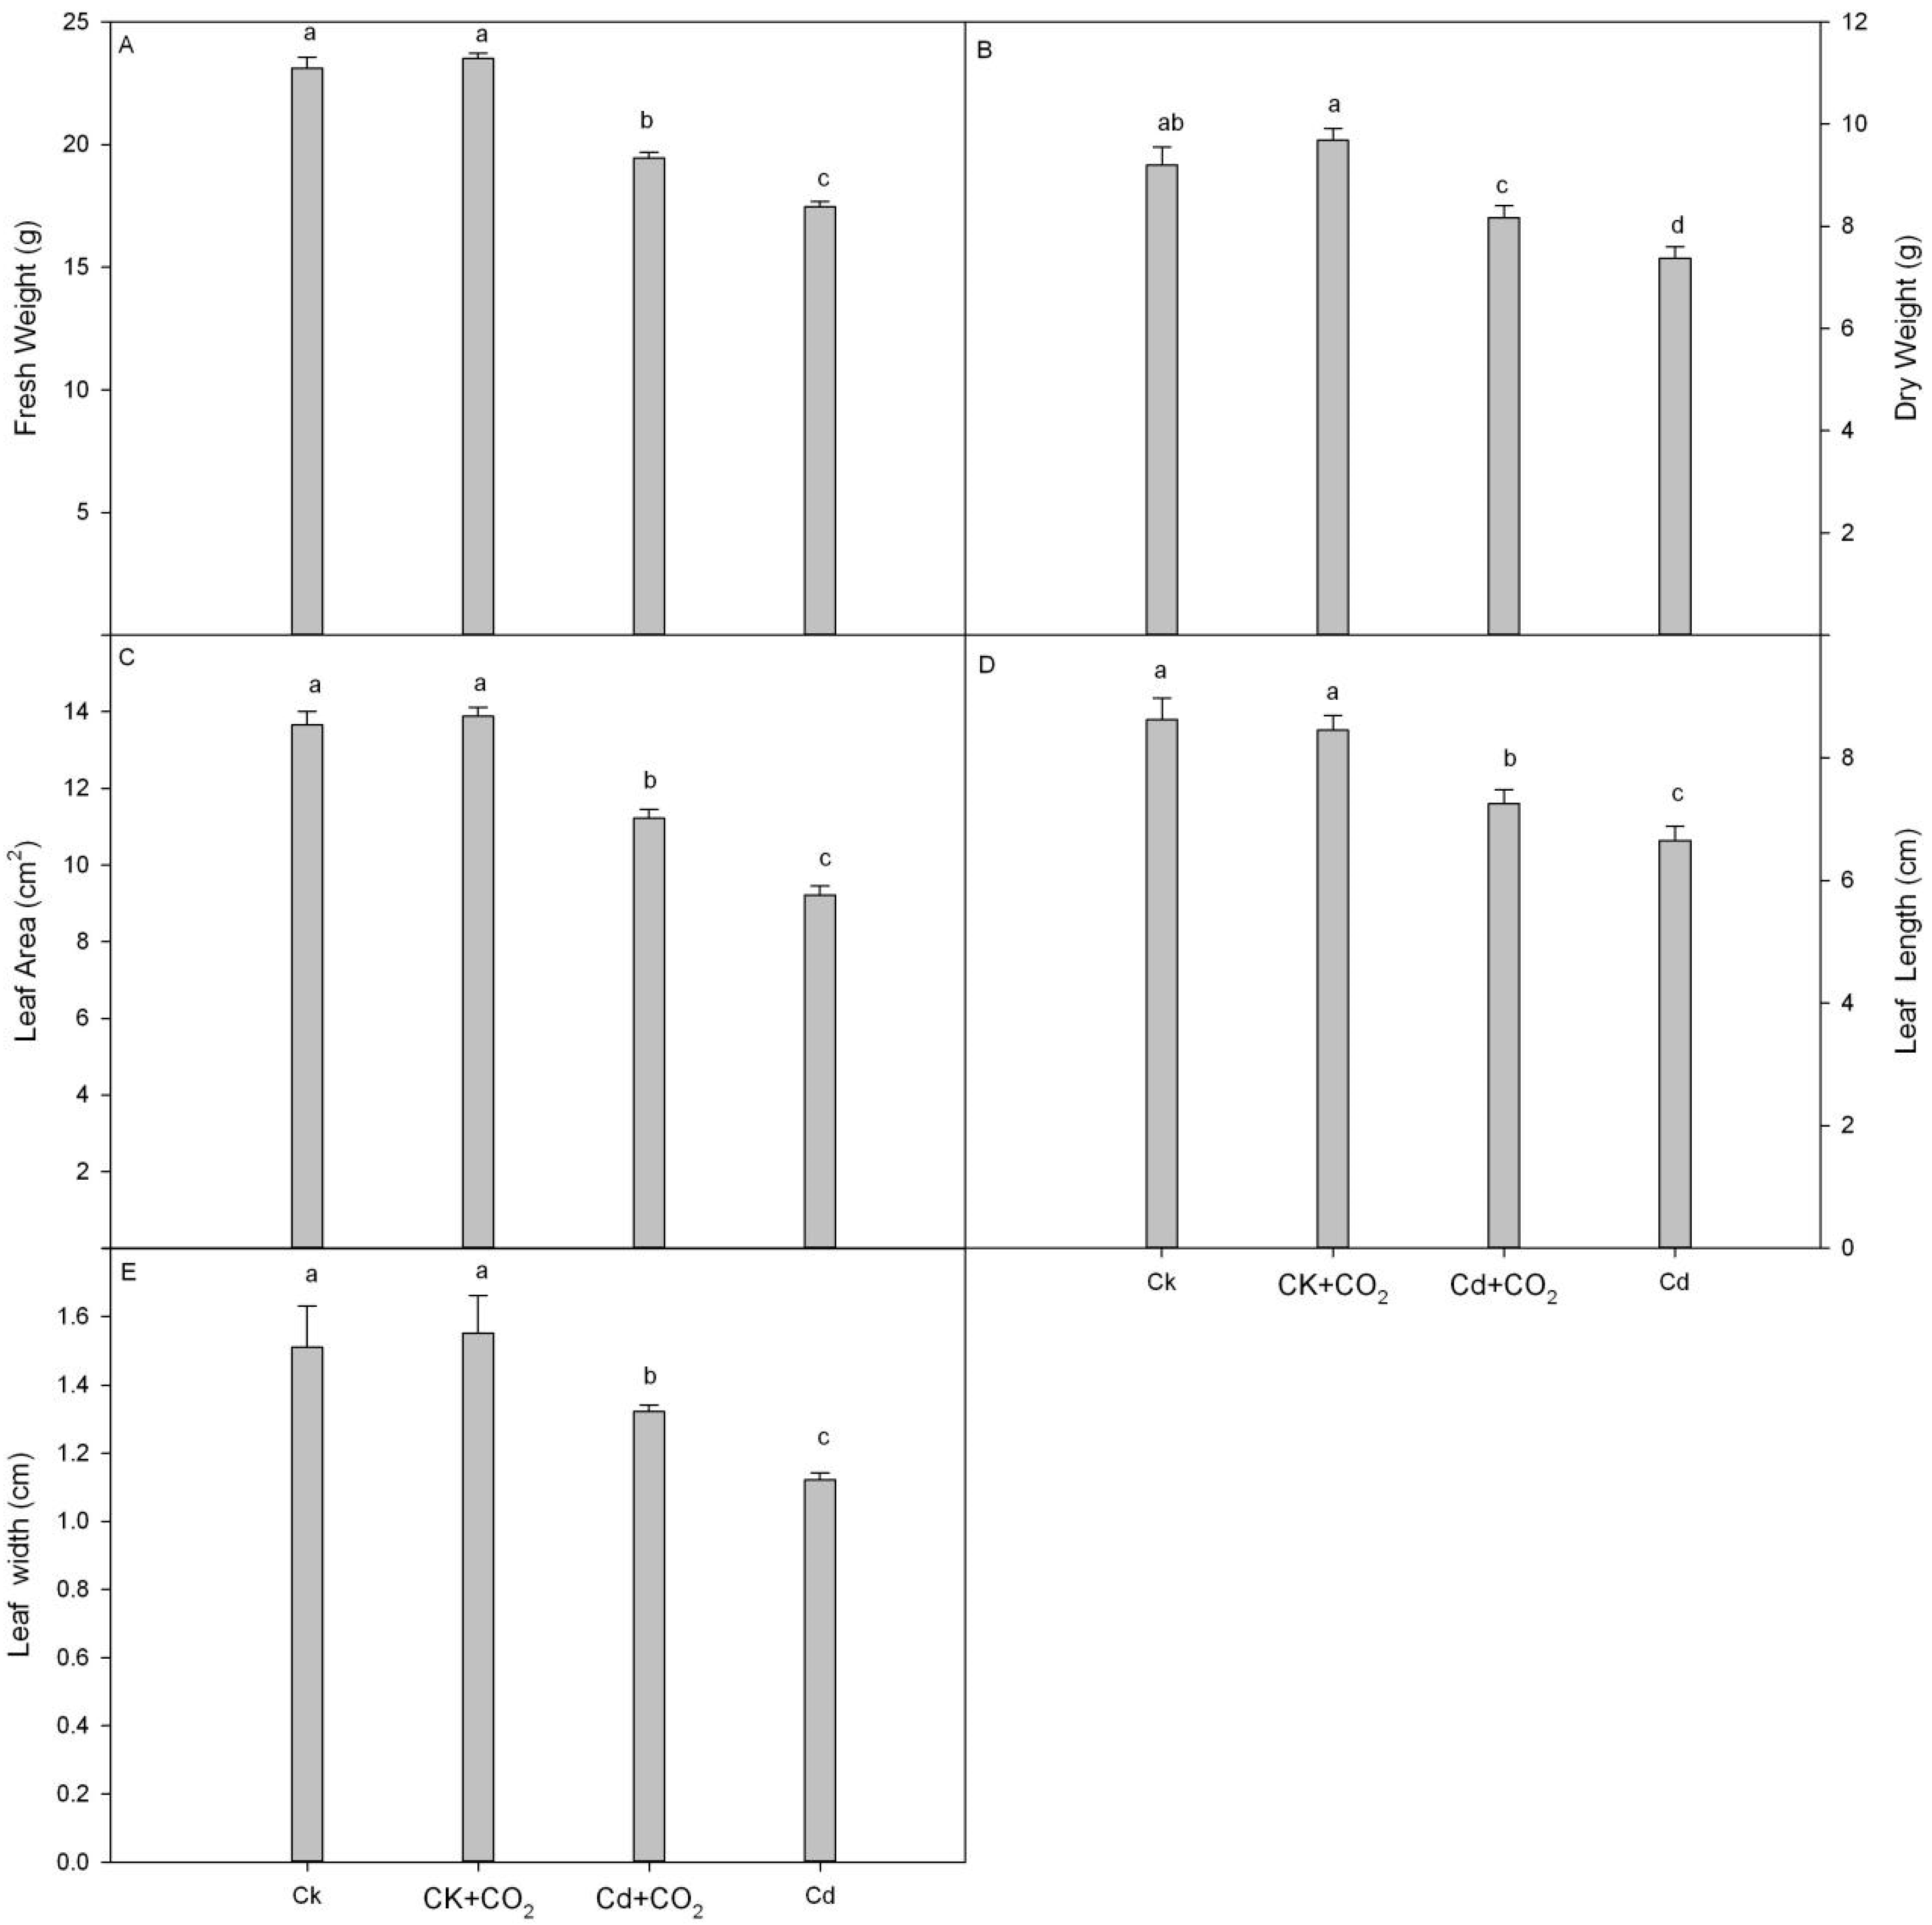
3.1. Growth Characteristics

The CO2 concentration had little impact on the growth characteristics of hazelnut leaves during the experimental period. In the high CO2 concentration treatment, the dry weight of hazelnut leaves increased, but not significantly. Compared with the CK, the fresh weight and dry weight of hazelnut leaves under Cd stress significantly decreased by 21.7% and 19.3%, respectively (Figure 1).

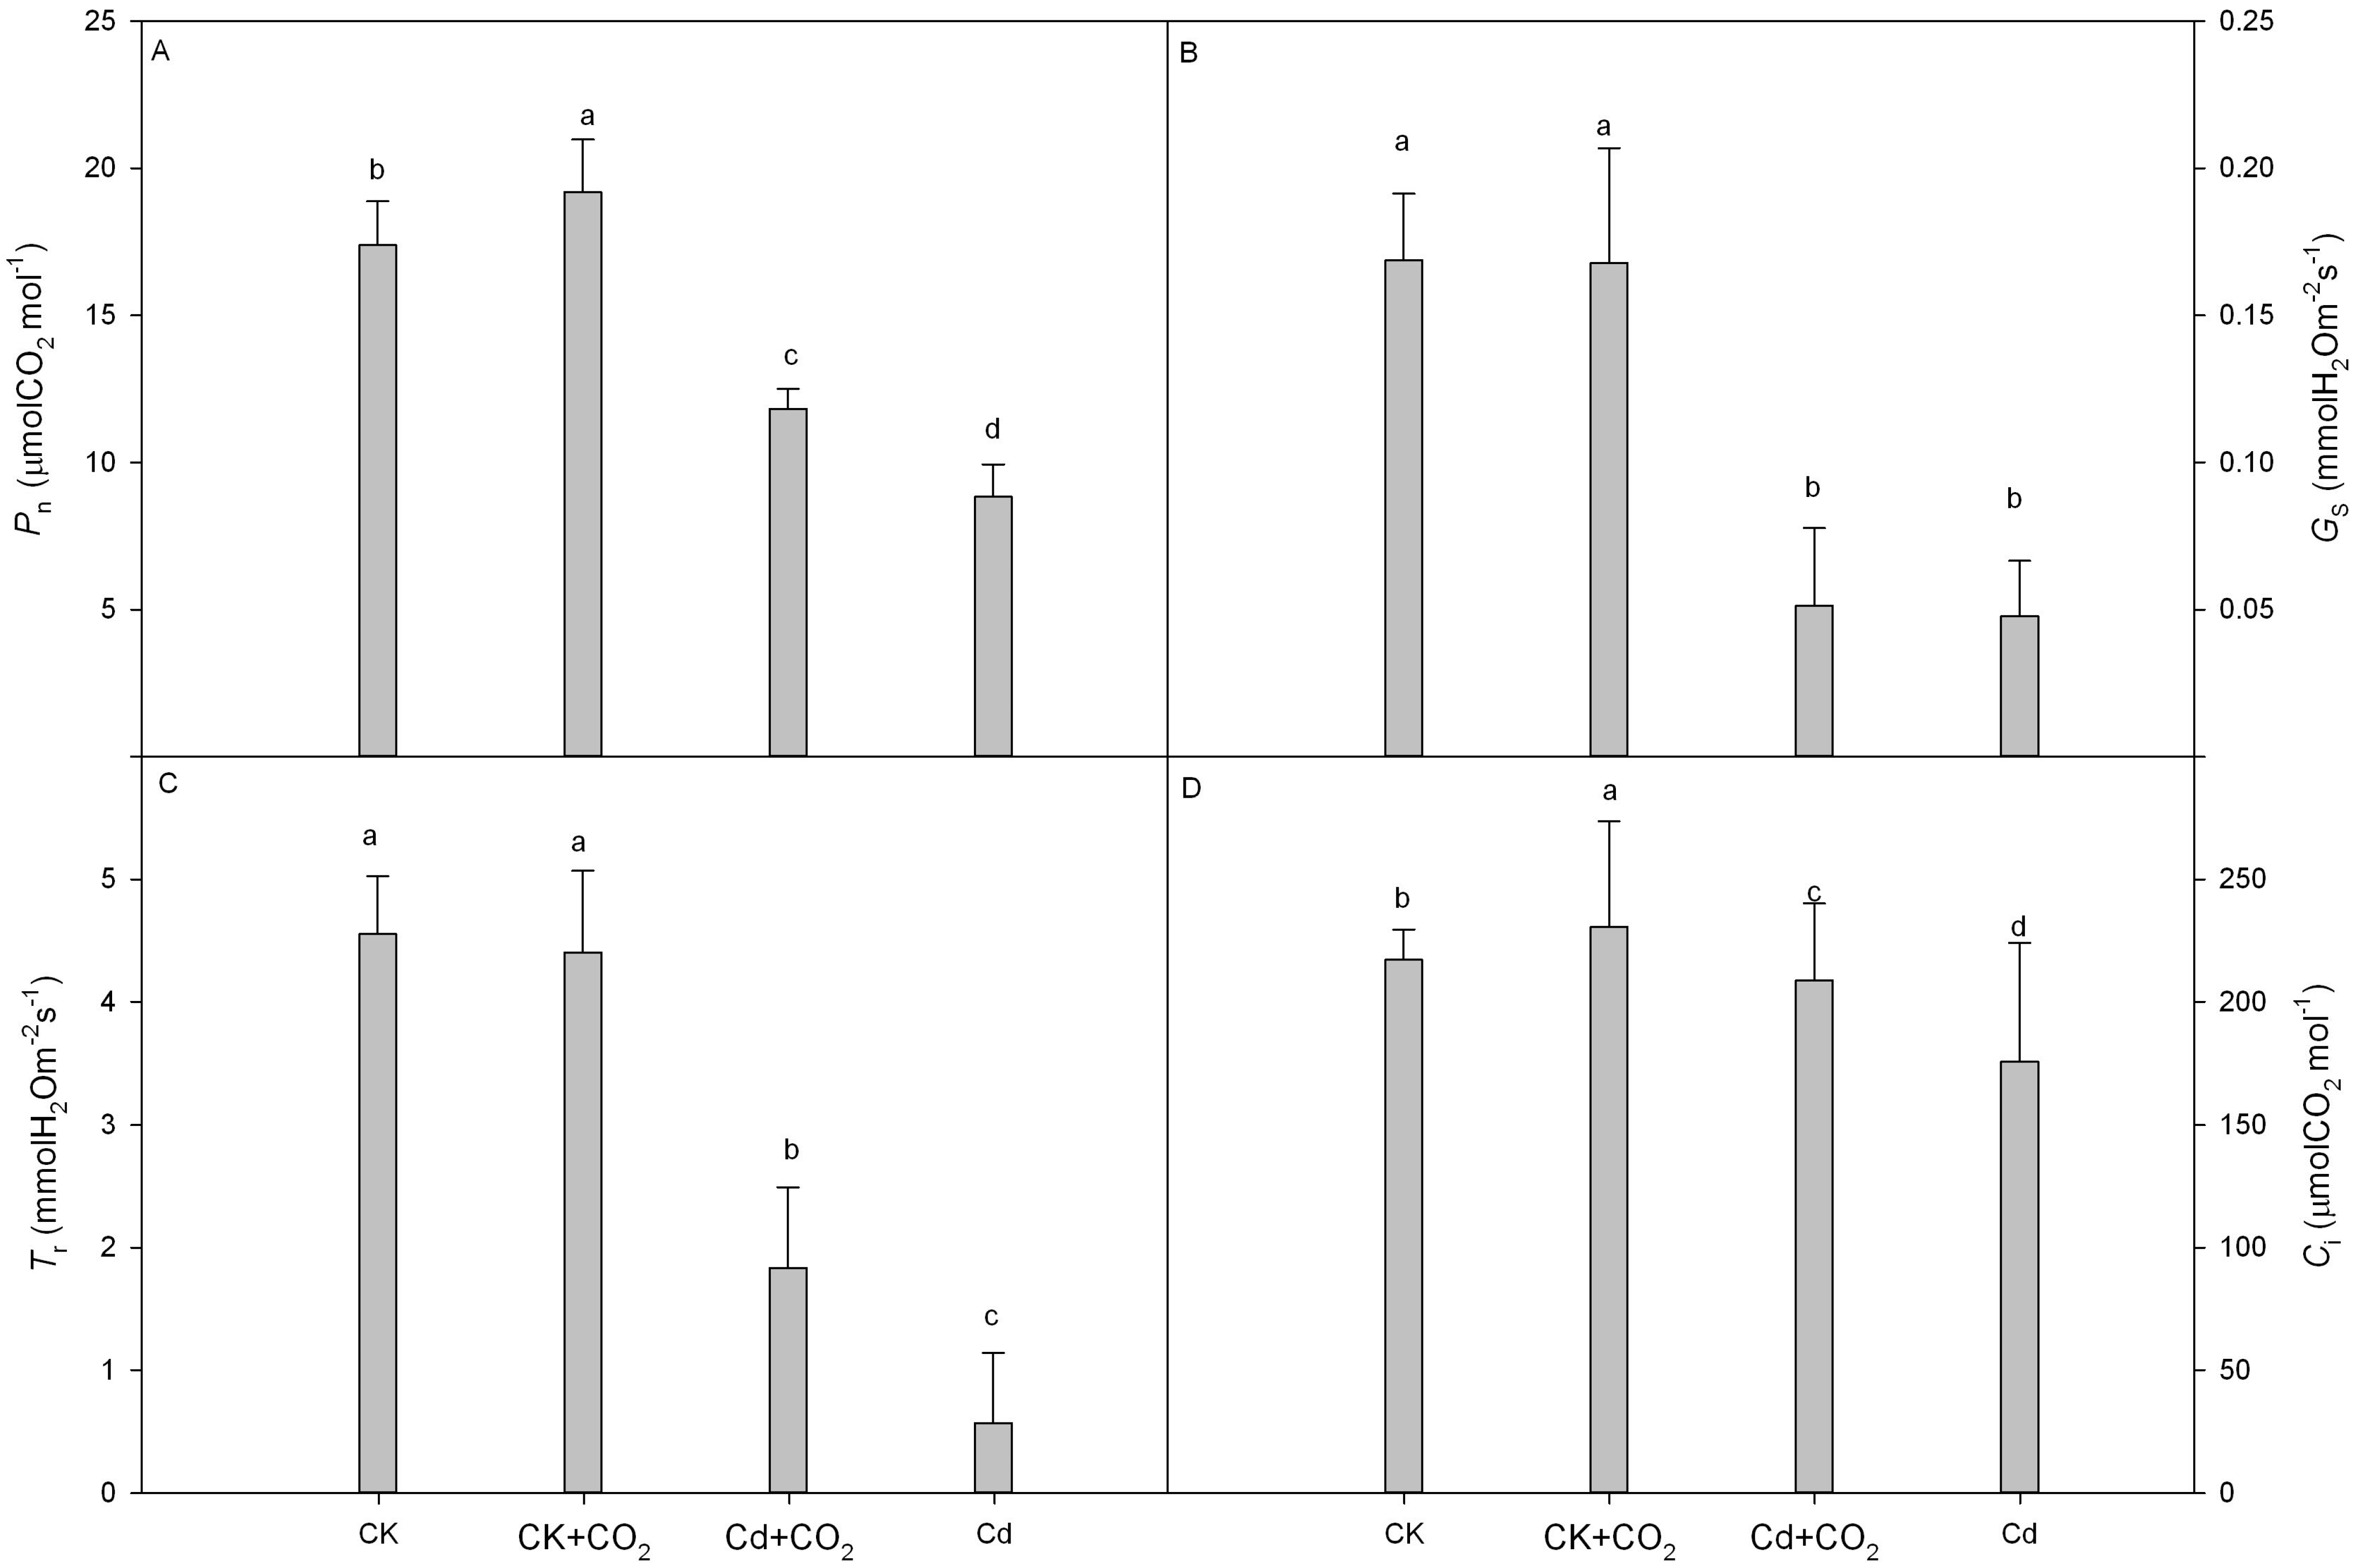
3.2. Photosynthetic Gas Exchange Parameters

The hazelnut leaves subjected to a CO2 concentration of 750 μmol·mol−1 had slightly higher rates of photosynthesis (Pn) and internal CO2 concentration (Ci) compared with those subjected to a CO2 concentration of 370 μmol·mol−1, with a significant increase in Pn by 9.41% (p < 0.05). Conversely, when exposed to cadmium (Cd) stress, the Pn, stomatal conductance (Ci), transpiration rate (Tr), and stomatal conductance (Gs) of hazelnut leaves all exhibited a significant decrease. However, hazelnut leaves treated with a CO2 concentration of 750 μmol·mol−1 displayed different responses compared with those treated with a CO2 concentration of 370 μmol·mol−1 (Figure 2).

3.3. Chlorophyll Fluorescence Characteristics

The analysis showed that when exposed to a CO2 concentration of 370 μmol·mol−1 and Cd stress, the Fo of hazelnut leaves increased by 16.12% (significantly different at p < 0.05) compared with the control group, while Fm decreased by 17.88% (significantly different at p < 0.05). The change in Fo and Fm was less pronounced in hazelnut leaves under the 750 μmol·mol−1 CO2 treatment compared with the 370 μmol·mol−1 CO2 treatment (Figure 3).

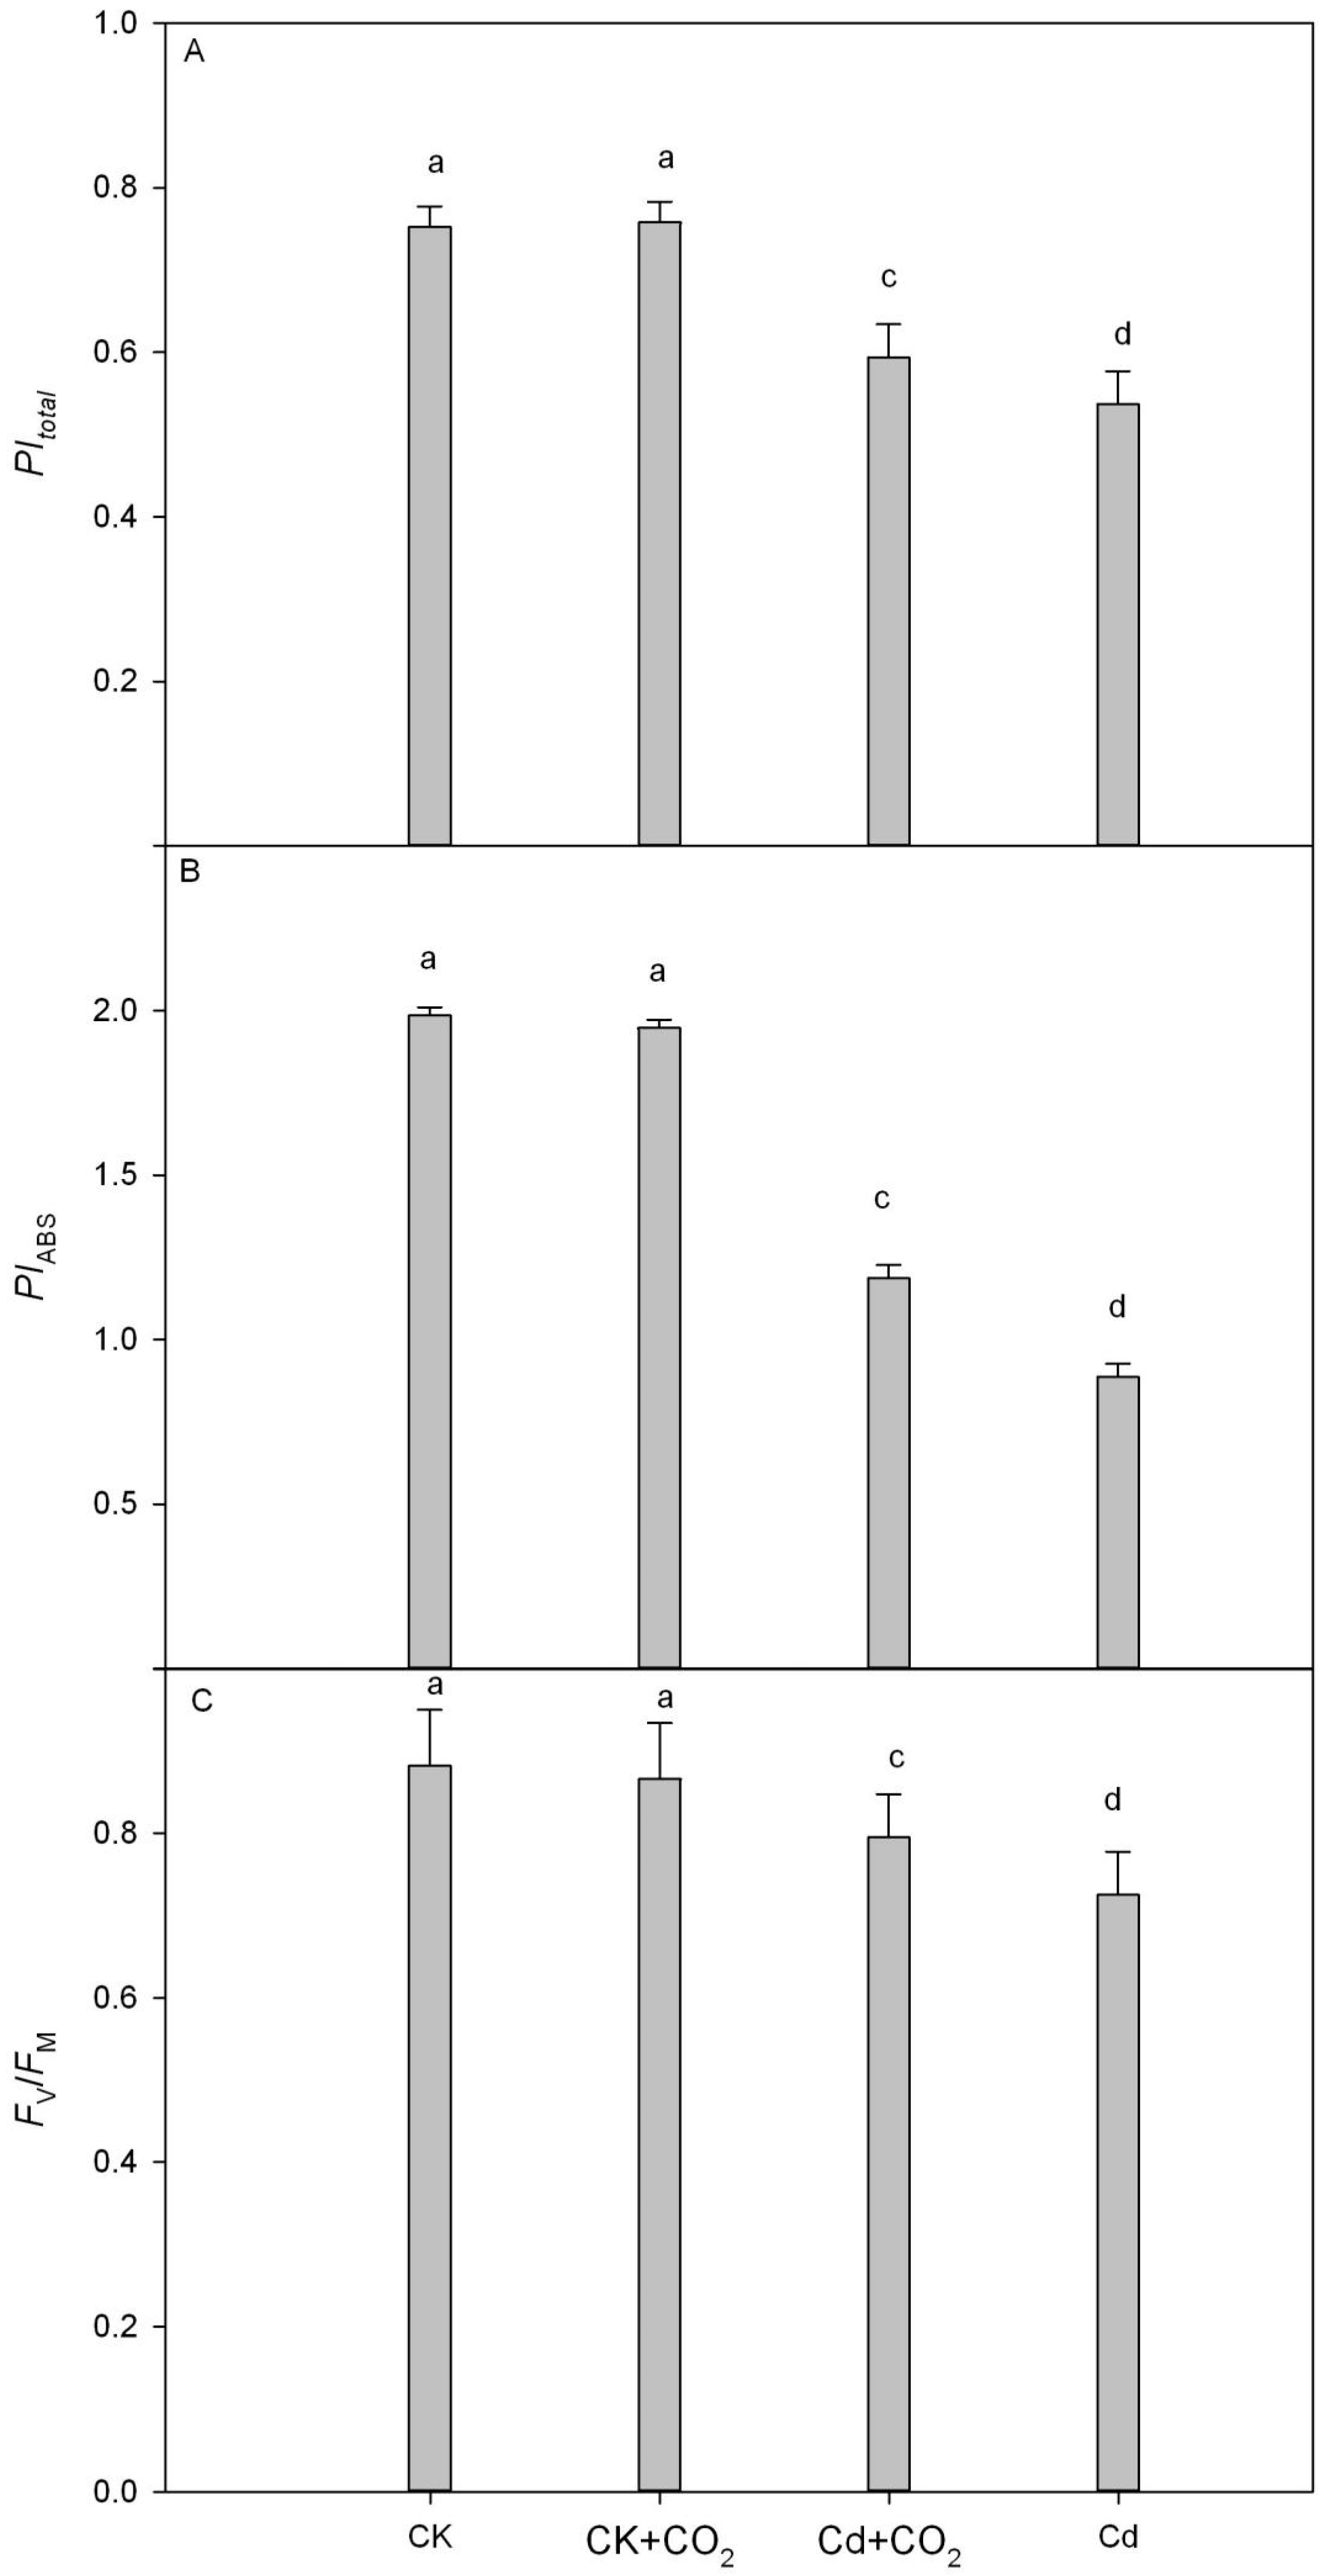
3.4. PSII Photochemical Efficiency

There was no significant difference in the Fv/Fm, PIABS, and PItotal of hazelnut leaves when comparing the CK treatment to the 370 and 750 μmol·mol−1 CO2 treatments. However, as the duration of the Cd stress treatment increased, there was a noticeable decrease in these parameters in the hazelnut leaves. When exposed to Cd stress, the hazelnut leaves treated with 750 μmol·mol−1 CO2 showed a 5.78%, 25.13%, and 5.61% decrease in Fv/Fm, PIABS, and PItotal, respectively, compared with those treated with 370 μmol·mol−1 CO2, indicating a significantly larger difference in these parameters (Figure 4).

3.5. Standardized O-P Curve and Relative Variable Fluorescence VJ, VK, and VL

Analysis of the quantitative changes in VJ revealed that the VJ of hazelnut leaves significantly increased under Cd stress conditions in both the 370 and 750 μmol·mol−1 CO2 treatments compared with the control group (CK). However, the increase in VJ was greater in the 370 μmol·mol−1 CO2 treatment than in the 750 μmol·mol−1 CO2 treatment. Analysis of the quantitative changes in VK indicated that the VK of hazelnut leaves in the 750 μmol·mol−1 CO2 treatment was 8.45% lower (p < 0.05) than that in the 370 mol·mol−1 CO2 treatment under Cd stress conditions.
Quantitative analysis of the changes in VL showed that the VL of hazelnut leaves increased significantly by 5.31% and 7.23% (p < 0.05) in the 370 μmol·mol−1 CO2 treatment under Cd stress conditions compared with the control group. On the other hand, the VL of hazelnut leaves did not show a significant change in either the Cd stress or Cd stress conditions in the 750 μmol·mol−1 CO2 treatment (Figure 5).

3.6. Parameters of Energy Distribution per Unit of Reaction Center

The change in RC/CSm suggested that under Cd stress, the RC/CSm of hazelnut leaves under the 370 μmol·mol−1 CO2 treatments decreased by 17.98% compared with the CK (p < 0.05). No significant decrease in the RC/CSm was observed in the 750 μmol·mol−1 CO2 treatment (Figure 6).

4. Discussion

The results of this study showed the biomass accumulation and growth of hazelnut that grew in Cd-contaminated soils to have different responses to the rise in atmospheric CO2 concentration. The rise in biomass of hazelnut that was treated with Cd was lower than that of the control, indicating that Cd stress conditions have an inhibitory effect on hazelnut’s growth. The migration of heavy metal Cd in the soil–plant system affects the biochemical and physiological processes, growth, and development of plants directly by impeding root growth, inhibiting nutrient absorption and water, and inhibiting photosynthesis, thereby reducing plant yield [21,22,23]. These results suggested that in Cd-contaminated soil, a high concentration of CO2 can alleviate the toxic effect of Cd on plants.

4.1. The Growth and Development of Hazelnut under Cd Stress Conditions

The rise in atmospheric CO2 concentration and Cd content in the soil is the trend change of our future climate. Numerous studies have shown that Cd stress has a significant inhibitory effect on plant development and growth. For instance, some studies found that with water content’s continuous reduction, plant height, root/shoot ratio, and aboveground and belowground fresh weight all showed a downward trend in Coreopsis tinctoria [24]. The biomass and morphological indexes of seedlings decreased significantly under Cd stress. A study on phenotypes of Zea mays L.’ seedlings found that Cd stress greatly inhibited the development and growth of wheat seedlings, which was mainly reflected by the number of tillers, seedling height, and leaf area. Other reports suggested a fertilizer effect of the increased CO2 concentration on crop growth [25]. The present study found that under high CO2 concentrations, the leaf length, leaf width, and leaf area of hazelnut significantly rose, indicating that the rise in photosynthetic area is conducive to dry matter’s accumulation in the plant, thus increasing the fresh weight and dry weight of the aboveground part of hazelnut.

4.2. Effects of High CO2 Concentration on Gas Exchange Parameters under Cd Stress

A few studies have shown that a rise in CO2 concentration causes a decrease in the partial closure and the Gs of stomata. Some studies showed that the doubling of CO2 concentration reduced the stomatal conductance by an average of 11% and the rise in CO2 concentration reduced winter wheat’s stomatal density [26,27]. In this study, in the 750 μmol·mol−1 CO2 treatment, Gs and Tr of hazelnut leaves were unchanged compared with those in the 370 μmol·mol−1 CO2 treatment; however, Pn was significantly increased. This indicated that Gs might not be the limiting factor for the rise in Pn under the double CO2 concentration treatment. In addition, an elevated CO2 concentration can improve the Rubisco activity, is related to carboxylation, and can enhance photosynthetic capacity by inhibiting photorespiration and increasing substrates. CO2 is both the substrate for photosynthesis and stomata’s regulator. Some studies showed that the effects of Cd stress and elevated CO2 concentration significantly interact, impacting Pn, and that a high CO2 concentration improves plants’ adaptability to Cd stress [28].

4.3. Effects of High CO2 Concentration on PSII Photochemical Efficiency under Cd Stress Conditions

The presence of Cd stress inhibited the dark reaction, resulting in a decrease in activity in the PSII reaction center. The accumulation of assimilates (NADPH and ATP) also had a feedback effect, further inhibiting the light reaction process [29,30,31]. In this experiment, as the duration of Cd stress increased, hazelnut leaves exhibited a decreasing trend in Fv/Fm, PIABS, and PItotal. Particularly, the decrease in PIABS and PItotal was more pronounced, indicating a decrease in photochemical activity in the PSII of hazelnut leaves under Cd stress. A previous study similarly found that an increased CO2 concentration affects the photosynthetic energy conversion and electron transfer of plant leaves. However, in this experiment, when the Cd stress was mild, the rise in CO2 concentration had no significant effect on Fv/Fm, PIABS, and PItotal of hazelnut leaves. Under Cd stress, hazelnut leaves treated with 750 μmol·mol−1 CO2 had significantly higher values for Fv/Fm, PIABS, and PItotal compared with those treated with 370 μmol·mol−1 CO2. This suggests that the increased CO2 concentration can alleviate photoinhibition in hazelnut leaves under Cd stress.
Under stress conditions, the blocked sites of photosynthetic electron transfer in plants often appear on the electron donor side and the electron acceptor side of the PSII reaction center [32,33]. As the specified symbol, the oxygen-evolving complex (OEC) on the PSII electron donor side was injured, and the rise of the relative variable fluorescence at point K of 0.3 ms (VK) was considered. The relative variable fluorescence at the OJIP curve’s 2 ms, point J (VJ), represented the degree of the active reaction center’s closure, and the rise of VJ indicated that the electron transfer from QA to QB in the photosynthetic electron transfer chain was inhibited and that the accumulation of redox-state QA gradually increased [32,33]. In this experiment, VJ and VK in hazelnut leaves rose to varying degrees under Cd stress, indicating that the decrease in PSII photochemical activity in hazelnut leaves caused by Cd stress was related to blockage of electron transfer on the PSII donor and receptor sides. Although VJ and VK of hazelnut leaves showed no significant difference in the 370 and 750 μmol·mol−1 CO2 treatments, under Cd stress, the VK and VJ of leaves in the 750 μmol·mol−1 CO2 treatment were both significantly lower than in the 370 μmol·mol−1 CO2 treatment. These results showed that the rise in CO2 concentration could alleviate the degree of damage to the OEC in hazelnut leaves under Cd stress, and that it could promote the electron transfer from QA to QB on the PSII receptor side under Cd stress.
The rise of the relative variable fluorescence at point L (VL) was thought of as the change in thylakoid membrane fluidity, which was the major indicator that its functional and structural integrity was destroyed [32,33]. In this experiment, it was observed that the VL of hazelnut leaves decreased significantly under Cd stress under the treatment with a CO2 concentration of 750 μmol·mol−1 compared with the treatment with a CO2 concentration of 370 μmol·mol−1. The increase in VL was considered an important indication of the change in fluidity of the thylakoid membrane, as well as the damage to its functional and structural integrity. Therefore, the increase in CO2 concentration was found to enhance the stability of the thylakoid membrane in hazelnut leaves under Cd stress. The stability of the thylakoid membrane is directly linked to the stability of PSII function. Consequently, the relatively stable thylakoid membrane also contributes to the stability of PSII.
The utilization and absorption of light energy in plant leaves’ PSII reaction center can be affected by stress conditions [34,35,36]. Under Cd stress conditions, the hazelnut leaves’ RC/CSm significantly decreased, indicating that when a part of the reaction centers in hazelnut leaves becomes inactive under Cd stress, the leaves could adapt to Cd stress by enhancing the light energy absorption capacity using the remaining active reaction centers. These results are similar to several previously published studies. Compared with the results from the 370 μmol·mol−1 CO2 treatment, related and overall similar results were obtained with regard to the trend of light energy absorption and allocation parameters of the PSII reaction centers in hazelnut leaves under the 750 μmol·mol−1 CO2 treatment, but the magnitude of variation was significantly reduced. In particular, the RC/CSm was not significantly reduced in the CO2 treatments combined with Cd stress. One possible explanation for this outcome is the hypothesis that the increase in CO2 levels may impact the way hazelnut leaves absorb and distribute light energy through the photosystem II (PSII) reaction centers when under cadmium stress. This could lead to a decrease in the number of reaction centers affected by this stress. As a result of this process, the amount of energy absorbed by the PSII reaction centers for electron transfer is also expected to increase. This ensures a regular energy supply and the production of assimilatory power (in the form of ATP and NADPH) during PSII electron transfer, which aids in the process of CO2 fixation [37,38].

5. Conclusions

The increase in CO2 concentration enhances the photosynthetic performance of hazelnut leaves. However, in the absence of Cd stress, the increase in CO2 concentration has a minimal effect on the photochemical activity and electron transfer of hazelnut leaves’ PSII. On the other hand, when subjected to Cd stress and elevated CO2 concentrations, the photosynthetic electron transfer on the PSII receptor side is stimulated, while the damage to the OEC on the PSII donor side is alleviated. As a result, the energy distribution of the PSII reaction centers is optimized, leading to an increase in the quantity of active reaction centers and the stability of the thylakoid membrane.

Author Contributions

Conceptualization, X.T.; Methodology, X.L. and P.N.; Formal analysis, X.L. and B.L.; Investigation, Y.C.; Resources, X.T.; Writing—original draft, X.L. and Y.C.; Writing—review and editing, X.T. and X.L. All authors have read and agreed to the published version of the manuscript.

Funding

This research was funded by Jilin Provincial Natural Science Foundation grant number No.YDZJ202101ZYTS113.

Institutional Review Board Statement

Not applicable.

Data Availability Statement

The data that support the findings of this study are available from the corresponding author upon reasonable request.

Conflicts of Interest

The authors declare no conflict of interest.

References

  1. Woodward, F.I.; Kelly, C.K. The influence of CO2 concentration on stomatal density. New Phytol. 2006, 131, 311–327. [Google Scholar] [CrossRef]
  2. Melillo, J.M.; Steudler, P.A.; Aber, J.D. Soil warming and carbon-cycle feedbacks to the climate system. Science 2002, 298, 2173–2176. [Google Scholar] [CrossRef] [PubMed]
  3. Wheeler, J.K.; Huggett, B.A.; Tofte, A.N. Cutting xylem under tension or supersaturated with gas can generate PLC and the appearance of rapid recovery from embolism. Plant. Cell Environ. 2013, 36, 1938–1949. [Google Scholar] [CrossRef] [PubMed]
  4. Suslov, M.A. Dynamics of intercellular water transfer in the roots of intact Zea mays L. plants under elevated concentrations of atmospheric CO2. Plant Physiol. Biochem. 2020, 151, 516–525. [Google Scholar] [CrossRef]
  5. Kosiba, A.M.; Schaberg, P.G.; Rayback, S.A.; Hawley, G.J. The surprising recovery of red spruce growth shows links to decreased acid deposition and elevated temperature. Sci. Total Environ. 2018, 637, 1480–1491. [Google Scholar] [CrossRef]
  6. Strasser, R.J.; Srivastava, A.; Govindjee. Polyphasic chlorophyll a fluorescence transient in plants and cyanobacteria. Photochem. Photobiol. 1995, 61, 32–42. [Google Scholar] [CrossRef]
  7. Ainsworth, E.A.; Rogers, A. The response of photosynthesis and stomatal conductance to rising CO2: Mechanisms and environmental interactions. Plant. Cell. Environ. 2007, 30, 258–270. [Google Scholar] [CrossRef]
  8. Murray, D.R. Plant responses to carbon dioxide. Am. J. Bot. 1995, 82, 690–697. [Google Scholar] [CrossRef]
  9. Taylor, B.N.; Strand, A.E.; Cooper, E.R.; Beidler, R.E.; Katilyn, V.; Schonholz, M. Root length, biomass, tissue chemistry and mycorrhizal colonization following 14 years of CO2 enrichment and 6 years of N fertilization in a warm temperate forest. Tree Physiol. 2014, 34, 955–965. [Google Scholar] [CrossRef]
  10. Hassan, W.; Bano, R.; Bashir, S.; Aslam, Z. Cadmium toxicity and soil biological index under potato (Solanum tuberosum L.) cultivation. Soil Res. 2016, 54, 460–468. [Google Scholar] [CrossRef]
  11. Pazzaglia, P.T.; Weiner, J.; Liu, F. Effects of CO2 elevation and irrigation regimes on leaf gas exchange plant water relations, and water use efficiency of two tomato cultivars. Agric. Water Manag. 2019, 169, 26–33. [Google Scholar] [CrossRef]
  12. Wu, D.X.; Wang, G.X. Interaction of CO2, enrichment and drought on growth, water use, and yield of broad bean (Vicia faba). Environ. Experi. Bot. 2000, 43, 13–139. [Google Scholar] [CrossRef]
  13. Zavalloni, C.; Vicca, S.; Buscher, M.; de la Providencia, I.E.; de Boulois, H.D.; Declerck, S.; Nijs, I.; Ceulemans, R. Exposure to warming and CO2 enrichment promotes greater above-ground biomass, nitrogen, phosphorus and arbuscular mycorrhizal colonization in newly established grasslands. Plant Soil 2012, 359, 121–136. [Google Scholar] [CrossRef]
  14. Tóth, S.Z.; Schansker, G.; Kissimon, J.; Kovã, C.L.; Garab, G.; Strasser, R.J. Biophysical studies of photosystem II-related recovery processes after a heat pulse in barley seedlings (Hordeum vulgare L.). J. Plant. Physiol. 2005, 162, 181–194. [Google Scholar] [CrossRef] [PubMed]
  15. Sun, Z.W.; Ren, L.K.; Fan, J.W.; Li, Q.; Wang, K.J.; Guo, M.M.; Wang, L.; Li, J.; Zhang, G.X.; Yang, Z.Y.; et al. Salt response of photosynthetic electron transport system in wheat cultivars with contrasting tolerance. Plant. Soil Environ. 2016, 62, 515–521. [Google Scholar] [CrossRef]
  16. Jiang, H.X.; Chen, L.S.; Zheng, J.G.; Zheng, J.G.; Han, S.; Tang, N.; Smith, B.R. Aluminum-induced effects on Photosystem II photochemistry in Citrus leaves assessed by the chlorophyll a fluorescence transient. Tree Physiol. 2008, 28, 1863–1871. [Google Scholar] [CrossRef]
  17. Farquhar, G.D.; O’Leary, M.H.; Berry, J.A. On the relationship between carbon isotope discrimination and the intercellular carbon dioxide concentration in leaves. Aust. J. Plant Physiol. 1982, 9, 121–137. [Google Scholar] [CrossRef]
  18. Ashraf, S.; Ali, Q.; Zahir, Z.A.; Sobia, A.; Hafiz, N. Phytoremediation: Environmentally sustainable way for reclamation of heavy metal polluted soils. Ecotoxicol. Environ. Saf. 2019, 174, 714–727. [Google Scholar] [CrossRef]
  19. Pedroso, D.D.; Barbosa, M.V.; Dos Santos, J.V.; Pinto, F.A.; Siqueira, J.O.; Carneiro, M.A.C. Arbuscular mycorrhizal fungi favor the initial growth of Acacia mangium, Sorghum bicolor, and Urochloa brizantha in soil contaminated with Zn, Cu, Pb, and Cd. Bull. Environ. Contam. Toxicol. 2018, 101, 386–391. [Google Scholar] [CrossRef]
  20. Xu, H.; Li, L.; Li, Q.H.; Zhou, L.; Zhu, X.J.; Chen, F.J.; Wang, Y.H.; Fang, W.P. Effects of elevated atmospheric CO2 concentration and temperature on photosynthesis system and quality components in tea plant. J. Nanjing Agric. Univ. 2016, 39, 550–556. [Google Scholar]
  21. Li, Q.; Liu, B.; Wu, Y.; Zou, Z. Interactive effects of drought stresses and elevated CO2 concentration on photochemistry efficiency of cucumber seedlings. J. Int. Plant. Biol. 2008, 50, 1307–1317. [Google Scholar] [CrossRef]
  22. Jia, X.; Zhao, Y.H.; Liu, T.; He, Y.H. Leaf defense system of Robinia pseudoacacia L. seedlings exposed to 3 years of elevated atmospheric CO2 and Cd-contaminated soils. Sci. Total Environ. 2017, 605, 48–57. [Google Scholar] [CrossRef]
  23. Li, Q.M.; Liu, B.B.; Zou, Z.R. Effects of doubled CO2 concentration on photosynthetic characteristics of cucumber seedlings under drought stresses. Sci. Agric. Sin. 2011, 44, 963–971. [Google Scholar]
  24. Curtis, P.S.; Wang, X.Z. A meta-analysis of elevated CO2 effects on woody plant mass, form, and physiology. Oecologia 1998, 113, 299–313. [Google Scholar] [CrossRef] [PubMed]
  25. Zhang, Z.S.; Li, G.; Gao, H.Y.; Zhang, L.T.; Yang, C.; Liu, P.; Meng, Q.W. Characterization of photosynthetic performance during senescence in stay-green and quick-Leaf-senescence Zea mays L. inbred lines. PLoS ONE 2012, 7, e42936. [Google Scholar] [CrossRef]
  26. Farquhar, G.D.; von Caemmerer, S.; Berry, J.A. A biochemical model of photosynthetic CO2 assimilation in leaves of C3 species. Planta 1980, 149, 78–90. [Google Scholar] [CrossRef] [PubMed]
  27. Khanboluki, G.; Hosseini, H.M.; Holford, P.; Zadeh, B.M.; Milham, P.J. Effect of elevated atmospheric CO2 concentration on growth and physiology of wheat and sorghum under cadmium stress. Commun. Soil. Sci. Plant Ana. 2018, 49, 2867–2882. [Google Scholar] [CrossRef]
  28. Guo, B.H.; Dai, S.X.; Wang, R.G.; Guo, J.K.; Ding, Y.A.; Xu, Y.M. Combined effects of elevated CO2 and Cd-contaminated soil on the growth, gas exchange, antioxidant defense, and Cd accumulation of poplars and willows. Environ. Exper Bot. 2015, 115, 1–10. [Google Scholar] [CrossRef]
  29. Wu, K.R.; Li, J.X.; Luo, J.P.; Liu, Y.K.; Song, Y.C.; Liu, N.L.; Rafiq, M.T.; Li, T.Q. Effects of elevated CO2 and endophytic bacterium on photosynthetic characteristics and cadmium accumulation in Sedum alfredii. Sci. Total Environ. 2018, 643, 357–366. [Google Scholar] [CrossRef] [PubMed]
  30. Zhang, H.H.; Zhang, X.L.; Li, X.; Ding, J.N.; Zhu, W.X.; Qi, F.; Zhang, T.; Tian, Y.; Sun, G.Y. Effects of NaCl and Na2CO3 stresses on the growth and photosynthesis characteristics of Morus alba seedlings. Chin. J. Appl. Ecol. 2012, 23, 625–631. [Google Scholar]
  31. Tang, L.; Hamid, Y.; Gurajala, H.K.; He, Z.L.; Yang, X.E. Effects of CO2 application and endophytic bacterial inoculation on morphological properties, photosynthetic characteristics and cadmium uptake of two ecotypes of Sedum alfredii Hance. Environ. Sci. Poll. Res. 2019, 26, 1809–1820. [Google Scholar] [CrossRef] [PubMed]
  32. Wu, Y.N.; Zhong, H.X.; Li, J.B.; Xing, J.H.; Xu, N.; Zou, H.F. Water use efficiency and photosynthesis of Calamagrostis angustifolia leaves under drought stress through CO2 concentration increase. J. Plant Interact. 2022, 17, 60–74. [Google Scholar] [CrossRef]
  33. Shuang, H.; Ning, T.; Jiang, H.X.; Yang, L.T.; Li, Y.; Chen, L.S. CO2 assimilation, photosystem II photochemistry, carbohydrate metabolism and antioxidant system of citrus leaves in response to boron stress. Plant Sci. 2009, 176, 143–153. [Google Scholar]
  34. Shi, Y.; Liu, Y.Q.; Li, H.Y.; Pei, H.P.; Ju, X.H. Phytochelatins formation kinetics and Cd-induced growth inhibition in Lolium perenne L. at elevated CO2 level under Cd stress. Environ. Sci. Poll. Res. 2021, 28, 35751–35763. [Google Scholar] [CrossRef]
  35. Cohen, I.; Halpern, M.; Yermiyahu, U.; Bar-Tal, A.; Gendler, T.; Rachmilevitch, S. CO2 and nitrogen interaction alters root anatomy, morphology, nitrogen partitioning and photosynthetic acclimation of tomato plants. Planta 2019, 250, 1423–1432. [Google Scholar] [CrossRef] [PubMed]
  36. Habeeb, T.H.; Abdel-Mawgoud, M.; Yehia, R.S.; Khalil, A.M.A.; Saleh, A.; Abdelgawad, H. Interactive impact of arbuscular mycorrhizal fungi and elevated CO2 on growth and functional food value of Thymus vulgare. J. Fung. 2020, 6, 168. [Google Scholar] [CrossRef] [PubMed]
  37. Wang, X.H.; Li, Y.; Lu, H.; Wang, S. Combined effects of elevated temperature and CO2 concentration on Cd and Zn accumulation dynamics in Triticum aestivum L. J. Environ. Sci. 2016, 47, 109–119. [Google Scholar] [CrossRef]
  38. Balabanova, D.A.; Paunov, M.; Goltsev, V.; Cuypers, A.; Vangronsveld, J.; Vassilev, A. Photosynthetic performance of the imidazolinone resistant sunflower exposed to single and combined treatment by the herbicide imazamox and an amino acid extract. Front. Plant Sci. 2016, 7, 1559. [Google Scholar] [CrossRef]
Figure 1. The interaction of high CO2 concentration and Cd stress with the growth characteristics of hazelnut leaves. (A): Fresh weight; (B): Dry weight; (C): Leaf area; (D): Leaf length; (E): Leaf width. CK + CO2: CK Under 750 μmol·mol−1 CO2 concentrations; Cd + CO2: Cd stress + 750 μmol·mol−1 CO2 concentrations; Cd: Cd stress. Note: Data in the figure are the mean ± SE; values followed by different lowercase letters indicate a significant difference (p < 0.05).
Forests 14 01791 g001
Figure 2. The interaction of high CO2 concentration and Cd stress with the photosynthetic gas exchange parameters of hazelnut leaves. (A): Net photosynthetic rate (Pn); (B): Stomatal conductance (Gs); (C): Transpiration rate (Tr); (D): Intercellular CO2 concentration (Ci). Note: Data in the figure are the mean ± SE; values followed by different lowercase letters indicate a significant difference (p < 0.05).
Forests 14 01791 g002
Figure 3. The interaction of high CO2 concentration and Cd stress with the characteristic points (O and P). Parameters of hazelnut leaves. (A): Minimal recorded fluorescence intensity; (B): Maximal recorded fluorescence intensity. CK: Under 370 μmol·mol−1 CO2 concentrations. Note: Data in the figure are the mean ± SE; values followed by different lowercase letters indicate a significant difference (p < 0.05).
Forests 14 01791 g003
Figure 4. The interaction of high CO2 concentration and Cd stress with PSII photochemical efficiency. Parameters of hazelnut leaves. PItotal: electron flux to the final PSI electron acceptors, i.e., of both PSII and PSI (A); PIABS: PSII based on absorption (B); Fv/Fm: the maximum photochemical efficiency of PSII (C). Note: Data in the figure are the mean ± SE; values followed by different lowercase letters indicate a significant difference (p < 0.05).
Forests 14 01791 g004
Figure 5. The interaction of high CO2 concentration and Cd stress with relative variable fluorescence VJ (A), relative variable fluorescence VK (B), and variable fluorescence VL (C) of hazelnut leaves. Note: Data in the figure are the mean ± SE; values followed by different lowercase letters indicate a significant difference (p < 0.05).
Forests 14 01791 g005
Figure 6. Effects of high CO2 concentration, Cd stress, and their interaction on energy distribution per unit of reaction center and per unit area of hazelnut leaves. Note: Data in the figure are the mean ± SE; values followed by different lowercase letters indicate a significant difference (p < 0.05).
Forests 14 01791 g006
Disclaimer/Publisher’s Note: The statements, opinions and data contained in all publications are solely those of the individual author(s) and contributor(s) and not of MDPI and/or the editor(s). MDPI and/or the editor(s) disclaim responsibility for any injury to people or property resulting from any ideas, methods, instructions or products referred to in the content.

