Article

Analysis of Slope Stability with Different Vegetation Types under the Influence of Rainfall

1
Zijin College of Geology and Mining, Fuzhou University, Fuzhou 350108, China
2
College of Environment & Safety Engineering, Fuzhou University, Fuzhou 350108, China
*
Author to whom correspondence should be addressed.
Forests 2023, 14(9), 1865; https://doi.org/10.3390/f14091865
Submission received: 3 August 2023 / Revised: 7 September 2023 / Accepted: 11 September 2023 / Published: 13 September 2023
(This article belongs to the Section Forest Hydrology)

Abstract

:
Rainfall-prone shallow landslides account for one-fifth of the global land area, and rainfall is critical to the mechanics and hydrology of shallow slopes. In typical geological disaster-prone areas, the hydrodynamic responses of slopes with different vegetation types under rainfall conditions require further study. The purpose of this study was to analyze the hydraulic stability of soils with different vegetation types under rainfall conditions and their effects on slope stability. Thus, the soil–water characteristic curves and water-stable aggregate characteristics of soils with three vegetation types were analyzed. A two-dimensional finite element model was used to simulate the slope stability of extreme rainfall environments with different rainfall durations. The results showed that the matric suction of soil with trees was less affected by rainfall with a better stability of water-stable aggregates than that of soil with shrubs and grass. The plastic strain cloud map showed that the maximum plastic strain occurred at the toe of the slope. In addition, the potential slip depth of slopes with trees was smaller than that of slopes with shrubs and grass. Under the two rainfall durations, the factor of safety (FoS) of slopes with trees changed by 0.06, whereas that of slopes with shrubs and grass changed by 0.1. The findings of this study provide valuable insights into changes in the stability of slopes with different vegetation types under varying rainfall conditions. It is of great significance to provide a scientific basis for the application of ecological measures in the prevention and control of mountain disasters and guide the implementation of appropriate land management measures.

1. Introduction

Shallow landslides are characterized by a more frequent occurrence and a wide distribution, which is one of the problems that has garnered attention in the field of engineering construction [1]. Plants can prevent shallow landslides and soil erosion, provide green environmental protection, are a low investment, have good ecological benefits, and have been widely used in slope protection projects [2]. Shallow landslides susceptible to rainfall account for nearly one-fifth of the global land area [3]. Generally, the slopes of different vegetation types are greatly affected by soil moisture. Vegetation affects many factors, such as soil and hydraulic properties, structure, and the initial state of the slopes. Thus, the failure of slopes with vegetation, evident from the occurrence of landslides, is the result of a more complex hydromechanical coupling process, in contrast to when they occur on a bare slope [4].
Shallow landslides are usually triggered by heavy rainfall, and the thickness of landslides affected by rainfall are usually less than 2 m [5]. Soils on affected shallow slopes are often unsaturated before rainfall occurs. Following rainfall, the rapid increase in soil pore water pressure and the development of positive pore pressure are the most important causes of shallow landslides [6]. When the soil moisture content is high, the matric suction between air, water, and soil particles is significantly reduced, resulting in the loss of shear resistance and ultimately slope failure [7]. Plants can improve soil matric suction through their own transpiration, thereby enhancing soil shear strength [8]. This increase in soil strength caused by plant-induced changes in soil moisture is called hydrological reinforcement [9]. Different vegetation types respond differently to changes in soil moisture, and the resulting hydrological enhancements also differ [10,11].
Present research on plant-stabilized slopes, mainly focus on mechanical reinforcements, and their effects on the root system, which mainly depend on the tensile strength to improve the shear strength of the soil [12,13,14,15]. To quantify the shear strength of root soil, researchers have carried out root tensile [16,17] and in situ shear tests of soil [18], and successively proposed the Wu–Waldron [19], fiber bundle [20], root bundle [21], and other mechanical models, experimentally and theoretically, to measure the shear resistance of root soil intensity. These studies showed that the root system significantly improved the shear strength of the soil. Based on mechanical tests and theoretical models, many researchers have investigated the mechanical reinforcement effect of plant roots on slopes. These results show that plant roots can effectively improve slope stability through mechanical reinforcement.
Plants not only strengthen the slope through mechanical action, but also through hydrological action. At present, there are relatively few studies on the effect of the hydrological reinforcement of plants on slopes. To study the effects of the hydrological reinforcement of plants, researchers have developed different calculation frameworks based on different hydromechanical models [22,23,24]. Arnone, Caracciolo, Noto, Preti, and Bras [22] studied the effects of hydromechanical reinforcement by trees and shrubs using a root topology model. Using these frameworks, they quantified the effects of hydromechanics on the joint reinforcement of slopes and found that combining hydromechanical and mechanical reinforcement simultaneously resulted in a higher factor of safety (FoS) of the slope than only considering the mechanical reinforcement. However, the authors failed to fully explain the effects of the FoS on slopes with different vegetation types under rainfall conditions. Therefore, to better understand hydrological reinforcement and utilize the benefits of plant roots on shallow slopes, the influence of rainfall on the stability of these different slopes must be studied.
Here, to study plant hydrological effects on shallow slopes, we established a numerical model to couple the reinforcement effects of rainfall conditions and solid mechanics on shallow slopes. We then analyzed the hydromechanical parameters to determine the influence of water-stable aggregate parameters on plant slope stability. Finally, a numerical model was used to quantify changes in the safety factor of slopes with different vegetation types under rainfall conditions and investigate the influence of rainfall infiltration on the stability of the slope vegetation slope. Our findings can provide guidance for the hydromechanical reinforcement of shallow slopes with plants.

2. Materials and Methods
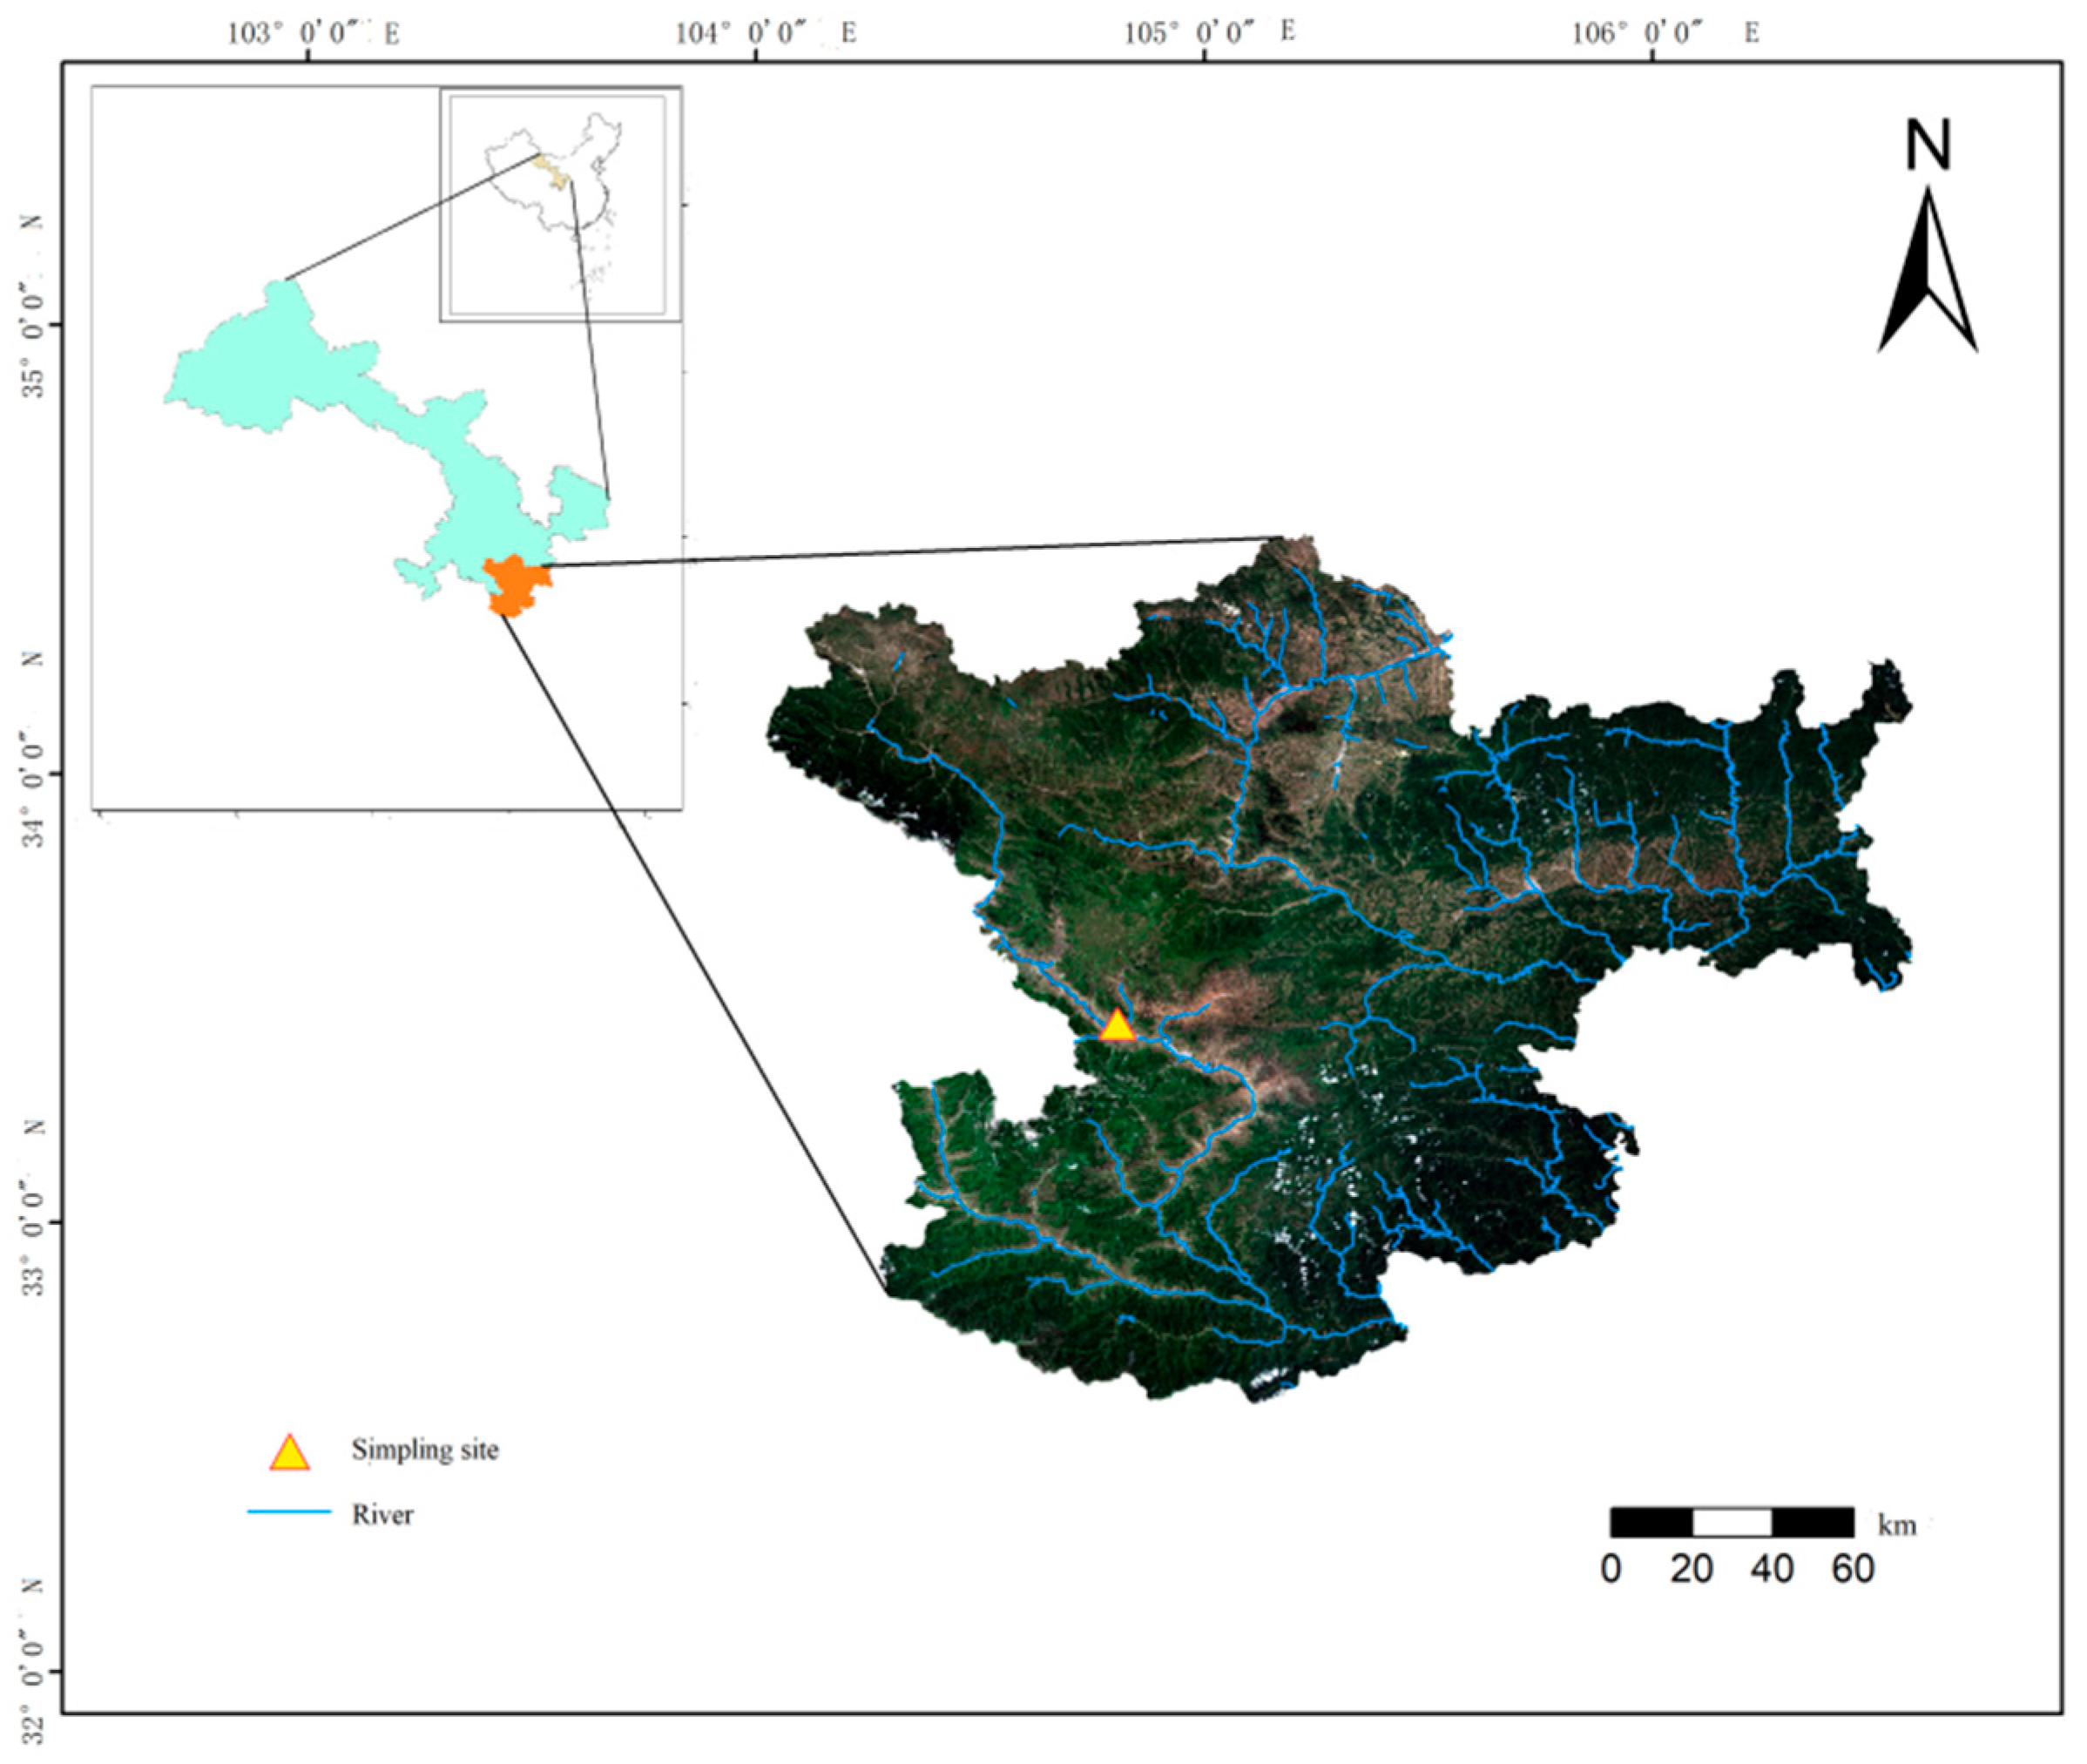
2.1. Study Area

The study area (32°47′~33°42′ N, 104°34′~105°38′ E) is located in the vegetation restoration area along the Bailongjiang River in Longnan City, Gansu Province, China (Figure 1) at the confluence of the Qinba Mountains, the Tibetan Plateau, and the Loess Plateau, and the Bailongjiang River is a tributary of the upper reaches of the Yangtze River, the longest river in Asia [14]. It belongs to the transition zone from subtropical to warm temperate zones and is an important ecological barrier and water conservation area for the Yangtze River. In 2008, large-scale landslides occurred here, and the native vegetation was destroyed, creating bare soil. Under the administration of the local government, the villagers conducted extensive plantation activities on bare soil, by planting trees, shrubs, and grass. The multi-year average temperature is 14.9 °C with a mean annual precipitation between 400 and 900 mm. The soil type in this area is sandy loam [25]. The site descriptions and soil strength characteristics of the study area are summarized in Table 1.

2.2. Field Sampling

Field sampling was conducted from October to November 2019. The sampling site was located on a north-facing slope, 3.2 km long and 2.8 km2 in area. It was divided into three trial zones of 50 m × 30 m. The vegetation types in the test area are trees, shrubs, and grasses, as shown in Figure 2. We collected disturbed soil samples from each plot at a depth of 50 cm using soil pits. Undisturbed soil samples, such as bulk density samples, were collected at each depth using cylinders (10 cm in diameter, 500 cm3 in volume). A total of 108 soil samples were collected, with one half being disturbed soil samples and the other half were undisturbed soil samples (i.e., 3 vegetation types × 3 plots × 4 soil profiles × 3 repetitions).
The physicochemical characteristics of the collected soil samples were analyzed at the Key Laboratory of Western China’s Environment System (Ministry of Education, China) using standard analytical procedures, which are summarized in Table 2.

2.3. Laboratory Analyses

Soil particle size was measured using a laser grain-size analyzer [26]. The mineralogy in the soil was measured using an XRF spectrometer [27]. The composition of the water-stable aggregates was measured using wet sieving [28,29]. The soil–water characteristic curve (SWCC) was described using the Van Genuchten model [30], and the model was fitted to the data [31] and measured using tensiometers (UMS® T5, GmbH München Art. No. T5) (Figure 3a):
θ = θ r + ( θ s θ r ) [ ( 1 + α h ) n ] m
where θ is the volumetric soil moisture; θr and θs are the residual volume soil moisture and saturated soil moisture, respectively; α, n, and m (m = 1 − 1/n) are shape parameters; and h is the soil water potential or matric suction (kPa).
α is related to the inlet state of the soil, the parameter n is related to the pore size distribution of the soil, and the parameter m is related to the overall symmetry of the soil characteristic curves. Because our slope model uses the coupling of the solid mechanical properties of the soil with the hydraulic properties, for the hydraulics part, we used the unsaturated infiltration model—the Richards equation model—whereby all the control equations discussed so far assumed that the porous medium is fully saturated, while the Richards equation describes the movement of water in unsaturated soils, and it is necessary to enter these parameters in the model as well.
The permeability coefficient, soil pH, and bulk density were measured using the variable head method (GB/T 50123-2019), a pH electrode (1:2.5, soil/distilled water), and the soil core method [32], respectively. Total porosity was measured following the method described by Klute, et al. [33], and the soil cohesion and internal friction angle were obtained from direct shear tests (GB/T 50123-2019) (Figure 3b). The contribution of matric suction to the soil shear strength is represented by the third component on the right side of Equation (2) [34]:
τ = c + σ u a t a n   φ + ( θ θ r θ s θ r ) u a u w t a n   φ
where τ is the shear strength (kPa), c′ is the effective cohesion (kPa), (σua) is the net normal stress (kPa), σ is the normal stress applied to the soil sample (kPa), ua is the total normal stress (kPa), φ′ is the effective internal friction angle (°), (uauw) is the soil matric suction (kPa), θ is the volumetric soil moisture, θr is the residual volume of soil moisture, and θs is the saturated soil moisture.

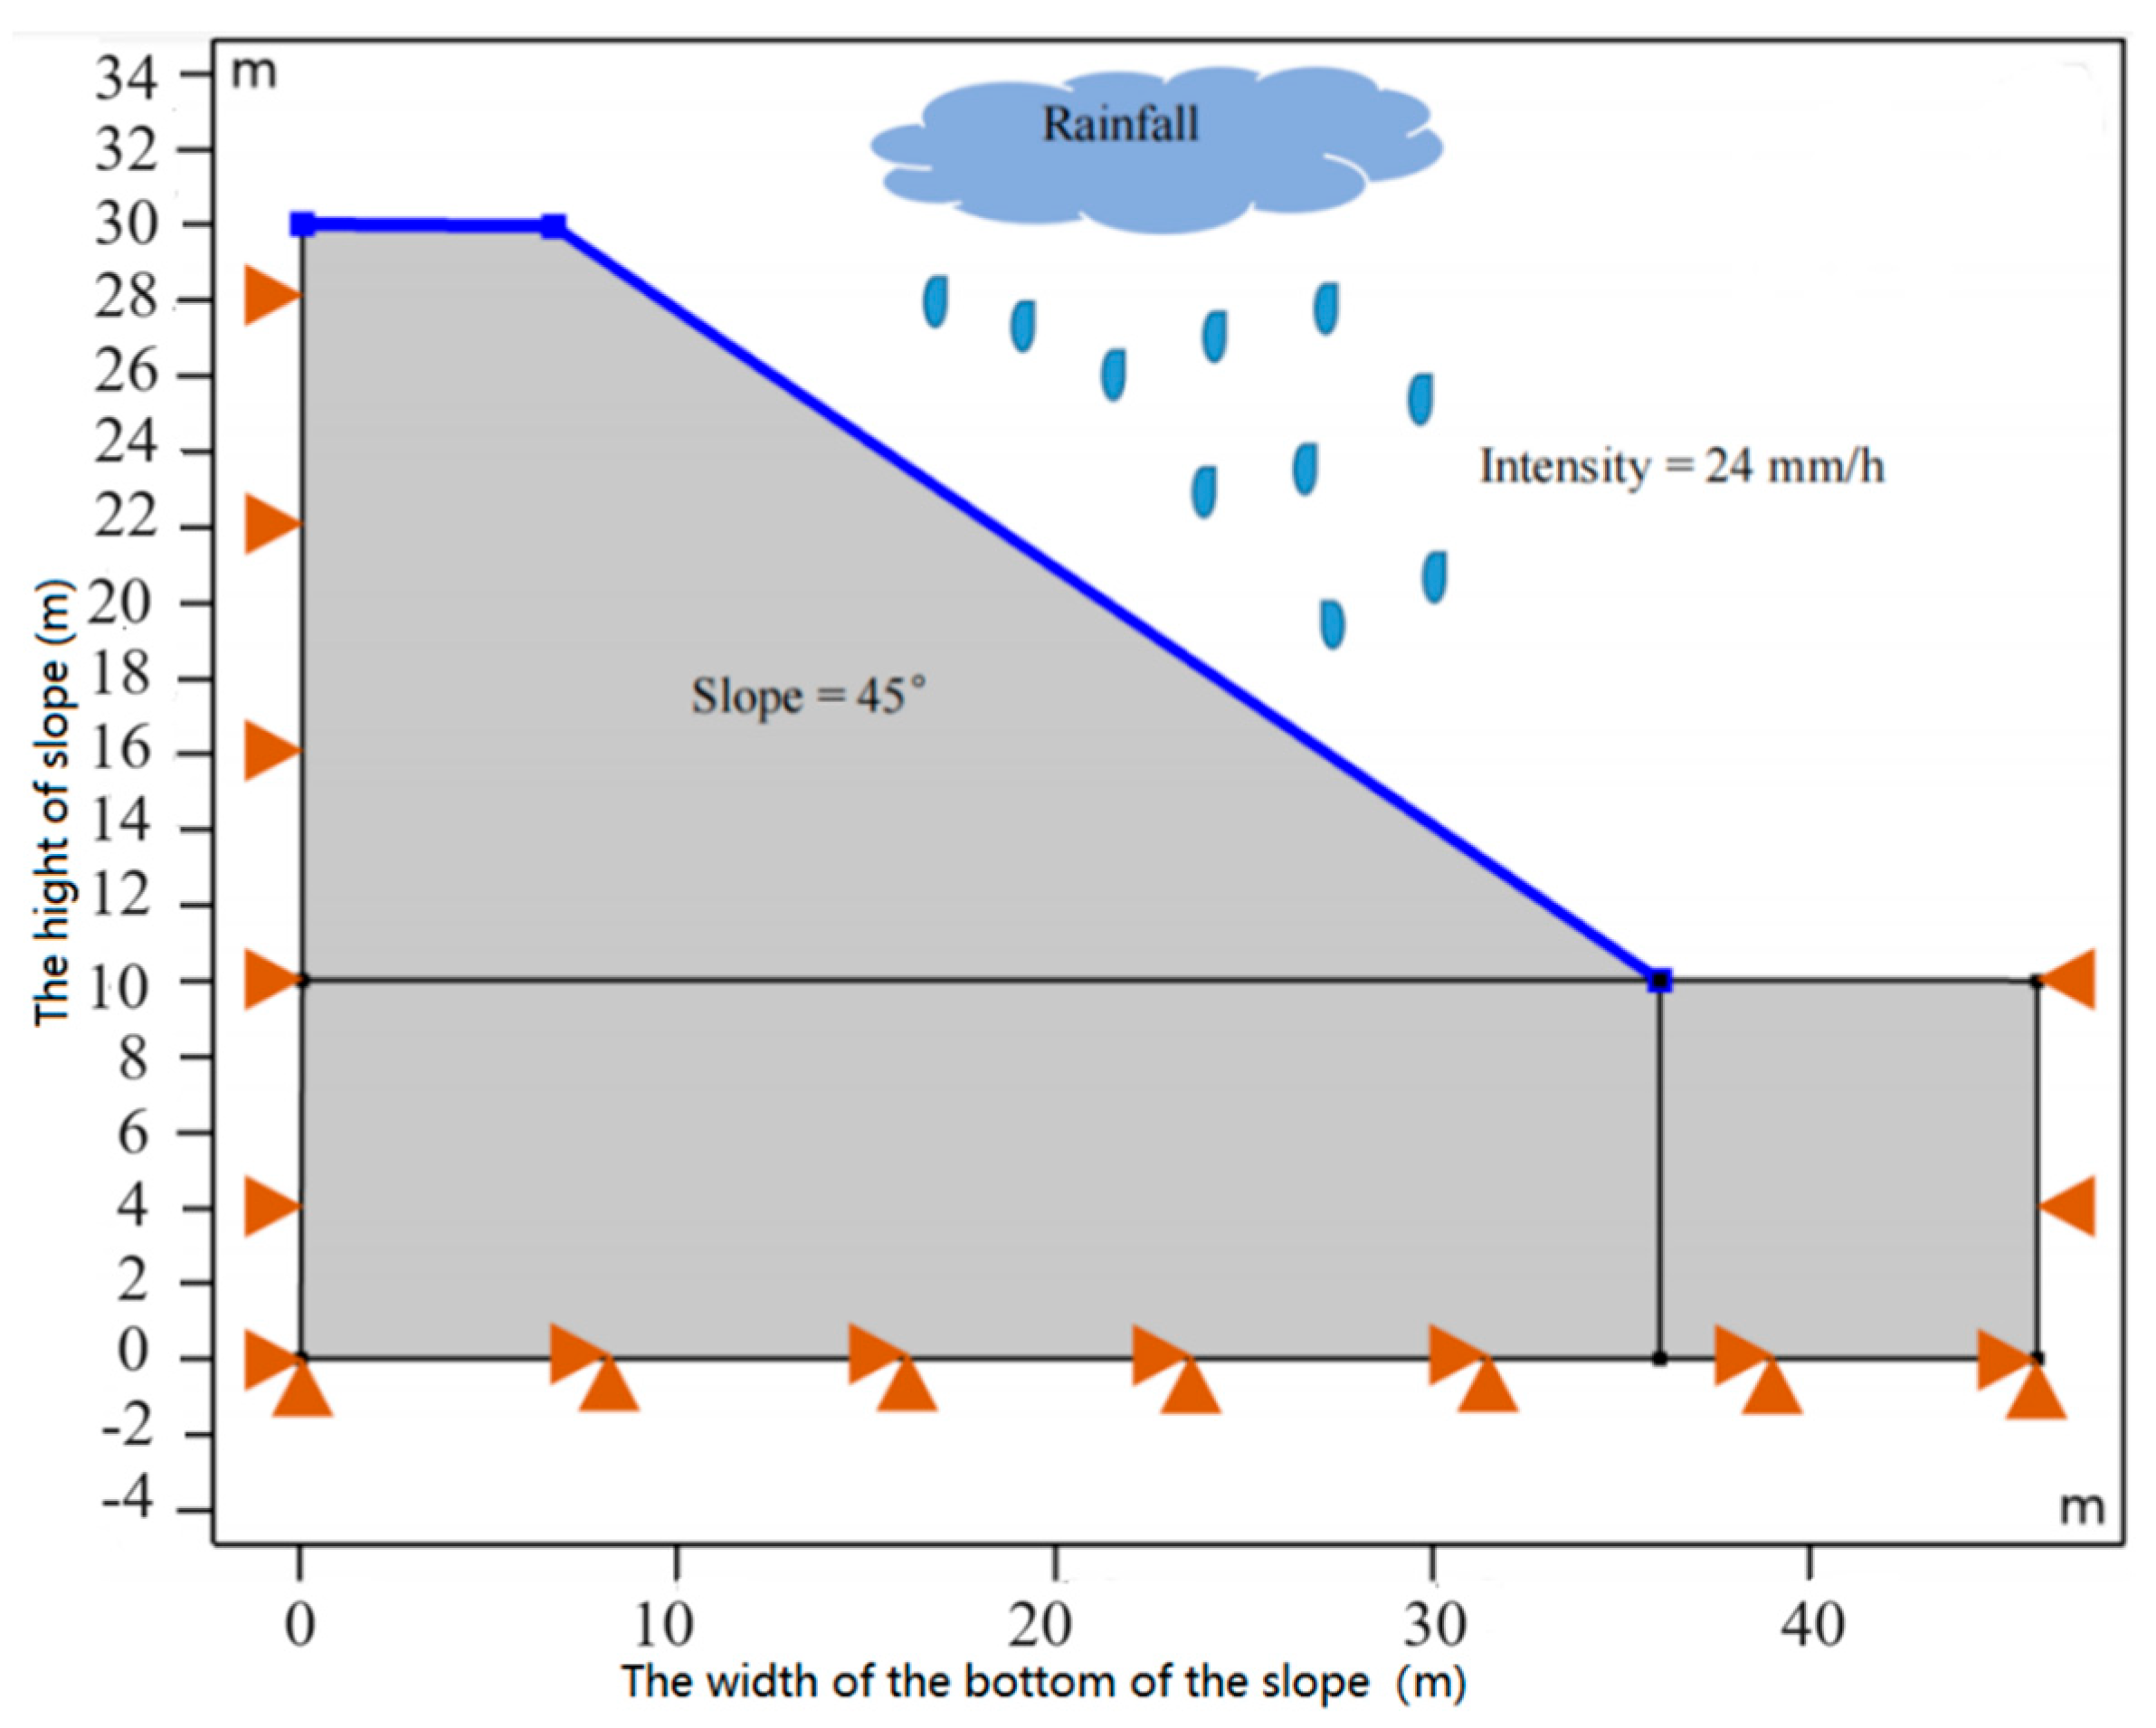
2.4. Slope Stability Modeling

In the two-dimensional finite element model, the internal friction angle (φ) and cohesion (c) were reduced using the strength reduction method (SRM) and the maximum reduction factor was defined as the factor of safety (FoS = c/cr = tan φ/tan φr, where cr is the cohesion used in SRM and φr is the internal friction angle used in SRM). The SRM was applied to analyze the slope stability using COMSOL Multiphysics 5.6 (COMSOL Inc., Sweden). When FoS = 1, the slope stability is critical; when FoS > 1, the slope is stable; when FoS < 1, the slope fails [35]. The size of the geometric model used for the numerical simulation is shown in Figure 4, and the slope was 45°. The boundaries between the bottom and sides of the model were fixed constraint boundaries, the slant and top boundaries were rainfall infiltration boundaries, and the state of the slope was homogeneous. The corresponding material properties were set for slopes with different vegetation types, and the cohesion was defined as the sum of the cohesion provided by the cohesion of the bare soil and the contribution of matric suction. Only gravity loads were considered for the entire slope.

2.5. Statistical Analysis

Descriptive statistics of soil strength parameters and soil physicochemical properties were calculated and a single factor analysis of variance (ANOVA, p < 0.05) was used to study the effects of vegetation type on soil aggregates. All tests were performed using the SPSS software (v 25; SPSS Inc., Chicago, IL, USA). The SWCC was obtained by the Van Genuchten model; fitting was performed using RETC data analysis software(U.S. Salinity Laboratory, USDA, ARS, Riverside, CA, USA). The data files were uploaded to the RETC data analysis software in RET format.

3. Results

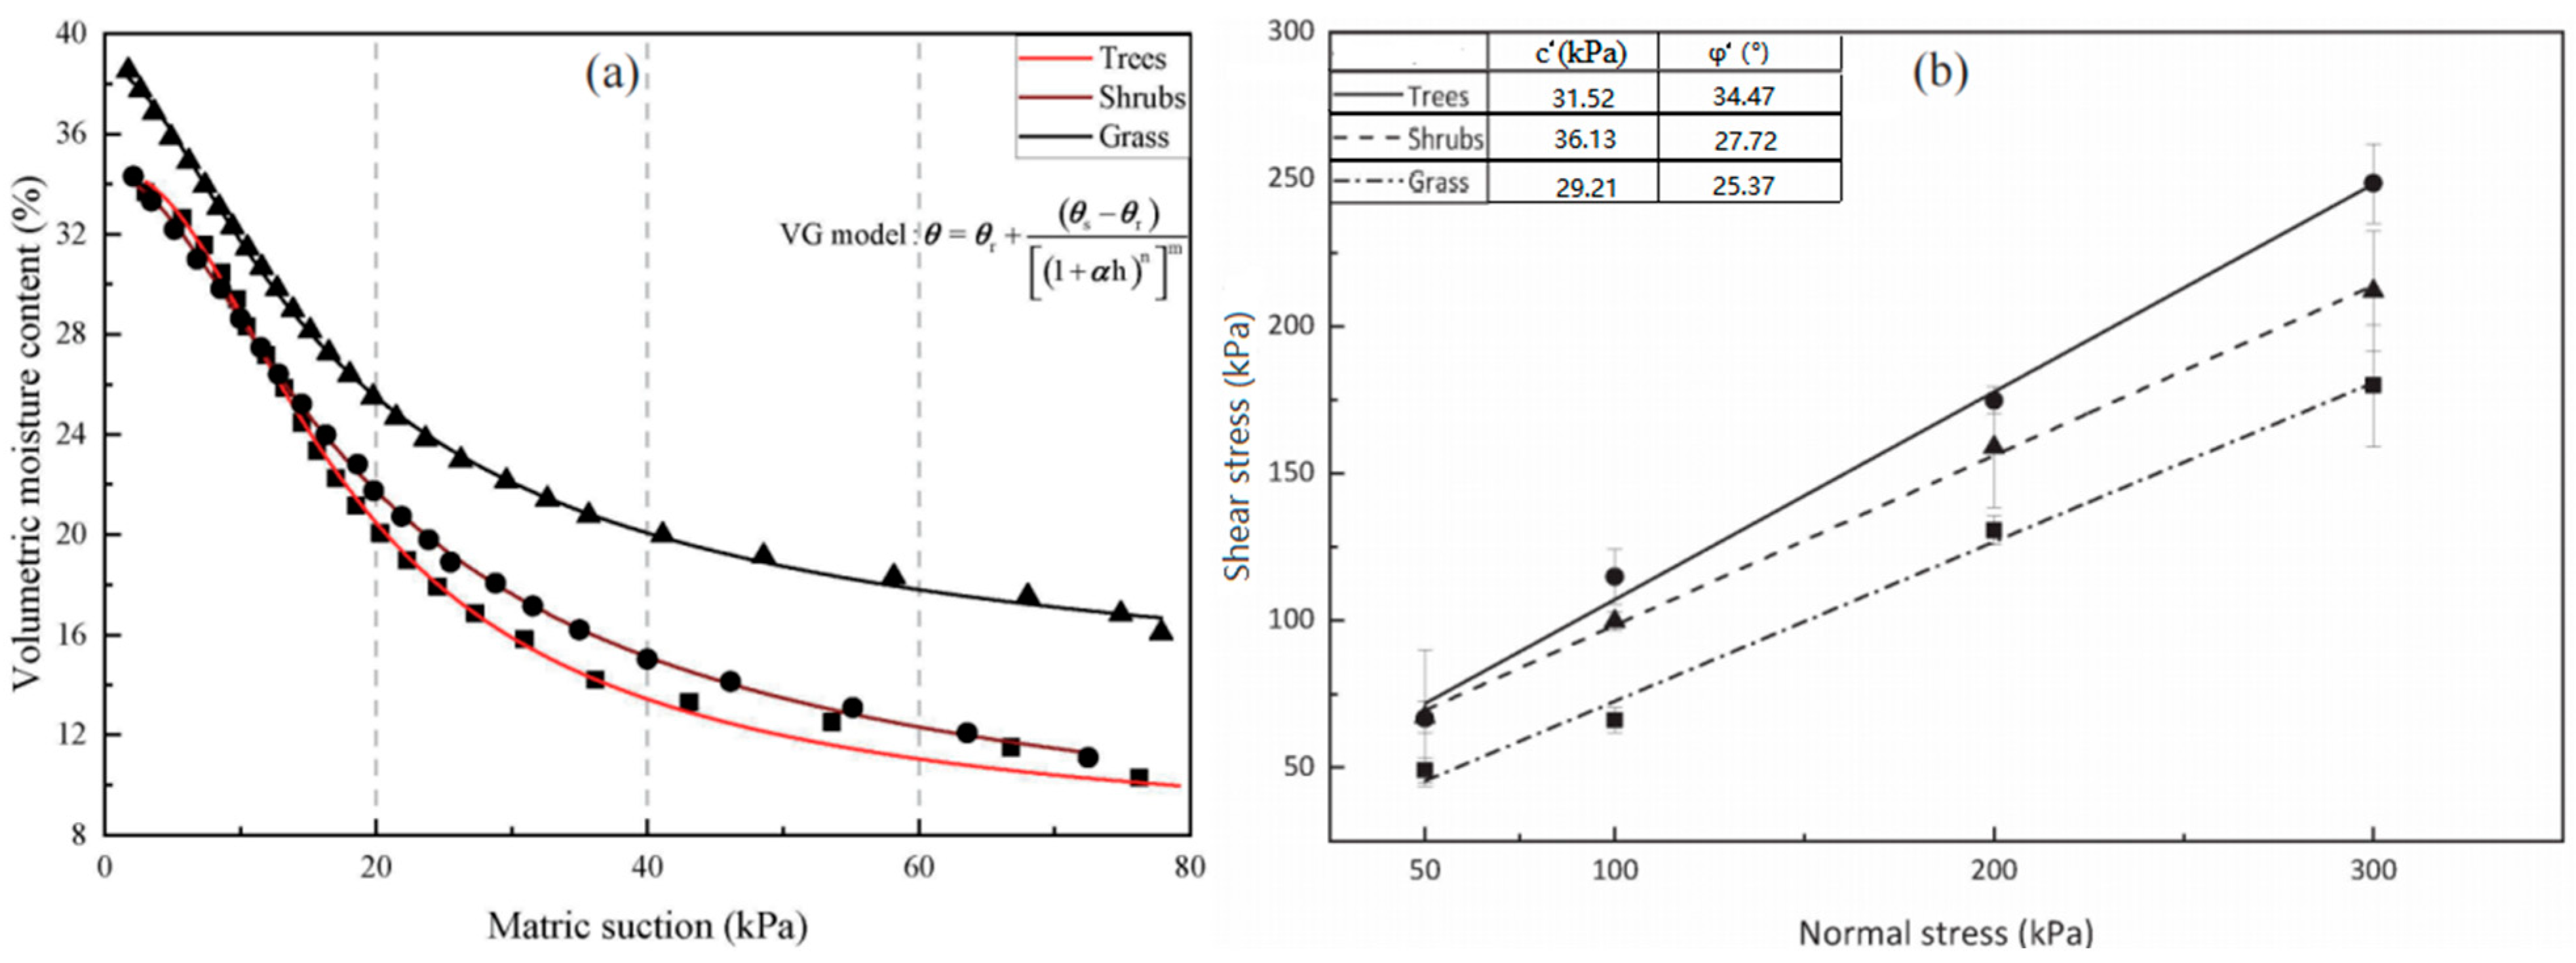
3.1. Soil Properties

In this study, raw data for the correspondence between soil moisture and matric suction were determined using T5 tensiometers [36]. These data were fitted to SWCC using the Van Genuchten model and the results are shown in Figure 5a [30]. The SWCC is the curve of the corresponding relationship between soil moisture and matric suction. The soil drying and wetness curves are two measurement methods for the soil–water characteristic curve; the drying curve was chosen for this study. When the volumetric water content of soil decreased from 28% to 20%, the increase in range in the matric suction of trees for soil was the smallest among the changes in the matric suction of soils for the three vegetation types. When the variation range of matric suction was the same, the soil of trees had the largest variation in volumetric water content among the three types of soils (Figure 5a). Among the three Mohr–Coulomb damage envelopes, the slope of the envelope of soil planted with trees was the largest, that is, the internal friction angle of the soil for trees was the largest. Under the four normal stress conditions (50, 100, 200, and 300 kPa), the shear strength of the soil for trees was always greater than that of soil for shrubs, which was greater than that of soil for grass (Figure 5b). Among the soils with different vegetation types, the soils planted with trees had the highest organic carbon content, total porosity, and sand content (Table 2).

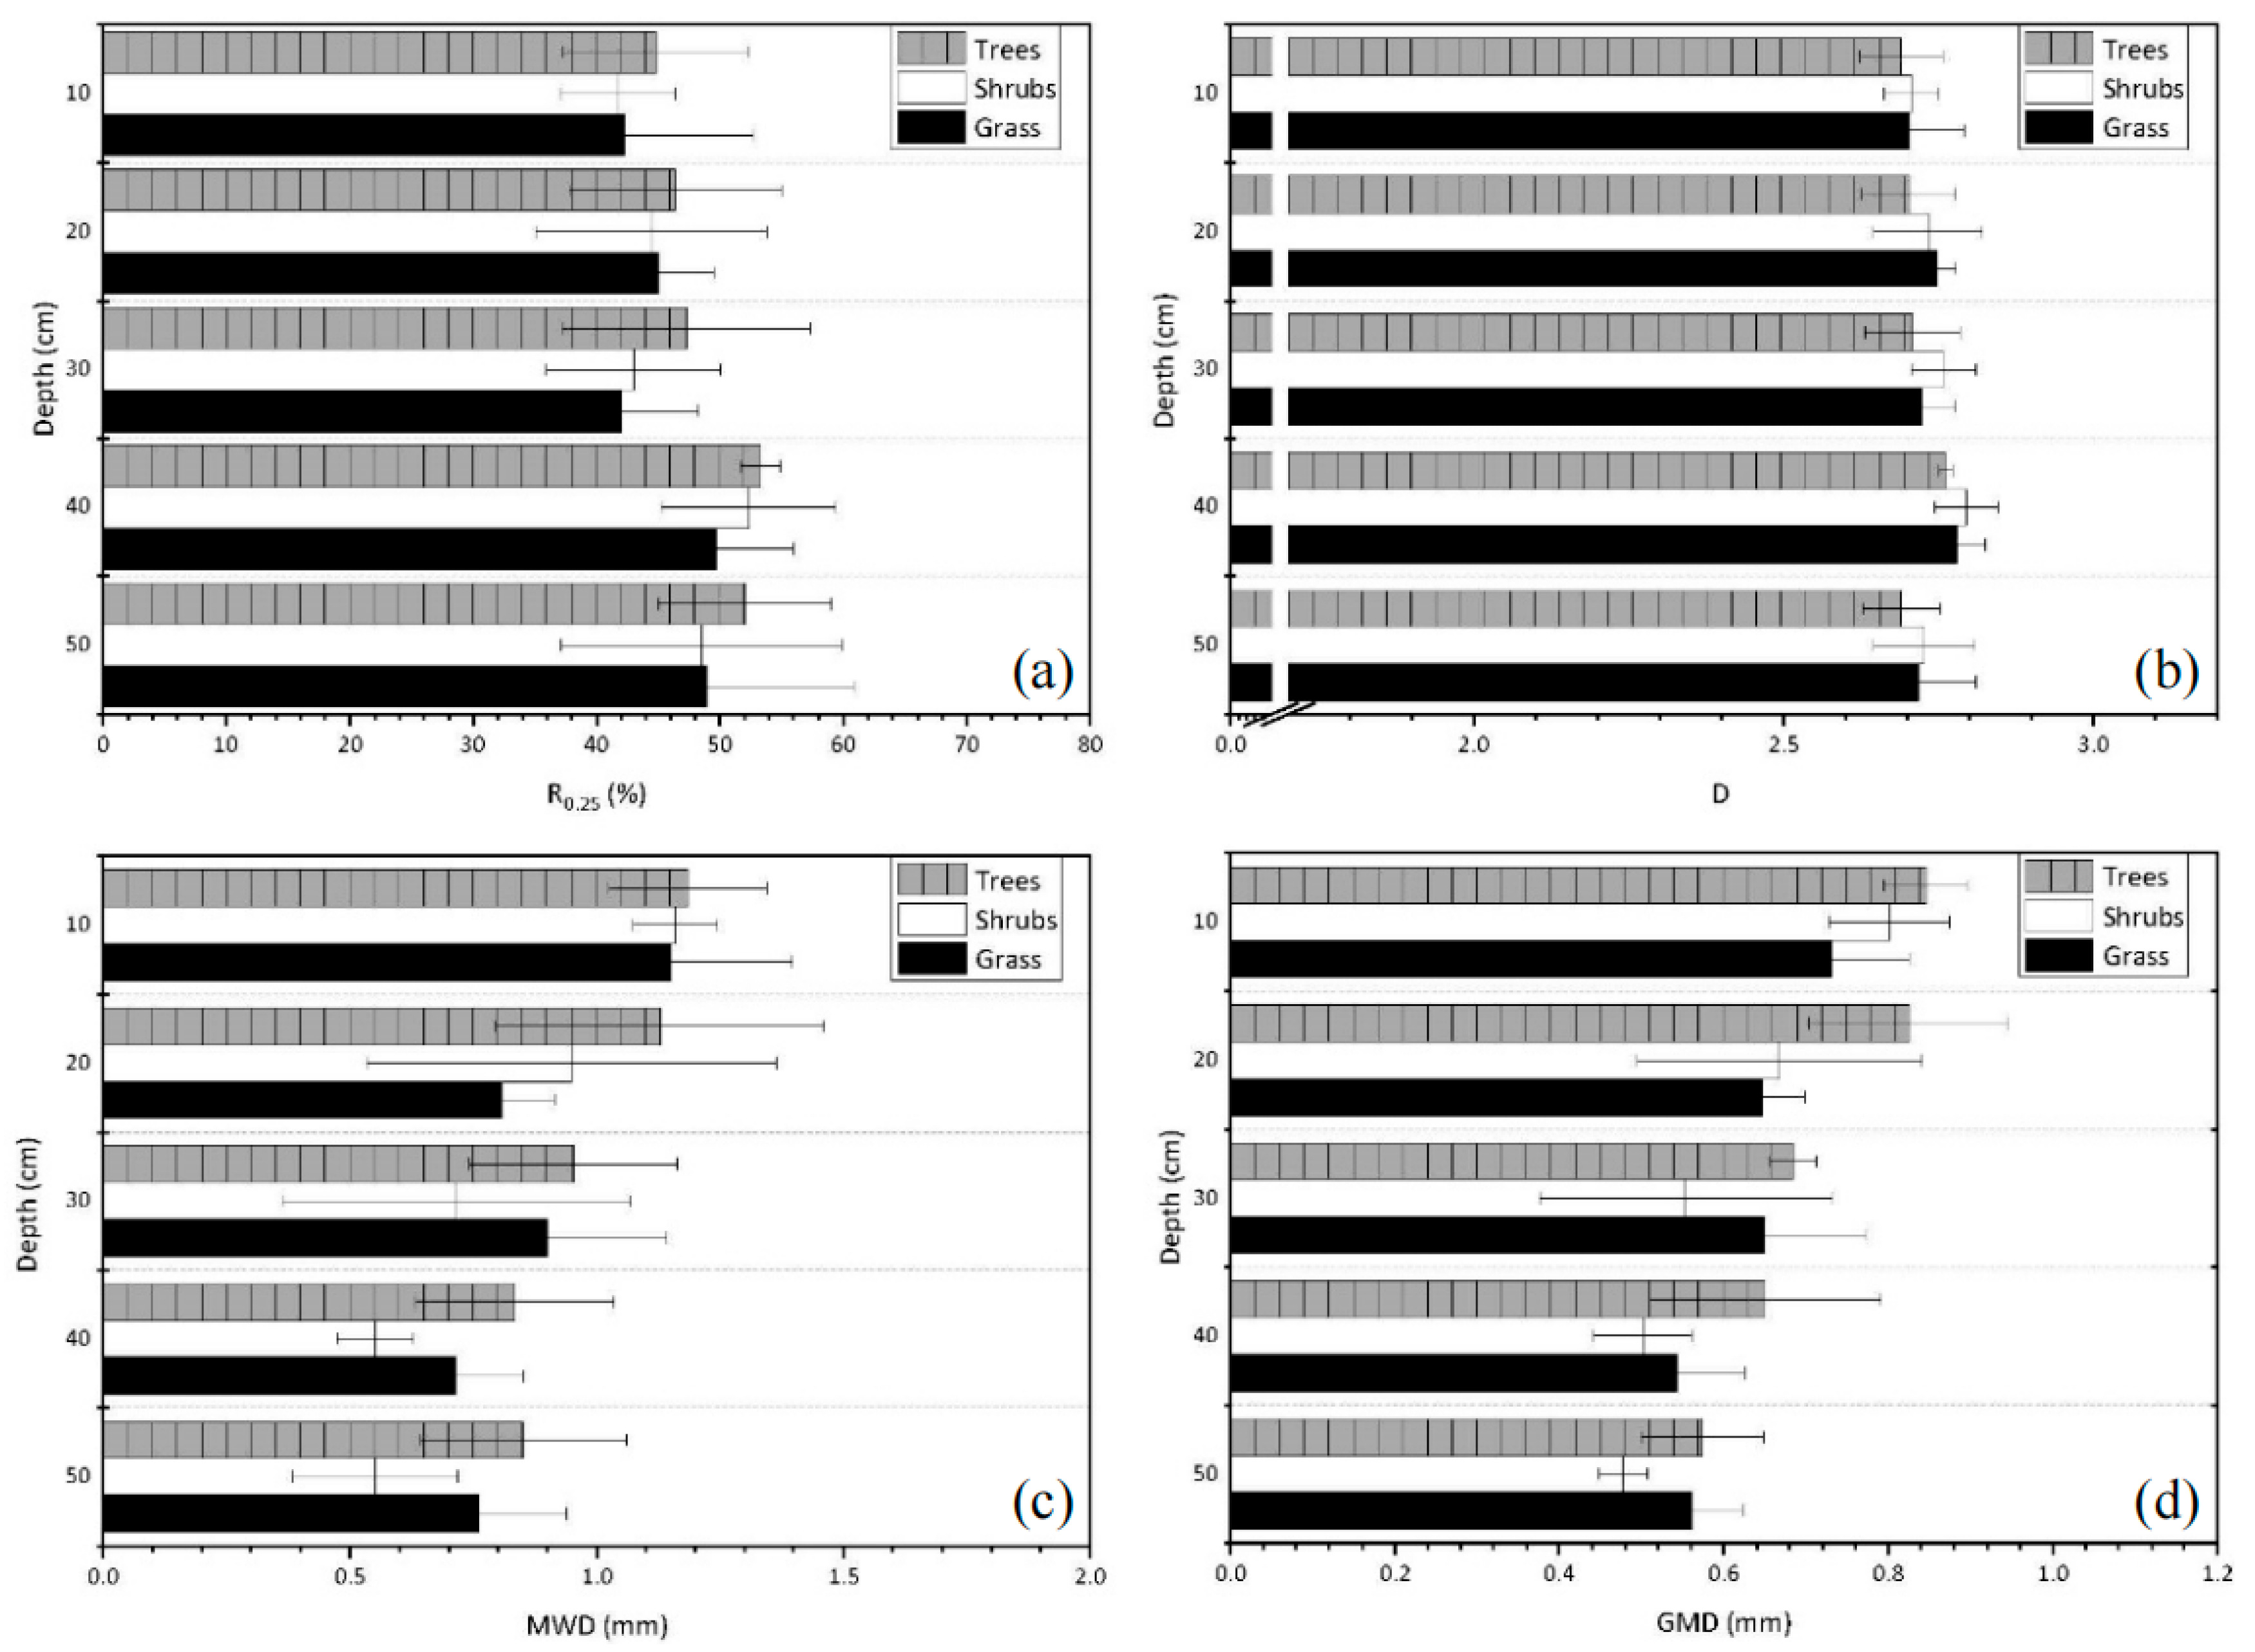
3.2. Water-Stable Aggregates

Stability analyses of soil aggregates are often expressed in terms of large aggregate content (soil particle diameter > 0.25 mm, R0.25), mean weight diameter (MWD), geometric mean diameter (GMD), and aggregate dimensionality coefficients (D), which are calculated using Equations (3)–(6). In soil hydromechanics, the composition of R0.25 (water-stable aggregate diameter > 0.25 mm) can be used to analyze the hydraulic stability of soil structure [37]. The greater the content of aggregates (>0.25 mm), the better the stability and distribution of soil aggregates [38]. Among the three vegetation types, the R0.25 of trees and stability of soil aggregates in trees were always greater than that of shrubs and grass (Figure 6a). The fractal dimension (D) of the soil aggregate structure reflects the influence of soil–water stability macroaggregate content on soil stability and structure [39]. The smaller the fractal dimension of the aggregates, the better the soil structure and stability (Figure 6b). The larger the aggregate mean weight (MWD) and geometric mean diameters (GMD), the better the soil structure and stability. The fractal dimension of aggregates shows that the soil with trees was smaller than that with shrubs and grass. However, the MWD and GMD of the soil with trees was larger than those of soil with shrubs and grass (Figure 6c,d). This suggests that the soil structure was most stable when trees were present; therefore, tree planting may reduce the fractal dimension of the soil structure and improve soil aggregate structure:
( 3 D ) l g ( x ¯ i / x m a x ) = l g M ( r < x ¯ i ) M T
R 0.25 = 1 M < 0.25 M T × 100 %
M W D = i n x ¯ i w i / i n w i
G W D = e x p i n w i l n x ¯ i / i n w i
where D is the dimensional coefficient of soil aggregates; x ¯ i  is the average diameter of the particle size (mm);  x m a x  is the average diameter of the largest particle size (mm);  M T  is the total weight of the soil (g);  M ( r < x ¯ i )  is the weight of the soil smaller than the particle size (g).  w i  is the mass percentage (%) of soil particles of each particle size;  M < 0.25  is the weight of soil particles smaller than 0.25 mm (g).

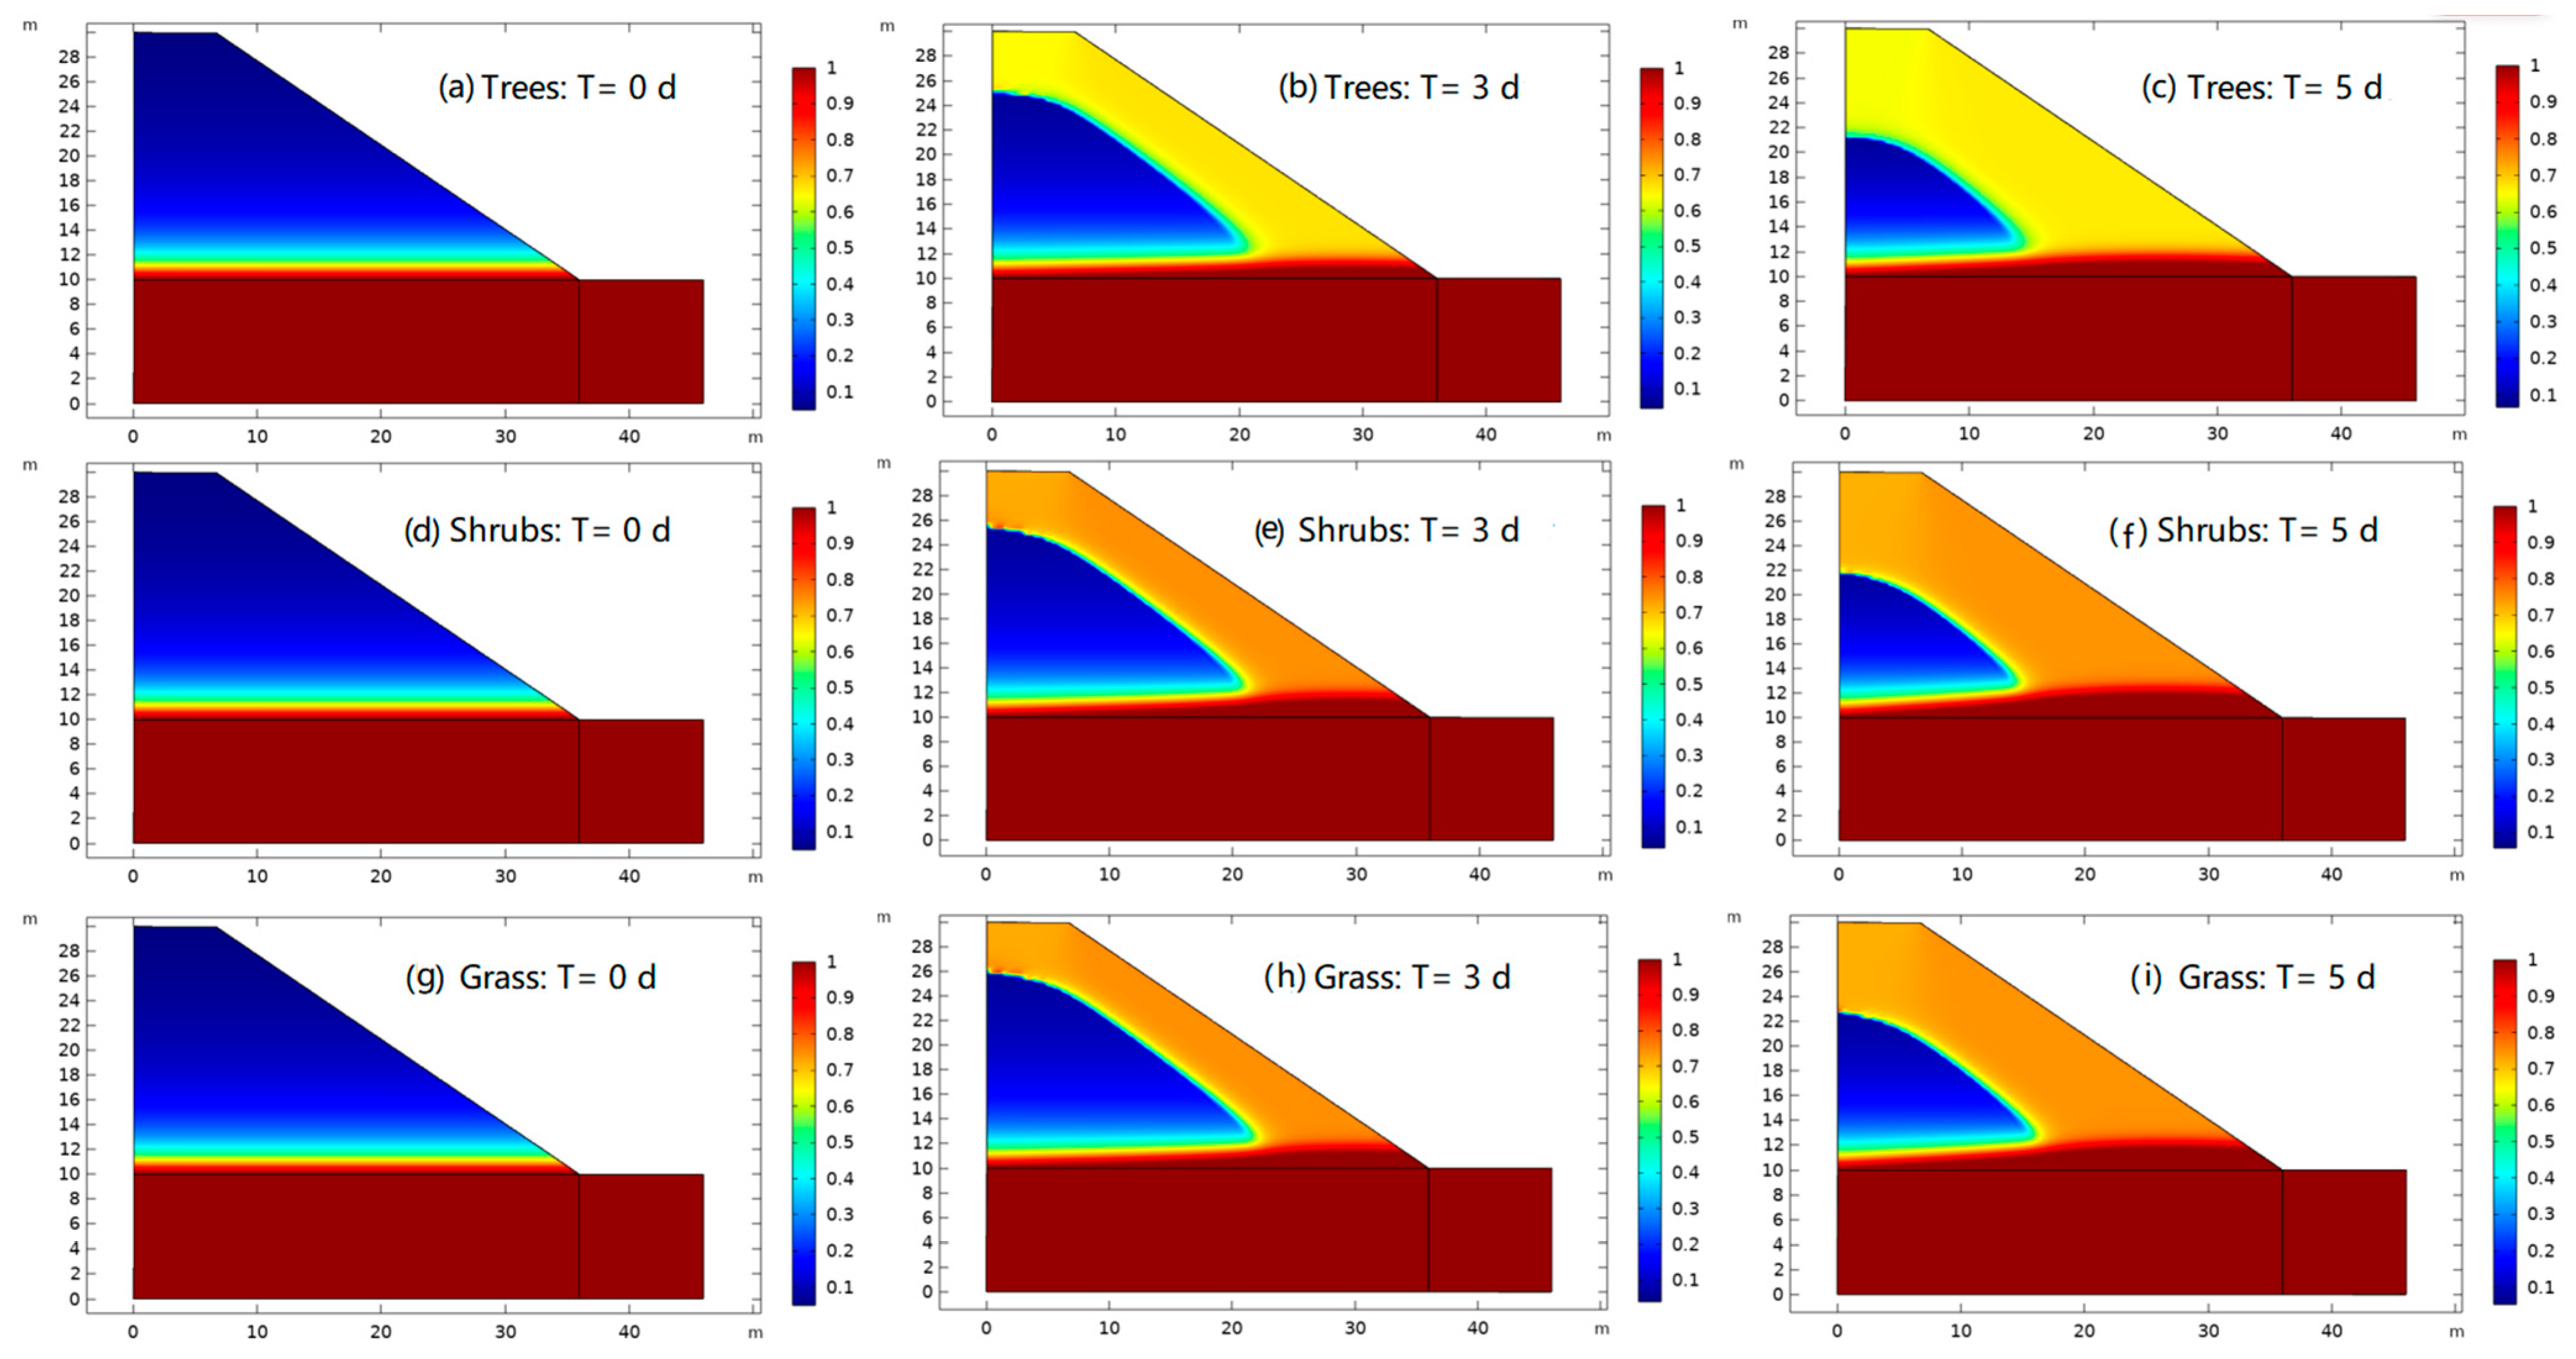
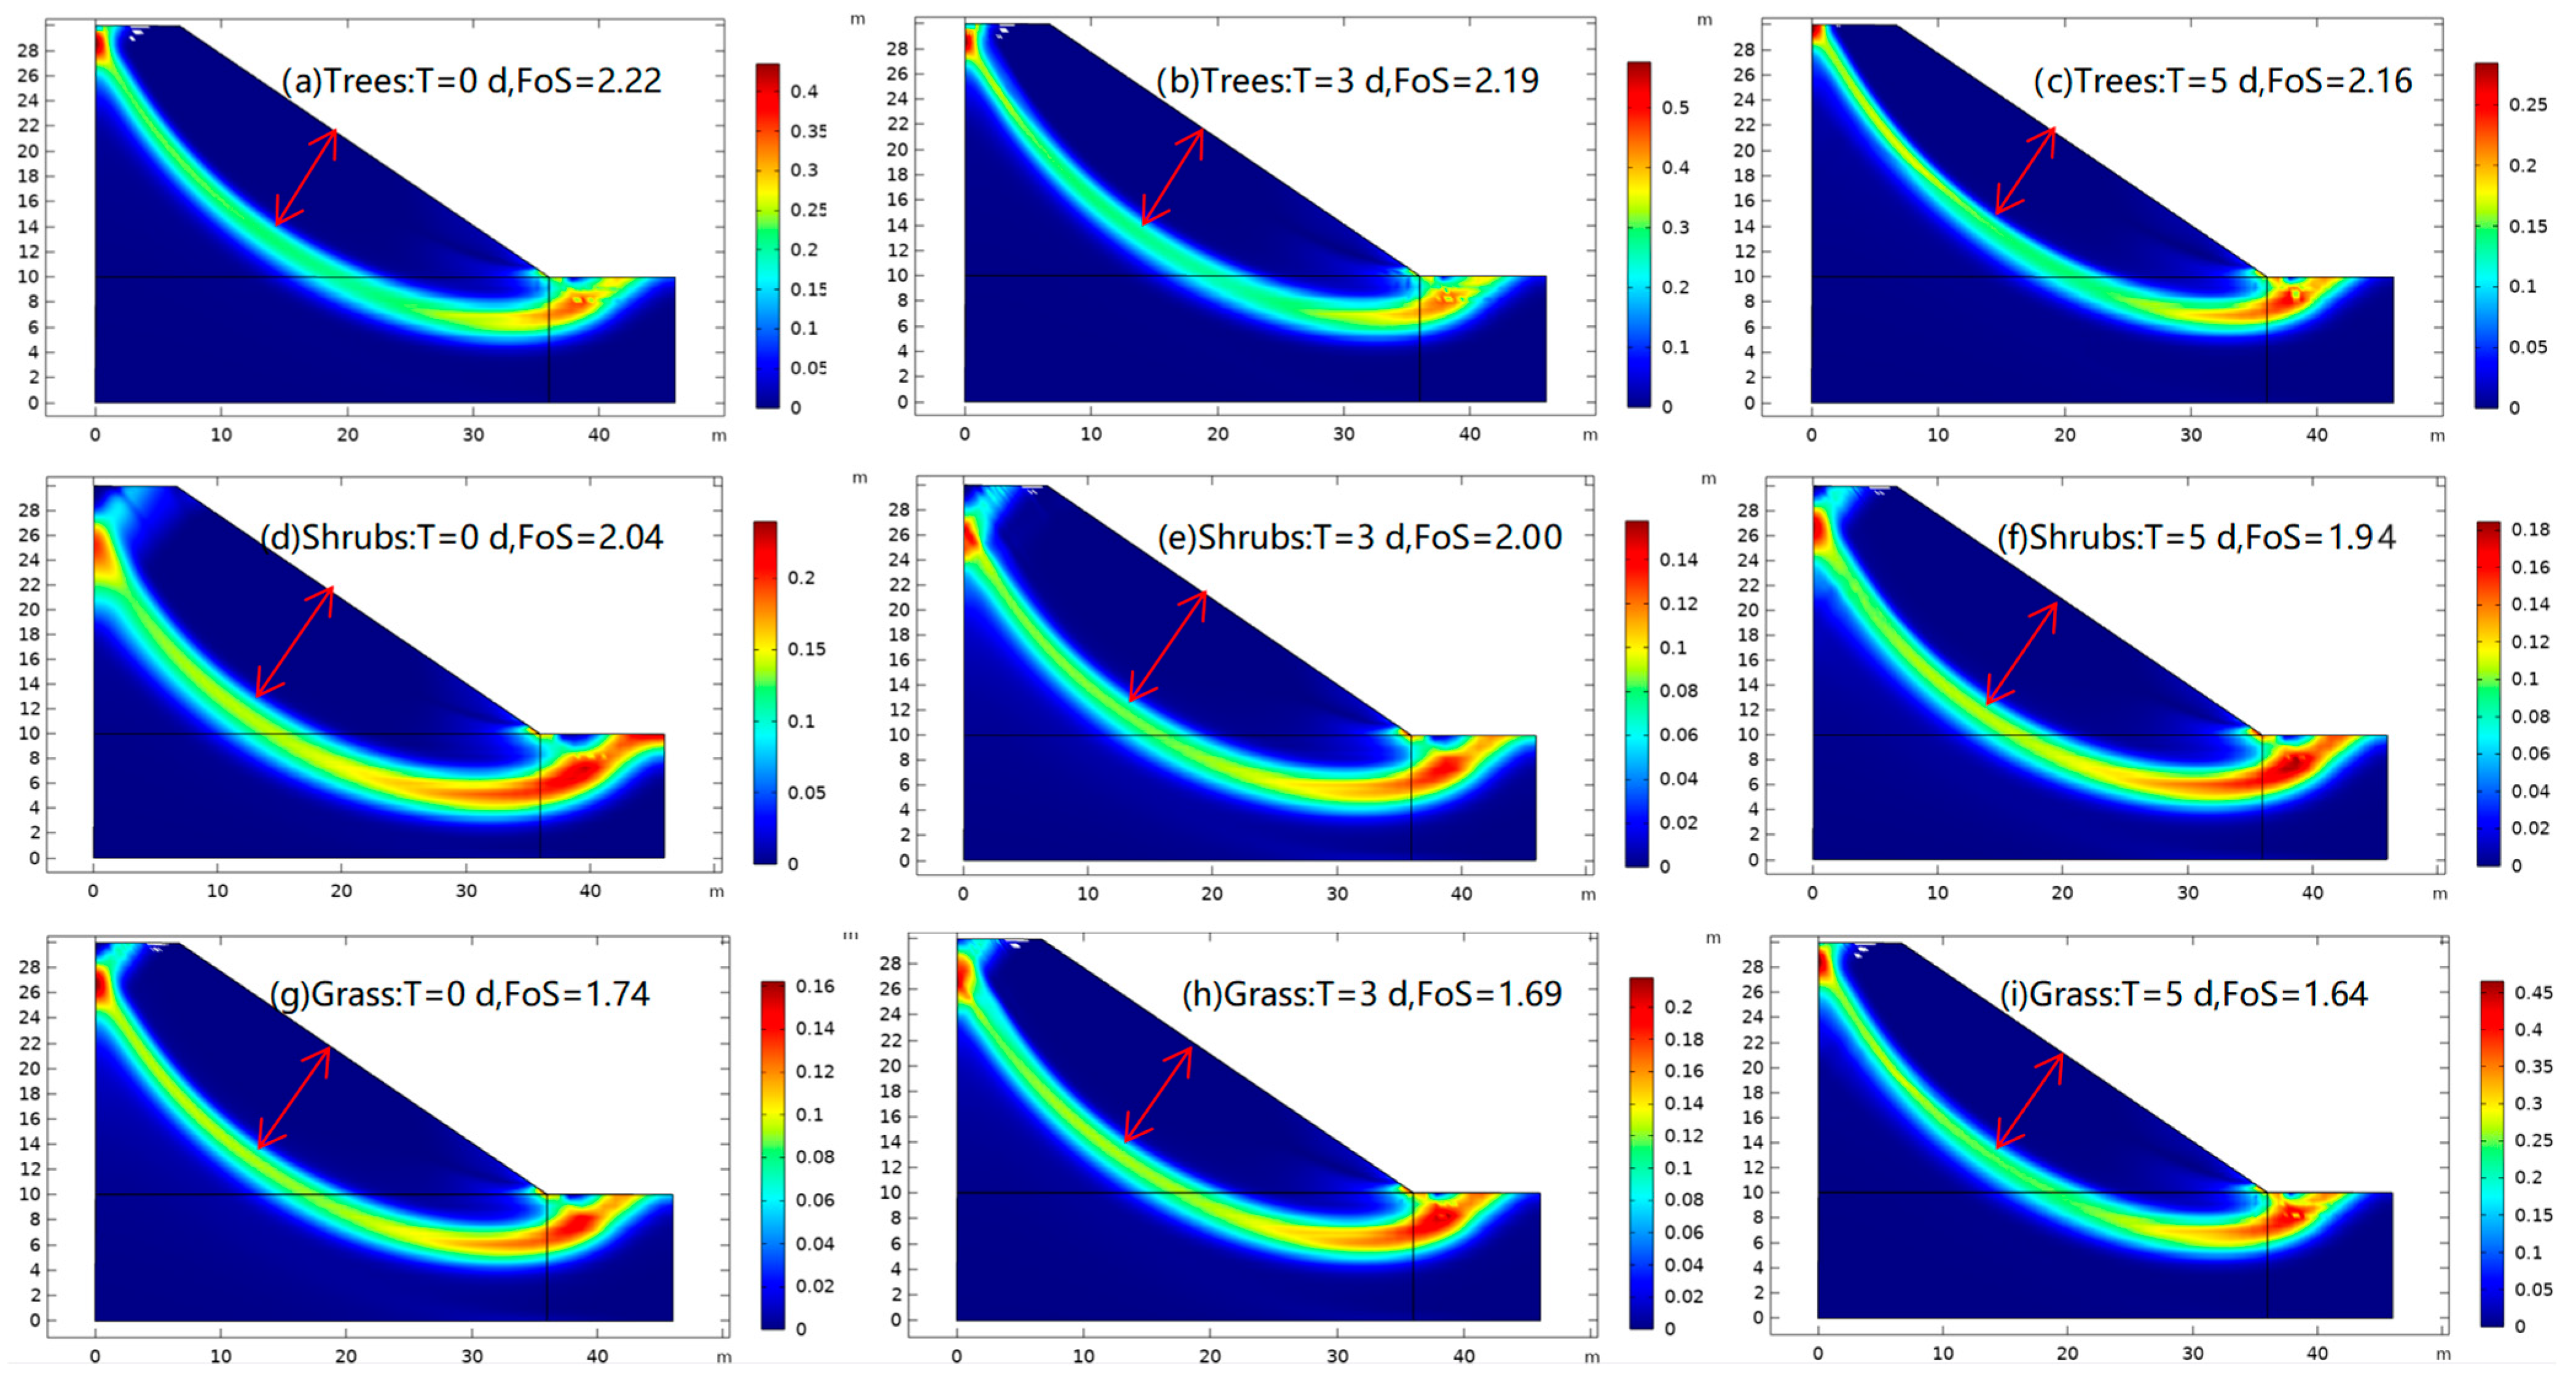
3.3. Slope Stability Analysis under the Influence of Rainfall

The soil mechanical strength parameters were obtained using the direct shear test, and the Van Genuchten model parameters were obtained from the SWCC [30]. These are provided in Table 1. Rainfall simulation for slopes with three vegetation types was performed using COMSOL Multiphysics 5.6 (COMSOL Inc., Sweden). From the distribution of the effective saturation of slopes after rainfall seen in Figure 7, the unsaturated area of the slope decreases with time after rainfall, with trees having the largest unsaturated zone relative to grass and shrubs, and the location of the diving surface being lower than the other two. The increase in the plastic strain represents the position of the critical failure surface and provides the possible failure mechanisms [40]. Figure 8 represents the plastic strain of the slope, with the red areas representing the areas of the greatest plastic strain, where the most severe damage occurred. We considered extreme rainfall conditions (480 mm/d) and different rainfall durations (t = 0 d, t = 5 d) to understand the impact of rainfall on slope stability. Under the mean rainfall intensity, seen from the cloud map (T = 0 d), the FoS of the slope with trees, shrubs, and grass was 2.22, 2.04, and 1.74, respectively. When t = 5 d, the FoS of the slopes of the three vegetation types was reduced. At this time, the FoS of the slope with trees, shrubs, and grass was 2.16, 1.94, and 1.64, respectively, and the FoS of trees decreased by 2.7%, shrubs by 4.9%, and grasses by 5.7%. The plastic zone indicates the potential sliding surface of the slope. The potential sliding surface depth of the slope with trees was smaller than that of the slopes with shrubs and grass.

4. Discussion

4.1. Hydromechanical Characteristics of Soils with Different Vegetation Types

Soil texture is related to the degree of development of the soil parent material, and land use does not affect soil texture [41]. The soil sand content in the study area was high and there was no significant difference between the different vegetation types. The same soil texture eliminates experimental errors caused by it. Therefore, the results were not affected by these factors, thus ensuring the consistency of the experimental conditions.
Matric suction is absent when the soil is completely saturated; however, it increases from near zero to maximum suction as air enters the soil [34]. This pattern was observed in our study, where the matric suction decreased with increasing soil volumetric moisture content (Figure 5a). The increase in the matric suction of the soil with trees was smaller than that of soils with shrubs and grasses. This may be due to the higher porosity of the soil with trees. Matric suction is mainly provided by the negative pressure of water in the soil pores [42]. The dissipation of matric suction is related to apparent cohesion, which dissipates faster in high-porosity soils than in low-porosity soils [42]. Our results showed that the internal friction angles of soils with different vegetation types were significantly different, which is consistent with the variation law of sand content in soils with different vegetation types. The rainfall in the study area was mostly concentrated in August–October. As rainfall increased the soil moisture, matric suction and shear strength considerably reduced, which explains the high frequency of landslides during this period. The probability of landslides on slopes with trees was less than that on slopes with shrubs and grass.

4.2. Effects of Different Vegetation on Water-Stable Aggregates

The soil structure determines slope stability, and rainfall is an important factor that affects soil structure [43]. Rainwater wetting has a disintegrating effect on soil aggregates. When soil aggregates migrate due to wetting, the soil macroaggregates (R0.25) are broken into fine particles, and the content of macroaggregates (R0.25) gradually decreases; consequently, the content of microaggregates gradually increases, and soil erosion resistance is weakened. Our results showed that soil stability first decreased and then stabilized. In our study area, shallow landslides are prone to occur, the soil structure is loose, and the summer rainfall is mostly in the form of heavy rain, so the characteristics of soil aggregates were more likely to change, which in turn affected the soil structure and slope stability. In this study, the fractal dimension of soil aggregates on slopes with trees was smaller than that on slopes with shrubs and grass; however, MWD and GMD were larger on slopes with trees than on the slopes with the other two vegetation types (Figure 6). This suggests that the slopes where trees were planted were favorable for the stabilization of water-stable aggregates probably because of the high organic carbon [44] and silicon content, which are conducive to the formation and stability of aggregates [45].

4.3. Response of Slope Stability with Different Vegetation to Rainfall

The potential failure mechanism of the slope can be observed through a finite-element numerical simulation. After rainfall, the internal water content of the slope increases, the unsaturated zone decreases, and the submerged surface rises as shown in Figure 7. Studies have shown that as the soil water content increases with rainfall, the matrix suction decreases and the hydrostatic pressure increases, the effective stress in the soil decreases, which leads to slope instability [46]. In the soil plastic strain cloud map (Figure 8), the red section represents the location with the largest sliding displacement and high probability of destruction [40]. The comparison of cloud maps revealed that the damaged area on the slopes where trees were planted may be considerably smaller than that on the slopes where shrubs and grass were planted. The sliding body depth of the slopes on which trees were planted was less than that of the slopes on which shrubs and grass were planted. After 5 d of simulated rainfall conditions, the potential sliding surface depth of slopes with trees was smaller than that of slopes with shrubs and grass. The FoS of slopes with the three vegetation types decreased. This is because during rainfall, soil moisture content and saturation increase, while soil matric suction and strength decrease [42,43]. The variation range of the FoS of slopes with trees, shrubs, and grass was 0.06, 0.1, and 0.1, respectively. The variation range of the FoS of slopes with trees among the slopes with three vegetation types was the smallest, indicating that the changes in soil moisture had little effect on the FoS of the slopes with trees. This may be due to a higher water retention and higher saturated water conductivity of trees relative to grassland, due to larger pores resulting from thicker roots, a reduced density of soil (BD), and a higher soil organic carbon content [47]. Kim et al. (2017) investigated the inter-annual and intra-annual variations in the hydrological and mechanical effects of roots under different climates and vegetation types. Trees provided hydrological reinforcement for 121–365 d per y, thereby contributing to an additional FoS of over 0.3 [4]; this explains the hydrological reinforcement and stability of slopes with trees. Thus, in the event of extreme rainfall, slopes with trees are more stable and minimize the occurrence of geological disasters.

5. Conclusions

In this study, we evaluated the effects of the hydraulic characteristics of unsaturated soil and rainfall duration on shallow landslides under different vegetation types. Several disturbed and undisturbed soil samples were collected from the shallow landslide-prone areas of the Bailong River Basin, representing soils with three vegetation types (grass, shrubs, and trees). The small fractal dimension of aggregates in soils with trees contributed to the stability of the soil structure. Rainfall was an important factor that affected the stability of shallow landslides. As the rainfall time increased, the safety factor of the slope decreased. Under the same rainfall conditions, the variation range of the safety factor of the slope with trees was small, indicating that the soil moisture had little influence on the slopes with trees, which were more stable.
Here, by studying the influence of rainfall on the stability of slopes with different vegetation types, we better understand the hydromechanical properties of plant–soil composite materials, which will help to formulate suitable sustainable vegetation utilization measures to prevent shallow landslides.
Our findings are laboratory rather than field-practical tests, and future research is required to better understand the mechanisms underlying the relationship between vegetation and soil properties. Nonetheless, the results of this study emphasize the differences in soil solid mechanical properties and hydraulic properties across vegetation types and indicate the importance of vegetation type on soil stability.

Author Contributions

Software, Y.L.; Investigation, R.D.; Writing—original draft, B.C.; Supervision, W.S. All authors have read and agreed to the published version of the manuscript.

Funding

This research was funded by the National Natural Science Foundation of China (Grant No. 41871198).

Conflicts of Interest

The authors declare no conflict of interest.

References

  1. Keefer, D.K.; Larsen, M.C. Assessing Landslide Hazards. Science 2007, 316, 1136–1138. [Google Scholar] [CrossRef] [PubMed]
  2. Stokes, A.; Douglas, G.B.; Fourcaud, T.; Giadrossich, F.; Gillies, C.; Hubble, T.; Kim, J.H.; Loades, K.W.; Mao, Z.; McIvor, I.R.; et al. Ecological mitigation of hillslope instability: Ten key issues facing researchers and practitioners. Plant Soil 2014, 377, 1–23. [Google Scholar] [CrossRef]
  3. Hong, Y.; Adler, R.; Huffman, G. Use of satellite remote sensing data in the mapping of global landslide susceptibility. Nat. Hazards 2007, 43, 245–256. [Google Scholar] [CrossRef]
  4. Kim, J.H.; Fourcaud, T.; Jourdan, C.; Maeght, J.-L.; Mao, Z.; Metayer, J.; Meylan, L.; Pierret, A.; Rapidel, B.; Roupsard, O.; et al. Vegetation as a driver of temporal variations in slope stability: The impact of hydrological processes. Geophys. Res. Lett. 2017, 44, 4897–4907. [Google Scholar] [CrossRef]
  5. Bordoni, M.; Meisina, C.; Valentino, R.; Lu, N.; Bittelli, M.; Chersich, S. Hydrological factors affecting rainfall-induced shallow landslides: From the field monitoring to a simplified slope stability analysis. Eng. Geol. 2015, 193, 19–37. [Google Scholar] [CrossRef]
  6. Lu, N.; Godt, J.W. Hillslope Hydrology and Stability; Cambridge University Press: Cambridge, UK, 2013. [Google Scholar]
  7. Vanapalli, S.K.; Fredlund, D.G.; Pufahl, D.E.; Clifton, A.W. Model for the prediction of shear strength with respect to soil suction. Can. Geotech. J. 1996, 33, 379–392. [Google Scholar] [CrossRef]
  8. Carminati, A.; Moradi, A.B.; Vetterlein, D.; Vontobel, P.; Lehmann, E.; Weller, U.; Vogel, H.-J.; Oswald, S.E. Dynamics of soil water content in the rhizosphere. Plant Soil 2010, 332, 163–176. [Google Scholar] [CrossRef]
  9. Delage, P.; Boldrin, D.; Leung, A.K.; Bengough, A.G.; Cui, Y.J.; Ghabezloo, S.; Pereira, J.M.; Tang, A.M. Desirable leaf traits for hydrological reinforcement of soil. E3S Web Conf. 2016, 9, 12006. [Google Scholar]
  10. Boldrin, D.; Leung, A.K.; Bengough, A.G. Correlating hydrologic reinforcement of vegetated soil with plant traits during establishment of woody perennials. Plant Soil 2017, 416, 437–451. [Google Scholar] [CrossRef]
  11. Boldrin, D.; Leung, A.K.; Bengough, A.G. Hydrologic reinforcement induced by contrasting woody species during summer and winter. Plant Soil 2018, 427, 369–390. [Google Scholar] [CrossRef]
  12. Li, J.; Wang, X.; Jia, H.; Liu, Y.; Zhao, Y.; Shi, C.; Zhang, F.; Wang, K. Assessing the soil moisture effects of planted vegetation on slope stability in shallow landslide-prone areas. J. Soils Sediments 2021, 21, 2551–2565. [Google Scholar] [CrossRef]
  13. Wang, S.; Meng, X.; Chen, G.; Guo, P.; Xiong, M.; Zeng, R. Effects of vegetation on debris flow mitigation: A case study from Gansu province, China. Geomorphology 2017, 282, 64–73. [Google Scholar] [CrossRef]
  14. Wang, X.; Hong, M.-M.; Huang, Z.; Zhao, Y.-F.; Ou, Y.-S.; Jia, H.-X.; Li, J. Biomechanical properties of plant root systems and their ability to stabilize slopes in geohazard-prone regions. Soil Tillage Res. 2019, 189, 148–157. [Google Scholar] [CrossRef]
  15. Fan, C.-C.; Su, C.-F. Role of roots in the shear strength of root-reinforced soils with high moisture content. Ecol. Eng. 2008, 33, 157–166. [Google Scholar] [CrossRef]
  16. Phan, T.N.; Likitlersuang, S.; Kamchoom, V.; Leung, A.K. Root biomechanical properties of Chrysopogon zizanioides and Chrysopogon nemoralis for soil reinforcement and slope stabilisation. Land Degrad. Dev. 2021, 32, 4624–4636. [Google Scholar] [CrossRef]
  17. Wu, Z.; Leung, A.K.; Boldrin, D.; Ganesan, S.P. Variability in root biomechanics of Chrysopogon zizanioides for soil eco-engineering solutions. Sci. Total Environ. 2021, 776, 145943. [Google Scholar] [CrossRef]
  18. Badhon, F.F.; Islam, M.S.; Islam, A.; Arif, Z.U. A simple approach for estimating contribution of vetiver roots in shear strength of a soil–root system. Innov. Infrastruct. Solut. 2021, 6, 96. [Google Scholar] [CrossRef]
  19. Wu, T.H.; McKinnell, W.P., III; Swanston, D.N. Strength of tree roots and landslides on Prince of Wales Island, Alaska. Can. Geotech. J. 1979, 16, 19–33. [Google Scholar] [CrossRef]
  20. Pollen, N.; Simon, A. Estimating the mechanical effects of riparian vegetation on stream bank stability using a fiber bundle model. Water Resour. Res. 2005, 41, 226–244. [Google Scholar] [CrossRef]
  21. Schwarz, M.; Lehmann, P.; Or, D. Quantifying lateral root reinforcement in steep slopes—From a bundle of roots to tree stands. Earth Surf. Process. Landf. 2010, 35, 354–367. [Google Scholar] [CrossRef]
  22. Arnone, E.; Caracciolo, D.; Noto, L.V.; Preti, F.; Bras, R.L. Modeling the hydrological and mechanical effect of roots on shallow landslides. Water Resour. Res. 2016, 52, 8590–8612. [Google Scholar] [CrossRef]
  23. DDas, G.K.; Hazra, B.; Garg, A.; Ng, C.W.W. Stochastic hydro-mechanical stability of vegetated slopes: An integrated copula based framework. Catena 2018, 160, 124–133. [Google Scholar] [CrossRef]
  24. Zhu, H.; Zhang, L. Evaluating suction profile in a vegetated slope considering uncertainty in transpiration. Comput. Geotech. 2015, 63, 112–120. [Google Scholar] [CrossRef]
  25. Wang, X.; Huang, Z.; Hong, M.M.; Zhao, Y.F.; Ou, Y.S.; Zhang, J. A comparison of the effects of natural vegetation regrowth with a plantation scheme on soil structure in a geological hazard-prone region. Eur. J. Soil Sci. 2019, 70, 674–685. [Google Scholar] [CrossRef]
  26. Zobeck, T.M. Rapid soil particle size analyses using laser diffraction. Appl. Eng. Agric. 2004, 20, 633–639. [Google Scholar] [CrossRef]
  27. Marques, J.J.; Schulze, D.G.; Curi, N.; Mertzman, S.A. Major element geochemistry and geomorphic relationships in Brazilian Cerrado soils. Geoderma 2004, 119, 179–195. [Google Scholar] [CrossRef]
  28. Six, J.; Elliott, E.; Paustian, K.; Doran, J. Aggregation and soil organic matter accumulation in cultivated and native grassland soils. Soil Sci. Soc. Am. J. 1998, 62, 1367–1377. [Google Scholar] [CrossRef]
  29. Puget, P.; Chenu, C.; Balesdent, J. Dynamics of soil organic matter associated with particle-size fractions of water-stable aggregates. Eur. J. Soil Sci. 2000, 51, 595–605. [Google Scholar] [CrossRef]
  30. van Genuchten, M.T. A closed-form equation for predicting the hydraulic conductivity of unsaturated soils. Soil Sci. Soc. Am. J. 1980, 44, 892–898. [Google Scholar] [CrossRef]
  31. Ren, X.; Kang, J.; Ren, J.; Chen, X.; Zhang, M. A method for estimating soil water characteristic curve with limited experimental data. Geoderma 2020, 360, 114013. [Google Scholar] [CrossRef]
  32. Arshad, M.A.; Lowery, B.; Grossman, B. Physical Tests for Monitoring Soil Quality. Methods Assess. Soil Qual. 1997, 49, 123–141. [Google Scholar]
  33. Klute, A.; Fritschedanielson, R.; Sutherland, P.; Blake, G.; Hartge, K.; Bradford, J.; Bower, G.H.; Gee, G.W.; Bauder, J.; Gee, D.G. Methods of Soil Analysis. Part 1. Physical and Mineralogical Methods; Part 2. Chemical and Microbiological Properties; American Society of Agronomy, Inc.: Madison, WI, USA, 1986; Volume 146, pp. 413–423. [Google Scholar]
  34. Lu, N.; Likos, W.J. Suction stress characteristic curve for unsaturated soil. J. Geotech. Geoenviron. 2006, 132, 131–142. [Google Scholar] [CrossRef]
  35. Lin, D.-G.; Huang, B.-S.; Lin, S.-H. 3-D numerical investigations into the shear strength of the soil–root system of Makino bamboo and its effect on slope stability. Ecol. Eng. 2010, 36, 992–1006. [Google Scholar] [CrossRef]
  36. Gonzalez-Ollauri, A.; Mickovski, S.B. Plant-soil reinforcement response under different soil hydrological regimes. Geoderma 2017, 285, 141–150. [Google Scholar] [CrossRef]
  37. Agriculture, E.A.J. Soil Aggregate Stability: A Review. J. Sustain. Agric. 1999, 14, 83–151. [Google Scholar]
  38. Beare, M.H.; Bruce, R.R. A comparison of methods for measuring water-stable aggregates: Implications for determining environmental effects on soil structure. In Soil Structure/Soil Biota Interrelationships; Elsevier: Amsterdam, The Netherlands, 1993; pp. 87–104. [Google Scholar]
  39. Zhao, D.; Xu, M.; Liu, G.; Ma, L.; Zhang, S.; Xiao, T.; Peng, G. Effect of vegetation type on microstructure of soil aggregates on the Loess Plateau, China. Agric. Ecosyst. Environ. 2017, 242, 1–8. [Google Scholar] [CrossRef]
  40. Shao, W.; Bogaard, T.; Bakker, M.J.P.E.; Science, P. How to use COMSOL multiphysics for coupled dual-permeability hydrological and slope stability modeling. Procedia Earth Planet. Sci. 2014, 9, 83–90. [Google Scholar] [CrossRef]
  41. Are, K.S.; Oluwatosin, G.A.; Adeyolanu, O.D.; Oke, A.O. Slash and burn effect on soil quality of an Alfisol: Soil physical properties. Soil Tillage Res. 2009, 103, 4–10. [Google Scholar] [CrossRef]
  42. Sattler, K.; Elwood, D.; Hendry, M.T.; Huntley, D.; Holmes, J.; Wilkinson, P.B.; Chambers, J.; Donohue, S.; Meldrum, P.I.; Macciotta, R.; et al. Quantifying the contribution of matric suction on changes in stability and displacement rate of a translational landslide in glaciolacustrine clay. Landslides 2021, 18, 1675–1689. [Google Scholar] [CrossRef]
  43. Zambon, N.; Johannsen, L.L.; Strauss, P.; Dostal, T.; Zumr, D.; Cochrane, T.A.; Klik, A.J.C. Splash erosion affected by initial soil moisture and surface conditions under simulated rainfall. Catena 2021, 196, 104827. [Google Scholar] [CrossRef]
  44. Asensio, V.; Vega, F.A.; Andrade, M.L.; Covelo, E.F. Tree vegetation and waste amendments to improve the physical condition of copper mine soils. Chemosphere 2013, 90, 603–610. [Google Scholar] [CrossRef]
  45. Yamashita, T.; Flessa, H.; John, B.; Helfrich, M.; Ludwig, B. Organic matter in density fractions of water-stable aggregates in silty soils: Effect of land use. Soil Biol. Biochem. 2006, 38, 3222–3234. [Google Scholar] [CrossRef]
  46. Alsubal, S.; bin Sapari, N.; Harahap, I.S.H.; Al-Bared, M.A.M. A Review on Mechanism of Rainwater in Triggering Landslide. IOP Conf. Ser. Mater. Sci. Eng. 2018, 513, 012009. [Google Scholar] [CrossRef]
  47. Paez-Bimos, S.; Villacis, M.; Morales, O.; Calispa, M.; Molina, A.; Salgado, S.; de Bievre, B.; Delmelle, P.; Munoz, T.; Vanacker, V. Vegetation effects on soil pore structure and hydraulic properties in volcanic ash soils of the high Andes. Hydrol. Process. 2022, 36, e14678. [Google Scholar] [CrossRef]
Figure 1. Soil sampling locations.
Forests 14 01865 g001
Figure 2. (a) Trees. (b) Shrubs. (c) Grasses. (d) Soil profile.
Forests 14 01865 g002
Figure 3. (a) Determination of SWCC using tensiometers. (b) Soil direct shear test using electric quadruple shear apparatus.
Forests 14 01865 g003
Figure 4. Geometric parameters of numerical slope model for two-dimensional finite element analysis (unit: meters). The blue line represents the permeation boundaries.
Forests 14 01865 g004
Figure 5. (a) Comparison of the SWCCs fitted with the Van Genuchten (VG) model for the three vegetation types (grass, shrubs, and trees). The red, brown, and black lines represent the best-fit line of the VG model in soils with trees, shrubs, and grass, respectively. (b) Relationship between shear strength at different normal stresses of soils with trees, shrubs, and grass.
Forests 14 01865 g005
Figure 6. (a) Water-stable aggregates with a diameter greater than 0.25 mm. (b) Fractal dimension of soil aggregates under three vegetation types. (c) Mean weight diameter of soil aggregates under three vegetation types. (d) Mean geometric diameter of soil aggregates under three vegetation types.
Forests 14 01865 g006
Figure 7. Effective saturation distribution of slopes at different times under rainfall conditions. (ac): trees; (df): shrubs; (gi): grass. Note: The size of the border indicates the scale size of the slope.
Forests 14 01865 g007
Figure 8. Failure modes of slopes with different vegetation types under two rainfall durations: (ac): trees; (df): shrubs; (gi): grass. The colors in PEMAG represent the plastic strain values. The length of the red arrow represents the depth of the potential sliding surface. The red area represents the area with the largest plastic strain. (Note: The size of the border indicates the scale size of the slope).
Forests 14 01865 g008
Table 1. Site description and soil strength characteristics.
SiteSpeciesH (m)c (kPa)φ (°)Permeabilityαnθr
BL2008104521.35 ± 1.7 b30.7 ± 1.5 b
TreesOlea europium L.106231.52 ± 8.08 ab34.47 ± 1.40 a48 cm/d0.092.5914.98
ShrubsPunica granatum105936.13 ± 4.20 a27.72 ± 0.38 c20 cm/d0.082.0313.24
GrassAvena fatua L.105729.21 ± 5.26 ab25.37 ± 0.71 d20 cm/d0.082.4313.52
Note: c: Soil cohesion (kPa); φ: internal friction angle (°); α, n, and m (m = 1 − 1/n) are shape parameters of the soil–water characteristic curve; H: elevation of sampling site; BL: bare land. Where letters in superscript differ, data are significantly different (p < 0.05, ANOVA). Values indicate mean ± standard deviation (n = 12).
Table 2. Soil physicochemical parameters.
Soil ParametersTreesShrubsGrass
SOC (g kg−1)3.50 ± 0.393.26 ± 0.733.48 ± 0.26
pH8.39 ± 0.26 a8.00 ± 0.04 b8.07 ± 0.07 a
BD (g cm−3)1.38 ± 0.191.38 ± 0.111.32 ± 0.09
TP (% v/v)46.41 ± 7.1244.19 ± 2.6945.03 ± 5.03
Sand (% w/w)52.97 ± 7.6046.74 ± 0.5845.63 ± 3.55
Clay (% w/w)7.19 ± 0.417.86 ± 0.788.00 ± 1.17
Silt (% w/w)39.83 ± 7.2645.40 ± 0.2446.37 ± 2.74
Fe2O3 (% w/w)4.84 ± 0.105.07 ± 0.095.19 ± 0.12
Al2O3 (% w/w)11.50 ± 0.2112.05 ± 0.2412.30 ± 0.28
SiO2 (% w/w)51.09 ± 0.9650.60 ± 0.7250.60 ± 2.47
Note: SOC: soil organic carbon, BD: bulk density, TP: total porosity. Where letters in superscript differ, data are significantly different (p < 0.05, ANOVA). Values indicate mean ± standard deviation (n = 12).
Disclaimer/Publisher’s Note: The statements, opinions and data contained in all publications are solely those of the individual author(s) and contributor(s) and not of MDPI and/or the editor(s). MDPI and/or the editor(s) disclaim responsibility for any injury to people or property resulting from any ideas, methods, instructions or products referred to in the content.

