Article

Nematode Community Characteristics Indicate Soil Restoration under Different Revegetation Approaches in the Semiarid Area of the Chinese Loess Plateau

1
State Key Laboratory of Soil Erosion and Dryland Farming on the Loess Plateau, Northwest A&F University, Yangling 712100, China
2
Institute of Soil and Water Conservation, Chinese Academy of Sciences and Ministry of Water Resources, Yangling 712100, China
3
College of Forestry, Northwest A&F University, Yangling 712100, China
4
Institute of Geographical Science, Taiyuan Normal University, Taiyuan 030619, China
*
Author to whom correspondence should be addressed.
Forests 2023, 14(9), 1886; https://doi.org/10.3390/f14091886
Submission received: 23 July 2023 / Revised: 4 September 2023 / Accepted: 14 September 2023 / Published: 17 September 2023
(This article belongs to the Section Forest Ecology and Management)

Abstract

:
Soil nematode communities can offer valuable indicators for monitoring the status of soil ecosystems. However, their potential for assessing soil restoration under revegetation has been neglected in temperate arid and semiarid areas. This study examined the characteristics of soil nematode communities and their relationships with soil physicochemical properties under five typical revegetation approaches in the semiarid Loess Plateau of China. The results showed that planting an artificial Caragana korshinskii forest led to the recovery of the soil food web, which significantly increased soil nematode abundance (138.10 ± 11.60 inds./100 g dry soil) and community diversity (Shannon-Wiener diversity: 2.48 ± 0.13; trophic diversity: 3.08 ± 0.02), associated with the high contents of SOC and NH4+-N. However, establishing an artificial Prunus sibirica forest improved neither soil properties nor nematode community characteristics, reflecting poor soil ecosystem restoration. After establishing an artificial Prunus davidiana forest (PD) and an artificial Medicago sativa grassland (MS), substantial increases in herbivorous and fungivorous nematodes were observed, respectively, likely due to the accumulation of particular genera that fed on roots (e.g., Pratylenchus) or their symbiotic fungi (e.g., Tylencholaimus), which might result in the deterioration (in MS) or restoration (in PD) of the soil food webs. Natural grassland restoration greatly improved soil properties (i.e., SOC, NH4+-N, microbial biomass carbon) but did not change the nematode community obviously, probably due to top-down predation in natural habitats. In conclusion, the characteristics of nematode communities can effectively indicate the restoration of soil food webs and identify their possible driving forces under revegetation, which have important implications for vegetation restoration in arid and semiarid regions.

1. Introduction

As one of the most severe environmental issues globally, land degradation poses a great threat to ecosystem health and human survival [1], especially in arid and semiarid environments [2]. Revegetation is a vital strategy widely used to mitigate land degradation, effectively reducing soil erosion, improving biodiversity, and restoring ecosystem services [3,4,5]. Traditional revegetation practices focus mainly on plant community manipulation [6,7,8]. In the past decade, the importance of belowground communities in ecosystem restoration has become increasingly understood in the scientific community [9]. The establishment and development of plant communities (artificially and naturally) have profound impacts on organisms at multiple trophic levels in the soil food web by changing their food resources and living environment [10,11,12,13], which can further regulate soil functions and plant community characteristics. These changes greatly influence ecosystem restoration outcomes [9,14,15]. Therefore, considering the belowground community response is crucial for the successful restoration of degraded ecosystems.
As one of the most abundant and diverse groups of soil fauna, nematodes play essential roles in structuring soil food webs [16,17,18] and regulating the essential processes of soil ecosystems [17,19,20,21]. Moreover, nematodes have been regarded as ideal bioindicators of ecological restoration because they are sensitive to changes in the local environment, and their community characteristics can offer important information on soil biodiversity and food web dynamics [17,22,23]. To date, numerous studies have addressed the effects of revegetation on soil nematode communities [24,25,26]. Previous results showed that soil nematode communities typically varied by the specific revegetation approach [25,27,28,29], and their characteristics provide a critical assessment of restoration in plant communities and soil food webs [21,30].
The Loess Plateau of China has an area of 640,000 km2, which is famous for its serious soil erosion and land degradation [31,32]. Since the 1950s, several government-led ecological conservation projects have been implemented to combat land degradation and improve ecological restoration in this region, such as the “Grain for Green” program, which aims to convert sloped farmlands into forests and grasslands through natural and artificial revegetation [31,33,34,35,36]. To explore the ecological consequences of this conversion, a series of studies have addressed the changes in plant communities and corresponding belowground parameters, including soil physicochemical properties and microbial communities, on the Loess Plateau [2,12,32,37,38,39,40]. However, until now, little attention has been given to soil nematode communities and their responses to revegetation in this region, which limits the comprehensive understanding of revegetation effects on soil ecosystem restoration.
In this study, the composition, structure, and ecological indices of soil nematode communities under different revegetation approaches (e.g., the conversion of sloped farmland to naturally restored grassland, artificial grassland, and artificial forests) and their relationships with soil physicochemical properties were analyzed in the semiarid area of the Loess Plateau. The objectives of this study were to evaluate the changes in soil nematode communities under different revegetation approaches and explore their significance for elucidating the impacts of revegetation on soil ecosystem restoration. It was hypothesized that the characteristics of soil nematode communities could effectively indicate the restoration of soil food webs and help identify the main forces driving changes in soil food webs under different revegetation approaches.

2. Materials and Methods
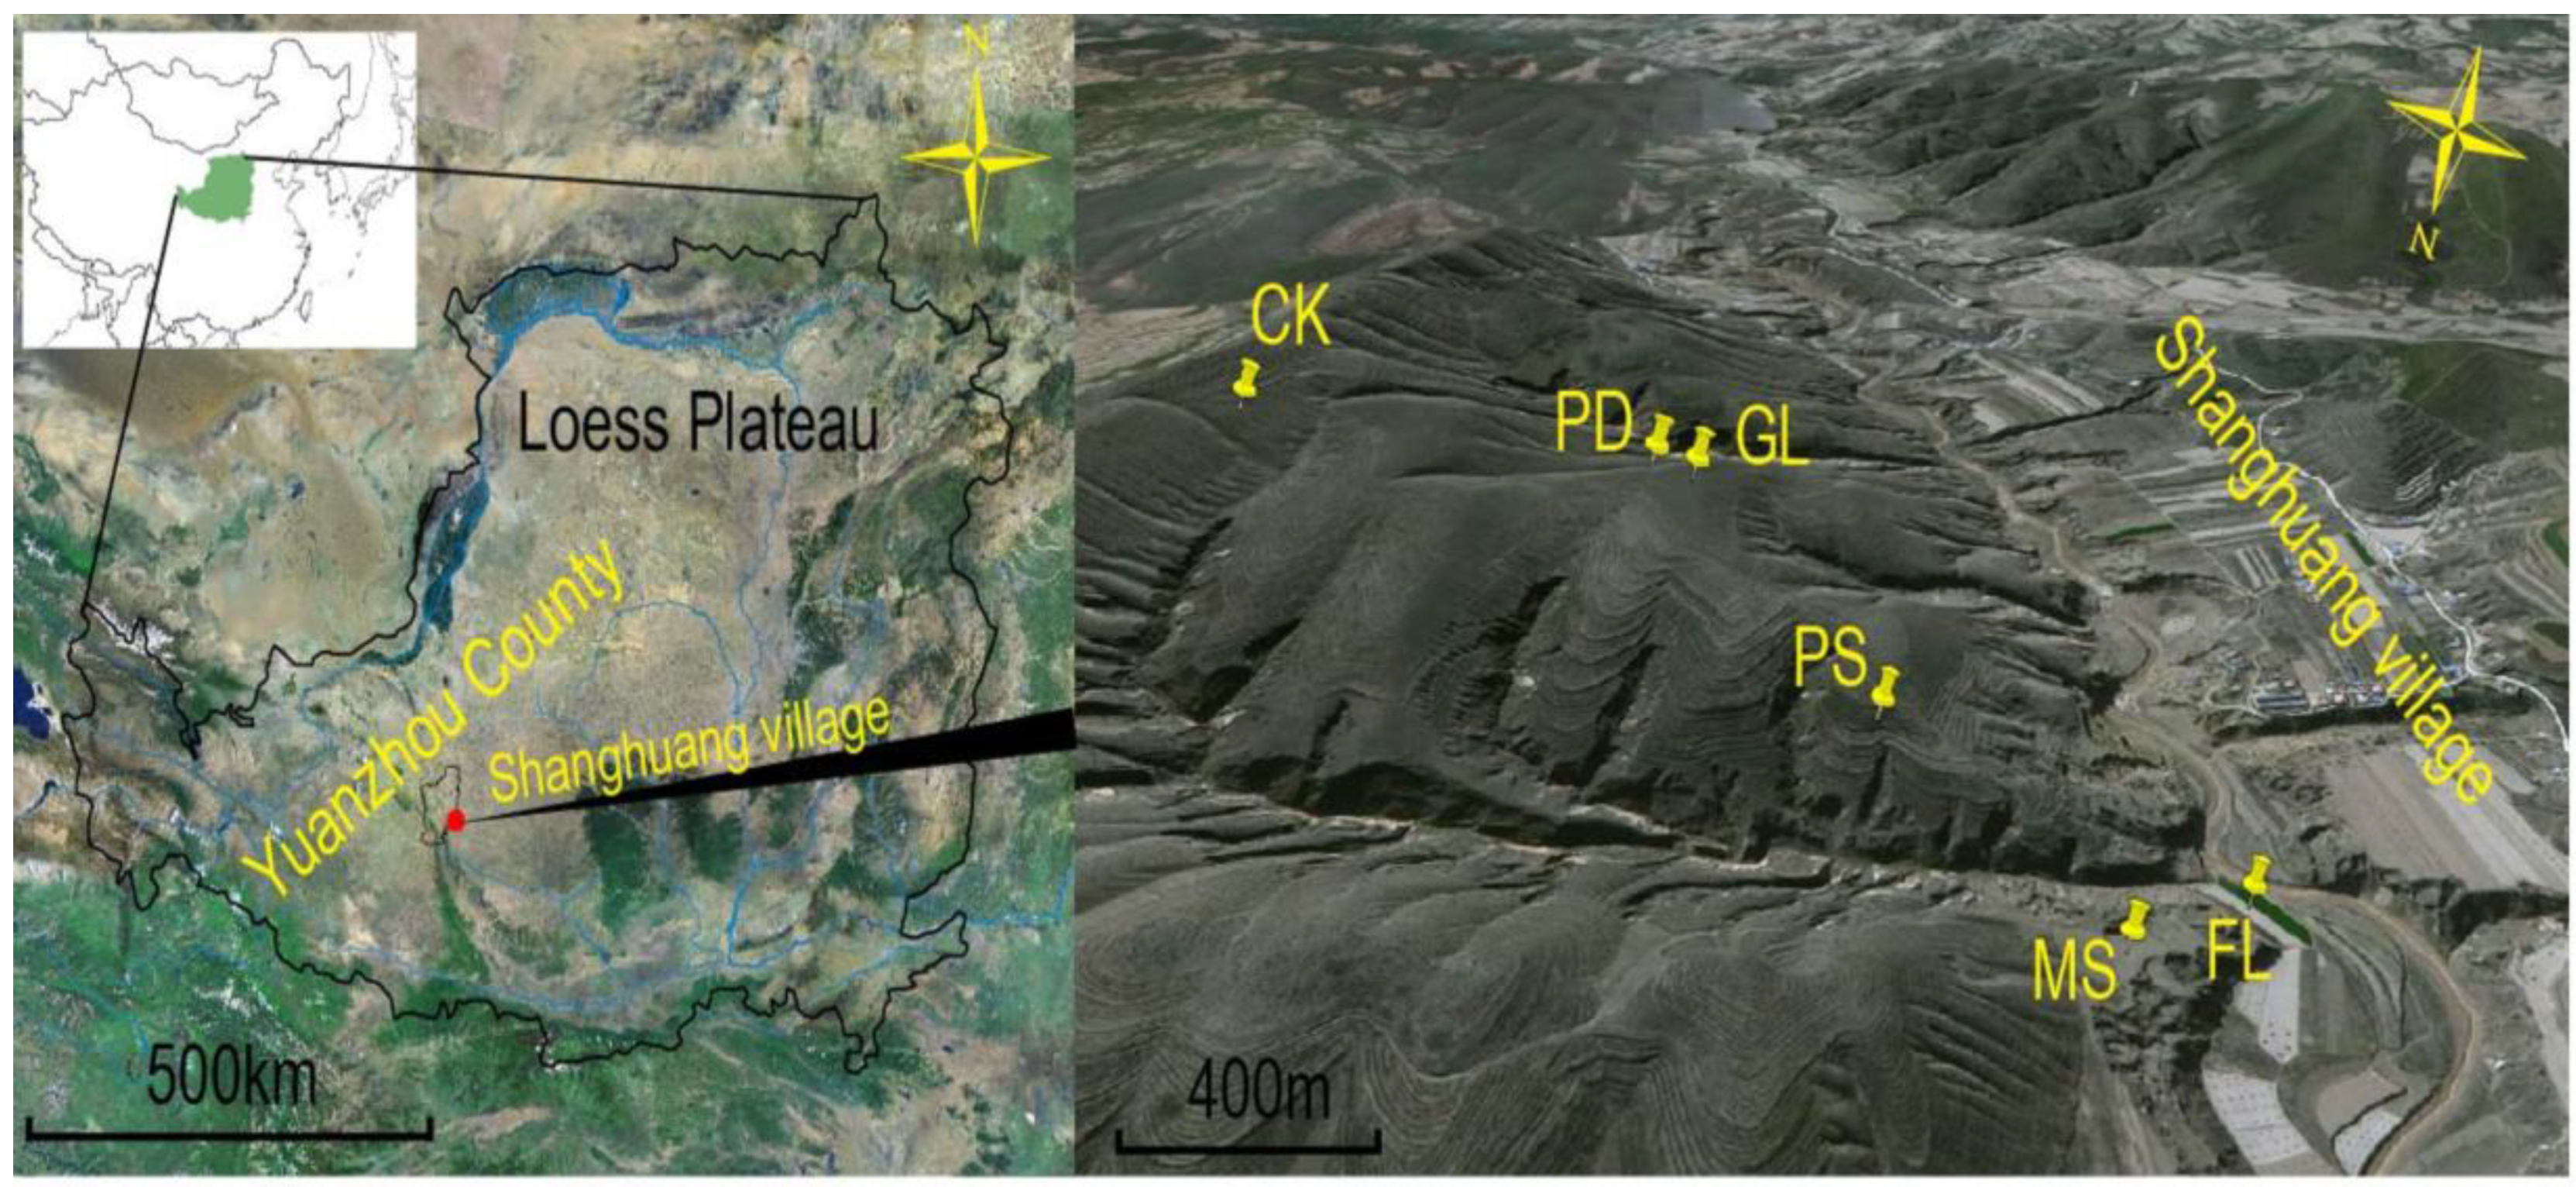
2.1. Study Sites

The study area is located in Shanghuang Village, Yuanzhou County, Guyuan City, Ningxia Hui Autonomous Region, China (106°27′–106°29′ E, 35°06′–36°20′ N) (Figure 1). This area is in the hilly-gully region of the western Loess Plateau, which is influenced by a semiarid, warm temperate, continental monsoon climate with a mean annual temperature of 7.1 °C and a mean annual precipitation of 420 mm, falling mainly from July to September. The mean annual evaporation is 1400 mm, with a mean aridity index of 1.5–2.0. The mean annual frost-free period is 150 days [41,42,43]. The soil in the study area is classified as a Haplic Calcisol according to the FAO (World Soil Resources) soil taxonomic system.
The study area belongs to an agriculture-pasturage ecotone, where severe soil erosion and land degradation occur. Since the 1980s, the “Grain for Green” project has been implemented in the Shanghuang area, where many sloped farmlands have been converted into grasslands and forests through artificial or natural revegetation. In the past several decades, the study area has been established as a key demonstration zone for the “Grain for Green” project, which has also been established as an experimental base to monitor vegetation restoration by Northwest Agricultural and Forestry University. The primary land use types in this area included artificial forests (Caragana korshinskii, Prunus davidiana, and Prunus sibirica), artificial grasslands (Medicago sativa), naturally restored grasslands (dominated by Thymus mongolicus, Stipa bungeana, Heteropappus altaicus, Artemisia sacrorum, etc.), and farmlands grown with corn (Zea mays).
In this study, the following sampling sites were selected under typical types of vegetation in the study area: artificial C. korshinskii forest (CK), artificial P. sibirica forest (PS), artificial P. davidiana forest (PD), artificial M. sativa grassland (MS), and naturally restored grassland (GL) (dominated by Thymus mongolicus, Heteropappus altaicus, and Stipa bungeana). These sites were all converted from farmland (grown with corn) and revegetated between 2002 and 2005. These sites had similar terrain conditions and similar previous farming practices. Since the establishment of the artificial M. sativa grassland in 2005, the aboveground parts of plants in this field have been harvested annually (in September of every year), and the replanting of M. sativa has been carried out every five years after plowing in April (in 2010 and 2015). A traditional sloped farmland (FL) grown with corn was selected as a control, which was used for agricultural production with low fertilizer input. Detailed information (geographical information and vegetation characteristics) for all experimental sites is presented in Table 1.

2.2. Soil Sampling

For each study site, three independent plots (20 m × 20 m) were established in August (the growing season) of 2018 and considered sampling replicates. These plots were at least 100 m apart from each other. Within each plot, the plant communities were investigated. After the removal of plant litter, twelve soil samples were collected along an S-shaped curve from a 0–20 cm soil layer using a soil drilling sampler with a 10 cm diameter and mixed as one composite soil sample. The fresh soil samples were stored in plastic bags and transported to the laboratory on ice. Visible plant roots, stones, litter, and debris in soil samples were manually removed. All soil samples were then divided into two subsamples. One subsample was sieved through a 5 mm mesh and maintained at 4 °C for extracting soil nematodes and analyzing soil moisture, microbial biomass carbon, microbial biomass nitrogen, and inorganic nitrogen (NO3-N and NH4+-N). Another subsample was air-dried and used for analyzing other soil physicochemical properties.

2.3. Soil Physicochemical Analysis

Soil pH was measured using an automatic titrator (Metrohm 702, Herisau, Switzerland) in 1:2.5 soil/water suspensions. Soil moisture content (SM) was measured gravimetrically and expressed as a percentage of the soil water to the dry soil weight. Soil organic carbon (SOC) content was determined using concentrated sulfuric acid (H2SO4) hydrolysis and potassium dichromate (K2Cr2O7) oxidation methods. Total nitrogen (TN) content was determined using the Kjeldahl method [44]. Ammonium (NH4+-N) and nitrate-nitrogen (NO3-N) in soil were extracted with 2 molar (M) potassium chloride (KCl), and the soil extracts were measured using a Continuous Flowing Analytical System Auto Analyzer 3-Continuous-Flow Analyzer (SAN++, SKALAR, Breda, Holland). Soil microbial biomass carbon (MBC) and microbial biomass nitrogen (MBN) were extracted using the chloroform-fumigation extraction method [45,46]. MBC concentrations in the soil extracts were measured using an automated TOC (Total Organic Carbon) analyzer (Multi C/N 3000, Analytik Jena, Jena, Thuringia, Germany), while MBN concentrations were determined by the semi-micro-Kjeldahl determination method [47].

2.4. Nematode Community Analysis

Nematodes were extracted from 100 g of fresh soil using a modified Baermann method followed by sugar centrifugal flotation [48]. After counting the total number of nematodes under a dissecting microscope (50× magnification) (Olympus SZX7, Olympus, Center Valley, PA, USA), the number of individuals per 100 g of dry soil was calculated to express nematode abundance. At least 100 nematode individuals were randomly selected per soil sample and morphologically identified to the genus level using a compound light microscope (100–400× magnification) (PrimoStar, Carl Zeiss, Oberkochen, Baden-Wuerttemberg, Germany), according to Bongers [49] and Ahmad and Jairjpuri [50]. The relative abundance of each genus was also calculated. Once there were fewer than 100 nematode specimens in one soil sample, all specimens were identified.
Each nematode genus found was assigned to one of the four trophic groups characterized by their feeding habits [18]: bacterivores (Ba), fungivores (Fu), plant parasites (PP), and omnivores-predators (OP). It should be noted that the genus Ditylenchus, which includes both plant parasites and fungivores, has a high relative abundance in most sampling sites. In order to clarify the feeding habit of Ditylenchus in our study, species identification was made for this genus by the use of the high-throughput sequencing (HTS) method [51]. The HTS results showed that two species of the Ditylenchus genus (D. destructor and D. angustus) were detected in soil samples, and both of them are plant parasites. Therefore, in our study, the Ditylenchus genus was assigned to the trophic group of plant parasites (PP). The detailed procedures of the HTS method are described in Supplementary Materials (Materials and Methods in Supplementary Materials).
All nematode genera were assigned to different functional guilds defined as colonizer-persister (c-p) values from 1 (r-strategist) to 5 (K-strategist) [22,52]. The individual numbers of nematodes with different c-p values reflect gradations between opposing life-history strategies [52]. The following ecological indices were analyzed to assess the characteristics of the nematode community and soil food web: (1) The Shannon-Wiener diversity index (H’ = −ΣPi × lnPi) [53], Pielou’s evenness index (J’ = H’/lnS) [54], Simpson dominance index (λ = Σ(Pi)2) [55], and Margalef richness index (SR = (S − 1)/lnN) [56] were calculated, where Pi = the proportion of the genus i in the total nematode community, S = the number of genera identified, and N = the total number of nematode individuals. These indices can be applied to evaluate soil nematode diversity at the genus level. (2) The trophic diversity index (TD = 1/Σ(P’i)2) was determined to assess the diversity of nematode communities at the trophic level [57], where P’i = the proportion of the trophic group i in the total nematode community. (3) The maturity index (MI = Σvi × fi) for free-living nematodes was calculated [22], where vi = the c-p value of a free-living nematode genus i and fi = the frequencies of that genus in a sample. The MI reflects the levels of environmental disturbance experienced by the soil ecosystem, with a low value expressing a highly disturbed system [22]. (4) The plant parasite index (PPI) was calculated in a similar manner as the MI but only for plant parasitic genera [58]. (5) The Wasilewska index (WI = (B + F)/PP) was determined to assess the health condition of the soil ecosystem [59], where B, F, and PP are the numbers of bacterivores, fungivores, and plant parasites in the total nematode community, respectively. (6) The nematode channel ratio (NCR = B/(B + F)) indicates the major decomposition pathway of the soil food web [60]. (7) The enrichment index (EI = 100 × e/(b + e)) was calculated to evaluate the response of the soil food web to available resources [60], and (8) the structure index (SI = 100 × s/(b + s)) was calculated to indicate the structural changes in the soil food web under human disturbance or during ecological restoration [60], where e, b, and s are the weighted proportions of the enriched component, basal component, and structured component of the soil food web, respectively [60]. Based on soil nematode communities’ EI and SI values, nematode faunal analysis was performed to comprehensively assess soil food web conditions at different sampling sites [60].

2.5. Data Analysis

All data were tested for normal distribution and homogeneity of variance by Kolmogorov-Smirnov and Levene’s tests, respectively. A one-way ANOVA followed by the least significant difference (LSD) test was used to assess the effects of the revegetation approach on soil properties and nematode communities. Pearson correlation analysis and redundancy analysis (RDA) were used to test the significance of correlations between nematode community characteristics and soil physicochemical properties across all sampling sites. Differences at the p < 0.05 level were considered to be statistically significant. Redundancy analysis (RDA) was performed using CANOCO software version 5.0 [61], and the other statistical analyses were performed using SPSS version 20.0 (SPSS Inc., Chicago, IL, USA).

3. Results

3.1. Soil Physicochemical Properties

The soil’s physicochemical properties varied under different revegetation approaches (Table 2). Compared to the FL, artificial C. korshinskii (CK) forest, artificial P. davidiana (PD) forest, and naturally restored grasslands (GL) greatly improved SOC and NH4+-N, while they more or less decreased soil pH and NO3-N (Table 2). PD and GL also slightly improved SM and MBC, respectively (Table 2). However, artificial M. sativa grassland (MS) and artificial P. sibirica (PS) forests did not induce observable improvements in soil physicochemical properties and even significantly lowered SOC and NO3-N in MS (Table 2). Therefore, CK forest, PD forest, and GL grassland showed greater improvement in soil physicochemical properties (Table 2).

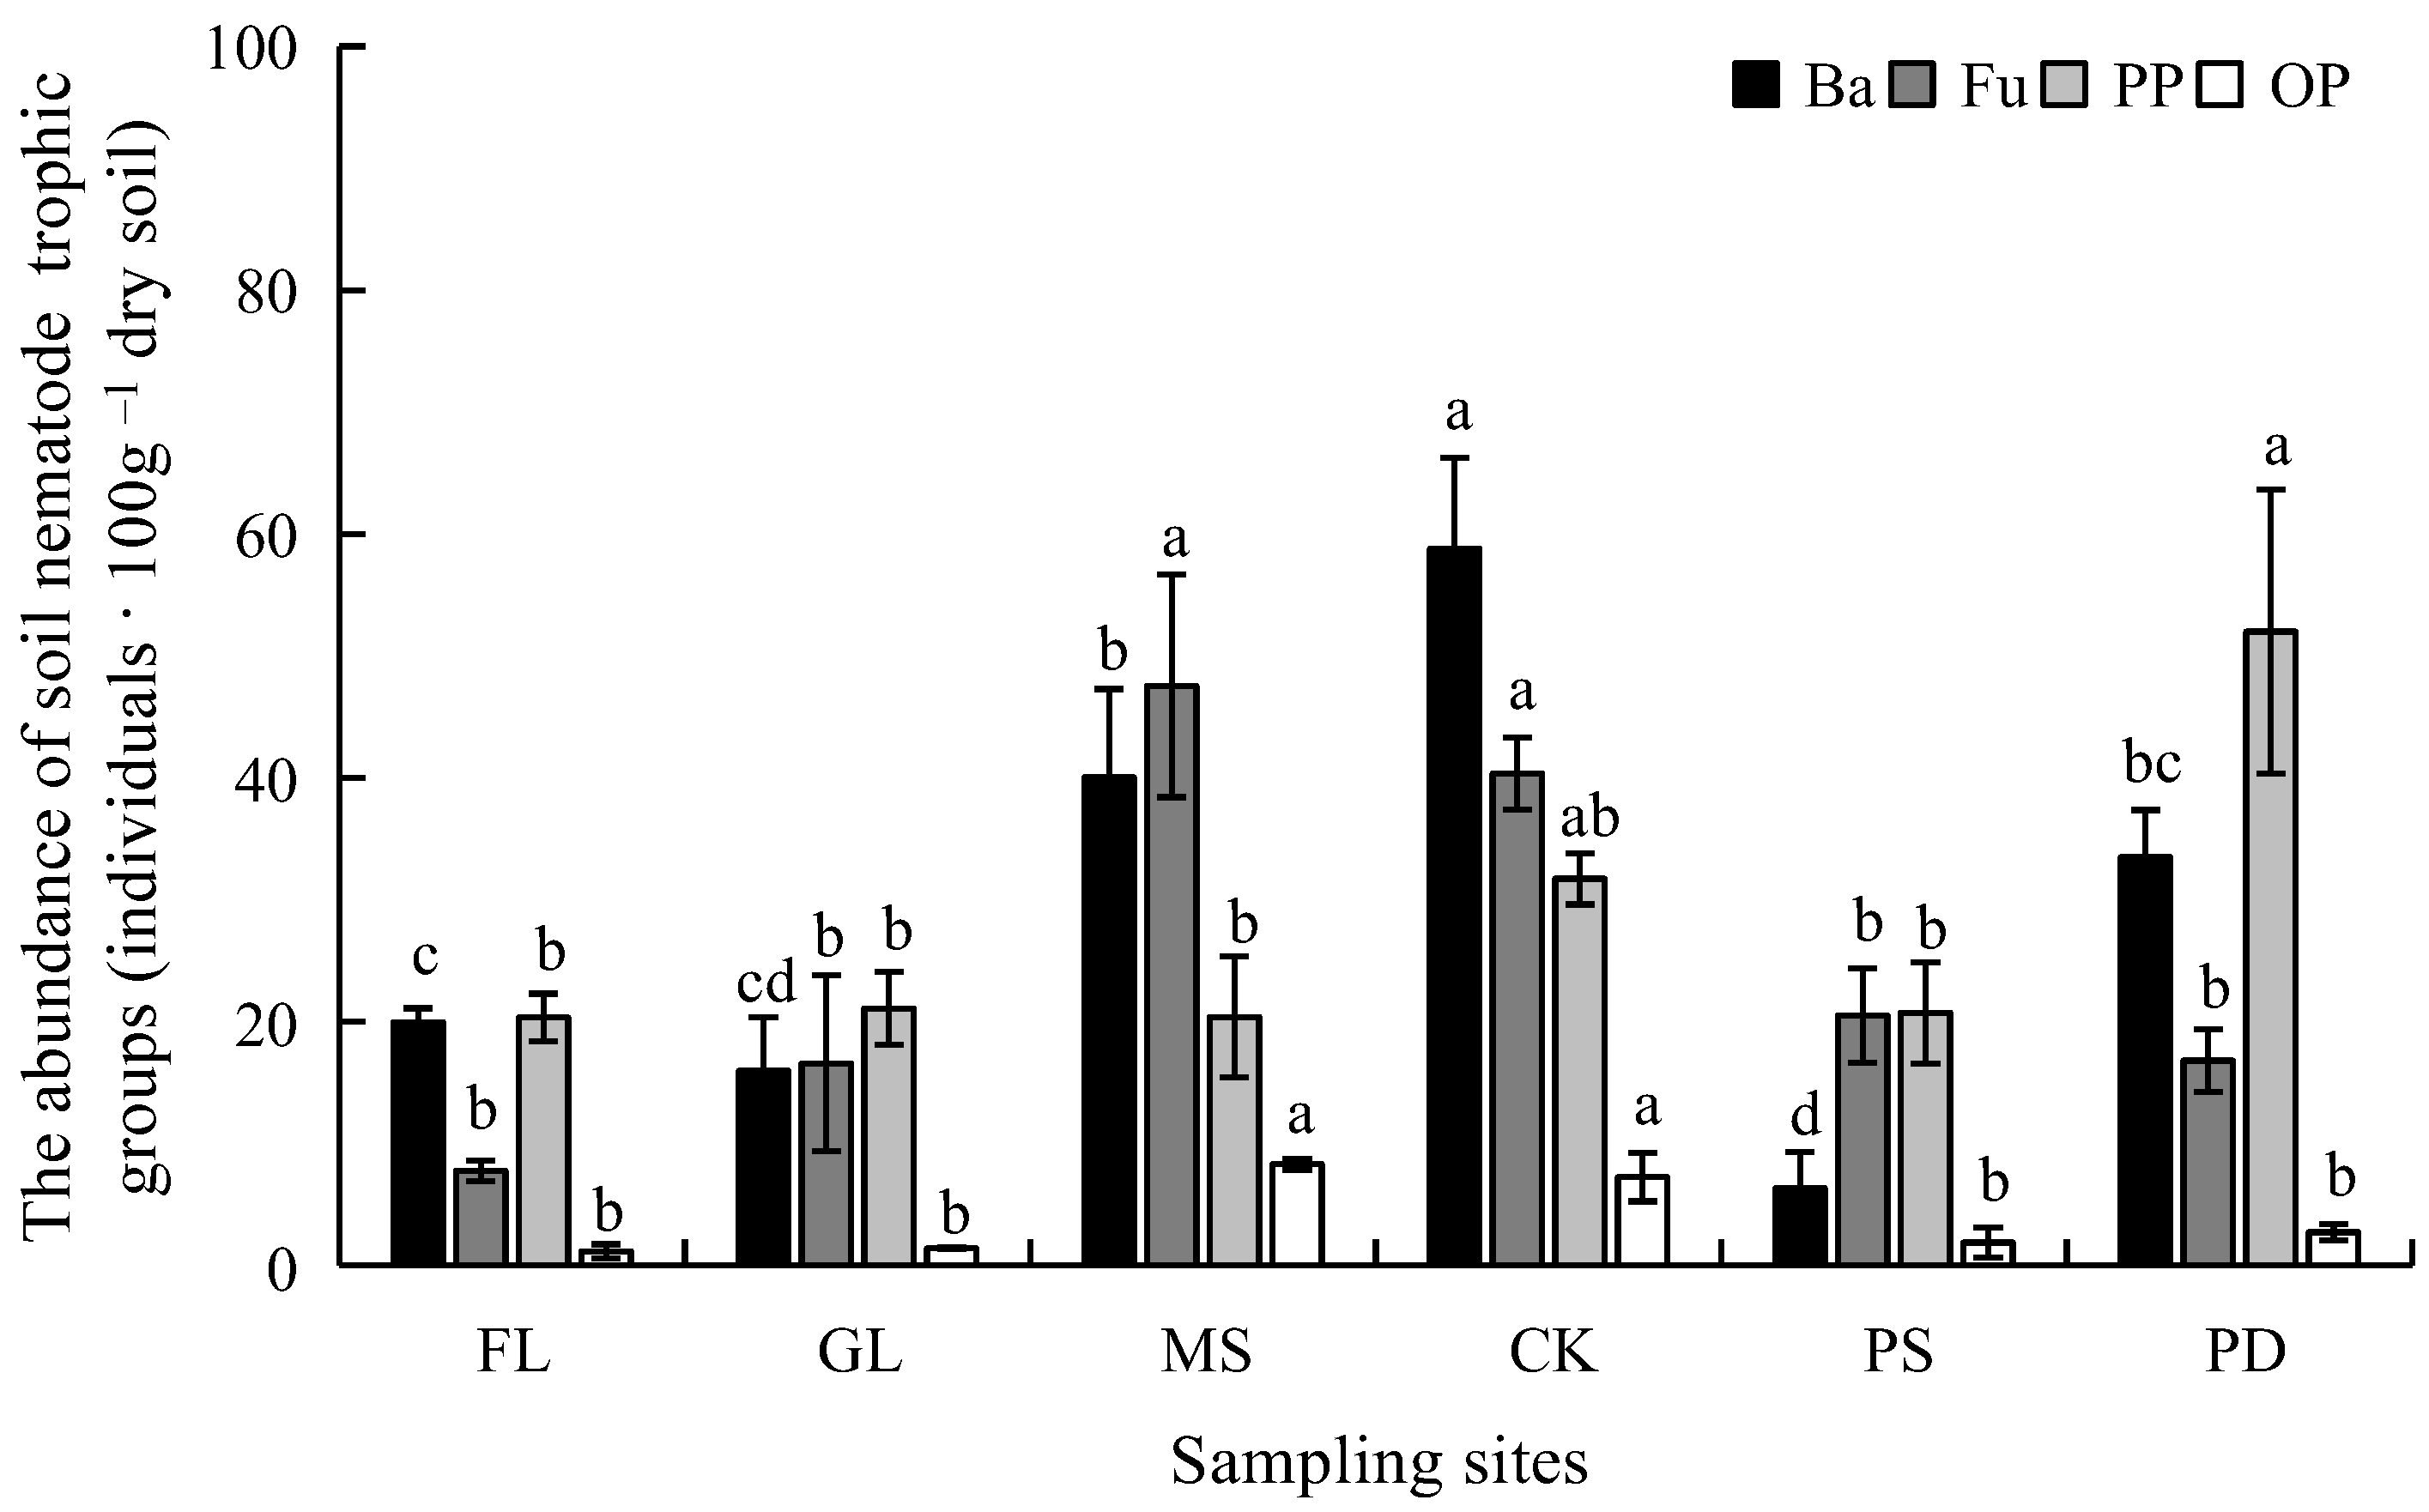
3.2. Composition and Structure of Soil Nematode Communities

The total abundance of soil nematodes varied significantly among revegetation approaches (p < 0.05) and was significantly higher in CK, PD, and MS when compared to FL. The highest total abundance of soil nematodes was observed in the CK forest (Table 3).
In all the sampling sites, a total of 31 nematode genera belonging to 19 families were observed, with the genera numbers varying little among revegetation approaches (p > 0.05) (Table 3). The composition of the soil nematode community was significantly influenced by the specific revegetation approach (Table 3). In FL, the Ditylenchus genus (assigned to the plant-feeding group), showed the highest relative abundance, followed by two bacterial-feeding genera, Acrobeles and Cervidellus (Table 3). Compared to FL, the sites under different revegetation approaches, particularly CK and MS, decreased the relative abundance of Ditylenchus (Table 3). Meanwhile, the PD forest increased the relative abundance of another plant-feeding nematode genus, Pratylenchus, while the other sites increased those of some fungal-feeding genera, such as Aphelenchus or Tylencholaimus (Table 3).
The trophic structure of the nematode community was also greatly affected by the specific revegetation approach (Figure 2). Bacterivores, fungivores, and omnivore-predators in the nematode community were present in higher abundance in the CK forest and the MS grassland, while the abundance of plant-feeders reached the highest abundance in the PD forest (Figure 2). Compared to FL, the PS forest had a slight decrease in bacterivore abundance while showing increased fungivore abundance. The GL grassland did not induce observable changes in the nematode community structure (Figure 2).

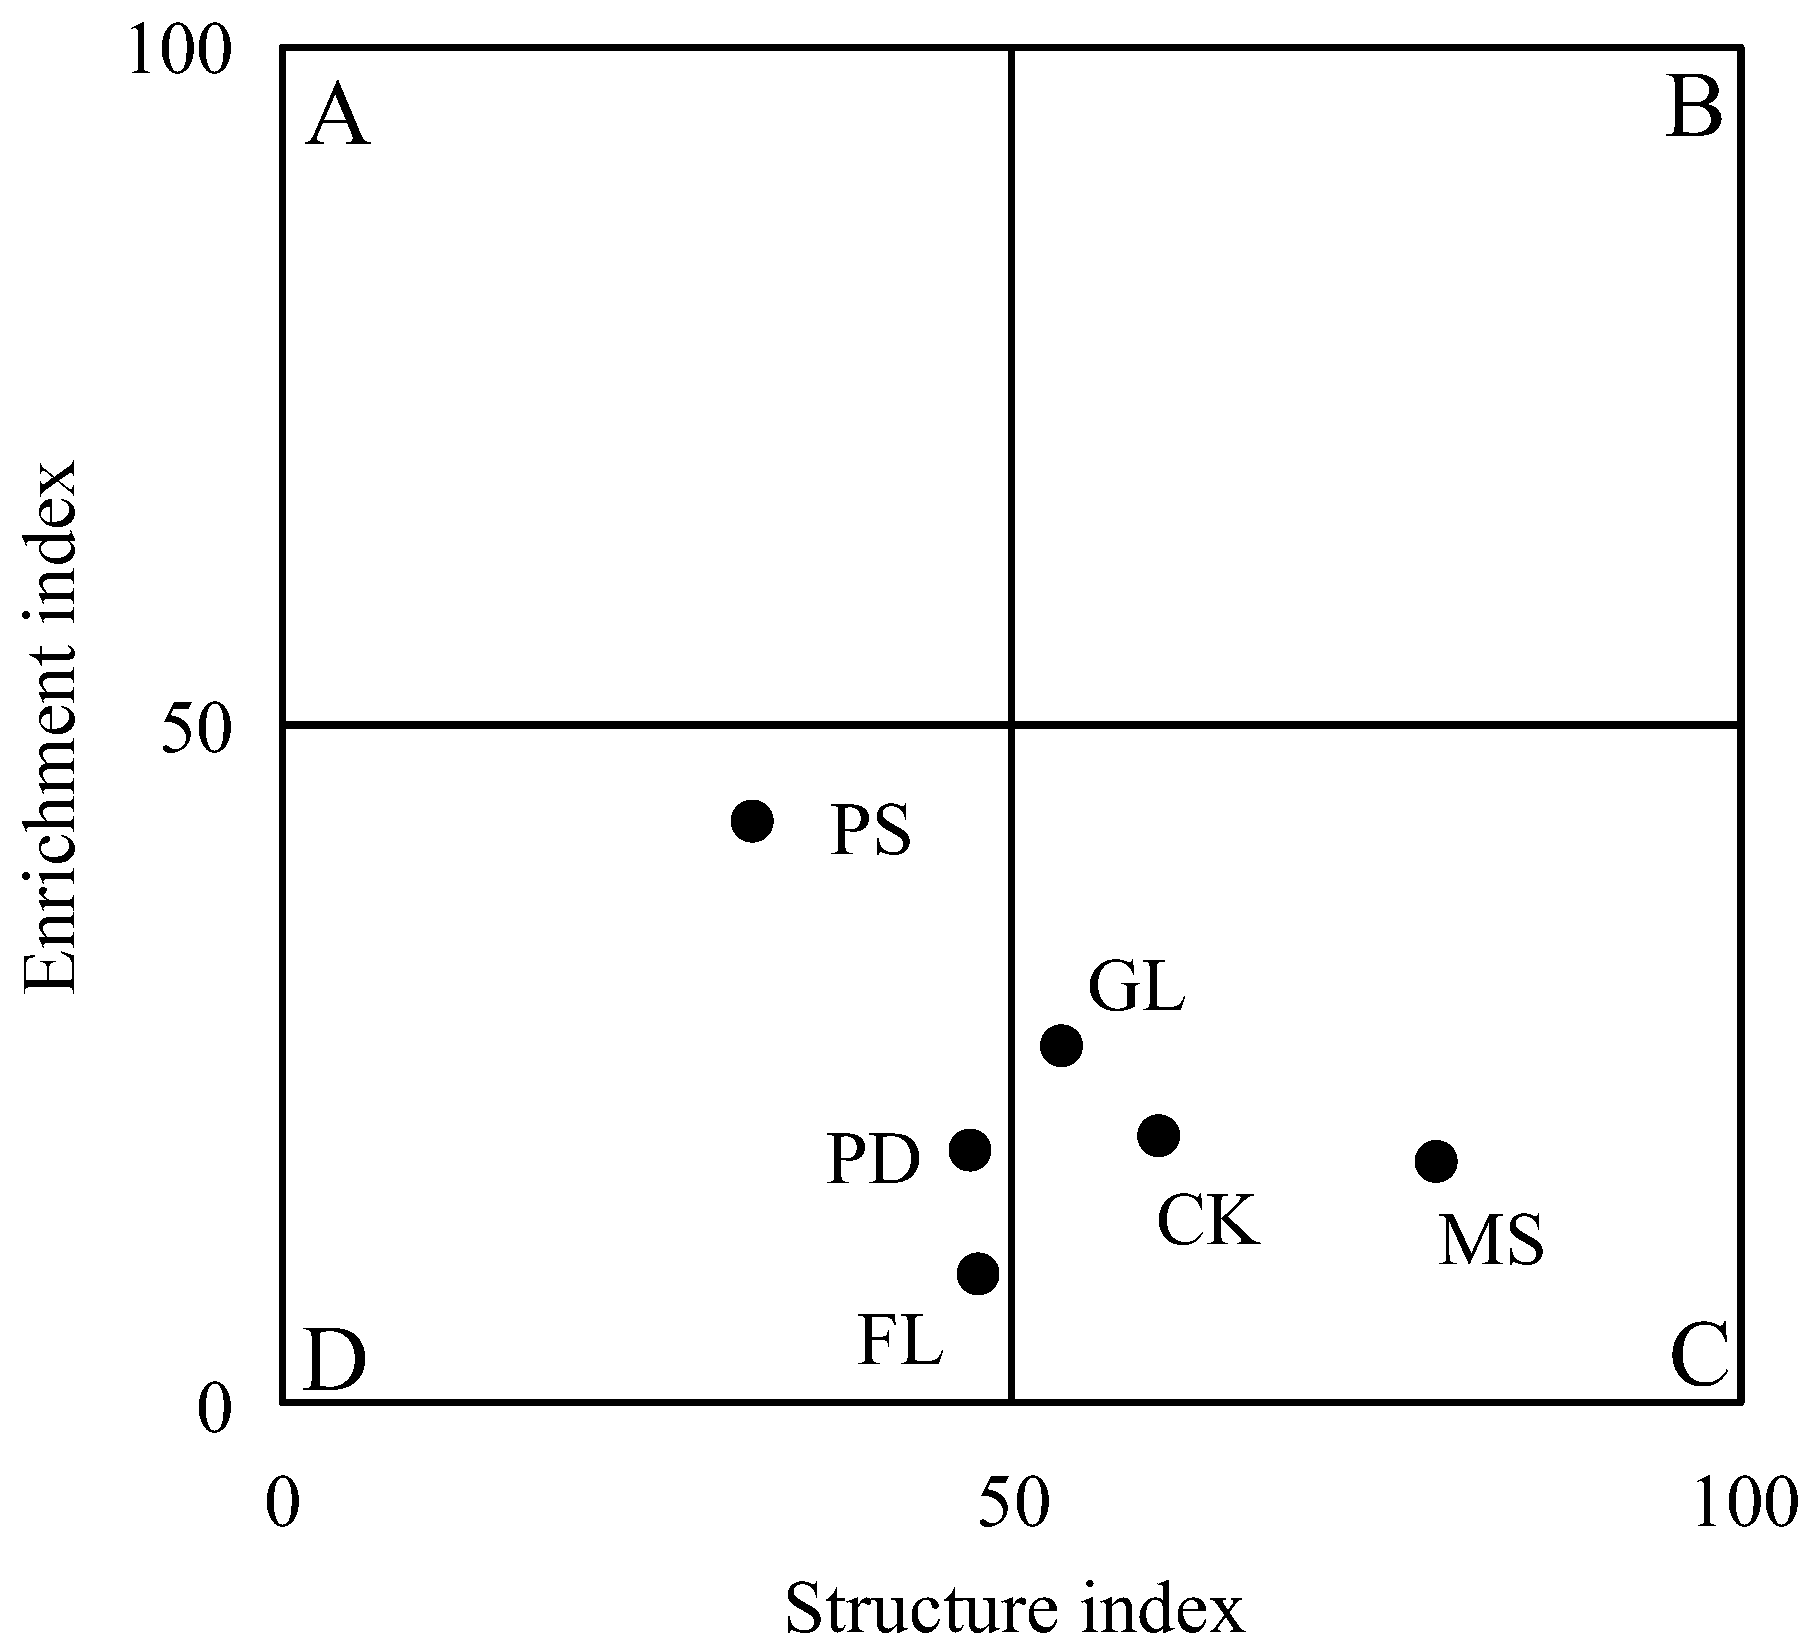
3.3. Ecological Indices of Soil Nematode Communities

The ecological indices of nematode communities greatly varied under different revegetation approaches (p < 0.05) (Table 4). In the CK forest, the nematode diversity index (H’) reached the highest value, while the dominance index (λ) decreased to the lowest value (p < 0.05) (Table 4). The TD index was higher in the CK forest and the MS grassland than in the other sites (Table 4). For nematode functional indices, the MI index was the highest in the MS grassland and the CK forest, while PPI and PPI/MI were the highest in the PD forest (Table 4). Nematode channel ratio (NCR) was the highest in FL (0.72) and significantly declined in MS grassland and PS forest (NCR < 0.5) (Table 4).
Nematode faunal analysis showed that the profiles of soil nematode communities in GL, MS, and CK were plotted in quadrant C (Figure 3), which indicated that these sites were undisturbed and moderately enriched with a highly structured soil food web. In contrast, the remaining sites were located in quadrant D, indicating stressed disturbance and degraded soil food webs in these belowground environments (Figure 3).

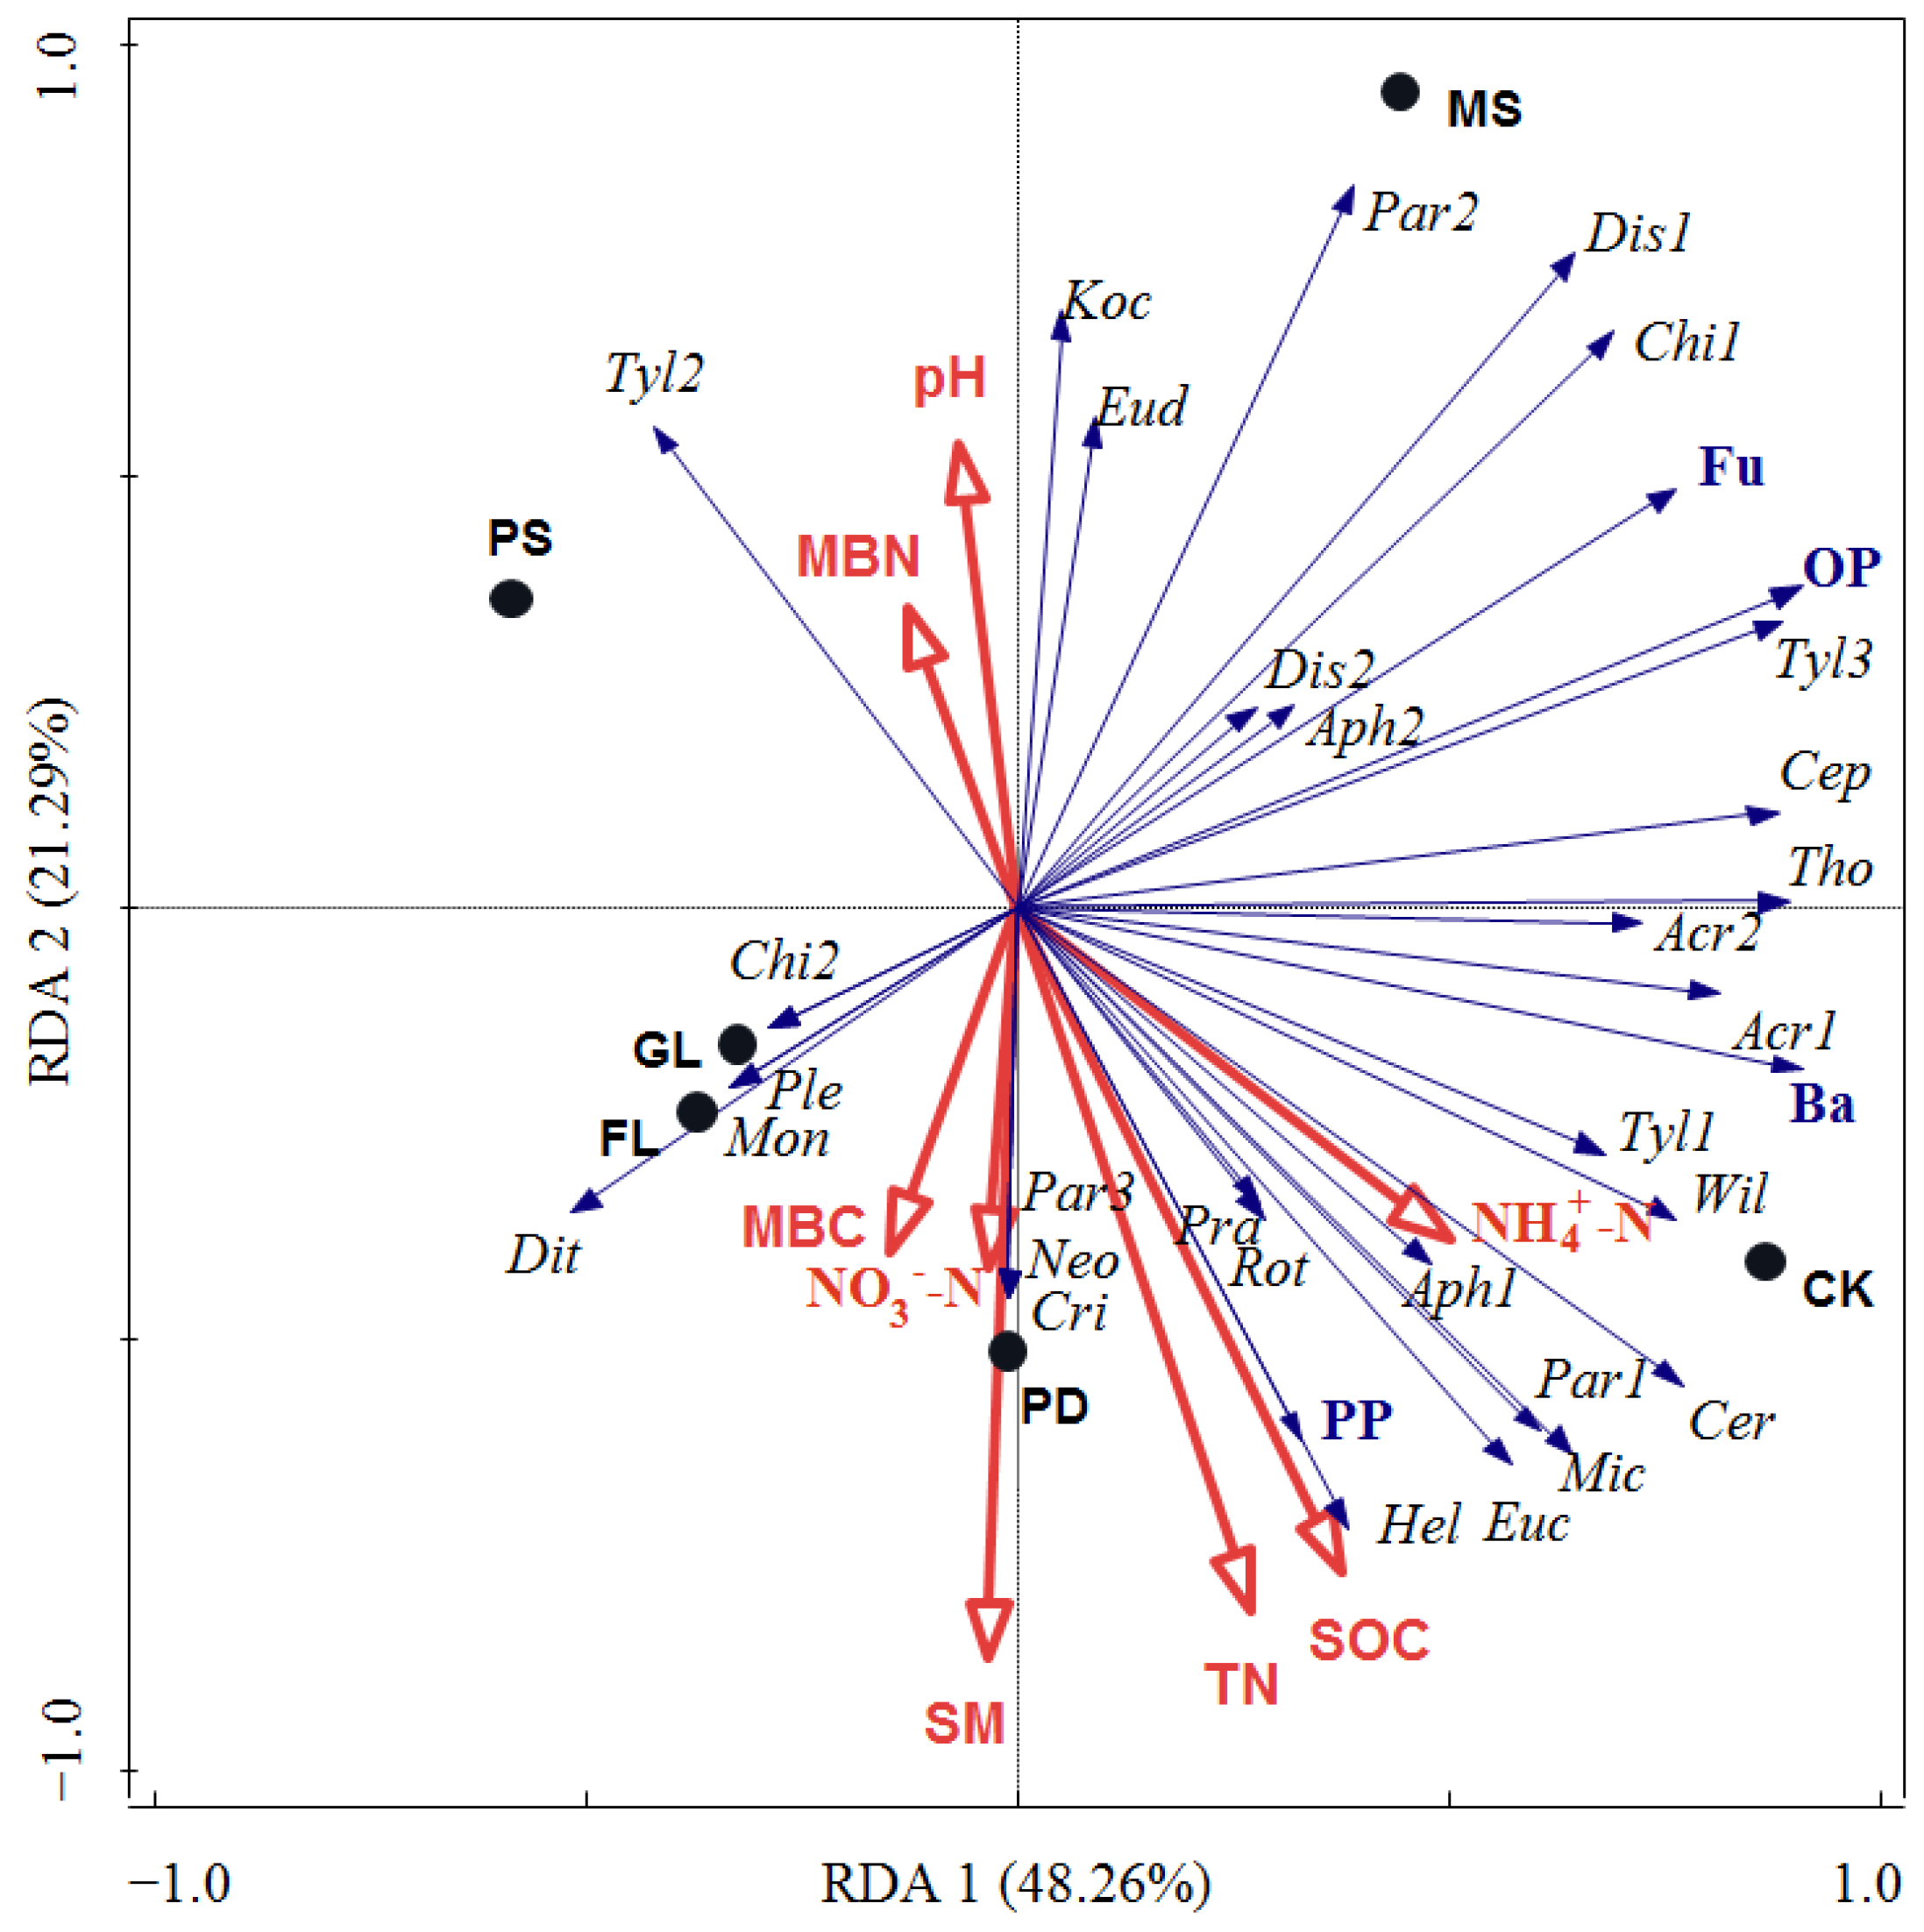
3.4. Relationships between Soil Nematode Communities and Physicochemical Properties

The redundancy analysis (RDA) indicated that the composition and structure of soil nematode communities varied greatly among different revegetation approaches, which could be partially attributed to changes in soil properties, specifically SOC, TN, NH4+-N, and SM content (Figure 4). The first two RDA axes explained 58.98% of the total variance (48.26% and 21.29% for the first and second axes, respectively) (Figure 4).
In the RDA diagram, the profile of the soil nematode community in GL did not differ significantly from that in FL (Figure 4). Soil nematode communities in the other sites varied significantly from those in FL, and they were also clearly separated from each other (Figure 4). Compared to FL, the CK forest had increased nematodes in all trophic groups, probably associated with the increased contents of SOC, TN, and NH4+-N. The PS forest led to a decrease in plant-parasitic and bacterivorous nematodes, and the PD forest induced a substantial increase in plant-parasitic nematodes, correlating with the changes in SOC, TN, and SM content (Figure 4). Artificial MS grassland mainly promoted the development of fungivores and omnivorous-predatory nematodes, accompanied by a decrease in SOC, TN, and SM contents (Figure 4).
Pearson correlation analysis further confirmed the correlations between soil physicochemical properties and nematode community characteristics (Table S1 in Supplementary Materials). The results showed that SOC and TN contents were positively correlated with the abundance of plant-feeding nematodes (p < 0.05) (Table S1 in Supplementary Materials). SOC and NH4+-N were also positively correlated with the H´ index of the nematode community. TN content showed positive correlations with NCR and PPI (p < 0.05) (Table S1 in Supplementary Materials). The NO3-N content was positively correlated with NCR while negatively correlated with EI (p < 0.05) (Table S1 in Supplementary Materials).

4. Discussion

4.1. Effects of Revegetation Approaches on Soil Physicochemical Properties

Compared to the farmland, soil properties (e.g., soil pH, moisture content, SOC, TN, and NH4+-N) were more or less improved in the naturally restored grassland GL and the two types of artificial forests (CK and PD) (Table 2). These results corroborate previous findings that in the semiarid area of the Loess Plateau, naturally restored grasslands and artificial forests have been more effective in improving soil physicochemical properties than artificial grasslands [36,62], because their higher plant diversity and biomass can offer more abundant and diverse resources for the soil ecosystem [36,62,63]. However, in contrast to the CK and PD forests, the PS forest did not positively impact soil physicochemical properties, even going so far as to decrease SM, SOC, and MBC contents (Table 2). The negative impact of PS forest revegetation can be attributed to its poor improvement of the species diversity and biomass of understorey herbaceous plants [64,65]. Therefore, artificial forests with different constructive plant species can significantly affect soil physicochemical properties. Soil NO3-N content was lower in all sites with revegetation than in farmland, likely due to the cessation of fertilization.

4.2. Effects of Revegetation Approaches on Soil Nematode Community Characteristics

In the past several decades, the importance of soil nematodes in ecological monitoring and restoration assessment has been increasingly recognized [13,17,20,28]. However, although abandoning farmland for revegetation has been considered the principal land-use change on the Loess Plateau [31], its impact on soil nematode communities is seldom studied in this region. In our study, among the three types of artificial forests (CK, PD, and PS) and two types of grasslands (MS and GL), the composition, structure, and ecological indices of soil nematode communities differed distinctly (Figure 2; Table 3 and Table 4). Our results indicated the presence of significant changes in soil food web structure and function, thus suggesting a wide variation in soil ecosystem restoration under different revegetation approaches.
Among all revegetation approaches, the establishment of the CK forest led to the greatest improvement in the soil nematode community. C. korshinskii is one of the most important afforestation species on the Loess Plateau, having a well-developed root system and strong nitrogen fixation ability, thus showing resistance to environmental stress [66,67]. The planting of C. korshinskii can effectively accelerate the restoration of the herbaceous community [12,64], which enhances resource entry into the soil ecosystem and improves the food supply for soil organisms [66,68]. In the CK forest, a high abundance of nematodes at multiple trophic levels was observed (Table 3; Figure 2), particularly bacterivores, which are highly sensitive to soil resource conditions [25]. Congruently, in CK, nematode diversity at the genus (H’) and trophic (TD) levels and in MI, SI, and WI was higher than in FL. It was demonstrated that with the conversion from sloped farmland to CK forest, the soil food web became more species-rich, mature, and highly structured [69,70], contributing to the resilience of the soil ecosystem functions [20,60].
In contrast to CK forest, PS forest induced no significant effect on nematode abundance and community characteristics, probably because P. sibirica was not as effective as C. korshinskii for prompting herbaceous community restoration and improving soil resource availability [64,65], which limits the available resources for soil organisms, especially bacterivores, thus leading to poor improvement on soil food web restoration.
Unlike the CK and PS forests, the PD forest induced a substantial increase in plant-feeding nematodes, specifically Pratylenchus. The nematode genus has been considered one of the most destructive below-ground herbivores for various economically important plants [71], often having outbreaks in apricot orchards, resulting in serious root injury and replant diseases [26,72]. These results imply that converting sloped farmland into PD forest may significantly increase the risk of infestation by plant-feeding nematodes, leading to complex impacts on the soil ecosystem [73,74,75]. On one hand, the infestation of plant-feeding nematodes leads to nutrient leakage from roots through mechanical injury [19,76], which may explain the improvement in soil physicochemical properties and the increase in bacterial-feeding nematodes in PD forests. On the other hand, the high dominance of plant-feeding nematodes (48.35%) significantly lowered the trophic diversity and structural complexity of the nematode community (as indicated by TD and SI), leading to the low values of MI and WI with the high values of PPI and PPI/MI. These changes indicated a deteriorated soil food web [17,22], implying poor restoration of the soil ecosystem in the PD forest [17,22,74,75].
Compared to FL, artificial MS grassland did not significantly affect soil properties but increased the abundance of bacterivorous, fungivorous, and omnivorous-predatory nematodes, leading to beneficial impacts on soil food web restoration. The abundance of fungivores increased the most significantly, especially those belonging to the functional guild of c-p 4 (e.g., Tylencholaimus), probably due to their feeding preference for arbuscular mycorrhizal fungi (AMF) [77]. It is well known that AMF can form asymbiotes with leguminous grasses (such as M. sativa) and exist abundantly in MS grasslands, which enhances the food resources for fungivorous nematodes (i.e., the c-p 4 functional guild) [77] and beneficially affects omnivorous-predatory nematodes. The highest TD, MI, and WI values were also found in the MS grassland, indicating a highly mature soil food web and healthy soil conditions [17,20,60].
In contrast to artificial MS grassland, naturally restored grassland (GL) greatly improved soil physicochemical properties but did not significantly influence the nematode community. It has been reported that in loess-hilly areas, natural grassland succession can effectively improve soil physicochemical properties and induce a shift in microbial communities through bottom-up effects [36,37,65,78,79]. However, in natural habitats, top-down predation is also one of the major driving forces of the soil food web [80,81]. The omnivorous-predatory nematodes, as well as predators of nematodes in other soil taxa (e.g., amoebae and mites), probably have an impact on the soil nematode community through the predator-prey channel [80,81], which may mitigate the bottom-up effects mediated by soil properties. Generally, the changes in soil nematode communities indicated that the conversion of farmland to CK forest and MS grassland showed more significant improvements in the soil food web and ecosystem restoration than other revegetation approaches. Nematode faunal analysis also showed that the profiles of nematode communities in PS, PD, and FL were plotted in quadrant D (Figure 3), implying the presence of deteriorated soil ecosystems in these sites [60]. In contrast, the nematode communities in CK, MS, and GL were located in quadrant C, with the former two having higher SI values (Figure 3), which indicated highly structured soil food webs and a stable soil environment [60].

4.3. Driving Forces of Soil Nematode Communities under Different Revegetation Approaches

RDA and correlation analysis demonstrated that the variations in the composition, structure, and ecological indices of nematode communities could be partially attributed to the changes in soil physicochemical properties, specifically SOC, TN, NH4+-N, and SM content (Figure 4; Table S1 in Supplementary Materials). This result suggested the importance of soil properties in regulating soil food webs under all revegetation approaches. Notably, in the CK forest, the great improvement in SOC and NH4+-N content could positively affect the abundance and activities of soil microbes [36,66], as well as their predators, namely, bacterivorous and fungivorous nematodes (i.e., Cervidellus, Acrobeles, and Tylencholaimus), and might further facilitate the development of nematodes at higher trophic levels (e.g., omnivores-predators). Conversely, in the PS forest, the low levels of soil moisture content and resource availability might be responsible for the low individual abundance and deteriorated status of the nematode community. Therefore, it was suggested that the bottom-up effects of vegetation mediated by soil properties might be a strong driver of soil food web structure and function under the two revegetation approaches [13,25,82].
In PD forest and MS grassland, the alterations in soil nematode communities were not significantly related to changes in soil properties but rather highly dependent on the outbreak of a particular genus that feeds on roots (or root symbiotic fungi). The planting of P. davidiana induced a substantial increase in the Pratylenchus genus and thus led to a dominance of plant-feeding nematodes, which negatively affected the structure and functioning of the soil food web and resulted in poor restoration of the soil ecosystem [27,83]. In MS grassland, abundant fungivorous nematodes, specifically Tylencholaimus, were potentially associated with the widespread symbiosis of M. sativa grass with AMF [77,79]. The high abundance of fungivorous nematodes could increase omnivorous-predatory nematodes and improve the restoration of the soil food web. Therefore, in artificial forests and grasslands, the host-parasite relationships between constructive plant species (or their symbiotic fungi) and particular nematode genera should be noted, which are likely to play key roles in regulating bottom-up forces from vegetation on soil food webs [19,77,79,84]. However, this inference requires further investigation.
In GL grassland, the driving forces of the soil food web might be more complex. It has been reported that in natural habitats, both bottom-up forces of vegetation and top-down control of predators are strong drivers of soil nematode communities [80,85]. Natural grassland succession can effectively improve soil resource availability [36], which could positively impact soil microbes and nematodes at multi-trophic levels through bottom-up effects [13]. However, the increased top-down predation pressure might also be exerted on nematode communities by omnivorous-predatory nematodes and organisms that were not investigated in the present study, such as amoebae and mites [80,85]. As a result of the combined effects of bottom-up and top-down forces, the characteristics of the soil nematode community in GL varied little from those in FL.
Through analyzing nematode community characteristics and their relationships with soil properties, our study implied a wide variation in the driving forces of soil food webs under different revegetation approaches in the semiarid area of the Loess Plateau. Consistent with previous research in temperate forests and grasslands [9,10,36], our results indicated the importance of the bottom-up effects of vegetation under all revegetation approaches and further suggested that soil properties and root herbivory or symbiosis (e.g., AMF) might mediate these effects. In addition, both bottom-up and top-down control might be strong driving forces for soil nematode communities under natural revegetation.
It is worth noting that in our study, soil nematodes were identified to the genus level. However, for some nematode genera (e.g., Ditylenchus), their species composition can have a great impact on soil food web. Therefore, here, we plan to reach identification of soil nematodes at the species level by the use of both morphological identification and high-throughput sequencing methods. Our results will provide more information on soil monitoring after restoration under revegetation approaches on the Loess Plateau, and also contribute to the standardization of an identification method for soil nematodes.
It should also be noted that the indices of nematode dispersion were not applied in our study since various nematode ecological indices have been used to assess soil ecosystem status from multiple perspectives. However, in our further studies, the application of a dispersion index such as Taylor’s power law should be considered to explore nematode dispersion patterns for specific taxonomic/functional groups and entire communities [86]. This can facilitate a better understanding of the spatial and temporal distribution patterns of soil nematodes. Meanwhile, the nematode dispersion index is useful in determining transformations of nematode counts to meet assumptions necessary for parametric statistical analyses as well as in developing nematode sampling methodology [87]. Guided by previous findings [87], we can optimize the sampling plan in further studies by implementing several methods, including increasing the number of sampling sites under different revegetation approaches, collecting soil samples at different depths in different seasons, and utilizing a standardized sampling device. These methods help to obtain more comprehensive and representative soil samples, thereby enhancing the accuracy and reliability of the dispersion index.

5. Conclusions

The composition, structure, and ecological indices of soil nematode communities greatly varied under different revegetation approaches in the semiarid area of the Loess Plateau, which can be more informative than soil properties for reflecting soil ecosystem restoration and providing valuable information about the driving forces of soil food webs. Compared to the FL, the CK forest positively impacted the soil nematode community, as indicated by the high individual abundance, reasonable structure, and ideal ecological indices (e.g., H’, SR, TD, etc.) of nematode communities. The beneficial impacts of CK forest on the soil nematode community could be associated with improving multiple soil properties, particularly SOC and NH4+-N content. In contrast, the PS forest improved neither soil properties nor nematode community characteristics. Our results elucidated the importance of soil properties in mediating the bottom-up effects of vegetation on nematode communities under these two revegetation approaches. In PD forest and MS grassland, however, the promotion of constructive plant species for particular herbivorous or fungivorous nematode genera (those feeding on roots or symbiotic fungi) may be more vital in regulating soil food webs. In addition, in GL grassland, the characteristics of the nematode community varied little, while soil properties differed significantly from those in FL, probably because both bottom-up and top-down control were important drivers of the soil food web under natural revegetation, leading to complex impacts on soil ecosystem restoration. Our results can offer valuable insights into the mechanisms that underlie revegetation effects on soil ecosystems and provide scientific recommendations for vegetation restoration and land use management in arid and semiarid environments.

Supplementary Materials

The following supporting information can be downloaded at: https://www.mdpi.com/article/10.3390/f14091886/s1. Materials and Methods: 1. High-throughput Sequencing Analysis of the Soil Nematode Community. Table S1: Pearson correlation coefficients between soil nematode community characteristics and soil physicochemical properties. Refs. [88,89,90,91] are cited in the supplementary materials.

Author Contributions

Conceptualization, J.H., G.L. and N.H.; methodology, J.H. and G.L.; validation, J.H.; investigation, J.H., T.H., J.C., Z.W. and N.H.; resources, J.H. and G.L.; data curation, J.H. and N.H.; writing—original draft preparation, J.H. and T.H.; writing—review and editing, J.H. and G.L.; visualization, Z.W. and N.H.; supervision, J.H. and G.L.; project administration, J.H.; funding acquisition, J.H. and G.L. All authors have read and agreed to the published version of the manuscript.

Funding

This research was funded by the National Natural Science Foundation of China (grant numbers 31500449 and 31971488) and Joint Funds of the National Natural Science Foundation of China (grant number U2243225).

Data Availability Statement

Data is contained within the article.

Acknowledgments

The contributions of Nan Wang, Dezhou Geng, and Xinyue Zhang in carrying out the experiment are gratefully acknowledged.

Conflicts of Interest

The authors declare no conflict of interest.

References

  1. Smith, P.; House, J.I.; Bustamante, M.; Sobocká, J.; Harper, R.; Pan, G.; West, P.C.; Clark, J.M.; Adhya, T.; Rumpel, C.; et al. Global change pressures on soils from land use and management. Glob. Chang. Biol. 2016, 22, 1008–1028. [Google Scholar] [CrossRef] [PubMed]
  2. Jia, X.; Wang, X.; Hou, L.; Wei, X.; Zhang, Y.; Shao, M.; Zhao, X. Variable response of inorganic carbon and consistent increase of organic carbon as a consequence of afforestation in areas with semiarid soils. Land Degrad. Dev. 2019, 30, 1345–1356. [Google Scholar] [CrossRef]
  3. Bullock, J.M.; Aronson, J.; Newton, A.C.; Pywell, R.F.; Rey-Benayas, J.M. Restoration of ecosystem services and biodiversity: Conflicts and opportunities. Trends Ecol. Evol. 2011, 26, 541–549. [Google Scholar] [CrossRef] [PubMed]
  4. Harris, J.A. Measurements of the soil microbial community for estimating the success of restoration. Eur. J. Soil Sci. 2003, 54, 801–808. [Google Scholar] [CrossRef]
  5. Khorchani, M.; Nadal-Romero, E.; Lasanta, T.; Tague, C. Carbon sequestration and water yield tradeoffs following restoration of abandoned agricultural lands in Mediterranean mountains. Environ. Res. 2022, 207, 112203. [Google Scholar] [CrossRef]
  6. Azeria, E.T.; Santala, K.; McIntosh, A.C.S.; Aubin, I. Plant traits as indicators of recovery of reclaimed wellsites in forested areas: Slow but directional succession trajectory. For. Ecol. Manag. 2020, 468, 118180. [Google Scholar] [CrossRef]
  7. Bai, X.; Zhao, W.; Wang, J.; Ferreira, C.S.S. Reducing plant community variability and improving resilience for sustainable restoration of temperate grassland. Environ. Res 2022, 207, 112149. [Google Scholar] [CrossRef]
  8. Fu, D.; Wu, X.; Qiu, Q.; Duan, C.; Jones, D.L. Seasonal variations in soil microbial communities under different land restoration types in a subtropical mountains region, Southwest China. Appl. Soil Ecol. 2020, 153, 103634. [Google Scholar] [CrossRef]
  9. Kardol, P.; De Deyn, G.B.; Laliberté, E.; Mariotte, P.; Hawkes, C.V. Biotic plant–soil feedbacks across temporal scales. J. Ecol. 2013, 101, 309–315. [Google Scholar] [CrossRef]
  10. Frouz, J.; Toyota, A.; Mudrák, O.; Jílková, V.; Filipová, A.; Cajthaml, T. Effects of soil substrate quality, microbial diversity and community composition on the plant community during primary succession. Soil Biol. Biochem. 2016, 99, 75–84. [Google Scholar] [CrossRef]
  11. Korthals, G.W.; Smilauer, P.; Van Dijk, C.; Van Der Putten, W.H. Linking above- and below-ground biodiversity: Abundance and trophic complexity in soil as a response to experimental plant communities on abandoned arable land. Funct. Ecol. 2001, 15, 506–514. [Google Scholar] [CrossRef]
  12. Liu, Y.; Fang, Y.; An, S. How C:N:P stoichiometry in soils and plants responds to succession in Robinia pseudoacacia forests on the Loess Plateau, China. For. Ecol. Manag. 2020, 475, 118394. [Google Scholar] [CrossRef]
  13. Zhang, X.; Guan, P.; Wang, Y.; Li, Q.; Zhang, S.; Zhang, Z.; Bezemer, T.M.; Liang, W. Community composition, diversity and metabolic footprints of soil nematodes in differently-aged temperate forests. Soil Biol. Biochem. 2015, 80, 118–126. [Google Scholar] [CrossRef]
  14. Van Der Heijden, M.G.A.; Bardgett, R.D.; Van Straalen, N.M. The unseen majority: Soil microbes as drivers of plant diversity and productivity in terrestrial ecosystems. Ecol. Lett. 2008, 11, 296–310. [Google Scholar] [CrossRef]
  15. van der Putten, W.H.; Bradford, M.A.; Pernilla Brinkman, E.; van de Voorde, T.F.J.; Veen, G.F. Where, when and how plant–soil feedback matters in a changing world. Funct. Ecol. 2016, 30, 1109–1121. [Google Scholar] [CrossRef]
  16. Bongers, T.; Ferris, H. Nematode community structure as a bioindicator in environmental monitoring. Trends Ecol. Evol. 1999, 14, 224–228. [Google Scholar] [CrossRef] [PubMed]
  17. Yeates, G.W. Nematodes as soil indicators: Functional and biodiversity aspects. Biol. Fertil. Soils 2003, 37, 199–210. [Google Scholar] [CrossRef]
  18. Yeates, G.W.; Bongers, T.; De Goede, R.G.; Freckman, D.W.; Georgieva, S.S. Feeding habits in soil nematode families and genera-an outline for soil ecologists. J. Nematol. 1993, 25, 315–331. [Google Scholar] [PubMed]
  19. Bardgett, R.D.; Cook, R.; Yeates, G.W.; Denton, C.S. The influence of nematodes on below-ground processes in grassland ecosystems. Plant Soil 1999, 212, 23–33. [Google Scholar] [CrossRef]
  20. Ekschmitt, K.; Bakonyi, G.; Bongers, M.; Bongers, T.; Boström, S.; Dogan, H.; Harrison, A.; Nagy, P.; O’Donnell, A.G.; Papatheodorou, E.M.; et al. Nematode community structure as indicator of soil functioning in European grassland soils. Eur. J. Soil Biol. 2001, 37, 263–268. [Google Scholar] [CrossRef]
  21. Ritz, K.; Trudgill, D.L. Utility of nematode community analysis as an integrated measure of the functional state of soils: Perspectives and challenges. Plant Soil 1999, 212, 1–11. [Google Scholar] [CrossRef]
  22. Bongers, T. The maturity index: An ecological measure of environmental disturbance based on nematode species composition. Oecologia 1990, 83, 14–19. [Google Scholar] [CrossRef]
  23. Urzelai, A.; Hernández, A.J.; Pastor, J. Biotic indices based on soil nematode communities for assessing soil quality in terrestrial ecosystems. Sci. Total Environ. 2000, 247, 253–261. [Google Scholar] [CrossRef] [PubMed]
  24. da Silva, J.V.C.d.L.; Hirschfeld, M.N.C.; Cares, J.E.; Esteves, A.M. Land use, soil properties and climate variables influence the nematode communities in the Caatinga dry forest. Appl. Soil Ecol. 2020, 150, 103474. [Google Scholar] [CrossRef]
  25. Guan, P.; Zhang, X.; Yu, J.; Ma, N.; Liang, W. Variation of soil nematode community composition with increasing sand-fixation year of Caragana microphylla: Bioindication for desertification restoration. Ecol. Eng. 2015, 81, 93–101. [Google Scholar] [CrossRef]
  26. Li, X.Y.; Liu, Q.Z.; Wang, Y.Z.; Sun, H.Y.; Bai, C.Q.; Lewis, E.E. Different changes of soil nematode communities in replant and continuous-planting peach orchards and their indicative value for peach replant problem. Helminthologia 2015, 52, 261–269. [Google Scholar] [CrossRef]
  27. Coffey, V.; Otfinowski, R. Legacies of afforestation on soil nematode community composition, structure, and diversity in a northern Canadian prairie. Plant Soil 2019, 435, 437–447. [Google Scholar] [CrossRef]
  28. Vink, S.N.; Bienkowski, D.; Roberts, D.M.; Daniell, T.J.; Neilson, R. Impact of land use and management practices on soil nematode communities of Machair, a low-input calcareous ecosystem of conservation importance. Sci. Total Environ. 2020, 738, 140164. [Google Scholar] [CrossRef]
  29. Huo, N.; Zhao, S.; Huang, J.; Geng, D.; Wang, N.; Yang, P. Seasonal Stabilities of Soil Nematode Communities and Their Relationships with Environmental Factors in Different Temperate Forest Types on the Chinese Loess Plateau. Forests 2021, 12, 246. [Google Scholar] [CrossRef]
  30. Kardol, P.; De Long, J. How anthropogenic shifts in plant community composition alter soil food webs [version 1; peer review: 2 approved]. F1000Research 2018, 7, 4. [Google Scholar] [CrossRef]
  31. Deng, L.; Shangguan, Z.-p.; Sweeney, S. “Grain for Green” driven land use change and carbon sequestration on the Loess Plateau, China. Sci. Rep. 2014, 4, 7039. [Google Scholar] [CrossRef] [PubMed]
  32. Yang, Y.; Dou, Y.; Huang, Y.; An, S. Links between Soil Fungal Diversity and Plant and Soil Properties on the Loess Plateau. Front. Microbiol. 2017, 8, 2198. [Google Scholar] [CrossRef] [PubMed]
  33. Gong, C.; Tan, Q.; Liu, G.; Xu, M. Impacts of species mixture on soil nitrogen stocks in the Loess Plateau of China. For. Ecol. Manag. 2021, 491, 119145. [Google Scholar] [CrossRef]
  34. Li, G.; Huang, J.; Guo, H.; Du, S. Projecting species loss and turnover under climate change for 111 Chinese tree species. For. Ecol. Manag. 2020, 477, 118488. [Google Scholar] [CrossRef]
  35. Yu, Y.; Zhao, W.; Martinez-Murillo, J.F.; Pereira, P. Loess Plateau: From degradation to restoration. Sci. Total Environ. 2020, 738, 140206. [Google Scholar] [CrossRef]
  36. Zhang, C.; Liu, G.; Xue, S.; Wang, G. Soil bacterial community dynamics reflect changes in plant community and soil properties during the secondary succession of abandoned farmland in the Loess Plateau. Soil Biol. Biochem. 2016, 97, 40–49. [Google Scholar] [CrossRef]
  37. Guo, Y.; Hou, L.; Zhang, Z.; Zhang, J.; Cheng, J.; Wei, G.; Lin, Y. Soil microbial diversity during 30 years of grassland restoration on the Loess Plateau, China: Tight linkages with plant diversity. Land Degrad. Dev. 2019, 30, 1172–1182. [Google Scholar] [CrossRef]
  38. Li, G.; Zhang, X.; Huang, J.; Wen, Z.; Du, S. Afforestation and climatic niche dynamics of black locust (Robinia pseudoacacia). For. Ecol. Manag. 2018, 407, 184–190. [Google Scholar] [CrossRef]
  39. Liu, Y.; Chen, X.; Liu, J.; Liu, T.; Cheng, J.; Wei, G.; Lin, Y. Temporal and spatial succession and dynamics of soil fungal communities in restored grassland on the Loess Plateau in China. Land Degrad. Dev. 2019, 30, 1273–1287. [Google Scholar] [CrossRef]
  40. Zeng, Q.; An, S.; Liu, Y. Soil bacterial community response to vegetation succession after fencing in the grassland of China. Sci. Total Environ. 2017, 609, 2–10. [Google Scholar] [CrossRef]
  41. Zhao, Y.; Zou, X.; Zhang, J.; Cao, L.; Xu, X.; Zhang, K.; Chen, Y. Spatio-temporal variation of reference evapotranspiration and aridity index in the Loess Plateau Region of China, during 1961–2012. Quat. Int. 2014, 349, 196–206. [Google Scholar] [CrossRef]
  42. Jia, X.; Zhao, C.; Wang, Y.; Zhu, Y.; Wei, X.; Shao, M. Traditional dry soil layer index method overestimates soil desiccation severity following conversion of cropland into forest and grassland on China’s Loess Plateau. Agric. Ecosyst. Environ. 2020, 291, 106794. [Google Scholar] [CrossRef]
  43. Wen, M.; Cheng, D.; Song, J.; Zhang, G.; Lai, W.; Jiang, W. Impacts of climate change on aridity index and its spatiotemporal variation in the Loess Plateau of China, from 1961 to 2014. Environ. Earth Sci. 2018, 77, 137. [Google Scholar] [CrossRef]
  44. Bremner, J.M. Determination of nitrogen in soil by the Kjeldahl method. J. Agric. Sci. 1960, 55, 11–33. [Google Scholar] [CrossRef]
  45. Brookes, P.C.; Landman, A.; Pruden, G.; Jenkinson, D.S. Chloroform fumigation and the release of soil nitrogen: A rapid direct extraction method to measure microbial biomass nitrogen in soil. Soil Biol. Biochem. 1985, 17, 837–842. [Google Scholar] [CrossRef]
  46. Wu, J.; O’Donnell, A.G.; He, Z.L.; Syers, J.K. Fumigation-extraction method for the measurement of soil microbial biomass-S. Soil Biol. Biochem. 1994, 26, 117–125. [Google Scholar] [CrossRef]
  47. Vance, E.D.; Brookes, P.C.; Jenkinson, D.S. An extraction method for measuring soil microbial biomass C. Soil Biol. Biochem. 1987, 19, 703–707. [Google Scholar] [CrossRef]
  48. Liu, M.; Chen, X.; Qin, J.; Wang, D.; Griffiths, B.; Hu, F. A sequential extraction procedure reveals that water management affects soil nematode communities in paddy fields. Appl. Soil Ecol. 2008, 40, 250–259. [Google Scholar] [CrossRef]
  49. Bongers, A.M.T. De Nematoden Van Nederland; Pirota Schoorl, Bibliotheek uitgave KNNV, nr. 46: Utrecht, The Netherlands, 1988; 408p. [Google Scholar]
  50. Ahmad, W.; Jairajpuri, M.S. Mononchida: The Predaceous Nematodes (Nematology Monographs and Perspectives 7); Brill Academic Publishers: Leiden, The Netherlands, 2010. [Google Scholar]
  51. Geisen, S.; Snoek, L.B.; ten Hooven, F.C.; Duyts, H.; Kostenko, O.; Bloem, J.; Martens, H.; Quist, C.W.; Helder, J.A.; van der Putten, W.H. Integrating quantitative morphological and qualitative molecular methods to analyse soil nematode community responses to plant range expansion. Methods Ecol. Evol. 2018, 9, 1366–1378. [Google Scholar] [CrossRef]
  52. Bongers, T.; Bongers, M. Functional diversity of nematodes. Appl. Soil Ecol. 1998, 10, 239–251. [Google Scholar] [CrossRef]
  53. Shannon, C.E.; Weaver, W. The Mathematical Theory of Communication; University of Illinois Press: Champaign, IL, USA, 1949; Volume 60, p. 144. [Google Scholar]
  54. Pielou, E.C. The measurement of diversity in different types of biological collections. J. Theor. Biol. 1967, 15, 177. [Google Scholar] [CrossRef]
  55. Simpson, E.H. Measurement of Diversity. Nature 1949, 163, 688. [Google Scholar] [CrossRef]
  56. Margalef, R. La teoria de la informacion en ecologia. Mem. Real Acad. Cienc. Artes Barc. 1957, 32, 373–449. [Google Scholar]
  57. Heip, C. Biota and abiotic environment in the Westerschelde estuary. Hydrobiol. Bull. 1988, 22, 31–34. [Google Scholar] [CrossRef]
  58. Bongers, T.; van der Meulen, H.; Korthals, G. Inverse relationship between the nematode maturity index and plant parasite index under enriched nutrient conditions. Appl. Soil Ecol. 1997, 6, 195–199. [Google Scholar] [CrossRef]
  59. Wasilewska, L. The effect of age of meadows on succession and diversity in soil nematode communities. Pedobiologia 1994, 38, 1–11. [Google Scholar]
  60. Ferris, H.; Bongers, T.; de Goede, R.G.M. A framework for soil food web diagnostics: Extension of the nematode faunal analysis concept. Appl. Soil Ecol. 2001, 18, 13–29. [Google Scholar] [CrossRef]
  61. ter Braak, C.; Šmilauer, P. Canoco Reference Manual and User’s Guide: Software of Ordination, version 5.0; Microcomputer Power: Ithaca, NY, USA, 2012. [Google Scholar]
  62. Wang, Z.; Guo, S.; Sun, Q.; Li, N.; Jiang, J.; Wang, R.; Zhang, Y.; Liu, Q.; Wu, D.; Li, R.; et al. Soil organic carbon sequestration potential of artificial and natural vegetation in the hilly regions of Loess Plateau. Ecol. Eng. 2015, 82, 547–554. [Google Scholar] [CrossRef]
  63. Fang, X.; Xue, Z.; Li, B.; An, S. Soil organic carbon distribution in relation to land use and its storage in a small watershed of the Loess Plateau, China. Catena 2012, 88, 6–13. [Google Scholar] [CrossRef]
  64. Fu, B.J.; Liu, S.L.; Ma, K.M.; Zhu, Y.G. Relationships between soil characteristics, topography and plant diversity in a heterogeneous deciduous broad-leaved forest near Beijing, China. Plant Soil 2004, 261, 47–54. [Google Scholar] [CrossRef]
  65. Liu, Y.; Zhu, G.; Hai, X.; Li, J.; Shangguan, Z.; Peng, C.; Deng, L. Long-term forest succession improves plant diversity and soil quality but not significantly increase soil microbial diversity: Evidence from the Loess Plateau. Ecol. Eng. 2020, 142, 105631. [Google Scholar] [CrossRef]
  66. Jia, G.-M.; Liu, B.-R.; Wang, G.; Zhang, B. The microbial biomass and activity in soil with shrub (Caragana korshinskii K.) plantation in the semi-arid loess plateau in China. Eur. J. Soil Biol. 2010, 46, 6–10. [Google Scholar] [CrossRef]
  67. She, D.; Xia, Y.; Shao, M.; Peng, S.; Yu, S. Transpiration and canopy conductance of Caragana korshinskii trees in response to soil moisture in sand land of China. Agrofor. Syst. 2013, 87, 667–678. [Google Scholar] [CrossRef]
  68. Cao, C.; Jiang, D.; Teng, X.; Jiang, Y.; Liang, W.; Cui, Z. Soil chemical and microbiological properties along a chronosequence of Caragana microphylla Lam. plantations in the Horqin sandy land of Northeast China. Appl. Soil Ecol. 2008, 40, 78–85. [Google Scholar] [CrossRef]
  69. De Deyn, G.B.; Raaijmakers, C.E.; van Ruijven, J.; Berendse, F.; van der Putten, W.H. Plant species identity and diversity effects on different trophic levels of nematodes in the soil food web. Oikos 2004, 106, 576–586. [Google Scholar] [CrossRef]
  70. Ferris, H.; Matute, M.M. Structural and functional succession in the nematode fauna of a soil food web. Appl. Soil Ecol. 2003, 23, 93–110. [Google Scholar] [CrossRef]
  71. Yeates, G.W.; Hawke, M.F.; Rijkse, W.C. Changes in soil fauna and soil conditions under Pinus radiata agroforestry regimes during a 25-year tree rotation. Biol. Fertil. Soils 2000, 31, 391–406. [Google Scholar] [CrossRef]
  72. Khan, A.; Shaukat, S.S. Plant nematodes associated with almond seedlings in Kalat District, Balochistan. Pak. J. Zool. 2016, 48, 1579–1580. [Google Scholar]
  73. Baxter, C.; Rowan, J.S.; Mckenzie, B.M.; Neilson, R. Understanding soil erosion impacts in temperate agroecosystems: Bridging the gap between geomorphology and soil ecology using nematodes as a model organism. Biogeosciences 2013, 10, 7133–7145. [Google Scholar] [CrossRef]
  74. Stefanovska, T.; Skwiercz, A.; Zouhar, M.; Pidlisnyuk, V.; Zhukov, O. Plant-feeding nematodes associated with Miscanthus × giganteus and their use as potential indicators of the plantations’ state. Int. J. Environ. Sci. Technol. 2021, 18, 57–72. [Google Scholar] [CrossRef]
  75. Verschoor, B.C.; Pronk, T.E.; De Goede, R.G.M.; Brussaard, L. Could plant-feeding nematodes affect the competition between grass species during succession in grasslands under restoration management? J. Ecol. 2002, 90, 753–761. [Google Scholar] [CrossRef]
  76. Brinkman, E.P.; Duyts, H.; Karssen, G.; van der Stoel, C.D.; van der Putten, W.H. Plant-feeding nematodes in coastal sand dunes: Occurrence, host specificity and effects on plant growth. Plant Soil 2015, 397, 17–30. [Google Scholar] [CrossRef]
  77. Cesarz, S.; Reich, P.B.; Scheu, S.; Ruess, L.; Schaefer, M.; Eisenhauer, N. Nematode functional guilds, not trophic groups, reflect shifts in soil food webs and processes in response to interacting global change factors. Pedobiologia 2015, 58, 23–32. [Google Scholar] [CrossRef]
  78. Guo, Y.; Chen, X.; Wu, Y.; Zhang, L.; Cheng, J.; Wei, G.; Lin, Y. Natural revegetation of a semiarid habitat alters taxonomic and functional diversity of soil microbial communities. Sci. Total Environ. 2018, 635, 598–606. [Google Scholar] [CrossRef]
  79. Zhang, C.; Liu, G.; Song, Z.; Qu, D.; Fang, L.; Deng, L. Natural succession on abandoned cropland effectively decreases the soil erodibility and improves the fungal diversity. Ecol. Appl. 2017, 27, 2142–2154. [Google Scholar] [CrossRef] [PubMed]
  80. Kardol, P.; Newton, J.S.; Bezemer, T.M.; Maraun, M.; van der Putten, W.H. Contrasting diversity patterns of soil mites and nematodes in secondary succession. Acta Oecol. 2009, 35, 603–609. [Google Scholar] [CrossRef]
  81. Neilson, R.; Caul, S.; Fraser, F.C.; King, D.; Mitchell, S.M.; Roberts, D.M.; Giles, M.E. Microbial community size is a potential predictor of nematode functional group in limed grasslands. Appl. Soil Ecol. 2020, 156, 103702. [Google Scholar] [CrossRef]
  82. Ciobanu, M.; Popovici, I.; Zhao, J.; Stoica, I.-A. Patterns of relative magnitudes of soil energy channels and their relationships with environmental factors in different ecosystems in Romania. Sci. Rep. 2015, 5, 17606. [Google Scholar] [CrossRef]
  83. Ferris, H.; Sánchez-Moreno, S.; Brennan, E.B. Structure, functions and interguild relationships of the soil nematode assemblage in organic vegetable production. Appl. Soil Ecol. 2012, 61, 16–25. [Google Scholar] [CrossRef]
  84. Schöning, C.; Wurst, S. Positive effects of root-knot nematodes (Meloidogyne incognita) on nitrogen availability do not outweigh their negative effects on fitness in Nicotiana attenuata. Plant Soil 2016, 400, 381–390. [Google Scholar] [CrossRef]
  85. Wardle, D.A.; Williamson, W.M.; Yeates, G.W.; Bonner, K.I. Trickle-down effects of aboveground trophic cascades on the soil food web. Oikos 2005, 111, 348–358. [Google Scholar] [CrossRef]
  86. Taylor, R.A.J. Taylor’s Power Law: Order and Pattern in Nature; Academic Press: Cambridge, MA, USA, 2019. [Google Scholar]
  87. Abd-Elgawad, M.M.M. Optimizing Sampling and Extraction Methods for Plant-Parasitic and Entomopathogenic Nematodes. Plants 2021, 10, 629. [Google Scholar] [CrossRef] [PubMed]
  88. Caporaso, J.G.; Kuczynski, J.; Stombaugh, J.; Bittinger, K.; Bushman, F.D.; Costello, E.K.; Fierer, N.; Peña, A.G.; Goodrich, J.K.; Gordon, J.I.; et al. QIIME allows analysis of high-throughput community sequencing data. Nat. Methods 2010, 7, 335–336. [Google Scholar] [CrossRef] [PubMed]
  89. Magoč, T.; Salzberg, S.L. FLASH: Fast length adjustment of short reads to improve genome assemblies. Bioinformatics 2011, 27, 2957–2963. [Google Scholar] [CrossRef]
  90. Edgar, R.C. UPARSE: Highly accurate OTU sequences from microbial amplicon reads. Nat. Methods 2013, 10, 996–998. [Google Scholar] [CrossRef]
  91. Wang, Q.; Garrity, G.M.; Tiedje, J.M.; Cole, J.R. Naïve Bayesian Classifier for Rapid Assignment of rRNA Sequences into the New Bacterial Taxonomy. Appl. Environ. Microbiol. 2007, 73, 5261–5267. [Google Scholar] [CrossRef]
Figure 1. The locations of the study sites are Shanghuang Village, Yuanzhou County, Guyuan City, Ningxia Hui Autonomous Region, China. FL: sloped farmland; GL: naturally restored grassland; MS: artificial Medicago sativa grassland; CK: artificial Caragana korshinskii forest; PS: artificial Prunus sibirica forest; PD: artificial Prunus davidiana forest.
Forests 14 01886 g001
Figure 2. The total abundance of different trophic groups of soil nematode communities under different revegetation approaches (mean ± SE). Different lowercase letters above error bars indicate significant differences among sampling sites (p < 0.05). Ba: bacterivores; Fu: fungivores; PP: plant parasites; OP: omnivores-predators. The label meanings of sampling sites are explained in Figure 1.
Forests 14 01886 g002
Figure 3. Nematode faunal analysis under different revegetation approaches. The label meanings of sampling sites are explained in Figure 1.
Forests 14 01886 g003
Figure 4. Redundancy analysis (RDA) of the soil nematode community in relation to soil physicochemical properties. The label meanings of the sampling sites are explained in Figure 1. Ba: bacterivores; Fu: fungivores; PP: plant parasites; OP: omnivores-predators. SOC: soil organic carbon; SM: soil moisture; TN: total nitrogen; NH4+-N: soil ammonium nitrogen; NO3-N: soil nitrate nitrogen; MBC: microbial biomass carbon; MBN: microbial biomass nitrogen. Acr1: Acrobeles; Acr2: Acrobeloides; Cep: Cephalobus; Cer: Cervidellus; Chil: Chiloplacus; Euc: Eucephalobus; Chi2: Chiloplectus; Ple: Plectus; Wil: Wilsonema; Cri: Criconema; Dit: Ditylenchus; Hel: Helicotylenchus; Neo: Neopsilenchus; Par1: Paratylenchus; Pra: Pratylenchus; Rot: Rotylenchus; Tyl1: Tylenchorhynchus; Tyl2: Tylenchus; Aph1: Aphelenchoides; Aph2: Aphelenchus; Tyl3: Tylencholaimus; Eud: Eudorylaimus; Koc: Kochinema; Mic: Microdorylaimus; Par2: Paraxonchium; Tho: Thonus; Dis1: Discolaimium; Dis2: Discolaimus; Nyg: Nygolaimus; Par3: Paravulvus; Mon: Mononchus.
Forests 14 01886 g004
Table 1. The geographical features and vegetation characteristics of the sampling sites under different revegetation approaches.
Sampling SitesDominant Plant SpeciesPlanting TimeLongitudeLatitudeAltitude
(m)
FLCorn (Zea mays)/106°27′56″36°0′42″1583
GLT. mongolicus; S. bungeana; H. altaicus2004106°28′31″36°0′25″1681
MSM. sativa2005106°28′00″36°0′46″1593
CKC. korshinskii2005106°29′00″36°0′26″1652
PSP. sibirica2002106°28′06″36°0′38″1651
PDP. davidiana2004106°28′31″36°0′24″1670
The label meanings of sampling sites are explained in Figure 1.
Table 2. Soil physicochemical properties under different revegetation approaches (mean ± SE).
Sampling SitespHSM (%)SOC
(g/kg)
TN
(g/kg)
NH4+-N (mg/kg)NO3-N (mg/kg)MBC
(mg/kg)
MBN
(mg/kg)
FL8.15 ± 0.03 a13.66 ± 0.28 ab6.98 ± 0.15 b0.78 ± 0.02 ab0.75 ± 0.10 b2.92 ± 0.06 a628.61 ± 27.94 ab91.03 ± 3.68 ab
GL7.88 ± 0.12 b16.82 ± 0.50 a13.00 ± 0.59 a1.18 ± 0.17 ab1.72 ± 0.10 a0.23 ± 0.14 c739.57 ± 37.27 a39.97 ± 6.12 b
MS8.14 ± 0.02 a10.87 ± 0.18 b5.65 ± 0.31 c0.60 ± 0.03 b0.98 ± 0.09 ab0.19 ± 0.08 c428.42 ± 75.38 bc110.94 ± 14.15 a
CK7.98 ± 0.01 ab15.37 ± 0.16 ab13.74 ± 0.03 a1.18 ± 0.20 ab1.77 ± 0.35 a1.23 ± 0.40 b506.16 ± 11.46 b55.42 ± 17.40 ab
PS8.08 ± 0.02 ab12.66 ± 0.07 ab5.35 ± 0.29 c0.56 ± 0.04 b0.80 ± 0.08 ab0.11 ± 0.02 c342.40 ± 91.60 c100.18 ± 32.45 ab
PD8.00 ± 0.03 ab17.56 ± 2.31 a12.83 ± 0.27 a1.38 ± 0.04 a1.05 ± 0.24 ab0.51 ± 0.35 bc434.81 ± 34.66 bc118.94 ± 16.22 a
SM: soil moisture; SOC: soil organic carbon; TN: soil total nitrogen; NH4+-N: soil ammonium nitrogen; NO3-N: soil nitrate nitrogen; MBC: microbial biomass carbon; MBN: microbial biomass nitrogen. Different lowercase letters in the same column show statistically significant differences (p < 0.05) among revegetation approaches. The label meanings of the sampling sites are explained in Figure 1.
Table 3. The relative abundance (%) of nematode genera and the absolute abundance (inds./100 g dry soil) of soil nematodes under different revegetation approaches.
GenusTrophic Groupc-p ValueFLGLMSCKPSPD
AcrobelesBa216.8410.2617.8113.726.0020.89
AcrobeloidesBa22.114.272.831.811.002.67
CephalobusBa24.213.424.056.142.000.89
CervidellusBa212.639.404.4513.722.007.56
ChiloplacusBa21.050.005.262.172.000.00
ChiloplectusBa20.000.850.000.000.000.00
EucephalobusBa23.160.850.003.250.000.44
PlectusBa21.050.000.000.000.000.00
WilsoemaBa20.000.000.001.440.000.00
AphelenchoidesFu21.050.000.002.532.000.44
AphelenchusFu25.2617.099.3111.1935.008.89
TylencholaimusFu49.4712.8231.5815.885.006.67
DitylenchusPP223.1617.097.295.0517.0012.00
NeopsilenchusPP20.000.000.000.000.000.44
ParatylenchusPP20.001.710.005.781.001.78
TylenchusPP20.000.000.400.005.000.00
CriconemaPP30.000.000.000.000.000.44
HelicotylenchusPP32.114.270.402.892.001.33
PratylenchusPP311.507.696.484.698.0023.56
RotylenchusPP32.117.692.433.978.008.89
TylenchorhynchusPP32.110.000.400.720.000.44
EudorylaimusOm40.000.850.400.000.000.00
MicrodorylaimusOm40.000.000.000.360.000.44
KochinemaOm40.000.000.810.001.000.44
ThonusOm41.050.851.623.972.000.89
ParaxonchiumOm50.000.000.400.000.000.00
MononchusPr41.050.000.000.000.000.00
DiscolaimiumPr50.000.003.640.721.000.00
DiscolaimusPr50.000.000.400.000.000.44
NygolaimusPr50.000.850.000.000.000.00
ParavulvusPr50.000.000.000.000.000.44
Total genera number171619201721
Total nematode abundance49.18 ± 2.74 b55.00 ± 9.21 b116.26 ± 17.67 a138.10 ± 11.60 a49.43 ± 6.26 b105.00 ± 11.43 a
c-p value: colonizer-persister value; Ba: bacterivores; Fu: fungivores; PP: plant parasites; Om: omnivores; Pr: predators. Total nematode abundance data (inds./100 g dry soil) correspond to the mean ± SE. Different lowercase letters in the same line show statistically significant differences (p < 0.05) among revegetation approaches. The label meanings of sampling sites are explained in Figure 1.
Table 4. The ecological indices of soil nematode communities under different revegetation approaches (mean ± SE).
Ecological IndexFLGLMSCKPSPD
H’2.07 ± 0.12 b2.15 ± 0.10 b2.13 ± 0.19 b2.48 ± 0.13 a1.94 ± 0.22 b2.14 ± 0.07 b
J’0.88 ± 0.02 a0.89 ± 0.02 a0.83 ± 0.05 a0.88 ± 0.02 a0.82 ± 0.01 a0.83 ± 0.07 a
λ0.15 ± 0.02 ab0.14 ± 0.01 ab0.16 ± 0.03 ab0.11 ± 0.02 b0.21 ± 0.07 a0.15 ± 0.01 ab
SR2.49 ± 0.32 a2.58 ± 0.34 a2.62 ± 0.41 a3.25 ± 0.32 a2.56 ± 0.44 a2.67 ± 0.31 a
TD2.74 ± 0.04 ab2.84 ± 012 ab3.11 ± 0.14 a3.08 ± 0.02 a2.50 ± 0.22 b2.59 ± 0.11 ab
NCR0.72 ± 0.05 a0.51 ± 0.21 ab0.46 ± 0.01 b0.59 ± 0.05 ab0.21 ± 0.10 c0.67 ± 0.05 ab
WI1.38 ± 0.09 b1.54 ± 0.15 b4.67 ± 0.82 a3.13 ± 0.18 ab1.50 ± 0.46 b1.12 ± 0.29 b
MI1.41 ± 0.08 c1.54 ± 0.05 bc2.47 ± 0.56 a1.96 ± 0.13 b1.30 ± 0.38 c1.23 ± 0.42 c
PPI2.44 ± 0.02 b2.53 ± 0.13 ab2.52 ± 0.13 ab2.54 ± 0.15 ab2.43 ± 0.08 b2.71 ± 0.02 a
PPI/MI1.72 ± 0.05 ab1.67 ± 0.11 ab1.03 ± 0.07 b1.30 ± 0.30 b2.14 ± 0.51 a2.30 ± 0.27 a
Different lowercase letters indicate significant differences among revegetation approaches (p < 0.05). The label meanings of the sampling sites are explained in Figure 1. H’: Shannon diversity index; J’: Pielou evenness index; λ: Simpson dominance index; SR: Margalef richness index; TD: trophic diversity; NCR: nematode channel ratio; WI: Wasilewska index; MI: maturity index; PPI: plant parasites index; PPI/MI: plant parasites index/maturity index.
Disclaimer/Publisher’s Note: The statements, opinions and data contained in all publications are solely those of the individual author(s) and contributor(s) and not of MDPI and/or the editor(s). MDPI and/or the editor(s) disclaim responsibility for any injury to people or property resulting from any ideas, methods, instructions or products referred to in the content.

