Abstract
Maintaining permanent forest canopy cover and eventually harvesting timber by predetermined target diameter are often considered as a prototype for future management of the oak natural forest. However, target diameters and harvest age based on average forest growth rates from wide geographical areas often hamper improved management of oak forests. In this study, based on the sampling of 129 target trees from 51 oak natural secondary forest plots in Hunan Province, China, an individual-tree DBH (diameter at breast height) growth model of oak target trees was developed, and the site type (41 levels) was related to the model as random effects by a nonlinear mixed-effects approach. Moreover, the 41 site types were clustered into four site type groups (STG1, STG2, STG3, and STG4) by the K-means clustering algorithm to improve the model performance and practicality. With the help of the model, the five target diameters (including 24, 30, 40, 50, and 60 cm) were simulated in each of the four STGs, and the minimum target diameter was determined for each STG based on the theory of quantitative maturity. In the four STGs, the harvest age of the 24 cm diameter target ranged from 30 to 51 years; the harvest age of the 60 cm target diameter ranged from 131 to 220 years, with the oaks failing to reach 60 cm in the lowest-quality STG4; the minimum target diameter ranged from 21 cm to 29 cm. Results showed that lower-quality sites exclude higher target diameters from optimal harvesting strategies, in contrast to the higher target diameter as a more reasonable strategy in higher quality sites, and that the minimum target diameter is significantly influenced by site conditions. Therefore, it is necessary to develop a diverse target-diameter-harvesting strategy adapted for the complex site conditions of oak forests in Hunan Province towards site-specific timber management to improve the sustainability of timber production in oak forests.
1. Introduction
With the increasing demand for forest ecological services, close-to-nature forestry has become an important component of management practices throughout the world, and more close-to-nature management (CTNM) techniques are used to improve the sustainability of forest management [1,2,3,4,5,6]. In this context, the target tree management system (TMS) based on CTNM concepts is attracting increasing interest [7,8,9]. The TMS is an important management technique for producing large-size timber intended to provide more growing space for selected faster-growing and high-value trees (target trees) and improve the quality of individual trees by harvesting trees that are defective, unhealthy or in competition with target trees (disturbing tree) [10,11,12]. Moreover, the difference with traditional management is that the TMS abolished rotation age as an instrument for determining when a tree should be cut and adopting methods based on target diameter harvesting [6,9]. Target diameter harvesting is a variant of the single-tree selection system [2]. In respect to ecological and biological stability, target diameter harvesting is considered more attractive than traditional even-aged forest harvesting regime (e.g., clear-cutting) because the regeneration/felling phase of target trees is often longer, and the associated age/size structure is more diverse and natural [13,14]. However, some current forest practices do not consider the differences between stand sites and use one target diameter and harvest age to harvest all stands [15,16]. These general regulations are not based on the long-term sustainability of timber production and often lead to overexploitation of timber stocks and long-term decline of tree populations, raising doubts on the long-term sustainability of forests [17]. In contrast, diverse target-diameter-harvesting strategies are more flexible and practical because target diameter can be adjusted to site-specific tree growth patterns [8,18,19]. Therefore, this study abandoned the idea to determine an optimal target diameter and instead simulated the management effects of diverse target diameters in different site conditions to provide more choices of harvesting strategies for managers to maintain the long-term economics of timber production and the ecological stability of forests.
To develop a sustainable target-diameter-harvesting strategy based on appropriate guidelines, accurate information on the tree growth patterns is required. In this context, dendroecological data are an efficient and practical tool [17]. Analysis and modeling of dendroecological data by growth functions can provide information on growth patterns to predict feasible target diameters and to evaluate and adjust current forest management practices. However, the models constructed by traditional linear or nonlinear growth functions are difficult to apply to sites with complex conditions due to the inability to account for the influence of stochastic factors such as site factors [20,21]. The mixed-effects models can effectively solve this problem. The fixed-effects parameters in mixed-effects models are similar to covariate or treatment effects in traditional regression models [22], while random-effects parameters account for the heterogeneity and randomness in the data caused by known and unknown factors [23]. Because of their flexibility and versatility, mixed-effects models have been widely used in forest growth modeling [24,25,26,27,28].
Moreover, in the theory of forest management, the quantitative maturity age is an important basis for determining sustainable utilization and rational harvesting [29]. Peak average annual increment (MAI) is the main index of quantitative maturity, and harvesting forests before the peak MAI is generally considered unsustainable because it often reduces the diversity of stand structure and does not maximize the utilization of land resources [29,30]. Thus, two key variables can be determined for individual target tree based on the quantitative maturity approach: the minimum target diameter (the diameter at which the MAI peaks) and the corresponding harvest age [15,17,31,32]. Once these variables are known, forest managers can make strategic decisions to ensure the long-term sustainability of forests. The current study typically determines the minimum target diameter based on two different growth variables: diameter (base area) or volume [17,31,32]. According to the view of De Ridder et al., diameter-based estimates are more accurate because diameter is easy to measure and the age–diameter relationship is usually positive [31]. In contrast, the volume-based estimates can be limited by errors in height measurement of standing trees and diameter–height insignificant relationship [31].
Oak is one of the main dominant species of natural forests in China and is also a valuable large-size timber. The 9th Forest Resources Inventory of China showed that China’s existing oak forests area is 15.3 million hm2 and the stocking is 1.4 billion m3, which ranks first in terms of forest area and stocking in the country [33]. Hunan Province in south-central China is one of the major distribution areas of subtropical oak natural secondary forests [34]. For a long time, due to the lack of scientific management strategies and factors such as cutting and human interference, most of the oak-dominated forests in Hunan Province are degraded secondary forests, and the quality of forest stands is generally poorer [35,36]. These phenomena are of major concern to ecologists and managers, it is necessary to implement effective forest management treatments to improve the rate and quality of restoration of oak natural forests and maintain the diversity and stability of forest ecosystems.
In recent years, the CTNM practices in oak natural forests have been vigorously pursued in China and a series of technical guidelines on oak target trees management were developed to improve the quality of oak natural forests [37,38,39]. However, most current studies of TMS focus on the stand structure adjustment and the response mechanism of target trees to tending measures [37,39,40,41,42], while neglecting how to effectively utilize the target trees with high business value, and lack of studies on target trees harvesting strategies. In addition, the Association Standards of the Chinese Society of Forestry “Technical standards on the close-to-natural and multi-functional managements of the natural oak forests” set a uniform target diameter of 45 cm for oak target trees [43]. However, the standard does not apply to oak forests with complex site conditions in Hunan Province because it is based on the average growth rate of oak in China. Therefore, the objectives of this study were (1) to construct the DBH (diameter at breast height) growth model of oak target trees with site effects in Hunan Province, and to analyze the differences in growth patterns of oak target trees in different sites, (2) to simulate different target-diameter-harvesting strategies in different sites and to determine the corresponding harvest age, (3) to determine the minimum target diameter of oak target trees in different sites. The results of this study will contribute to the quality recovery and sustainable management of oak natural secondary forests in Hunan Province.
2. Materials and Methods
2.1. Site and Data Description
This study was conducted in Hunan Province, China (108°47′~114°15′ E, 24°38′~30°08′ N). The study area is located in the south-central part of China, with the forest area of 10.53 million ha and the forest cover of 49.69%. The area has a continental subtropical monsoon humid climate, with an average annual temperature of 15–18 °C and an annual precipitation of 1200–1700 mm. The altitude ranges from 23 m to 2099 m, with most of the area between 100 and 800 m. The region has rich oak resources, and the following oak species (Quercus spp.) were included in this study: Quercus glauca Thunb., Q. multinervis J. Q. Li, Q. shennongii C. C. Huang et S. H. Fu, Q. jenseniana Hand.-Mazz., Q. acutissima Carr., and Q. serrata Murray. Moreover, the presence of small amounts of two species belonging to the same Fagaceae family as oaks, Fagus lucida Rehd. et Wils. and Castanea henryi (Skan) Rehd. et Wils. were noted in the selected plots.
We established a total of 51 permanent plots with plot sizes of 20 m × 30 m in oak natural secondary forests, which were distributed in five different sites in Hunan Province. In each plot, the recorded site characteristics (site factors) included elevation, slope, aspect, slope position, soil type, and soil depth. Diameter at breast height and tree height were measured for the trees in each plot. Elevation was measured by a Real-Time Kinematic Surveyor (SR6 Plus) manufactured from Qianxun SI (Shanghai, China), slope and aspect were measured by a laser compass meter (DQL-16ZJ) from Harbin Optical Instrument Factory (Harbin, China), soil type and slope position were obtained from forest history data provided by local forestry centers, soil depth was obtained by measuring the distance from the rock to the soil surface with a straightedge, DBH was measured by a diameter tape and tree height was measured by a laser rangefinder (TruPulse 200) from Laser Technology (Asia) Ltd. (Guangzhou, China). The specific survey method refers to the National Standards of the People’s Republic of China “Technical regulations for continuous forest inventory” [44].
According to the study of Zhang et al., the removal of disturbing tree around target trees promotes the diameter growth of small and medium-diameter target trees but has no significant influence on large-diameter trees [37]. This implies that the large-diameter dominant trees are not influenced by stand competition, and their growth patterns represent the best growth pattern of target trees in the stand. Therefore, we selected two to four (a total of 129) large-diameter dominant oaks in each plot as target tree samples and used growth cones to drill the tree cores for age determination. Additionally, DBH was selected as the predictor variable because diameter is easier to measure and is the most important index to evaluate the value of target trees. The descriptive statistics of target trees and site factors are provided in Table 1.

Table 1.
The descriptive statistics of target trees and site variables for the 51 plots.
2.2. Site Factors Influencing DBH Growth
According to the Chinese forest site classification (Table 2) [45], each site factor was classified into different classes. Additionally, site factors were analyzed by one-way ANOVA after classifying the grade. The factors influencing the DBH growth of target trees were determined by p-values.
Table 2.
Information on the classification of the six site factors.
2.3. Base Model Selection
Before modeling mixed-effects, we considered four widely used theoretical growth equations to describe the DBH growth of target trees (Table 3) and compared the model performance. It should be noted that Richard’s formula did not converge and was not used in the basic model.
Table 3.
The candidate base models.
2.4. Nonlinear Mixed-Effects Models
Considering DBH growth can be influenced by site conditions, we added a random effect (site effect) into the base model to establish a nonlinear mixed-effects models (NLME). The single-level NLME was expressed as follows.
where the indexes i and j denote the first level (site type) random effects and the observation, respectively. represents the DBH observation of jth tree in the ith site type. represents the age of jth tree in the ith site type, is the function describing the relationship with and . The is the fixed-effects parameter, the represents the estimate of the random effects parameter in the ith site type. is the random effect variance–covariance matrix. is the variance–covariance matrix of site type. denotes that the random effects parameter obeys normal distribution with expectation of 0 and variance of . is the error term, which obeys the normal distribution with expectation of 0 and variance of . and are independent of each other. M is the number of site types, and is the number of trees in the ith site type.
2.5. The K-Means Clustering Algorithm
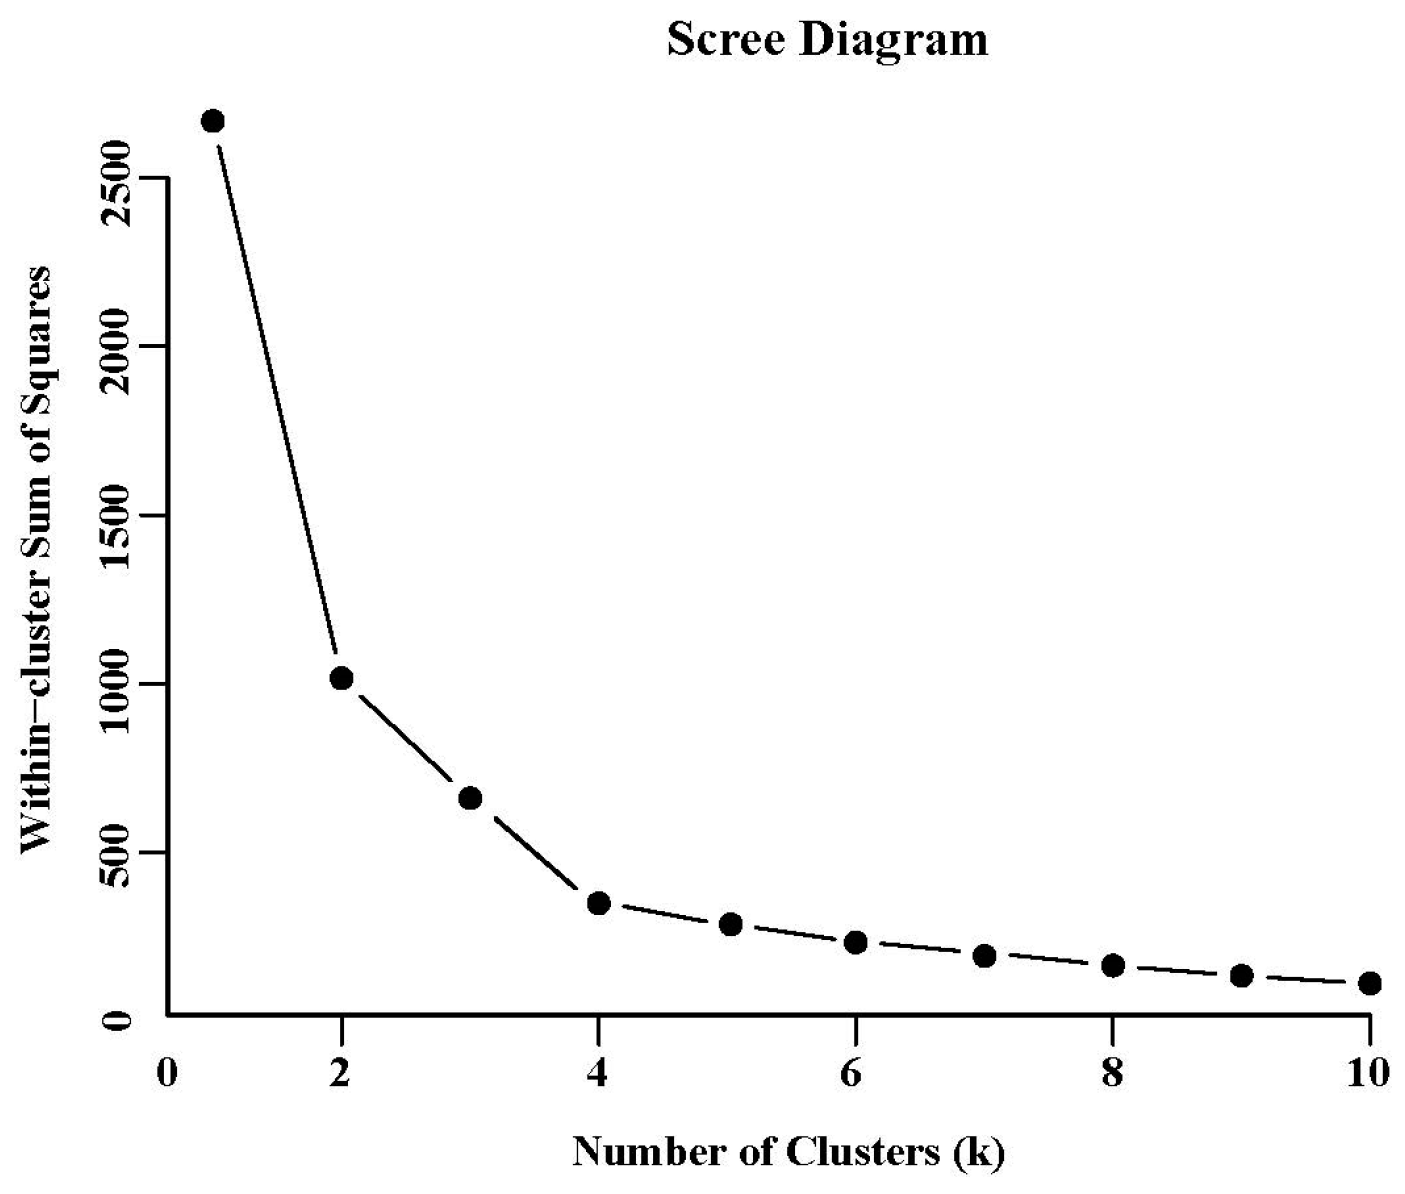
In this study, the growth curve is more complex due to the large number of site types, which is not conducive to model implementation. The K-means algorithm can divide the sample data into k groups such that the squared error between the empirical mean of the clusters and the points in the clusters is minimized. Here, we use the K-means algorithm to group the site types, and the site types with the same or similar impact effects will be grouped into one site type group (STG) to simplify the number of site types [50]. Considering that the results of the K-means clustering algorithm are significantly influenced by the initial centroids and the number of clusters, we used multiple random initializations (setting multiple initial centroids and selecting the optimal results) to improve the stability of the clustering results and determine the optimal number of clusters by the scree test [51].
2.6. Model Evaluation
The optimal base model was determined by the coefficient of determination (R2) and the mean absolute error (MAE). The best mixed-effects model was evaluated by Akaike’s information criterion (AIC) and log-likelihood (LL) [52,53]. The AIC considers both the number of constraints and the predictive value of the algorithm, and the candidate model with the smallest AIC value is determined to be the optimal model When the results of evaluation indexes are different [54]. Because the traditional evaluation approach of segmented data does not provide additional information for model evaluation, the validity of the mixed-effects models was evaluated using the leave-one-out cross-validation approach [55]. The model fitting and evaluation indexes calculation were implemented in R version 4.2.2.
where is the measured value of the ith sample, is the mean value of the sample, is the estimate of the ith sample. n is the number of samples, k is the number of model parameters, and L is the likelihood function value.
2.7. Quantitative Maturity Age and the Minimum Target Diameter
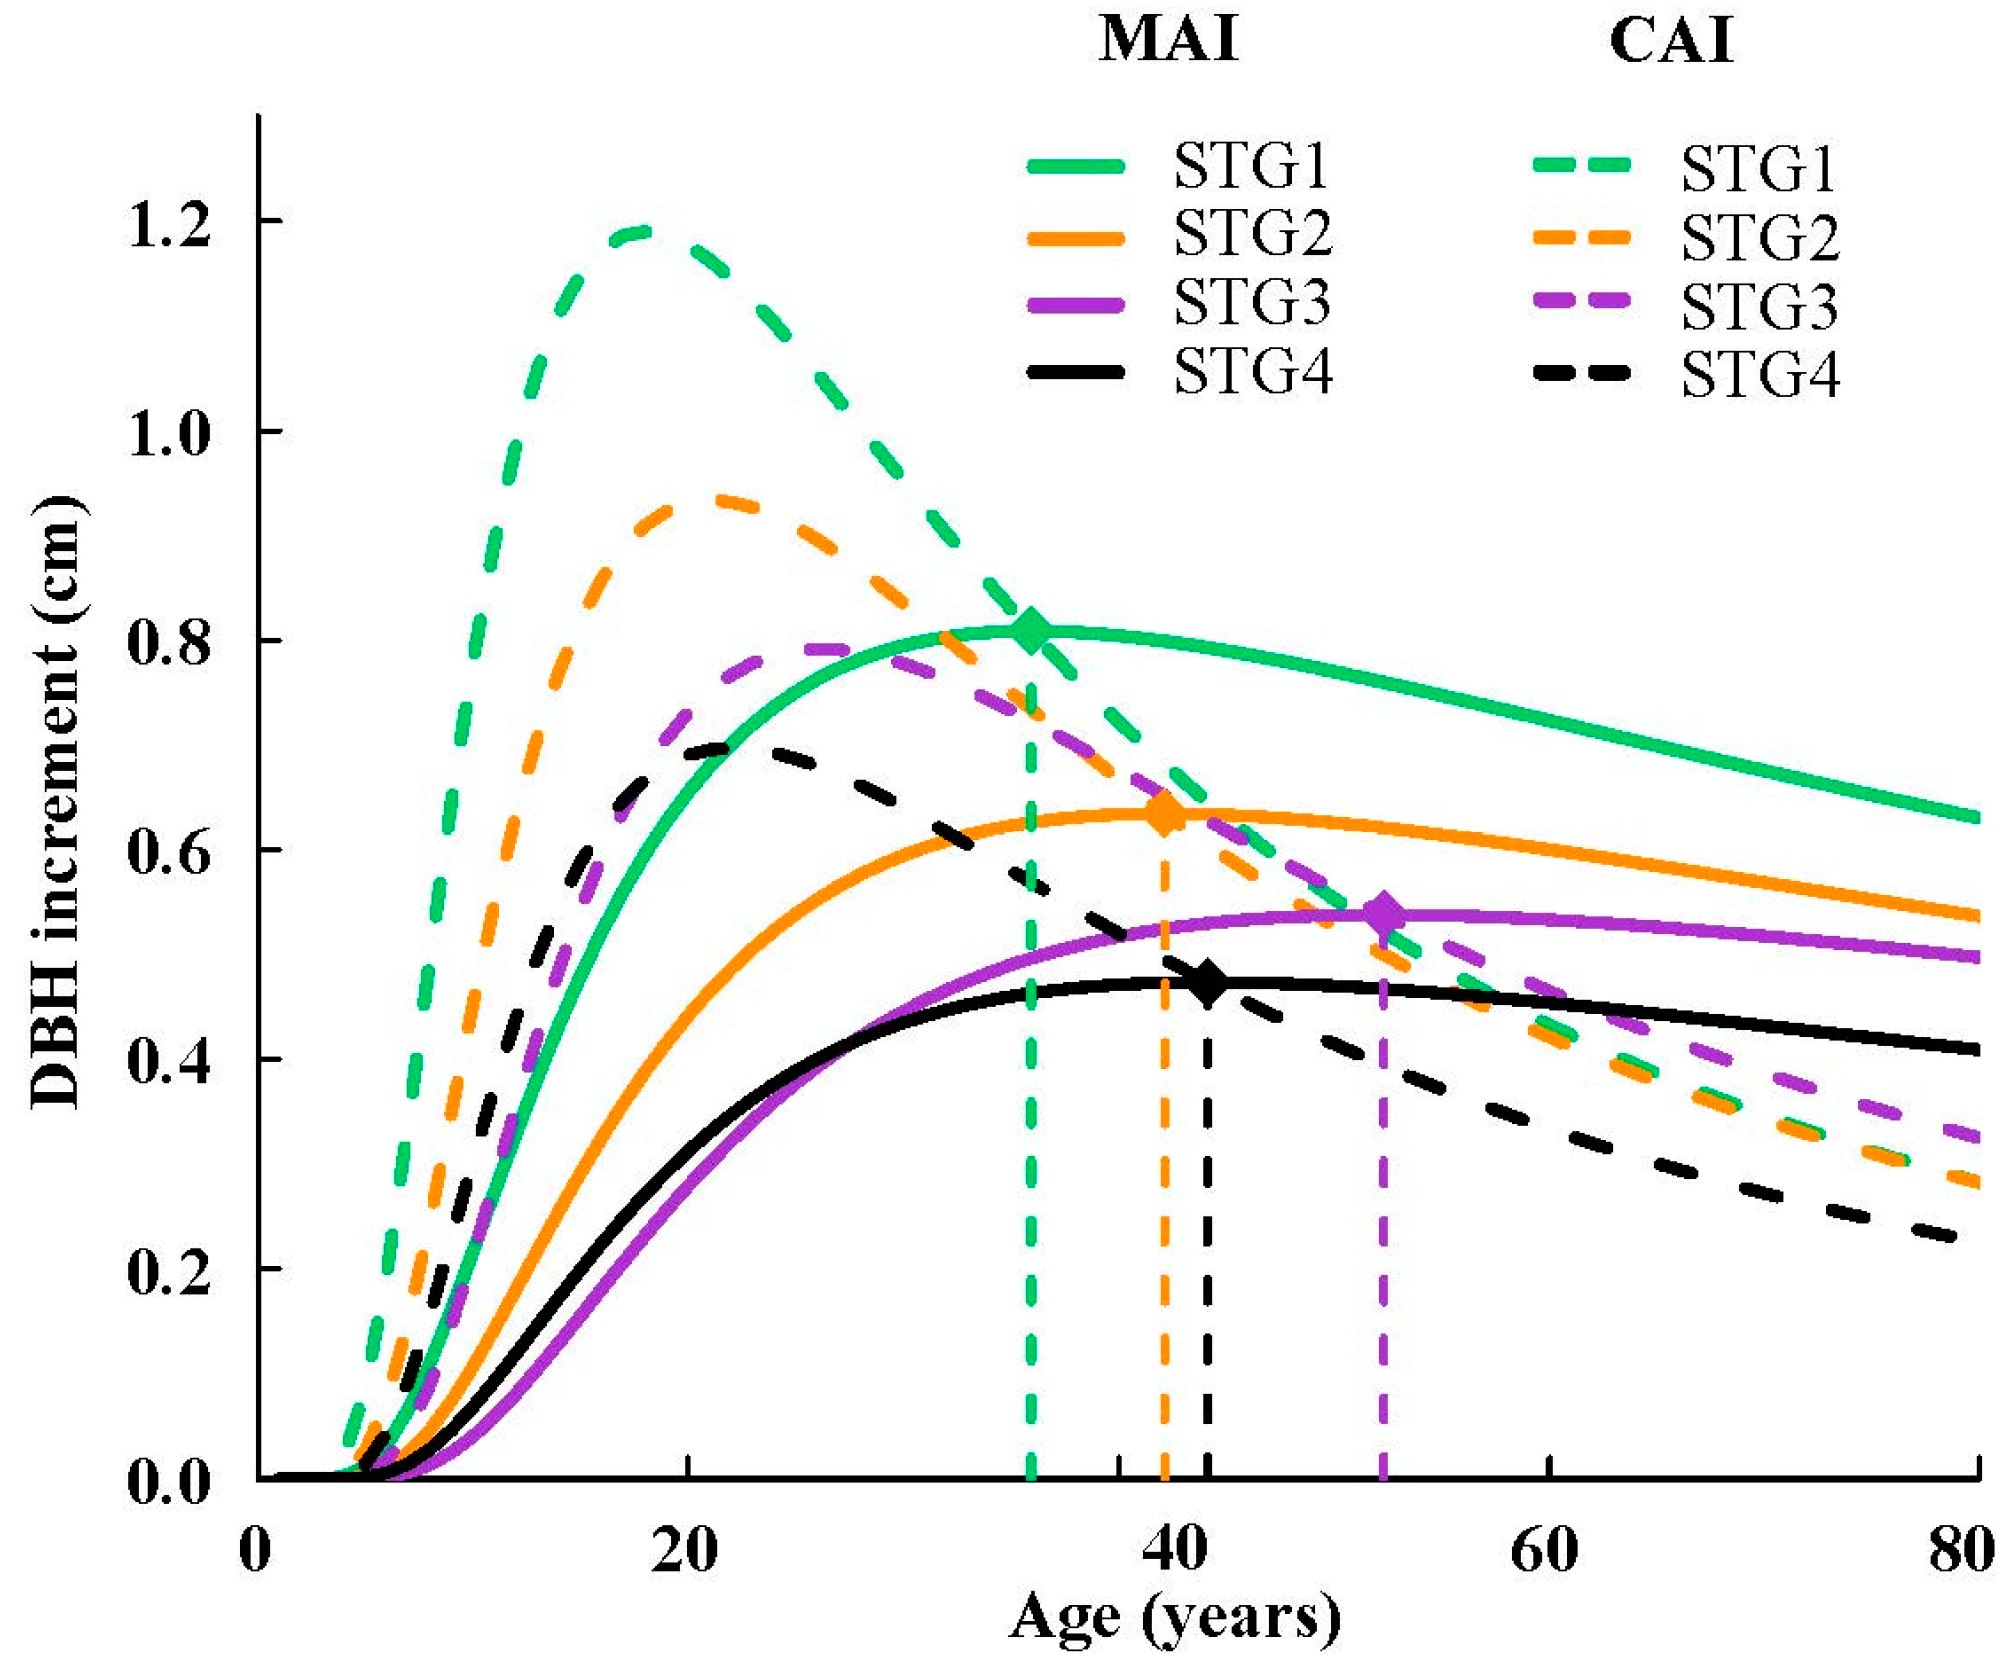
Based on the DBH growth model, the theory of quantitative maturity was applied to estimate the minimum target diameter and corresponding harvest age (quantitative maturity age) in different sites. The current annual increment (CAI) curve was obtained by taking the first order derivative of the DBH growth equation, and the mean annual increment (MAI) curve was obtained by the DBH growth equation divided by the tree age. The peak of the MAI can be found at the intersection of the CAI and MAI curves, the age of the tree at which the MAI peaks corresponds to a specific diameter on the mean annual diameter increment curve, i.e., the minimum target diameter [15,56].
where Age is the tree age, Age = 1, 2, …, n, y(Age) is the function describing diameter increments.
3. Results
3.1. Importance Analysis of Site Factors
The results of one-way ANOVA showed (Table 4) that elevation is the dominant factor (p < 0.05) influencing DBH growth of target trees, following slope, soil type, and aspect.
Table 4.
Significance test of site factors.
3.2. Base Model Selection and Simulation
We compared the performance of the four candidate base models by the NLME function of R version 4.2.2. The fitting results showed that the R2 values of the candidate models are all proximately 0.65, and model M4 has the highest fitting accuracy (Table 5). Therefore, the model M4 was determined to be the best base model for further analysis.
Table 5.
Information on parameter estimates and model evaluation of four candidate base models.
3.3. Nonlinear Mixed Models for Different Site Type Combinations
Considering the differences in site conditions in different stands, we classified the site factors with significant influence (elevation, slope, soil type, aspect) according to criteria (Table 2). The classified site factors can be combined into 840 site types and included only 41 site types in this study. The classification and combination of site factors are provided in Table S1.
There are three different combinations of random (site) effects correlated with the parameters a and b, i.e., correlating only a (M4.1), correlating only b (M4.2), and correlating both a and b (M4.3). The results showed that the models converged for all three cases above, and model M4.3 (R2 = 0.9436, AIC = 761.8526, LL = −375.9263) showed the best performance in terms of fit statistics (Table 6). Therefore, model M4.3 was determined to be the optimal model.
where Equations (7)–(9) are model M4.1, M4.2 and M4.3, respectively; a and b are model parameters; and are random effect parameters; D is the DBH of target trees; Age is the age of target trees.
Table 6.
Parameter estimates and model evaluation of the mixed-effects models with site effects.
3.4. Clustering of the Site Types and Model Simulation
Based on model M4.3, the 41 site types were clustered by the K-means clustering algorithm with different number of the clusters (from 1 to 10), with each number of clusters was randomly initialized 100 times and the respective best result was selected to plot the scree diagram. Figure 1 showed that when the number of clusters is four, the folding lines become smooth from steep and the within-cluster sum of squares decreases significantly, so the 41 site types were further divided into four site type groups (STGs) (Table 7). With regard to the STGs as the new random effect, the final DBH growth model (M4.4) of target trees with site effects was obtained as follows:
where is the target trees DBH in the ith STG; and are the parameter values of the ith STG; is the age of target trees in the ith STG.
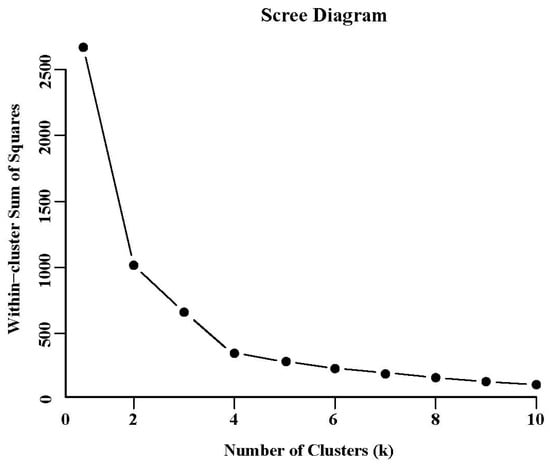
Figure 1.
Within-cluster sum of squares with different number of clusters (K).
Table 7.
Cluster results of site types.
The results showed that the accuracy (R2) of model M4.4 after cluster analysis was slightly reduced compared to model M4.3, but the AIC and LL are both significantly improved (Table 6 and Table 8). Compared with the base model M4, the distribution of residuals for model M4.4 is more concentrated and even (Figure 2).
Table 8.
Precision evaluation and parameter estimation of M4.4.
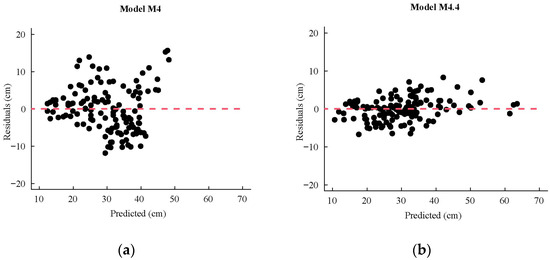
Figure 2.
The residual diagrams of the optimal base model (M4) and the mixed-effects model with site clustering (M4.4) ((a) represents M4; (b) represents M4.4).
3.5. Model Evaluation
Table 9 provides the prediction results for all models by the leave-one-out cross-validation approach. The results showed that the accuracy (R2) of the mixed-effects model that did not cluster for site effect (M4.1, M4.2, and M4.3) were all improved compared to the base model (M4), and the model M4.3 still had the highest accuracy, which is consistent with the conclusions of model fit. However, compared to the fitting accuracy (R2), the predictive accuracy (R2) of the mixed-effects models that did not cluster for site effect all decreased significantly (decreased by 8.57%, 8.17%, and 8.10%, respectively), and the mixed-effects model after cluster analysis (M4.4) only dropped slightly (1.23%). This implies that the final model (M4.4) is a valid and practical model, which is not only more concise but also not overfitted.
Table 9.
Prediction results of the leave-one-out cross-validation approach.
3.6. Harvest Age of Different Target Diameter in Different Sites
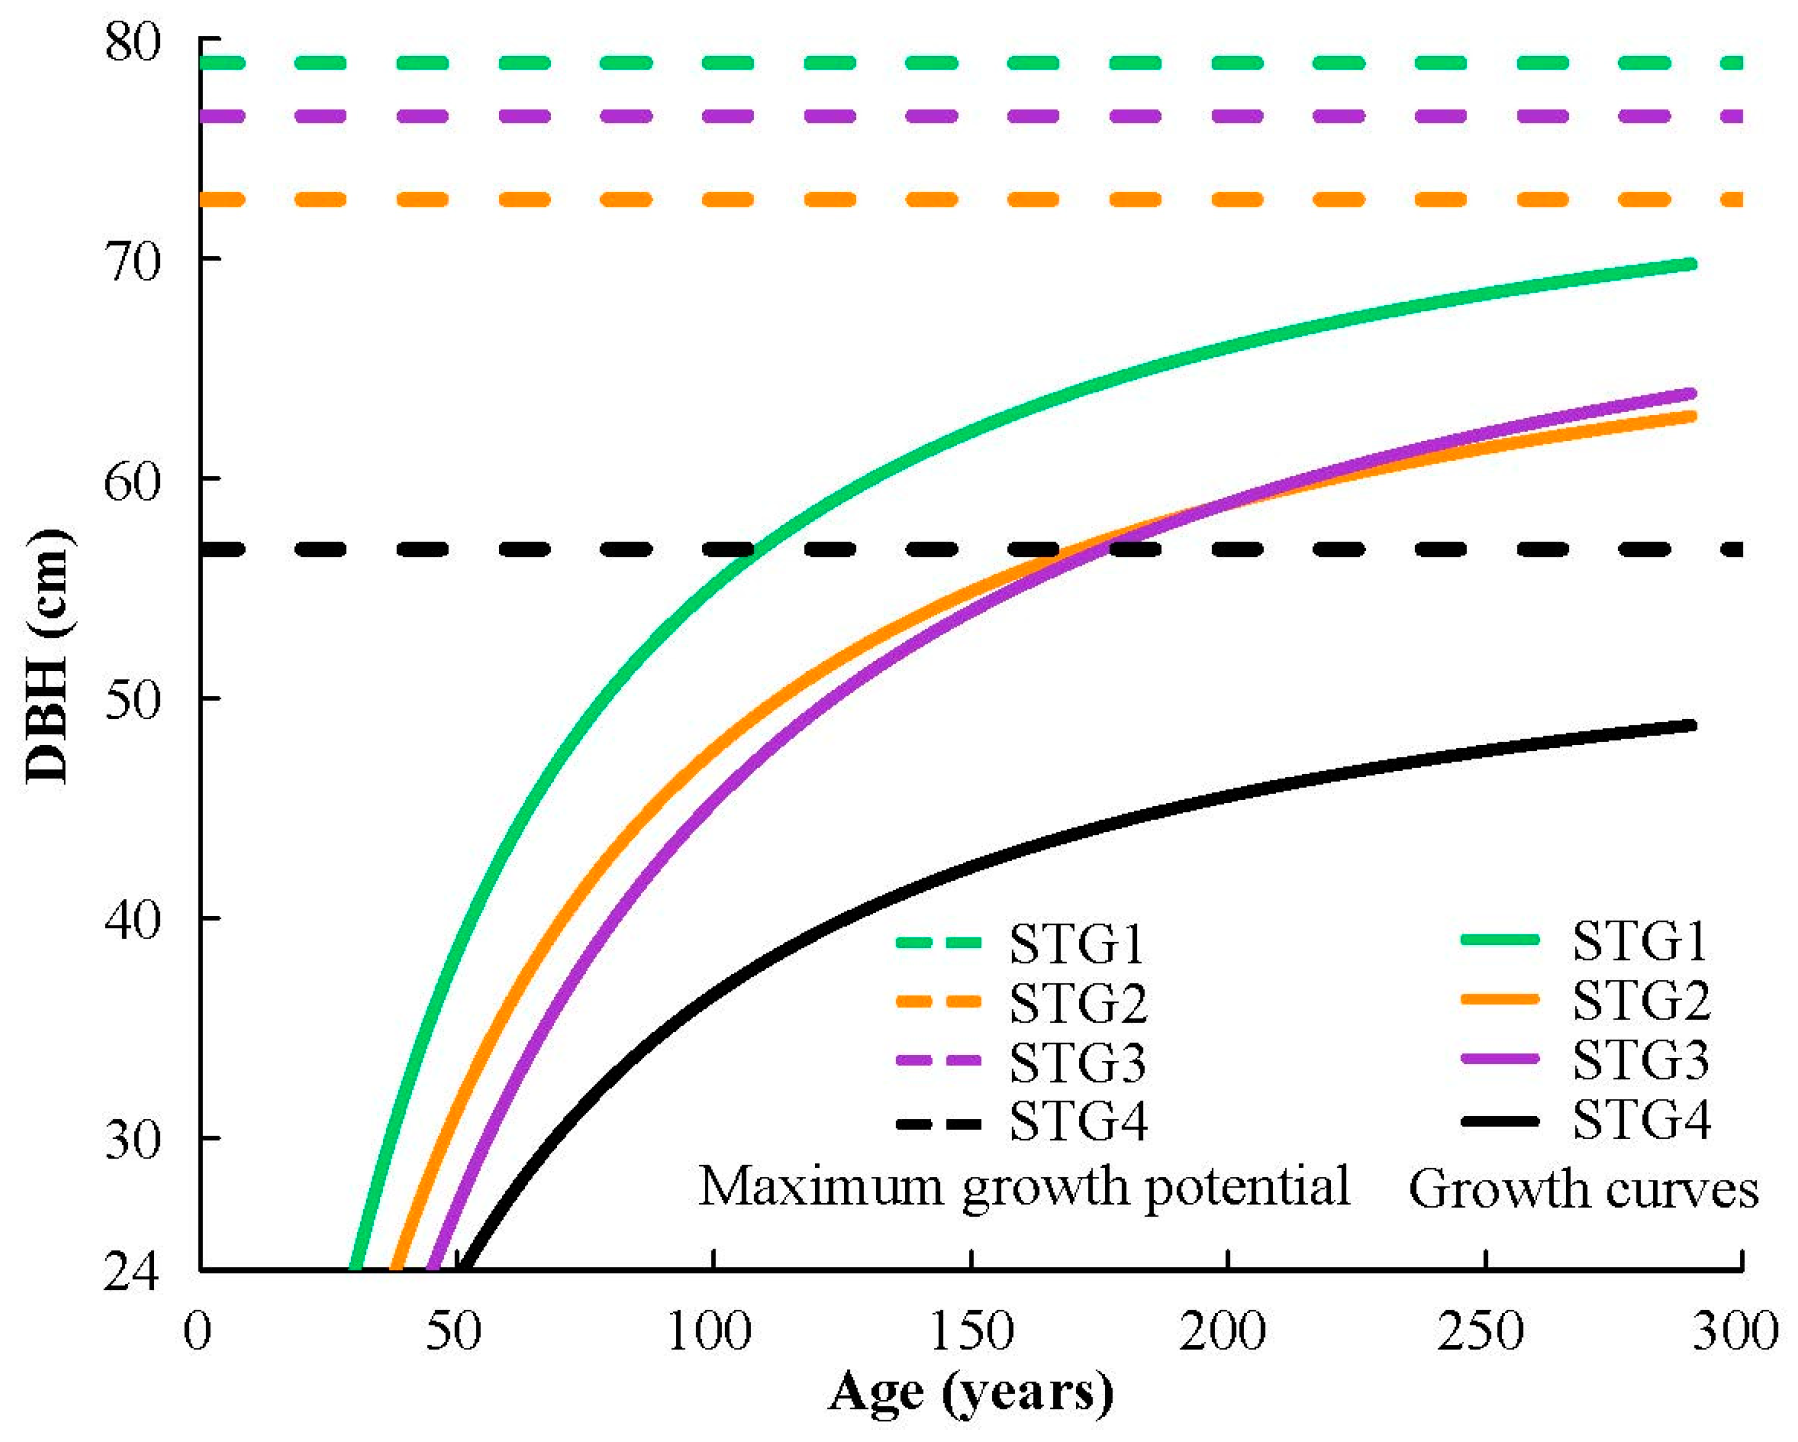
According to the biological interpretation of the parameters of the Schumacher growth equation, parameter a is the asymptotic parameter (representing maximum growth potential) and parameter b is the slope parameter (related to the maximum growth rate) [57,58]. Based on model M4.4 and the estimation of parameter a, we created the maximum growth potential in the four STGs and the growth curves after reaching DBH 24 cm (Figure 3). The results showed that the site quality of STG1 was the highest and the site quality of STG4 was the lowest; the site quality of STG3 and STG2 was medium, and the superiority or inferiority of the two sites reversed around the 60 cm target diameter.
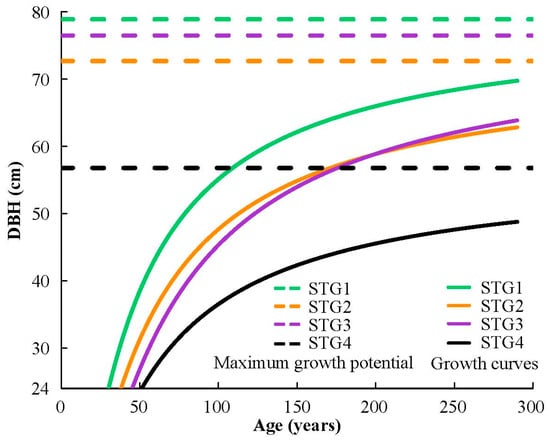
Figure 3.
The growth curves after reaching DBH (diameter at breast height) 24 cm and the maximum growth potential in the four STGs (site type groups).
Figure 3 showed that the maximum growth potential of oak diameter is 79 cm, but considering that the risk of tree senescence and mortality increases with a higher target diameter, the upper limit of the target diameter is 60 cm in this study [18]. Moreover, the production of large-size timber is the most important objective of the TMS, according to the Forestry Industry Standard of the People’s Republic of China “Guidelines for large-size timber cultivation” [59], the minimum diameter of large-size timber is limited to 24 cm. Therefore, five different target diameters (including 24, 30, 40, 50, and 60 cm) were simulated in each of the four STGs in this study, and the corresponding harvest age was estimated based on the inverse function (Equation (11)) of model M4.4. In general, the harvest age of the lowest target diameter (24 cm) was 30–51 years and harvest age of the highest target diameter (60 cm) was 131–220 years, while the target diameter of the lowest-quality STG4 could not even reach the 60 cm (Table 10).
where is the harvest age in the ith STG, is the target diameter, and and are the parameter values of the ith STG.
Table 10.
Harvest age with different target diameters in different STGs.
3.7. Determination of Quantitative Maturity Age and the Minimum Target Diameter
The minimum target diameter and quantitative maturity age were determined by the intersection of the MAI curve and the CAI curve. Figure 4 showed that the difference between the CAI and the MAI is that the peak of CAI is higher and occurred earlier. After the CAI peaks and begins to decline, the MAI continues to rise. The two curves intersect when the MAI reaches its peak, at which time the age is the quantitative maturity age and the corresponding diameter is the minimum target diameter.
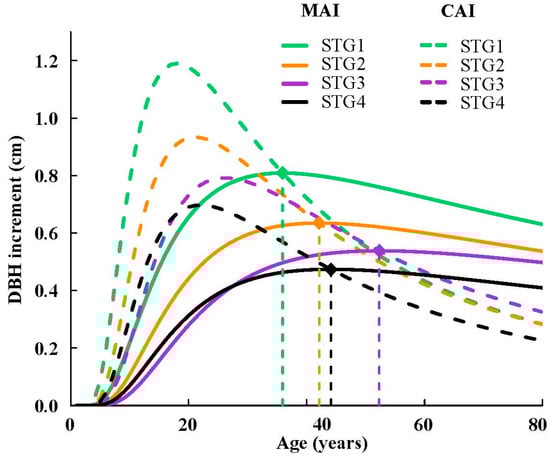
Figure 4.
Clusters of current annual increment (CAI) curves and mean annual increment (MAI) curves based on the site type group (STG). Note: DBH: diameter at breast height.
The results showed that the quantitative maturity age of STG1, STG2, STG3, and STG4 was 36 years, 42 years, 52 years, and 44 years, respectively. The minimum target diameter were 29 cm, 27 cm, 28 cm, and 21 cm, respectively. The peaks of MAI were 0.8087 cm/year, 0.6344 cm/year, 0.5380 cm/year, and 0.4737 cm/year, respectively (Table 11).
Table 11.
Information on quantitative maturity of oak target trees in different STGs.
4. Discussion
4.1. Harvest Age of Different Target Diameters
Buongiorno et al. found that it is possible to manage northern hardwood stands sustainably with target diameter harvesting, combined with the removal of poorly performing understorey trees [60]. In a study of six different cutting guides in mixed-species forests in Wisconsin by Lu and Buongiorno, it was concluded that a target-diameter-harvesting guide performed well from both an economic and a diversity point of view, as opposed to traditional silvicultural guides or high grading [61]. In the above forest management practices, target diameter is an important decision-making factor as it relates to timber quality, timber commercial value, and the ecological sustainability of the forest [19,62]. However, it is difficult to determine an optimal target diameter that satisfies all of the above due to differences in tree growth [18,19,60], which implies that accurate information on diameter increments and growth patterns of individual trees is required to estimate reasonable target diameters [63,64,65,66].
In this study, we found that the growth of oak target trees was significantly different due to site variation by modeling the growth dynamics of oak target trees in different site types. The results showed that the maximum difference in oak harvest age (from 30 to 51 years) at 24 cm target diameter was 21 years, and the maximum difference in oak harvest age (from 131 to 220 years) at 60 cm target diameter was 89 years. It can be seen that oak growth varies greatly from site to site, and a single target diameter does not apply to forests with complex site conditions. Similar results were observed by Roessiger et al. who tested a diverse diameter harvesting strategy based on growth data from temperate mixed forests and found that differences in tree growth change optimal harvesting strategies and diversify harvesting diameters [18].
Moreover, the lower-quality sites excluded higher target diameters from the optimal harvesting strategy. In northern France, the regular diameter-limit of oaks is 70 cm [67]. Lu et al. also argue that the target diameter of hardwood forests in China should be set above 60 cm to maintain the long-term economics of producing high-quality timber and ecological sustainability [9]. However, our study showed that the maximum growth potential for oak diameters in the lowest-quality STG4 was 57 cm, which would result in forest management failure if target diameters above 60 cm were to be applied to STG4. Additionally, the harvest age of oaks varies considerably from region to region due to differences in species, growing conditions, and commercial purposes, but generally ranges from 70 to 160 years and is concentrated in most regions between 80 and 100 years, as oak growth and timber quality are at a high level during this harvest period [68,69,70,71]. Tkach et al. argued that the harvest age of oaks must consider forest senescence beyond 120 years because the health of oak forests with production times of 131–140 years is deteriorating in Ukraine [72]. However, our study showed that in the medium-quality STG2 and STG3, the production time of oaks with 60 cm target diameters is over 200 years, at which time the risk of tip breakage, timber heart rot, and reduced growth will increase significantly, resulting in the reduction in the commercial value of the timber. This implies that the quality loss from tree senescence and the economic loss from tree heart rot would further limit the site types for which the high target diameter strategy would be applicable [18,19,62].
The sustainability of timber production is also another determining factor in determining the target diameter. As previously stated, according to the management standards of Chinese oak forests [43], the target diameter of oak is 45 cm, while the production time is 100–120 years. Based on this target diameter regulation, we estimate the harvest age in the highest-quality STG1 is 64 years. However, the 50–100 years is the fastest-growing period for oaks [73], and harvesting at this time would prematurely remove fast-growing oaks, resulting in a waste of land resources. Apparently, with increasing site quality, higher target-diameter-harvesting strategies should be used to maintain the sustainability of timber production.
4.2. The Minimum Target Diameter
Several studies showed that applying too low harvest diameters will result in premature removal of fast-growing and high-incremental-value trees [74], or failure to control harvest intensity and preserve adequate populations of reproductive adults [16,75]. To reduce the influence of irrational logging on forest structure and biodiversity, many regions have regulated the minimum harvesting diameter allowed for harvesting, but most regulations are based on average growth rates of the forest in geographic areas and they do not consider the differences in tree growth for the different sites [16]. This practice of using only one minimum harvest diameter ignores differences in tree growth and may result in the long-term degradation of available timber resources, as many trees are often harvested before they reach their maximum productivity [15,17].
One of the most important parameters within the concept of sustained yield is the minimum target diameter, a cutting limit that can be calculated based on tree growth patterns [31]. In this study, we applied the quantitative maturity concept, which derives the minimum target diameter from the age of the peak mean annual diameter increment. The results showed that the quantitative maturity age of oak target trees was 36–52 years, which is very close to the short rotation period (35–40 years) of European oak forests [76]. However, the minimum target diameters ranged from 21–29 cm, which is far below the target diameter standard of 45 cm for Chinese oaks. The difference may be caused by the following two aspects. Primarily, factors such as timber quality and changes in environmental dynamics are not considered due to the limitations of quantitative maturity theory. For example, Laliberté et al. suggest that the diameter threshold should be between 34 cm and 46 cm if both oak growth dynamics and timber quality are considered [77]. Although oaks in this diameter range have no obvious defects, they have a higher probability of losing vigor and quality in later periods [77]. Second, the growth variable used was diameter rather than volume in this study, as the time for the diameter to reach the maximum increment is often earlier than the volume-based estimation, and the estimated minimum target diameter is also lower [31].
Moreover, although harvesting forests based on the minimum target diameter produces the maximum economic benefits [18], applying lower harvest diameters implies that large and old trees in the stand become scarce, which may lead to a simplification of forest structure and dynamics over time, negatively affecting biodiversity [67]. Extending harvest age to after the quantitative maturity by increasing harvest diameter thresholds may contribute both to the production of large-diameter timber with high economic value and enhanced biodiversity conservation [67]. The study of Buonjoerno et al. also showed that the harvest diameter that only considers the maximum economic benefit in uneven-aged mixed forests often leads to lower size diversity, whereas higher harvest diameters not only give a high return but also maintain a higher diversity level [60]. This implies that improving forest quality in oak natural secondary forests only based on the minimum target diameter is very limited. We recommend that the minimum target diameter should be used as a base limit and the harvest diameter should be increased appropriately according to specific site conditions to increase the size diversity of oaks and the biodiversity of the forest, thus maintaining the sustainability of timber production and forest ecology.
Because oaks are widely distributed in China, the growth patterns of oaks in different regions may vary greatly. The generalizability of harvesting strategies based only on oak growth patterns of Hunan Province is limited, and the study area can be expanded and new environmental factors added in future studies to develop oak harvesting strategies with higher applicability and accuracy. In summary, our study provides reliable estimation methods of management criteria (e.g., minimum target diameter and harvest age of different target diameters) for oak target trees, which are important for the quality recovery of oak natural secondary forests and the improvement of the sustainability of oak forest management.
5. Conclusions
In this study, the growth dynamics of 129 oak target trees distributed in the 41 site types were modeled by the nonlinear mixed-effects model, and the 41 site types were clustered into four groups by the K-means clustering algorithm to simplify the model. Based on the growth model, we simulated five target diameters in each site type group and estimated the minimum target diameter in each site type group based on quantitative maturity theory. The results showed that applying higher target diameters in lower-quality sites may lead to failure of management objectives, while higher target diameters are more favorable to the sustainability of timber production with increasing site quality. In different site type groups, the minimum target diameters also varied considerably. Our study develops a useful model to predict harvest age at different target diameters in different sites and proposes a new method to estimate the minimum target diameter of oak in different site conditions. The findings will provide a theoretical and practical basis for quality recovery of oak natural secondary forests and sustainable timber production in Hunan Province.
Supplementary Materials
The following supporting information can be downloaded at: https://www.mdpi.com/article/10.3390/f15010120/s1, Table S1: Information on the classification and combination of site factors.
Author Contributions
W.Y., investigation, data curation, formal analysis, and writing—original draft. G.Z., writing—original draft, writing—review and editing, and supervision. All authors have read and agreed to the published version of the manuscript.
Funding
This study was supported by the National Natural Science Foundation of China (32271874).
Data Availability Statement
Restrictions apply to the availability of these data due to confidentiality.
Conflicts of Interest
The authors declare no conflict of interest.
References
- Collado, E.; Piqué, M.; Coello, J.; de-Dios-García, J.; Fuentes, C.; Coll, L. Close-to-Nature Management Effects on Tree Growth and Soil Moisture in Mediterranean Mixed Forests. For. Ecol. Manag. 2023, 549, 121457. [Google Scholar] [CrossRef]
- Brang, P.; Spathelf, P.; Larsen, J.B.; Bauhus, J.; Bončina, A.; Chauvin, C.; Drossler, L.; Garcia-Guemes, C.; Heiri, C.; Kerr, G.; et al. Suitability of Close-to-Nature Silviculture for Adapting Temperate European Forests to Climate Change. Forestry 2014, 87, 492–503. [Google Scholar] [CrossRef]
- Schneider, R.; Franceschini, T.; Duchateau, E.; Bérubé-Deschênes, A.; Dupont-Leduc, L.; Proudfoot, S.; Power, H.; De Coligny, F. Influencing Plantation Stand Structure through Close-to-Nature Silviculture. Eur. J. For. Res. 2021, 140, 567–587. [Google Scholar] [CrossRef]
- O’Hara, K.L. What Is Close-to-Nature Silviculture in a Changing World? For. Int. J. For. Res. 2016, 89, 1–6. [Google Scholar] [CrossRef]
- Van Gossum, P.; Luyssaert, S.; Serbruyns, I.; Mortier, F. Forest Groups as Support to Private Forest Owners in Developing Close-to-Nature Management. For. Policy Econ. 2005, 7, 589–601. [Google Scholar] [CrossRef]
- Gamborg, C.; Larsen, J.B. ‘Back to Nature’—A Sustainable Future for Forestry? For. Ecol. Manag. 2003, 179, 559–571. [Google Scholar] [CrossRef]
- Zhu, Y.; Zhao, B.; Zhu, Z.; Jia, B.; Xu, W.; Liu, M.; Gao, L.; Gregoire, T.G. The Effects of Crop Tree Thinning Intensity on the Ability of Dominant Tree Species to Sequester Carbon in a Temperate Deciduous Mixed Forest, Northeastern China. For. Ecol. Manag. 2022, 505, 119893. [Google Scholar] [CrossRef]
- Hessenmöller, D.; Bouriaud, O.; Fritzlar, D.; Elsenhans, A.S.; Schulze, E.D. A Silvicultural Strategy for Managing Uneven-Aged Beech-Dominated Forests in Thuringia, Germany: A New Approach to an Old Problem. Scand. J. For. Res. 2018, 33, 668–680. [Google Scholar] [CrossRef]
- Lu, Y.; Zhang, S.; Lei, X.; Ning, J.; Wang, Y. Theoretical Basis and Implementation Techniques on Close-to-nature Transformation of Plantations. World For. Res. 2009, 22, 20–27. [Google Scholar]
- Wan, P.; He, R.; Wang, P.; Cao, A. Implementation of Different Forest Management Methods in a Natural Forest: Changes in Soil Microbial Biomass and Enzyme Activities. For. Ecol. Manag. 2022, 520, 120409. [Google Scholar] [CrossRef]
- Geng, Y.; Yue, Q.; Zhang, C.; Zhao, X.; Von Gadow, K. Dynamics and Drivers of Aboveground Biomass Accumulation during Recovery from Selective Harvesting in an Uneven-Aged Forest. Eur. J. For. Res. 2021, 140, 1163–1178. [Google Scholar] [CrossRef]
- Pommerening, A.; Maleki, K.; Haufe, J. Tamm Review: Individual-Based Forest Management or Seeing the Trees for the Forest. For. Ecol. Manag. 2021, 501, 119677. [Google Scholar] [CrossRef]
- Tarp, P.; Buongiorno, J.; Helles, F.; Larsen, J.B.; Meilby, H.; Strange, N. Economics of Converting an Even-Aged Fagus sylvatica Stand to an Uneven-Aged Stand Using Target Diameter Harvesting. Scand. J. For. Res. 2005, 20, 63–74. [Google Scholar] [CrossRef]
- Sterba, H.; Zingg, A. Target Diameter Harvesting Ð a Strategy to Convert Even-Aged Forests. For. Ecol. Manag. 2001, 151, 95–105. [Google Scholar] [CrossRef]
- Schöngart, J. Growth-Oriented Logging (GOL): A New Concept towards Sustainable Forest Management in Central Amazonian Várzea Floodplains. For. Ecol. Manag. 2008, 256, 46–58. [Google Scholar] [CrossRef]
- Sist, P.; Fimbel, R.; Sheil, D.; Nasi, R.; Chevallier, M.-H. Towards Sustainable Management of Mixed Dipterocarp Forests of South-East Asia: Moving beyond Minimum Diameter Cutting Limits. Environ. Conserv. 2003, 30, 364–374. [Google Scholar] [CrossRef]
- Andrade, V.H.F.; Machado, S.d.A.; Figueiredo Filho, A.; Botosso, P.C.; Miranda, B.P.; Schöngart, J. Growth Models for Two Commercial Tree Species in Upland Forests of the Southern Brazilian Amazon. For. Ecol. Manag. 2019, 438, 215–223. [Google Scholar] [CrossRef]
- Roessiger, J.; Ficko, A.; Clasen, C.; Griess, V.C.; Knoke, T. Variability in Growth of Trees in Uneven-Aged Stands Displays the Need for Optimizing Diversified Harvest Diameters. Eur. J. For. Res. 2016, 135, 283–295. [Google Scholar] [CrossRef]
- Zell, J.; Hanewinkel, M.; Seeling, U. Financial Optimisation of Target Diameter Harvest of European Beech (Fagus sylvatica) Considering the Risk of Decrease of Timber Quality Due to Red Heartwood. For. Policy Econ. 2004, 6, 579–593. [Google Scholar] [CrossRef]
- Martins, F.B.; Soares, C.P.B.; Silva, G.F.D. Individual Tree Growth Models for Eucalyptus in Northern Brazil. Sci. Agric. 2014, 71, 212–225. [Google Scholar] [CrossRef]
- Abrantes, K.K.B.; Paiva, L.M.; Almeida, R.G.D.; Urbano, E.; Ferreira, A.D.; Mazucheli, J. Modeling the Individual Height and Volume of Two Integrated Crop-Livestock-Forest Systems of Eucalyptus spp. in the Brazilian Savannah. Acta Sci. Agron. 2019, 41, 42626. [Google Scholar] [CrossRef]
- Yang, Y.; Huang, S. Comparison of Different Methods for Fitting Nonlinear Mixed Forest Models and for Making Predictions. Can. J. For. Res. 2011, 41, 1671–1686. [Google Scholar] [CrossRef]
- Vonesh, E.F.; Chinchilli, V.M. Linear and Nonlinear Models for the Analysis of Repeated Measurements; Marcel Dekker: New York, NY, USA, 1997. [Google Scholar]
- Lhotka, J.M.; Loewenstein, E.F. An Individual-Tree Diameter Growth Model for Managed Uneven-Aged Oak-Shortleaf Pine Stands in the Ozark Highlands of Missouri, USA. For. Ecol. Manag. 2011, 261, 770–778. [Google Scholar] [CrossRef]
- Adame, P.; Hynynen, J.; Cañellas, I.; Del Río, M. Individual-Tree Diameter Growth Model for Rebollo Oak (Quercus pyrenaica Willd.) Coppices. For. Ecol. Manag. 2008, 255, 1011–1022. [Google Scholar] [CrossRef]
- Calegario, N.; Daniels, R.F.; Maestri, R.; Neiva, R. Modeling Dominant Height Growth Based on Nonlinear Mixed-Effects Model: A Clonal Eucalyptus Plantation Case Study. For. Ecol. Manag. 2005, 204, 11–21. [Google Scholar] [CrossRef]
- Uzoh, F.C.C.; Oliver, W.W. Individual Tree Diameter Increment Model for Managed Even-Aged Stands of Ponderosa Pine throughout the Western United States Using a Multilevel Linear Mixed Effects Model. For. Ecol. Manag. 2008, 256, 438–445. [Google Scholar] [CrossRef]
- Subedi, N.; Sharma, M. Individual-Tree Diameter Growth Models for Black Spruce and Jack Pine Plantations in Northern Ontario. For. Ecol. Manag. 2011, 261, 2140–2148. [Google Scholar] [CrossRef]
- Sun, K.; Sun, H.; Lu, G.; Fang, L.; Wan, Z.; Tan, Z. Study on the Effects of Stand Density Management of Chinese Fir Plantation in Northern China. Front. Plant Sci. 2023, 14, 1130299. [Google Scholar] [CrossRef]
- Qu, Y.; Jiang, Y.; Chen, H.; Hu, Y.; Jiang, Y.; Wang, Z.; Chhin, S.; Zhang, J.; Sun, L.; Zhang, X. Does the Peak Time of Stand Leaf Area Equal the Biological Maturity Age of Forests? For. Ecol. Manag. 2023, 538, 120988. [Google Scholar] [CrossRef]
- De Ridder, M.; Van den Bulcke, J.; Van Acker, J.; Beeckman, H. Tree-Ring Analysis of an African Long-Lived Pioneer Species as a Tool for Sustainable Forest Management. For. Ecol. Manag. 2013, 304, 417–426. [Google Scholar] [CrossRef]
- López, L.; Villalba, R.; Bravo, F. Cumulative Diameter Growth and Biological Rotation Age for Seven Tree Species in the Cerrado Biogeographical Province of Bolivia. For. Ecol. Manag. 2013, 292, 49–55. [Google Scholar] [CrossRef]
- State Forestry Administration of China. China Forest Resources Report; China Forestry Publishing House: Beijing, China, 2014.
- He, H.; Zhu, G.; Ma, W.; Liu, F.; Zhang, X. Additivity of Stand Basal Area Predictions in Canopy Stratifications for Natural Oak Forests. For. Ecol. Manag. 2021, 492, 119246. [Google Scholar] [CrossRef]
- Wang, W.; Wang, J.; Meng, J. A Climate-Sensitive Mixed-Effects Tree Recruitment Model for Oaks (Quercus spp.) in Hunan Province, South-Central China. For. Ecol. Manag. 2023, 528, 120631. [Google Scholar] [CrossRef]
- Wang, W.; Chen, X.; Zeng, W.; Wang, J.; Meng, J. Development of a Mixed-Effects Individual-Tree Basal Area Increment Model for Oaks (Quercus spp.) Considering Forest Structural Diversity. Forests 2019, 10, 474. [Google Scholar] [CrossRef]
- Zhang, X.; Zhang, H.; Lu, J.; Lei, X. Early Effects of Crop Tree Release Tending on Growth of Natural Secondary Quercus mongolica Forest. Sci. Silvae Sin. 2020, 56, 83–92. [Google Scholar]
- Feng, Q.; Chen, C.; Qin, L.; He, Y.; Wang, P.; Duan, Y.; Wang, Y.; He, Y. Effects of Different Management Models on Stand Structure and Plant Diversity of Natural Secondary Forests of Quercus Mongolica. Sci. Silvae Sin. 2018, 54, 12–21. [Google Scholar]
- Li, Y.; Ye, S.; Hui, G.; Hu, Y.; Zhao, Z. Spatial Structure of Timber Harvested According to Structure-Based Forest Management. For. Ecol. Manag. 2014, 322, 106–116. [Google Scholar] [CrossRef]
- Wang, D.; Li, J.; Tang, T. Determining the Optimal Density of Phoebe Bournei Plantations Based on Dynamic Programming under Close-to-Nature Management Measures. Sustainability 2022, 14, 847. [Google Scholar] [CrossRef]
- Ji, Y.; Zhang, P.; Shen, H. Competition Intensity Affects Growing Season Nutrient Dynamics in Korean Pine Trees and Their Microhabitat Soil in Mixed Forest. For. Ecol. Manag. 2023, 539, 121018. [Google Scholar] [CrossRef]
- Metz, J.; Seidel, D.; Schall, P.; Scheffer, D.; Schulze, E.-D.; Ammer, C. Crown Modeling by Terrestrial Laser Scanning as an Approach to Assess the Effect of Aboveground Intra- and Interspecific Competition on Tree Growth. For. Ecol. Manag. 2013, 310, 275–288. [Google Scholar] [CrossRef]
- T/CSF 009-2019; Technical Standards on the Close-to-Natural and Multi-Functional Managements of the Natural Oak Forests. Chinese Society of Forestry: Beijing, China, 2019.
- GB/T 38590-2020; Technicalre Gulations for Continuous Forest Inventory. National Forestry and Grassland Administration: Beijing, China, 2020.
- Zhang, W. Forest Site of China; China Science Publishing House: Beijing, China, 1997. [Google Scholar]
- Pearl, R.; Reed, L. On the Rate of Growth of the Population of the United States since 1790 and Its Mathematical Representation. Proc. Natl. Acad. Sci. USA 1920, 6, 275–288. [Google Scholar] [CrossRef] [PubMed]
- Ware, G.O.; Ohki, K.; Moon, L.C. The Mitscherlich Plant Growth Model for Determining Critical Nutrient Deficiency Levels 1. Agron. J. 1982, 74, 88–91. [Google Scholar] [CrossRef]
- Winsor, C.P. The Gompertz Curve as a Growth Curve. Proc. Natl. Acad. Sci. USA 1932, 18, 1–8. [Google Scholar] [CrossRef] [PubMed]
- Schumacher, F. A New Growth Curve and Its Applicability to Timber Yield Studies. J. For. Res. 1939, 37, 819–820. [Google Scholar]
- Zhu, G.; Hu, S.; Chhin, S.; Zhang, X.; He, P. Modelling Site Index of Chinese Fir Plantations Using a Random Effects Model across Regional Site Types in Hunan Province, China. For. Ecol. Manag. 2019, 446, 143–150. [Google Scholar] [CrossRef]
- D’agostino Sr, R.B.; Russell, H.K. Scree Test. In Encyclopedia of Biostatistics; John Wiley & Sons, Ltd.: Hoboken, NJ, USA, 2005. [Google Scholar]
- Akaike, H. A New Look at the Statistical Model Identification. IEEE Trans. Autom. Control 1974, 19, 716–723. [Google Scholar] [CrossRef]
- Pinheiro, J.C.; Bates, D.M.; Pinheiro, J.C. Approximations to the Log-Likelihood Function in the Nonlinear Mixed-Effects Model. J. Comput. Graph. Stat. 1995, 4, 12. [Google Scholar]
- Schwarz, G. Estimating the Dimension of a Model. Ann. Stat. 1978, 6, 461–464. [Google Scholar] [CrossRef]
- Stone, M. Cross-Validatory Choice and Assessment of Statistical Predictions. J. R. Stat. Soc. Ser. B (Methodol.) 1974, 36, 111–133. [Google Scholar] [CrossRef]
- Hang, X. Forest Management, 4th ed.; China Forestry Publishing House: Beijing, China, 2011. [Google Scholar]
- Palahí, M.; Tomé, M.; Pukkala, T.; Trasobares, A.; Montero, G. Site Index Model for Pinus Sylvestris in North-East Spain. For. Ecol. Manag. 2004, 187, 35–47. [Google Scholar] [CrossRef]
- Bravo-Oviedo, A.; del Río, M.; Montero, G. Geographic Variation and Parameter Assessment in Generalized Algebraic Difference Site Index Modelling. For. Ecol. Manag. 2007, 247, 107–119. [Google Scholar] [CrossRef]
- LY/T 2118-2013; Guidelines for Large-Size Timber Cultivation. National Forestry and Grassland Administration: Beijing, China, 2013.
- Buongiorno, J.; Kolbe, A.; Vasievich, M. Economic and Ecological Effects of Diameter-Limit and BDq Management Regimes: Simulation Results for Northern Hardwoods. Silva Fenn. 2000, 34, 223–235. [Google Scholar] [CrossRef]
- Lu, H.; Buongiorno, J. Long- and Short-Term Effects of Alternative Cutting Regimes on Economic Returns and Ecological Diversity in Mixed-Species Forests. For. Ecol. Manag. 1993, 58, 173–192. [Google Scholar] [CrossRef]
- Duncker, P.S.; Barreiro, S.M.; Hengeveld, G.M.; Lind, T.; Mason, W.L.; Ambrozy, S.; Spiecker, H. Classification of Forest Management Approaches: A New Conceptual Framework and Its Applicability to European Forestry. Ecol. Soc. 2012, 17, art51. [Google Scholar] [CrossRef]
- da Silva, R.P.; dos Santos, J.; Tribuzy, E.S.; Chambers, J.Q.; Nakamura, S.; Higuchi, N. Diameter Increment and Growth Patterns for Individual Tree Growing in Central Amazon, Brazil. For. Ecol. Manag. 2002, 166, 295–301. [Google Scholar] [CrossRef]
- Sánchez-González, M.; Tomé, M.; Montero, G. Modelling Height and Diameter Growth of Dominant Cork Oak Trees in Spain. Ann. For. Sci. 2005, 62, 633–643. [Google Scholar] [CrossRef]
- Hein, S.; Dhôte, J.-F. Effect of Species Composition, Stand Density and Site Index on the Basal Area Increment of Oak Trees (Quercus sp.) in Mixed Stands with Beech (Fagus sylvatica L.) in Northern France. Ann. For. Sci. 2006, 63, 457–467. [Google Scholar] [CrossRef]
- Lhotka, J.M. Examining Growth Relationships in Quercus Stands: An Application of Individual-Tree Models Developed from Long-Term Thinning Experiments. For. Ecol. Manag. 2017, 385, 65–77. [Google Scholar] [CrossRef]
- Percel, G.; Parmain, G.; Laroche, F.; Bouget, C. The Larger, the Better? Effects of Delayed Diameter-Limit Cutting on Old-Growth Attributes and Saproxylic Beetle Diversity in Temperate Oak Forests. Eur. J. For. Res. 2018, 137, 237–249. [Google Scholar] [CrossRef]
- Nicolescu, V.-N.; Vor, T.; Mason, W.L.; Bastien, J.-C.; Brus, R.; Henin, J.-M.; Kupka, I.; Lavnyy, V.; La Porta, N.; Mohren, F.; et al. Ecology and Management of Northern Red Oak (Quercus rubra L. syn. Q. borealis F. Michx.) in Europe: A Review. For. Int. J. For. Res. 2020, 93, 481–494. [Google Scholar] [CrossRef]
- Ostrogović Sever, M.Z.; Alberti, G.; Delle Vedove, G.; Marjanović, H. Temporal Evolution of Carbon Stocks, Fluxes and Carbon Balance in Pedunculate Oak Chronosequence under Close-To-Nature Forest Management. Forests 2019, 10, 814. [Google Scholar] [CrossRef]
- Bölöni, J.; Ódor, P.; Ádám, R.; Keeton, W.S.; Aszalós, R. Quantity and Dynamics of Dead Wood in Managed and Unmanaged Dry-Mesic Oak Forests in the Hungarian Carpathians. For. Ecol. Manag. 2017, 399, 120–131. [Google Scholar] [CrossRef]
- Kurtz, W.B.; Garrett, H.E.; Williams, R.A. Young Stands of Scarlet Oak in Missouri Can Be Thinned Profitably. South. J. Appl. For. 1981, 5, 12–16. [Google Scholar] [CrossRef]
- Tkach, V.; Buksha, I.; Slych, O.; Pasternak, V. Optimization of Maturity Age for Coppice Oak Forests within Left-Bank Forest-Steppe in Ukraine. Cent. Eur. For. J. 2021, 67, 181–186. [Google Scholar] [CrossRef]
- Orwig, D.A.; Cogbill, C.V.; Foster, D.R.; O’Keefe, J.F. Variations in Old-Growth Structure and Definitions: Forest Dynamics on Wachusett Mountain, Massachusetts. Ecol. Appl. 2001, 11, 437–452. [Google Scholar] [CrossRef]
- Seydack, A.H.W. An Unconventional Approach to Timber Yield Regulation for Multi-Aged, Multispecies Forests. I. Fundamental Considerations. For. Ecol. Manag. 1995, 77, 139–153. [Google Scholar] [CrossRef]
- Zimmerman, B.L.; Kormos, C.F. Prospects for Sustainable Logging in Tropical Forests. BioScience 2012, 62, 479–487. [Google Scholar]
- Nicolescu, V.N.; Carvalho, J.; Hochbichler, E.; Bruckman, V.; Bruckman, V. Silvicultural Guidelines for European Coppice Forests; Albert Ludwig University Freiburg Printing Press: Freiburg, Germany, 2017. [Google Scholar]
- Laliberté, J.; Pothier, D.; Achim, A. Adjusting Harvest Rules for Red Oak in Selection Cuts of Canadian Northern Hardwood Forests. For. Int. J. For. Res. 2016, 89, 402–411. [Google Scholar] [CrossRef]

Disclaimer/Publisher’s Note: The statements, opinions and data contained in all publications are solely those of the individual author(s) and contributor(s) and not of MDPI and/or the editor(s). MDPI and/or the editor(s) disclaim responsibility for any injury to people or property resulting from any ideas, methods, instructions or products referred to in the content. |
© 2024 by the authors. Licensee MDPI, Basel, Switzerland. This article is an open access article distributed under the terms and conditions of the Creative Commons Attribution (CC BY) license (https://creativecommons.org/licenses/by/4.0/).