
Evaluating Coastal Douglas Fir Growth Responses to Nitrogen Application Using Tree Ring Chronologies

Abstract
:1. Introduction
2. Data and Methods
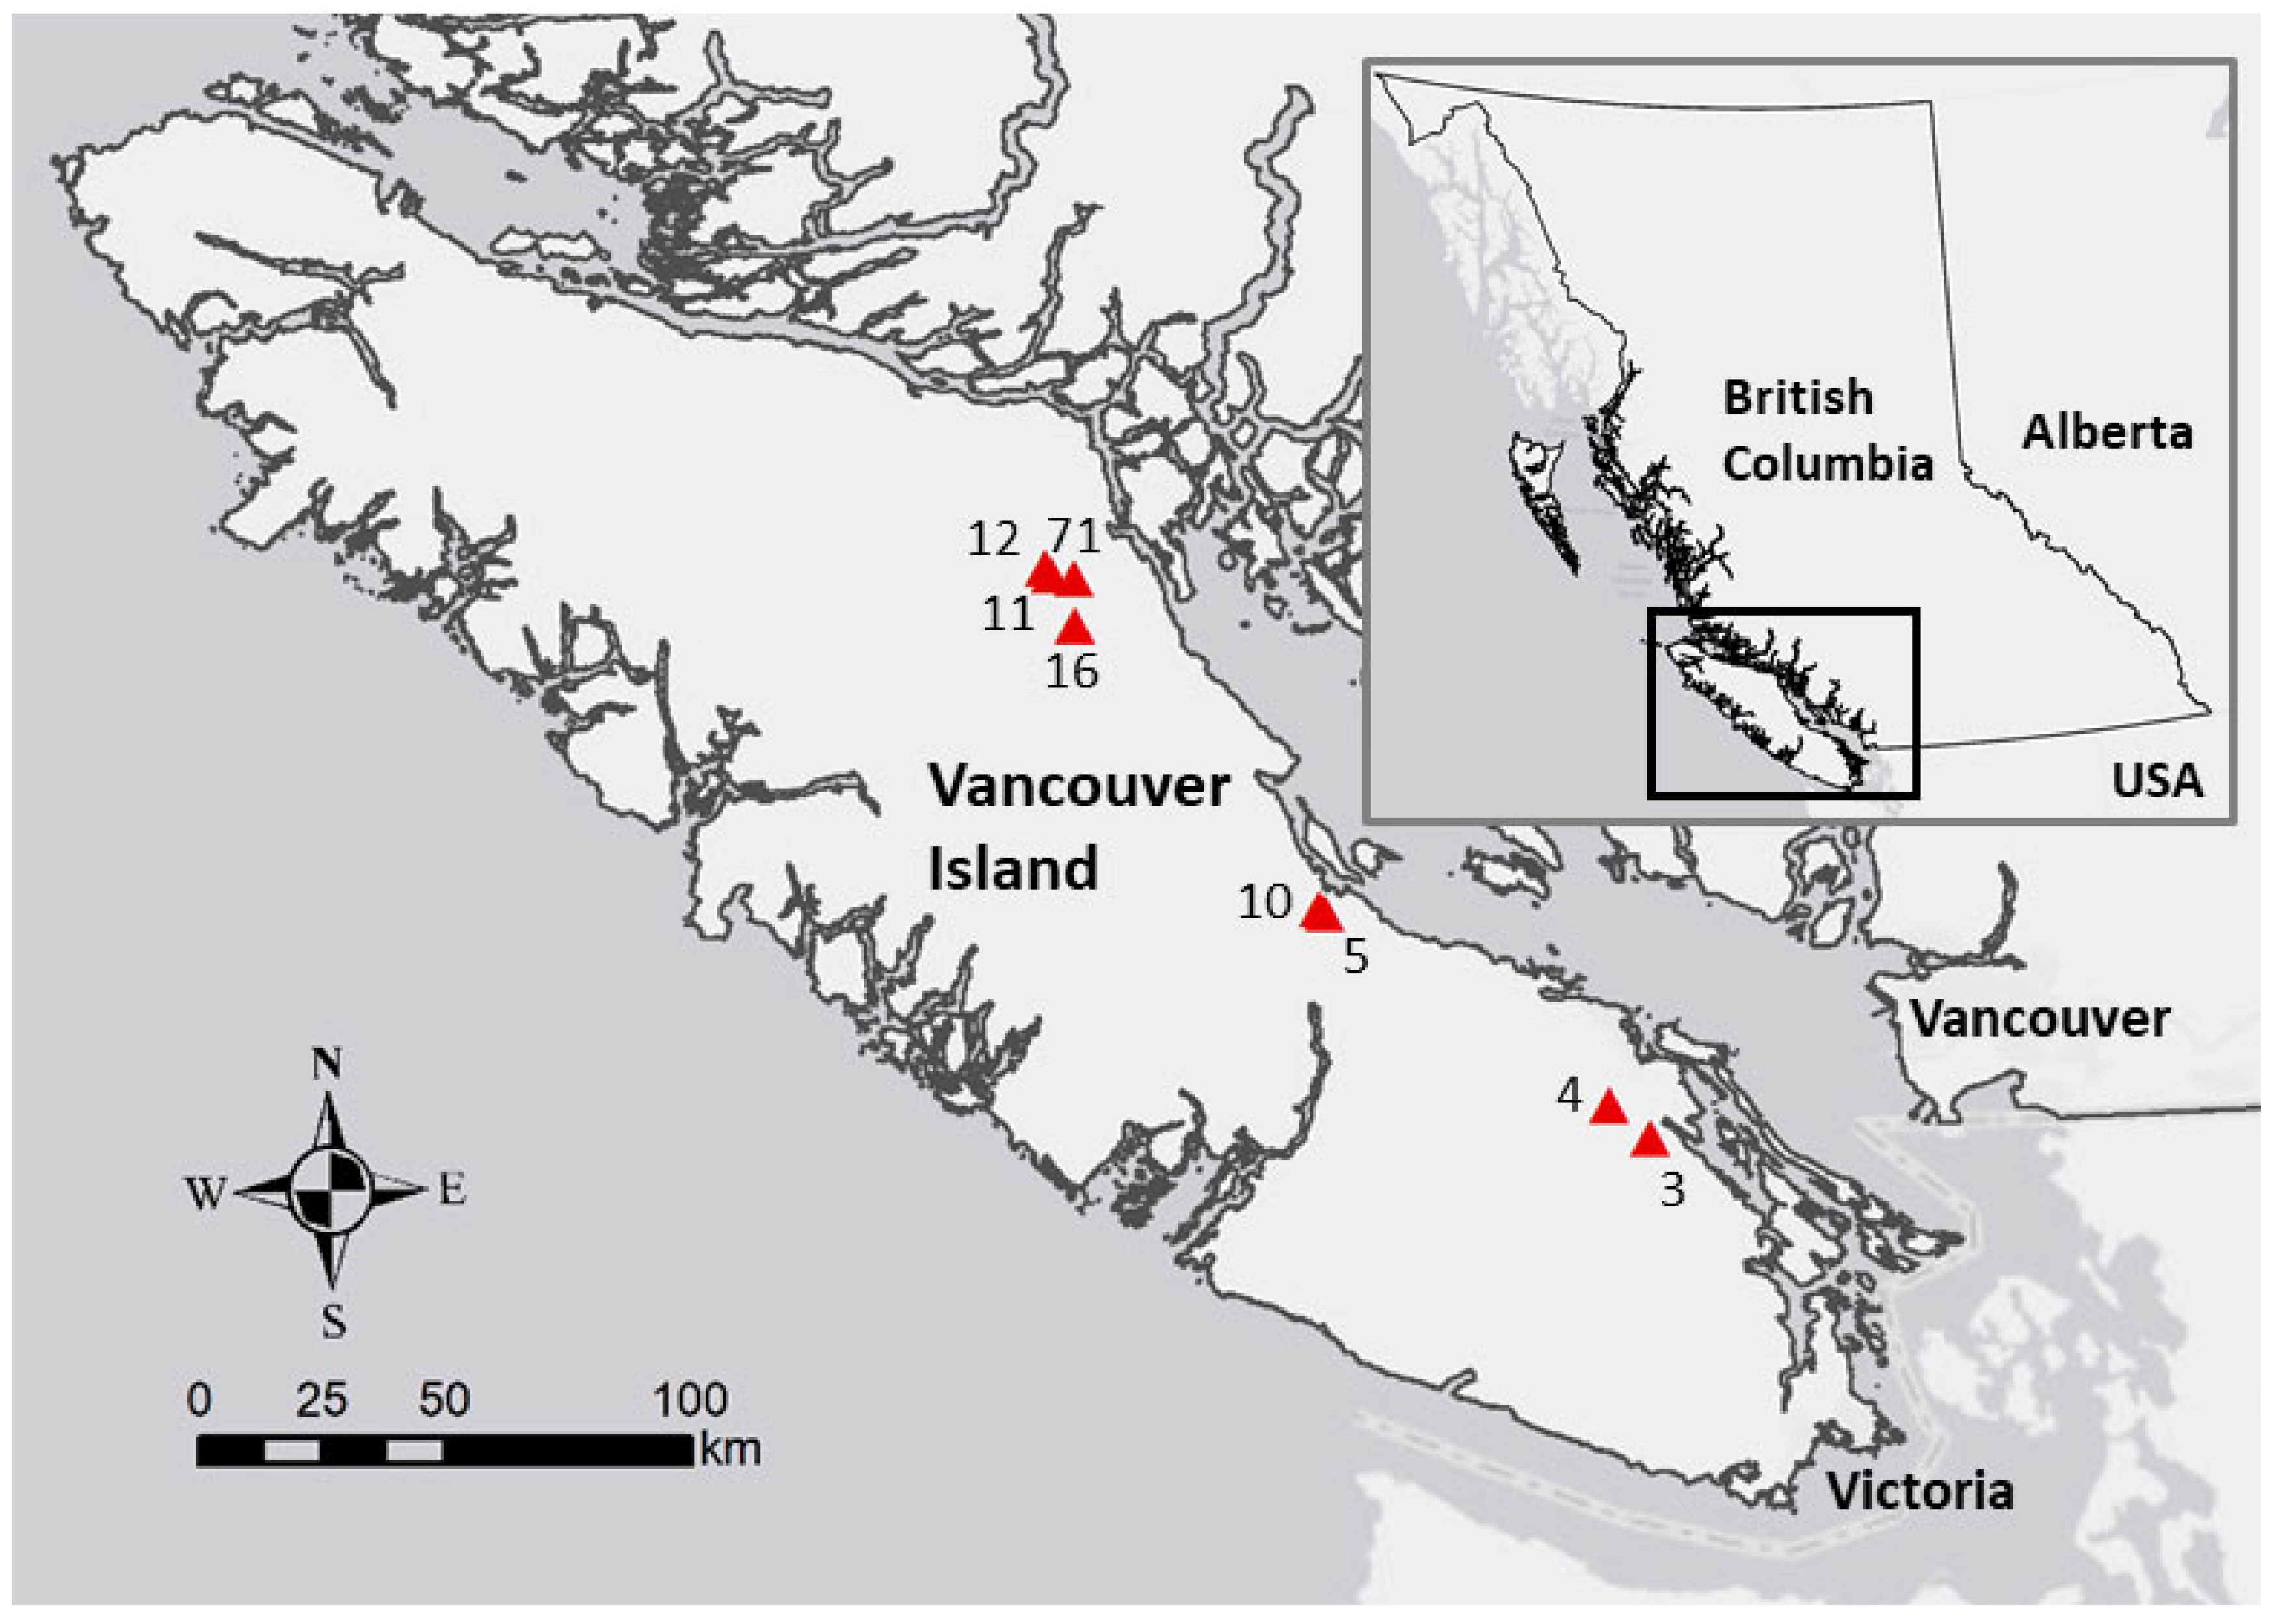
2.1. Study Site
2.2. Field and Laboratory Methods
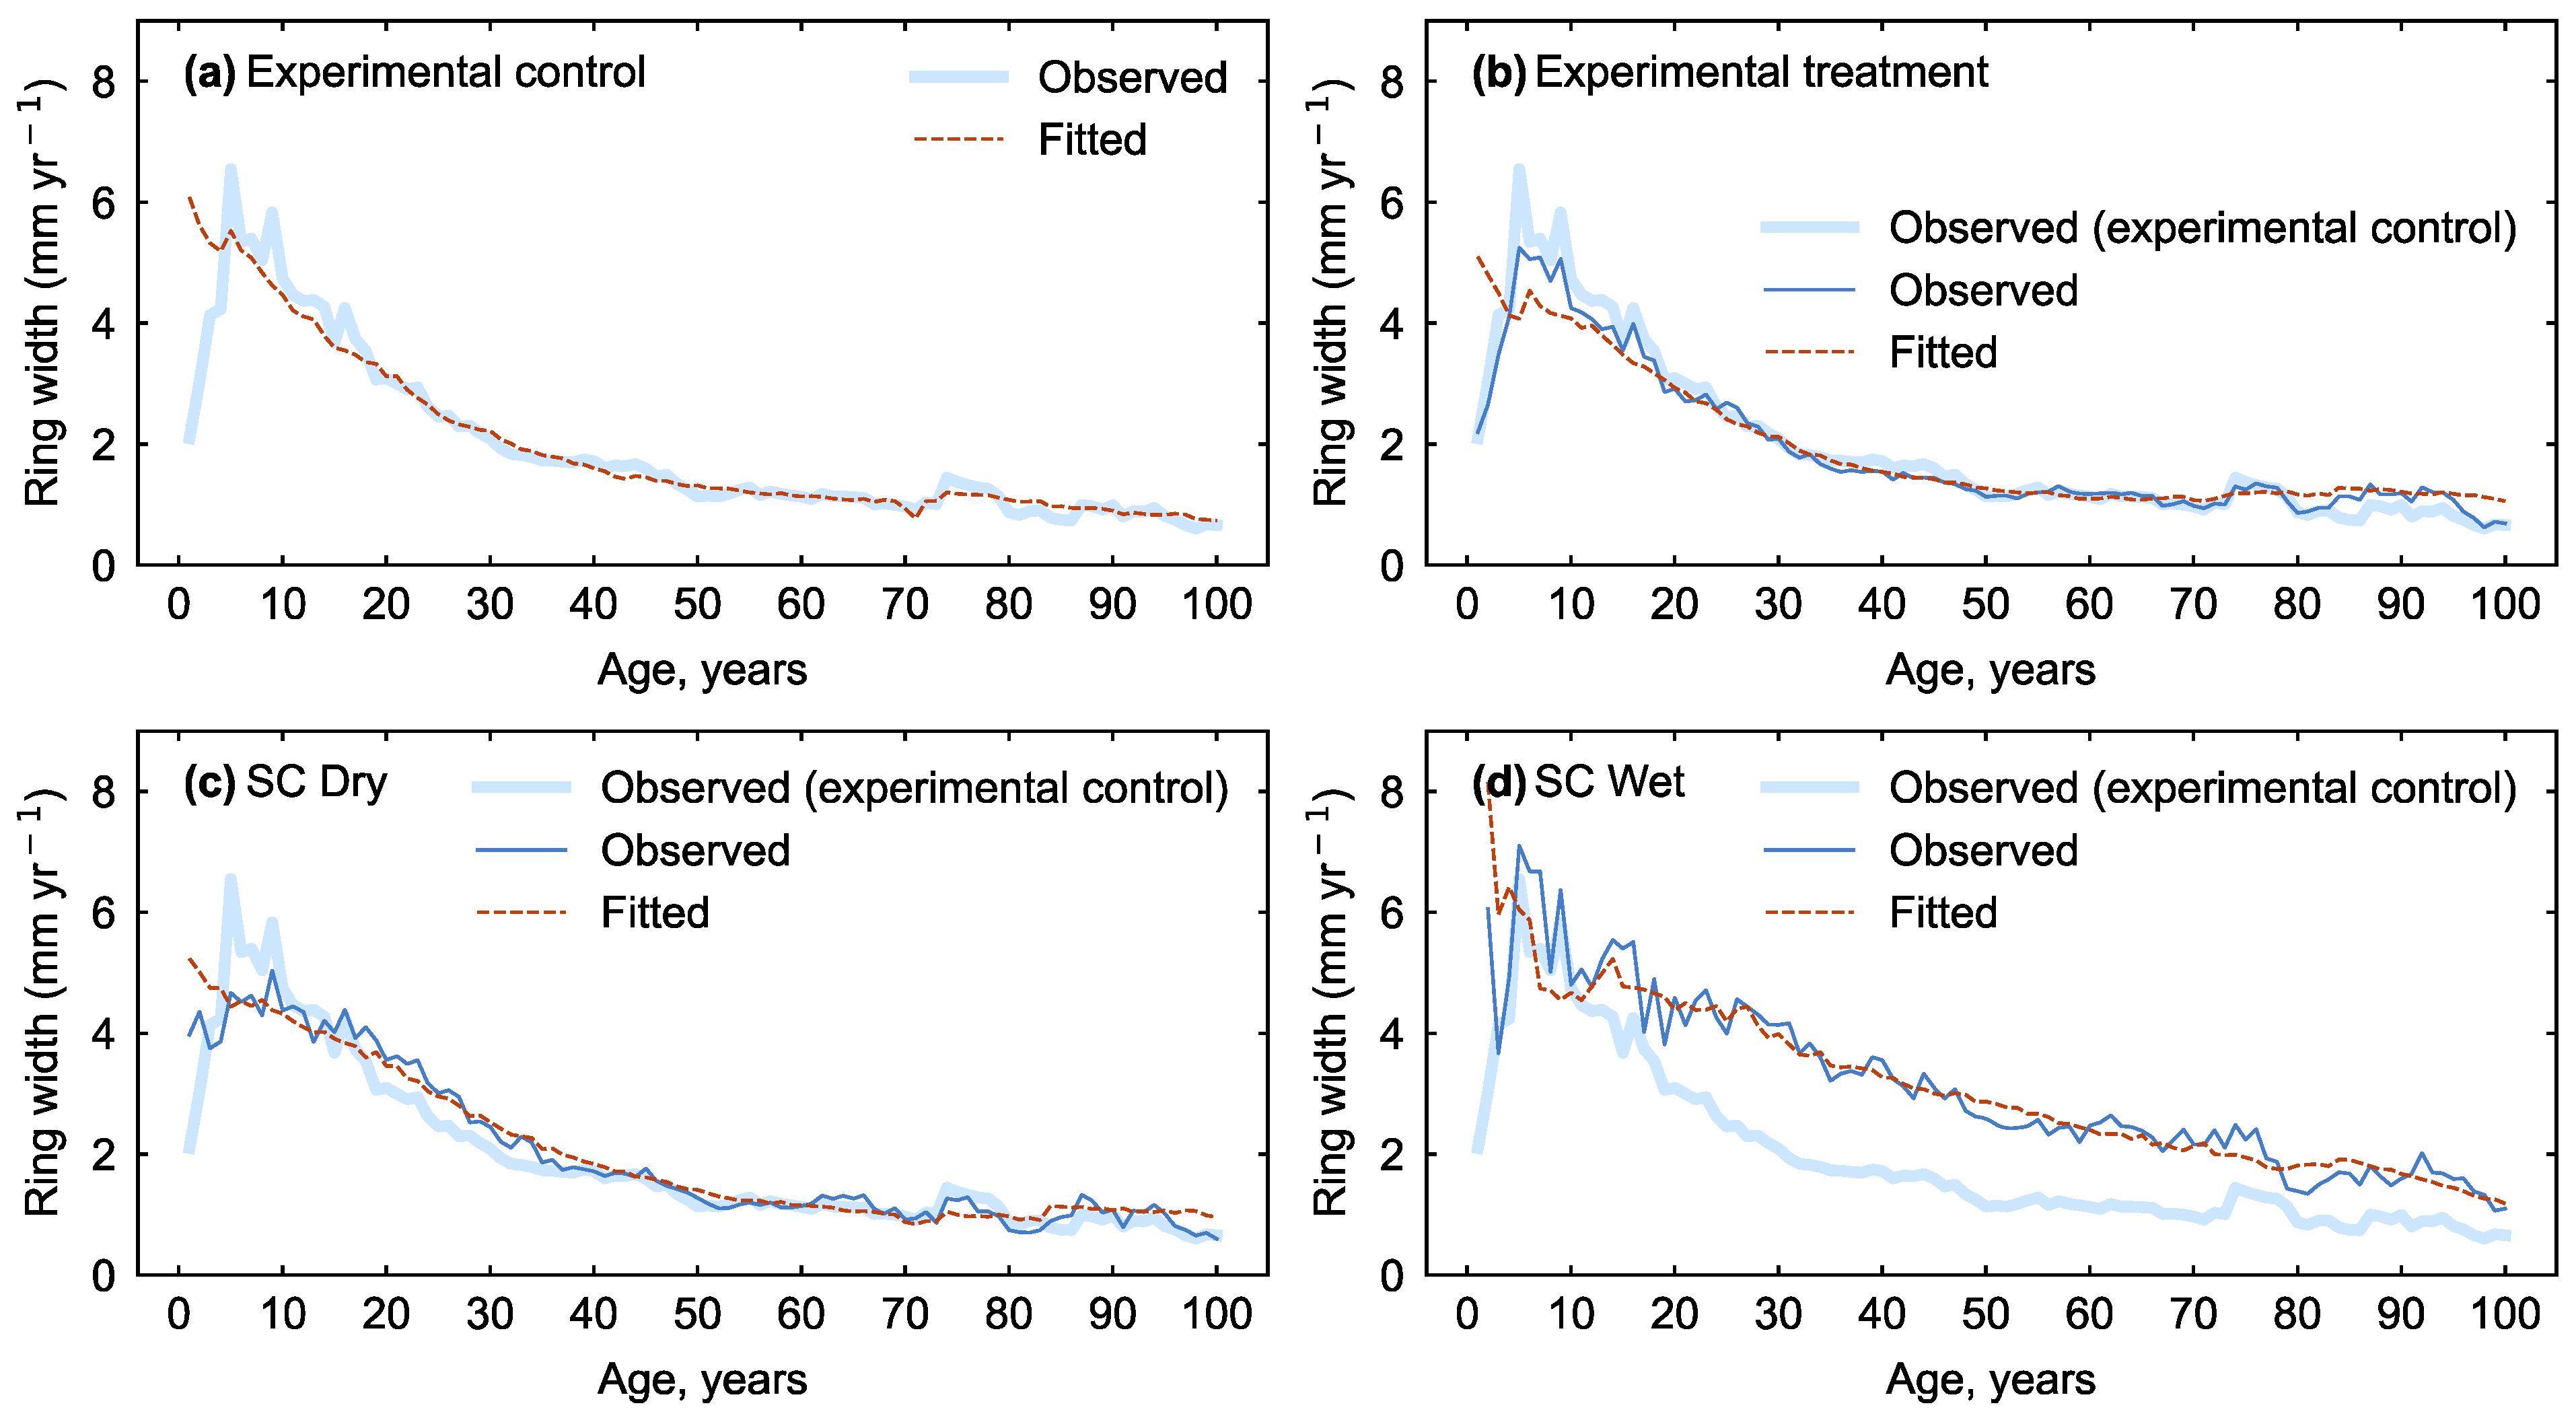
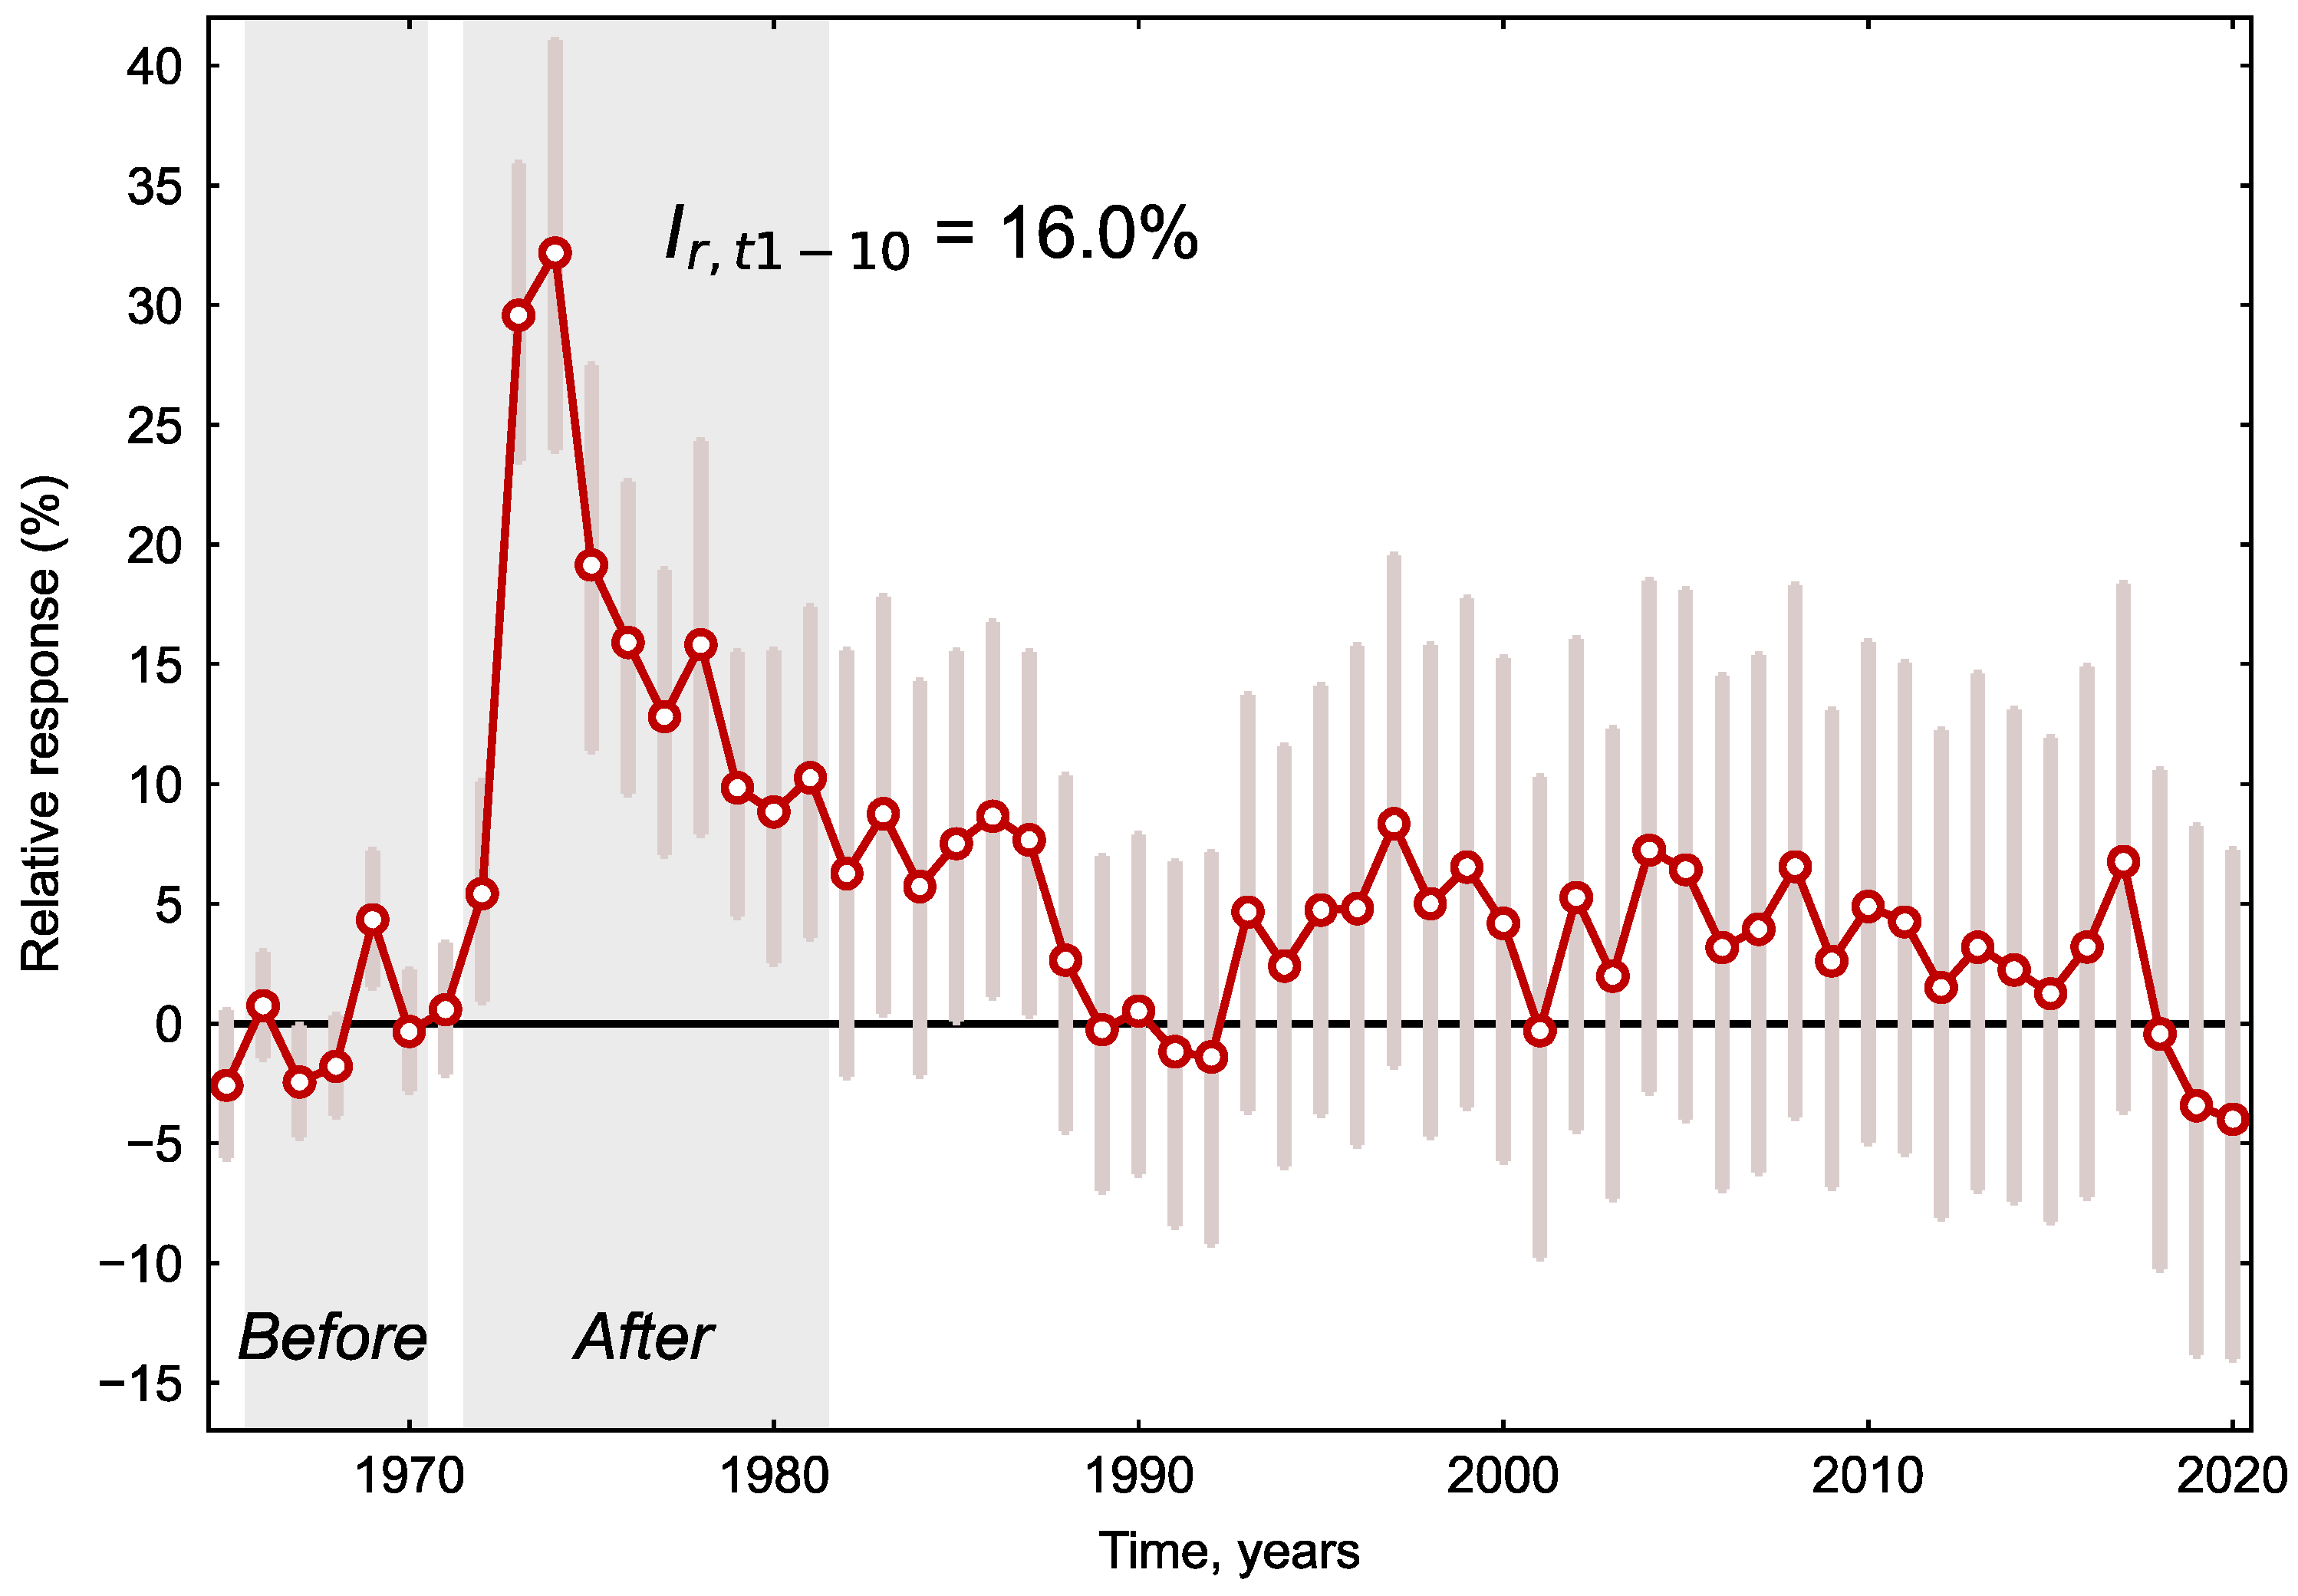
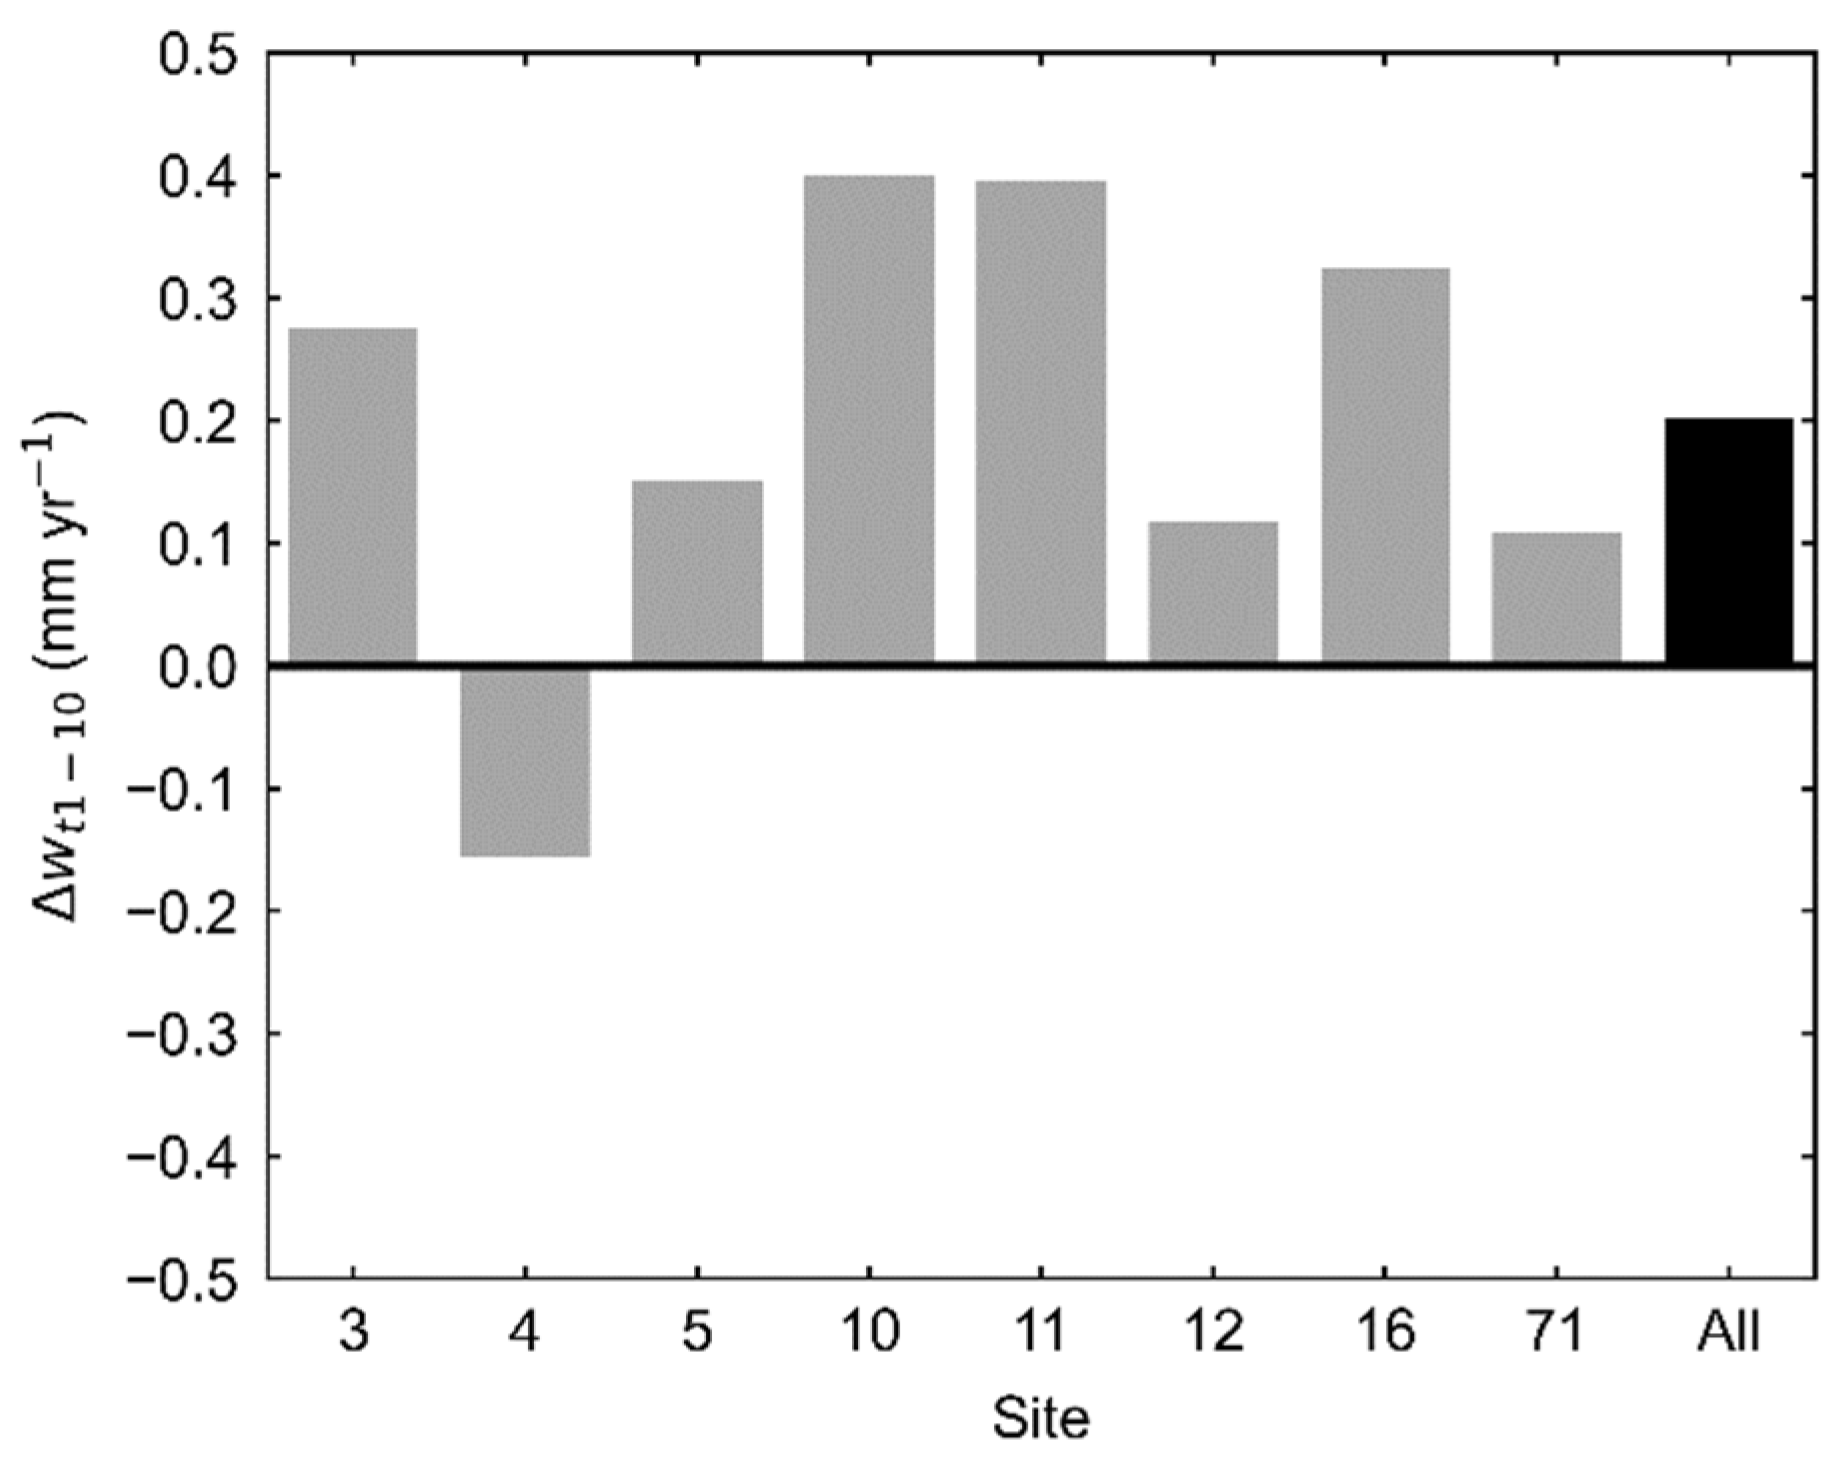
2.3. Estimating the Response to N Application
3. Results
4. Discussion
Author Contributions
Funding
Data Availability Statement
Acknowledgments
Conflicts of Interest
References
- Albaugh, T.J.; Vance, E.D.; Gaudreault, C.; Fox, T.R.; Allen, H.L.; Stape, J.L.; Rubilar, R.A. Carbon Emissions and Sequestration from Fertilization of Pine in the Southeastern United States. For. Sci. 2012, 58, 419–429. [Google Scholar] [CrossRef]
- Eriksson, E. Integrated Carbon Analysis of Forest Management Practices and Wood Substitution. Can. J. For. Res. 2007, 37, 671–681. [Google Scholar] [CrossRef]
- Sathre, R.; Gustavsson, L.; Bergh, J. Primary Energy and Greenhouse Gas Implications of Increasing Biomass Production through Forest Fertilization. Biomass Bioenergy 2010, 34, 572–581. [Google Scholar] [CrossRef]
- BC Silviculture Summary Dashboard. Available online: https://woongsoon.shinyapps.io/Silv_summary/ (accessed on 19 December 2022).
- Brix, H. Fertilization and Thinning Effect on Douglas-Fir Ecosystem at Shawnigan Lake: A Synthesis of Project Results; FRDA Research Program, Research Branch, BC Ministry of Forests and Lands: Victoria, BC, Canada, 1993. [Google Scholar]
- Brockley, R.P. Effects of Fertilization on the Growth and Foliar Nutrition of Immature Douglas-Fir in the Interior Cedar–Hemlock Zone of British Columbia: Six-Year Results; BC Ministry of Forests and Range: Victoria, BC, Canada, 2006. [Google Scholar]
- Brockley, R.P. Effects of Fertilization on the Nutrition and Growth of a Slow-Growing Engelmann Spruce Plantation in South Central British Columbia. Can. J. For. Res. 1992, 22, 1617–1622. [Google Scholar] [CrossRef]
- Filipescu, C.N.; Trofymow, J.A.; Koppenaal, R.S. Late-Rotation Nitrogen Fertilization of Douglas-Fir: Growth Response and Fibre Properties. Can. J. For. Res. 2016, 47, 134–138. [Google Scholar] [CrossRef]
- Gower, S.T.; Vogt, K.A.; Grier, C.C. Carbon Dynamics of Rocky-Mountain Douglas-Fir—Influence of Water and Nutrient Availability. Ecol. Monogr. 1992, 62, 43–65. [Google Scholar] [CrossRef]
- Jang, W.; Eskelson, B.N.I.; de Montigny, L.; Bealle Statland, C.A.; Sattler, D.F.; Ahmed, S. Stand Growth Responses after Fertilization for Thinned Lodgepole Pine, Douglas-Fir, and Spruce in Forests of Interior British Columbia, Canada. Can. J. For. Res. 2019, 49, 1471–1482. [Google Scholar] [CrossRef]
- Kishchuk, B.E.; Weetman, G.F.; Brockley, R.P.; Prescott, C.E. Fourteen-Year Growth Response of Young Lodgepole Pine to Repeated Fertilization. Can. J. For. Res. 2002, 32, 153–160. [Google Scholar] [CrossRef]
- Miller, R.; Tarrant, R. Long-Term Growth Response of Douglas-Fir to Ammonium Nitrate Fertilizer. For. Sci. 1983, 29, 127–137. [Google Scholar]
- Miller, R.E.; Clendenen, G.W.; Bruce, D. Volume Growth and Response to Thinning and Fertilizing of Douglas-Fir Stands in Southwestern Oregon; Pacific Northwest Research Station: Portland, OR, USA, 1988. [Google Scholar]
- Ballard, T.M.; Majid, N. Use of Pretreatment Increment Data in Evaluating Tree Growth Response to Fertilization. Can. J. For. Res. 1985, 15, 18–22. [Google Scholar] [CrossRef]
- Brockley, R. An Alternative Fertilization Monitoring Protocol; Ministry of Forests, Lands, Natural Resource Operations and Rural Development: Victoria, BC, Canada, 2015; Available online: https://www2.gov.bc.ca/assets/gov/environment/natural-resource-stewardship/land-based-investment/2an_alternative_fertilization_monitoring_protocol_revised_february_2015_final.pdf (accessed on 14 November 2022).
- Brockley, R.P.; Yole, D. Growth Response of Lodgepole Pine to Operational Fertilizer Application Near Burns Lake, BC; BC Ministry of Forests, Kalamalka Research Station: Vernon, BC, Canada, 1985. [Google Scholar]
- Braun, T.; Navratil, S. Development of an Operational Fertilization Program in Mid-to-Late-Rotation Lodgepole Pine Stands: An Indusry Testimonial. In Proceedings of the Enhanced Forest Management: Fertilization and Economics, Edmonton, AB, Canada, 1–2 March 2001. [Google Scholar]
- Brockley, R.P. Assessing the Fertilization Response Potential of Subalpine Fir (Abies Lasiocarpa): A Retrospective Study; Ministry of Forests and Range: Vernon, BC, Canada, 2010. [Google Scholar]
- Kohler, M.; Niederberger, J.; Wichser, A.; Bierbaß, P.; Rötzer, T.; Spiecker, H.; Bauhus, J. Using Tree Rings to Reconstruct Changes in Soil P Availability—Results from Forest Fertilization Trials. Dendrochronologia 2019, 54, 11–19. [Google Scholar] [CrossRef]
- Smolander, A.; Henttonen, H.M.; Nöjd, P.; Soronen, P.; Mäkinen, H. Long-Term Response of Soil and Stem Wood Properties to Repeated Nitrogen Fertilization in a N-Limited Scots Pine Stand. Eur. J. For. Res. 2022, 141, 421–431. [Google Scholar] [CrossRef]
- Klassen, H.; Saunder, S.C.; Kranabetter, M.; MacKinnon, A.; Fitzpatrick, O. Establishment of an Interdisciplinary Project to Evaluate Ecological Implications of Climate Change in Dry South Coast Forest Ecosystems; BC Ministry of Forests, Lands and Natural Resource Operations: Vanderhoof, BC, Canada, 2015. [Google Scholar]
- Meidinger, D.; Pojar, J. Ecosystems of British Columbia; Ministry of Forests: Victoria, BC, Canada, 1991. [Google Scholar]
- Adams, H.R.; Barnard, H.R.; Loomis, A.K. Topography Alters Tree Growth–Climate Relationships in a Semi-Arid Forested Catchment. Ecosphere 2014, 5, art148. [Google Scholar] [CrossRef]
- Hember, R.A.; Coops, N.C.; Kurz, W.A. Statistical Performance and Behaviour of Environmentally-Sensitive Composite Models of Lodgepole Pine Growth. For. Ecol. Manag. 2018, 408, 157–173. [Google Scholar] [CrossRef]
- Nicklen, E.F.; Roland, C.A.; Ruess, R.W.; Schmidt, J.H.; Lloyd, A.H. Local Site Conditions Drive Climate–Growth Responses of Picea Mariana and Picea Glauca in Interior Alaska. Ecosphere 2016, 7, e01507. [Google Scholar] [CrossRef]
- Cieszewski, C.J.; Bella, I.E. Polymorphic Height and Site Index Curves for Lodgepole Pine in Alberta. Can. J. For. Res. 1989, 19, 1151–1160. [Google Scholar] [CrossRef]
- Gadow, K.; Hui, G. Modelling Forest Development; Academy of Forest Sciences: Beijing, China; Faculty of Forest Sciences and Woodland Ecology: Göttingen, Germany, 1998. [Google Scholar]
- Weiskittel, A.; Hann, D.; Kershaw, J.; Vanclay, J. Whole-Stand and Size-Class Models. In Forest Growth and Yield Modeling; John Wiley & Sons, Ltd.: Hoboken, NJ, USA, 2011; pp. 53–68. ISBN 978-1-119-99851-8. [Google Scholar]
- Cook, E.R.; Kairiukstis, L.A. Methods of Dendrochronology. Applications in the Environmental Sciences; International Institute for Applied Systems Analysis, Kluwer Academic Publishers: Dordrecht, The Netherlands, 1990. [Google Scholar]
- Brubaker, L. Spatial Patterns of Tree Growth Anomalies in the Pacific Northwest. Ecology 1980, 61, 798–807. [Google Scholar] [CrossRef]
- Griesbauer, H.P.; Klassen, H.; Saunders, S.C.; Spittlehouse, D.L. Variation in Climate-Growth Relationships for Douglas-Fir Growth across Spatial and Temporal Scales on Southern Vancouver Island, British Columbia. For. Ecol. Manag. 2019, 444, 30–41. [Google Scholar] [CrossRef]
- Stone, J.N. Extensive Studies of Fertilizing and Thinning Coastal Douglas-Fir and Western Hemlock: An Installation Report; BC Ministry of Forests: Victoria, BC, Canada, 1994. [Google Scholar]
- Omule, S.A. Net Basal Area Response 9 Years after Fertilizing Thinned and Unthinned Douglas-Fir; Ministry of Forestry Research Branch: Victoria, BC, Canada, 1990. [Google Scholar]
- Larsson, L. CDendro Package Version 9.6. Cybis Elektronik & Data AB. Available online: www.cybis.se (accessed on 24 January 2022).
- Maxwell, R.S.; Larsson, L.-A. Measuring Tree-Ring Widths Using the CooRecorder Software Application. Dendrochronologia 2021, 67, 125841. [Google Scholar] [CrossRef]
- Holms, R.L. Computer -Assisted Quality Control in Tree -Ring Dating and Measurement. Tree-Ring Bull. 1983, 43, 51–67. [Google Scholar]
- Wang, T.; Hamann, A.; Spittlehouse, D.; Carroll, C. Locally Downscaled and Spatially Customizable Climate Data for Historical and Future Periods for North America. PLoS ONE 2016, 11, e0156720. [Google Scholar] [CrossRef]
- R Development Core Team. R: A Language and Environment for Statistical Computing; R Foundation for Statistical Computing: Vienna, Austria, 2021. [Google Scholar]
- Bunn, A.G. A Dendrochronology Program Library in R (dplR). Dendrochronologia 2008, 26, 115–124. [Google Scholar] [CrossRef]
- Brix, H. Effects of Thinning and Nitrogen-Fertilization on Growth of Douglas-Fir—Relative Contribution of Foliage Quantity and Efficiency. Can. J. For. Res. 1983, 13, 167–175. [Google Scholar] [CrossRef]
- Lee, S.-C.; Black, T.A.; Jassal, R.S.; Christen, A.; Meyer, G.; Nesic, Z. Long-Term Impact of Nitrogen Fertilization on Carbon and Water Fluxes in a Douglas-Fir Stand in the Pacific Northwest. For. Ecol. Manag. 2020, 455, 117645. [Google Scholar] [CrossRef]
- Albaugh, T.J.; Fox, T.R.; Allen, H.L.; Rubilar, R.A. Juvenile Southern Pine Response to Fertilization Is Influenced by Soil Drainage and Texture. Forests 2015, 6, 2799–2819. [Google Scholar] [CrossRef]
- Littke, K.M.; Cross, J.; Harrison, R.B.; Zabowski, D.; Turnblom, E. Understanding Spatial and Temporal Douglas-Fir Fertilizer Response in the Pacific Northwest Using Boosted Regression Trees and Linear Discriminant Analysis. For. Ecol. Manag. 2017, 406, 61–71. [Google Scholar] [CrossRef]
- Littke, K.M.; Harrison, R.B.; Zabowski, D.; Briggs, D.G. Assessing Nitrogen Fertilizer Response of Coastal Douglas-Fir in the Pacific Northwest Using a Paired-Tree Experimental Design. For. Ecol. Manag. 2014, 330, 137–143. [Google Scholar] [CrossRef]
- Weetman, G.F.; Fournier, R.M.; Schnorbus, E. Lodgepole Pine Fertilization Screening Trials: Four-Year Growth Response Following Initial Predictions. Soil Sci. Soc. Am. J. 1988, 52, 833–839. [Google Scholar] [CrossRef]


| Site | DBH (cm) | Height (m) | ||||||
|---|---|---|---|---|---|---|---|---|
| F † | C | SCDry | SCWet | F | C | SCDry | SCWet | |
| 3 | 45.4 | 45.6 | 37.2 | 52.8 | 34.3 | 35.6 | 30.4 | 34.5 |
| 4 | 37.2 | 35.2 | 42.0 | 48.2 | 33.8 | 30.5 | 31.5 | 37.8 |
| 5 | 29.1 | 30.5 | 30.0 | 29.1 | 25.6 | 27.0 | 23.2 | 42.1 |
| 10 | 33.4 | 31.9 | 32.8 | 59.1 | 27.6 | 25.9 | 24.2 | 34.4 |
| 11 | 32.8 | 35.1 | 40.4 | 44.6 | 28.7 | 30.3 | 26.4 | 37.7 |
| 12 | 28.3 | 29.2 | 36.2 | 51.0 | 29.1 | 27.7 | 20.9 | 38.5 |
| 16 | 36.4 | 37.1 | 31.2 | 46.5 | 32.6 | 31.7 | 23.3 | 35.6 |
| 71 | 34.1 | 30.4 | 34.5 | 50.5 | 28.7 | 25.0 | 26.0 | 36.8 |
| Mean | 34.0 | 34.0 | 35.5 | 47.7 | 29.6 | 29.0 | 25.7 | 37.2 |
| Site | Mean Annual Air Temperature (°C) | Mean Annual Precipitation Depth (mm yr−1) | Number of Dated Series | Average Series Length (Years) | Timespan, Calendar Years | Mean Inter-Series Correlation | Mean First-Order Autocorrelation |
|---|---|---|---|---|---|---|---|
| 3 | 7.4 | 1759 | 45 | 79.9 | 1919–2020 | 0.50 | 0.84 |
| 4 | 10.2 | 1105 | 49 | 62.2 | 1937–2020 | 0.57 | 0.82 |
| 5 | 4.5 | 2505 | 72 | 62.5 | 1949–2020 | 0.61 | 0.82 |
| 10 | 6.2 | 2153 | 62 | 65.7 | 1947–2020 | 0.58 | 0.83 |
| 11 | 8.1 | 1530 | 57 | 61.4 | 1948–2020 | 0.61 | 0.83 |
| 12 | 7.9 | 1571 | 58 | 57.4 | 1955–2020 | 0.63 | 0.82 |
| 16 | 7.7 | 1474 | 59 | 57.5 | 1957–2020 | 0.60 | 0.81 |
| 71 | 8.3 | 1518 | 60 | 67.0 | 1949–2020 | 0.61 | 0.77 |
Disclaimer/Publisher’s Note: The statements, opinions and data contained in all publications are solely those of the individual author(s) and contributor(s) and not of MDPI and/or the editor(s). MDPI and/or the editor(s) disclaim responsibility for any injury to people or property resulting from any ideas, methods, instructions or products referred to in the content. |
© 2023 by the authors. Licensee MDPI, Basel, Switzerland. This article is an open access article distributed under the terms and conditions of the Creative Commons Attribution (CC BY) license (https://creativecommons.org/licenses/by/4.0/).
Share and Cite
Hember, R.A.; Axelson, J.N.; Jang, W. Evaluating Coastal Douglas Fir Growth Responses to Nitrogen Application Using Tree Ring Chronologies. Forests 2024, 15, 13. https://doi.org/10.3390/f15010013
Hember RA, Axelson JN, Jang W. Evaluating Coastal Douglas Fir Growth Responses to Nitrogen Application Using Tree Ring Chronologies. Forests. 2024; 15(1):13. https://doi.org/10.3390/f15010013
Chicago/Turabian StyleHember, Robbie A., Jodi N. Axelson, and Woongsoon Jang. 2024. "Evaluating Coastal Douglas Fir Growth Responses to Nitrogen Application Using Tree Ring Chronologies" Forests 15, no. 1: 13. https://doi.org/10.3390/f15010013
APA StyleHember, R. A., Axelson, J. N., & Jang, W. (2024). Evaluating Coastal Douglas Fir Growth Responses to Nitrogen Application Using Tree Ring Chronologies. Forests, 15(1), 13. https://doi.org/10.3390/f15010013