Abstract
To reduce the cutting force and cutting energy consumption during the operation of tree-climbing pruning machines for poplar trees, a linear cutting test bench device for branches was designed according to the growth characteristics of poplar branches and pruning forestry requirements in this study. Firstly, the cutting mechanical analysis of poplar branches was carried out to explore the significance parameters affecting the cutting force, and then the cutting performance test and parameter optimization of poplar branches was carried out through the response surface method (RSM). The test results indicated that cutting speed, tool edge angle and tool back angle had significant effects on the ultimate shear stress, cutting power consumption per unit area, and the branch damage rate of poplar branches, and the established regression equation demonstrated high goodness of fit. Meanwhile, a second-order regression mathematical model was developed between ultimate shear stress, cutting the power consumption per unit area of the cut and the branch damage rate, and the significance parameter. The non-dominated Sorting Genetic Algorithm II (NSGA-II) was used for multi-objective optimization computation to obtain the optimal combination of cutting parameters as 3.02 m/s for cutting speed, 15° for tool edge angle, and 3° for tool back angle. In this case, the ultimate shear stress, cutting power consumption per unit area, and branch damage rate of poplar branches were small, which were 346.63 kPa, 9.35 mJ/mm2, and 12.36%, respectively. Through the test verification, it can be seen that the relative error between the verification test and the predicted value of model was less than 7%. Moreover, under a cutting tool edge angle of 15°, the ultimate shear stress, cutting power consumption per unit area, and branch damage rate were, respectively, reduced by 17.29%, 14.98%, and 34.21% compared with those under a cutting tool edge angle of 20°, which verifies the validity and reliability of the test results and the research method. This study can provide data support and reference for the research and development of energy-efficient poplar tree-climbing pruning equipment and related branch-cutting performance tests.
1. Introduction
Poplar is a plant of the genus Populus, and it is the most widely distributed and adaptable tree species in the world [1]. There are about 100 species in the genus, which are mainly distributed in Europe, Asia, and North America, and 57 species are distributed in China, mostly in Central China, North China, Northwest China, and Northeast China. As one of the three fast-growing afforestation tree species (eucalyptus, poplar, and pine) recommended by the Food and Agriculture Organization of the United Nations, poplar can be used in industrial timber forests, ecological shelter forests, and agroforestry shelter forests [2]. Currently, it is one of the important fast-growing timber tree species in China. According to statistics, as of 2019, the national poplar planting area reached 8.25 million hectares, ranking first in the world, and the planting area maintained a steady growth trend [3].
Pruning is a very important management measure in the nurturing process of poplar, which can improve the ventilation and light transmission conditions of the canopy and regulate the nutrient distribution between the trunk and branches. Scientific and rational pruning is crucial for protecting the ecological environment, improving wood quality, and solving the problem of supply and demand of wood resources, as well as the healthy development of China’s poplar industry [4,5]. At present, China’s poplars are mainly pruned with artificial assistance, and pruning or sawing is used for pruning operations through ladders or lifting platforms, in which exist high labor intensity, low efficiency, poor safety and other issues. With the continuous increase in the poplar planting scale, relying only on manual pruning cannot meet the production needs, and the demand for mechanized pruning equipment is increasingly urgent. According to the existing research methodology, before conducting pruner design and testing, it is generally necessary to carry out indoor relevant bench performance test studies to determine the relevant parameters [6,7]. Therefore, it is of high guiding significance to design poplar branch-cutting bench devices and clarify the relevant cutting parameters for developing pruning equipment, which can provide basic data and an important basis for the design and optimization of poplar branch pruning machinery.
In the past few years, many scholars have investigated the pruning and cutting performance of fruit trees and crops such as apples, pears, longan, etc. The cutting methods are mainly reciprocating and rotary [8,9,10]. Song et al. designed a rotary cutting device for sisal leaves and explored the influence of blade elevation angle, blade inclination angle, and cutting speed on ultimate shear stress and specific cutting energy [11,12]. Wang et al. utilized the electric horizontal cutting force test platform to study the effects of citrus stem diameter and moisture content, citrus fruit weight, cutting speed, leaf gap, and citrus fruit stem deflection angle on the cutting peak force [13]. Meng et al. employed the finite element ANSYS/LS-DYNA 2022 software and the bench device to study the effects of the number of circular saw blade teeth, cutting speed, feed speed, and branch diameter on the cutting stress and force of mulberry branches [14]. Mathanker et al. used a self-made test bench to test cutting speed and tool tilting angle as influencing factors and cutting power consumption as the objective function. The results indicated that the cutting power consumption was the smallest (0.26 J/mm) when the cutter inclination angle was 60° and the cutting speed was 7.9 m/s [15]. Kang et al. developed a reciprocating apple branch cutting test bench and investigated the influence of tool sliding angle, cutting clearance, and cutting speed on peak cutting force [16]. Zhang et al. designed a reciprocating cutting test bench for millet stems. The influence of cutting inclination angle, blade inclination angle, and cutting speed on the ultimate shear stress of stems and cutting power consumption per unit area was studied, and the optimal cutting parameters were determined. The ultimate shear stress of stems and the cutting power consumption per unit area were reduced by 6.6% and 3.9%, respectively [17]. Ding et al. utilized a self-made bench to study the influence of moving knife rake angle, moving knife wedge angle, and cutting speed on the peak cutting force and cutting power consumption of pear branches, and based on this, the optimal combination of the cutting parameters was determined [18]. Wu et al. utilized a self-made bench to study the influence of blade shape, branch diameter, blade angle, cutting gap, and cutting speed on the peak cutting force of longan branches [19].
According to the existing research on the cutting performance of fruit tree branches and stems, there are few relevant reports on the cutting performance of poplar branches. The previous research provides the basic theory and method for designing poplar branch cutting bench devices and the experimental study of cutting performance. In this paper, combined with the growth law of poplar branches and the characteristics of pruning forest art, a linear cutting bench device for poplar branches was designed, and the cutting performance test and parameter optimization were conducted. Analyzing the main influencing factors of its cutting performance through the theory of poplar branch cutting, and preliminarily determining the range of its value, the effects of various experimental factors on ultimate shear stress, cutting power consumption per unit area, and branch damage rate were investigated, and the optimal cutting parameters with low damage and low power consumption were determined. The study provides a reference for the optimized design of poplar pruning machinery and related experimental research.
2. Design and Working Principle of Linear Cutting Test Bench Device
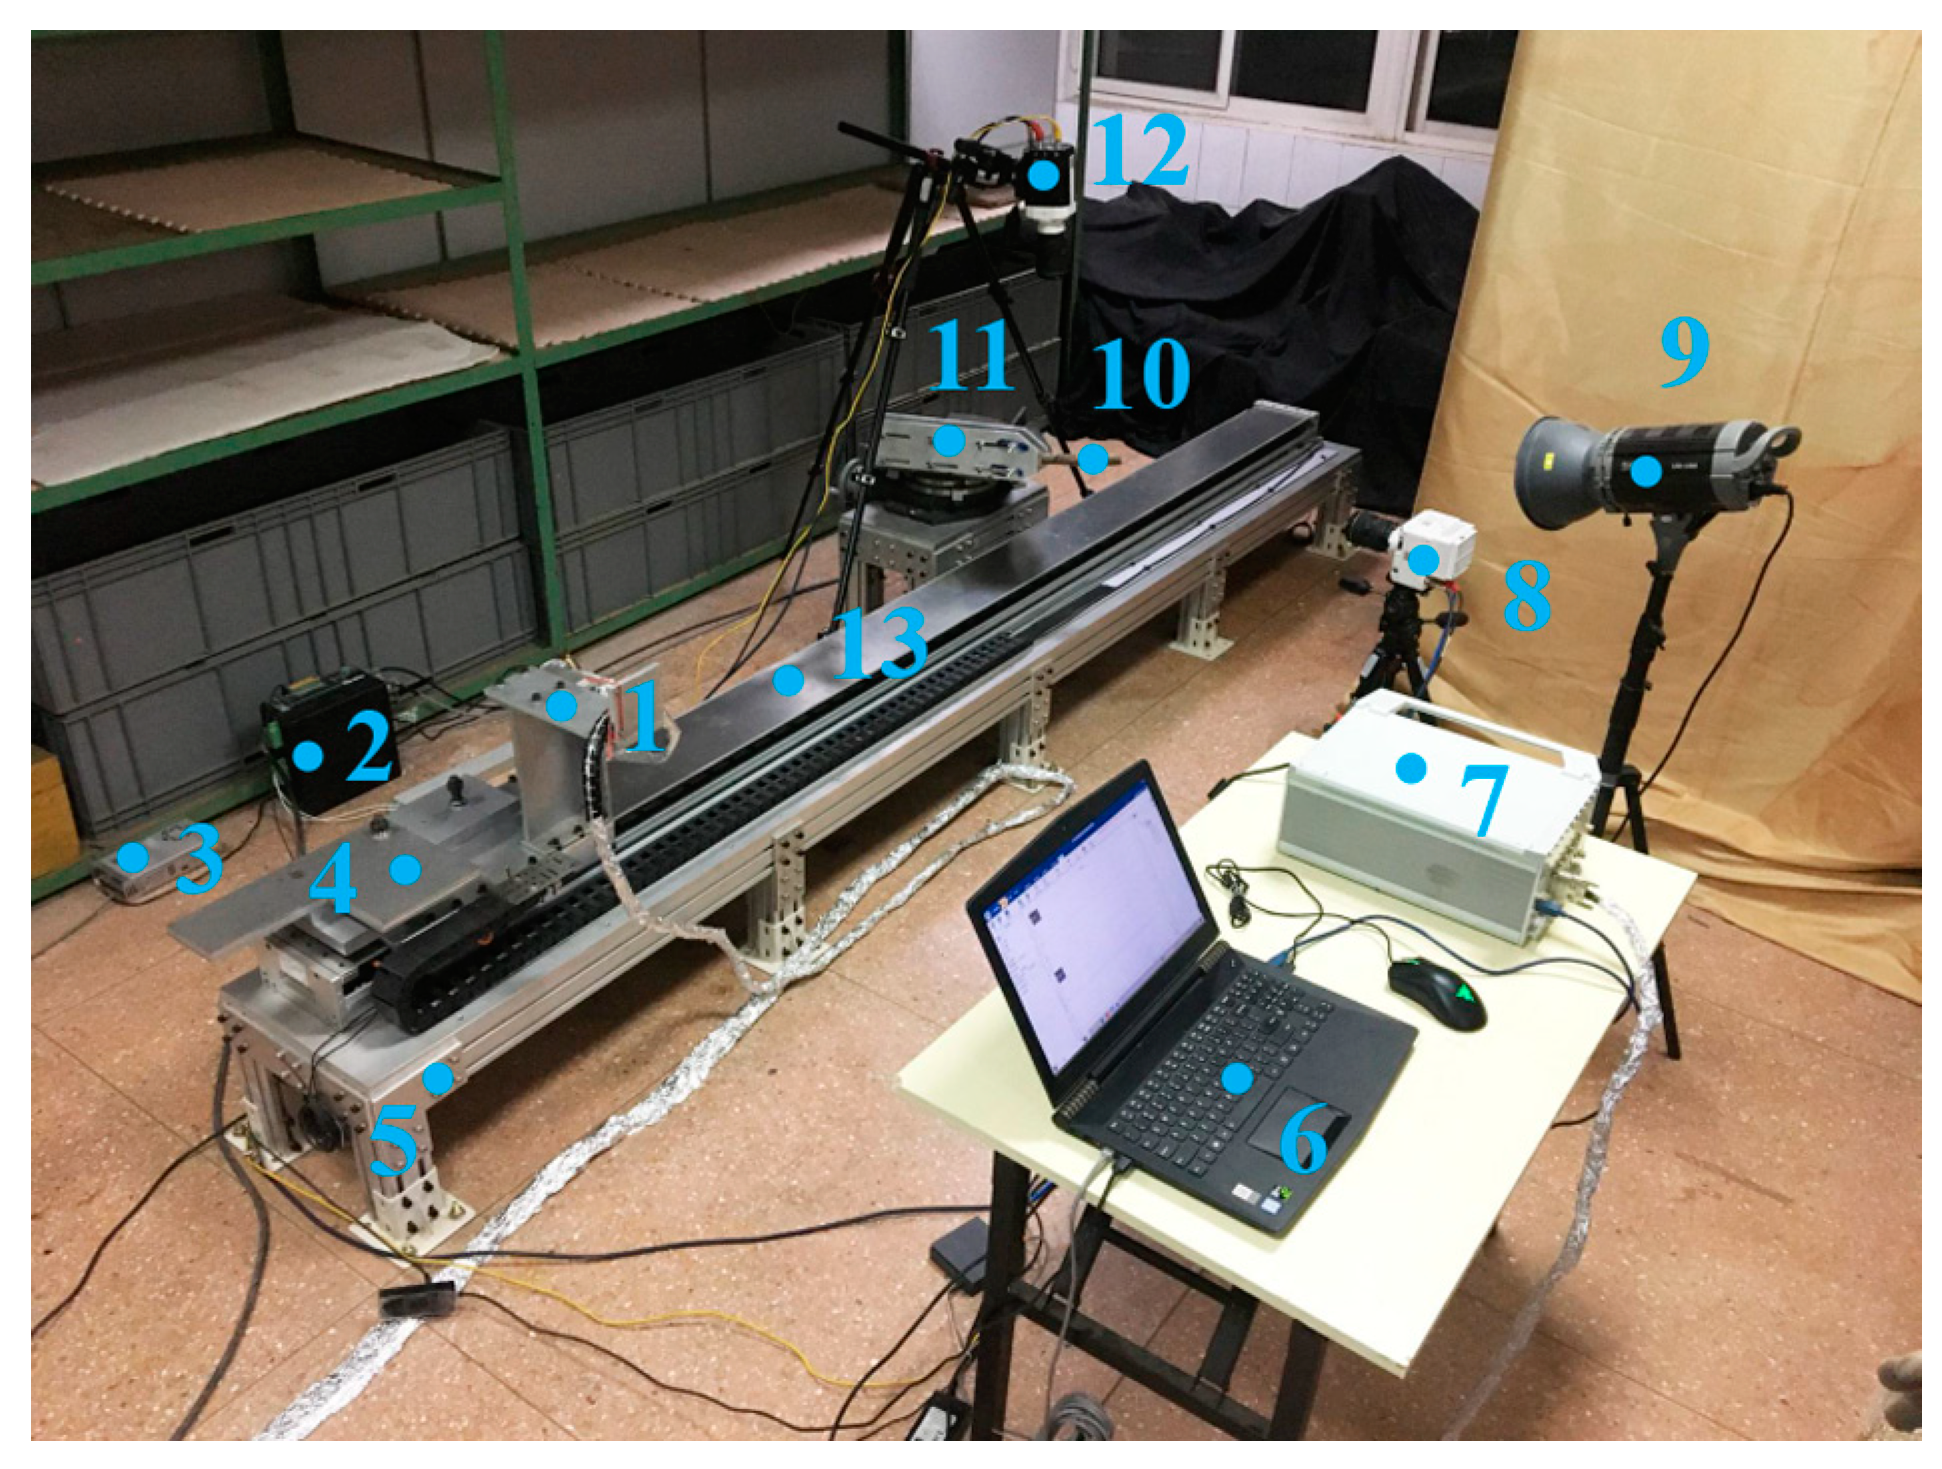
In this paper, a linear cutting test bench device is designed for poplar branches according to the growth characteristics of poplar branches and the characteristics of pruning forest art. The device mainly consists of a cutting device, a branch clamping device, a test system, and a flat linear motor module and frame, as shown in Figure 1. The bench device has a simple structure and supports convenient parameter adjustment. It can realize the cutting performance test of different cutting speeds, tool edge angles, tool back angles, and other factors. The main working process is described as follows: Firstly, the test factors are adjusted according to the bench test scheme, and then the power switch is turned on to guarantee that the computer, the DHDAS dynamic signal test and analysis system, the flat linear motor module, the driver, the DC power supply, and the high-speed camera remain energized. Next, the corresponding software is run on the computer to set the moving position, speed, and acceleration of the cutting device. Finally, the poplar branches are cut quickly under the linear motion of the cutting device. In the cutting process, the force sensor automatically collects the cutting force through the dynamic signal test and analysis system and transmits the relevant data to the computer; meanwhile, the high-speed camera records the whole process of cutting poplar branches.
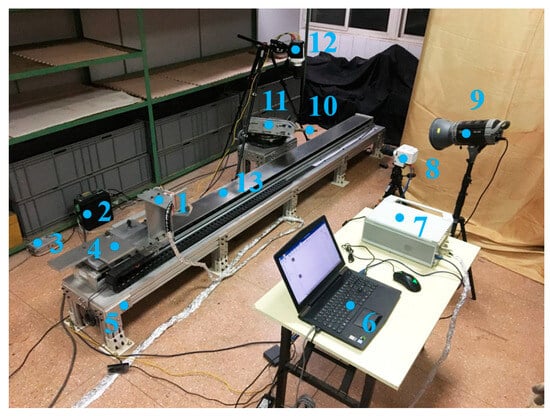
Figure 1.
The linear cutting test bench device: (1) cutting device; (2) driver; (3) DC power supply; (4) weighting device; (5) stand; (6) computer; (7) DHDAS dynamic signal test and analysis system; (8) high-speed camera 1; (9) lighting lamp; (10) poplar branch; (11) branch clamping device; (12) high-speed camera 2; (13) flat linear motor module.
2.1. Cutting Device
The cutting device mainly includes a cutting tool, two force sensors, a fixed frame, a counterweight device, a connecting plate, a flat linear motor module, a fixed plate, a fixed frame, etc., as illustrated in Figure 2. Among them, the cutting tool is arc-shaped, and it is a bionic design based on the arc shape of poplar trunk. In this paper, the research object is the Nanlin-3412 variety, and the tree age is 6 years. After measurement, most trunk diameters are about 150 mm, so the diameter of the arc-shaped tool is designed to be 150 mm. The frame is fixed on the foundation by 10 base seats, the fixed plate is fixed with the frame, the flat linear motor module is fixed by bolts, the fixed frame and the counterweight device are fixed on the flat linear motor module, the two force sensors are fixed with the fixed frame, and the cutting tool is fixed on the force sensor. The cutting speed, tool edge angle, tool back angle, and other parameters of the cutting device can be adjusted. Specifically, the cutting speed can be adjusted by software running on the computer, and the adjustment range is 0~5 m/s. The tool edge angle can be adjusted by replacing different tools, and the adjustment range is 15~35°. The tool back angle can be adjusted by adjusting the position of the fixture, and the adjustment range is 0~10°.
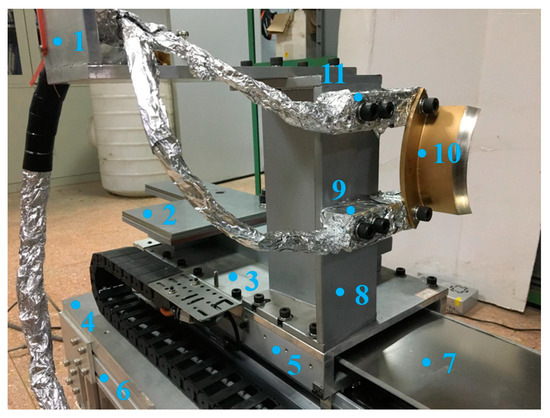
Figure 2.
The branch cutting device: (1) adapter plate; (2) counterweight block; (3) connecting plate; (4) fixed plate; (5) sliding table; (6) rack; (7) flat linear motor module; (8) fixed frame; (9) force sensor 1; (10) cutting tool; (11) force sensor 2.
2.2. Branch Clamping Device
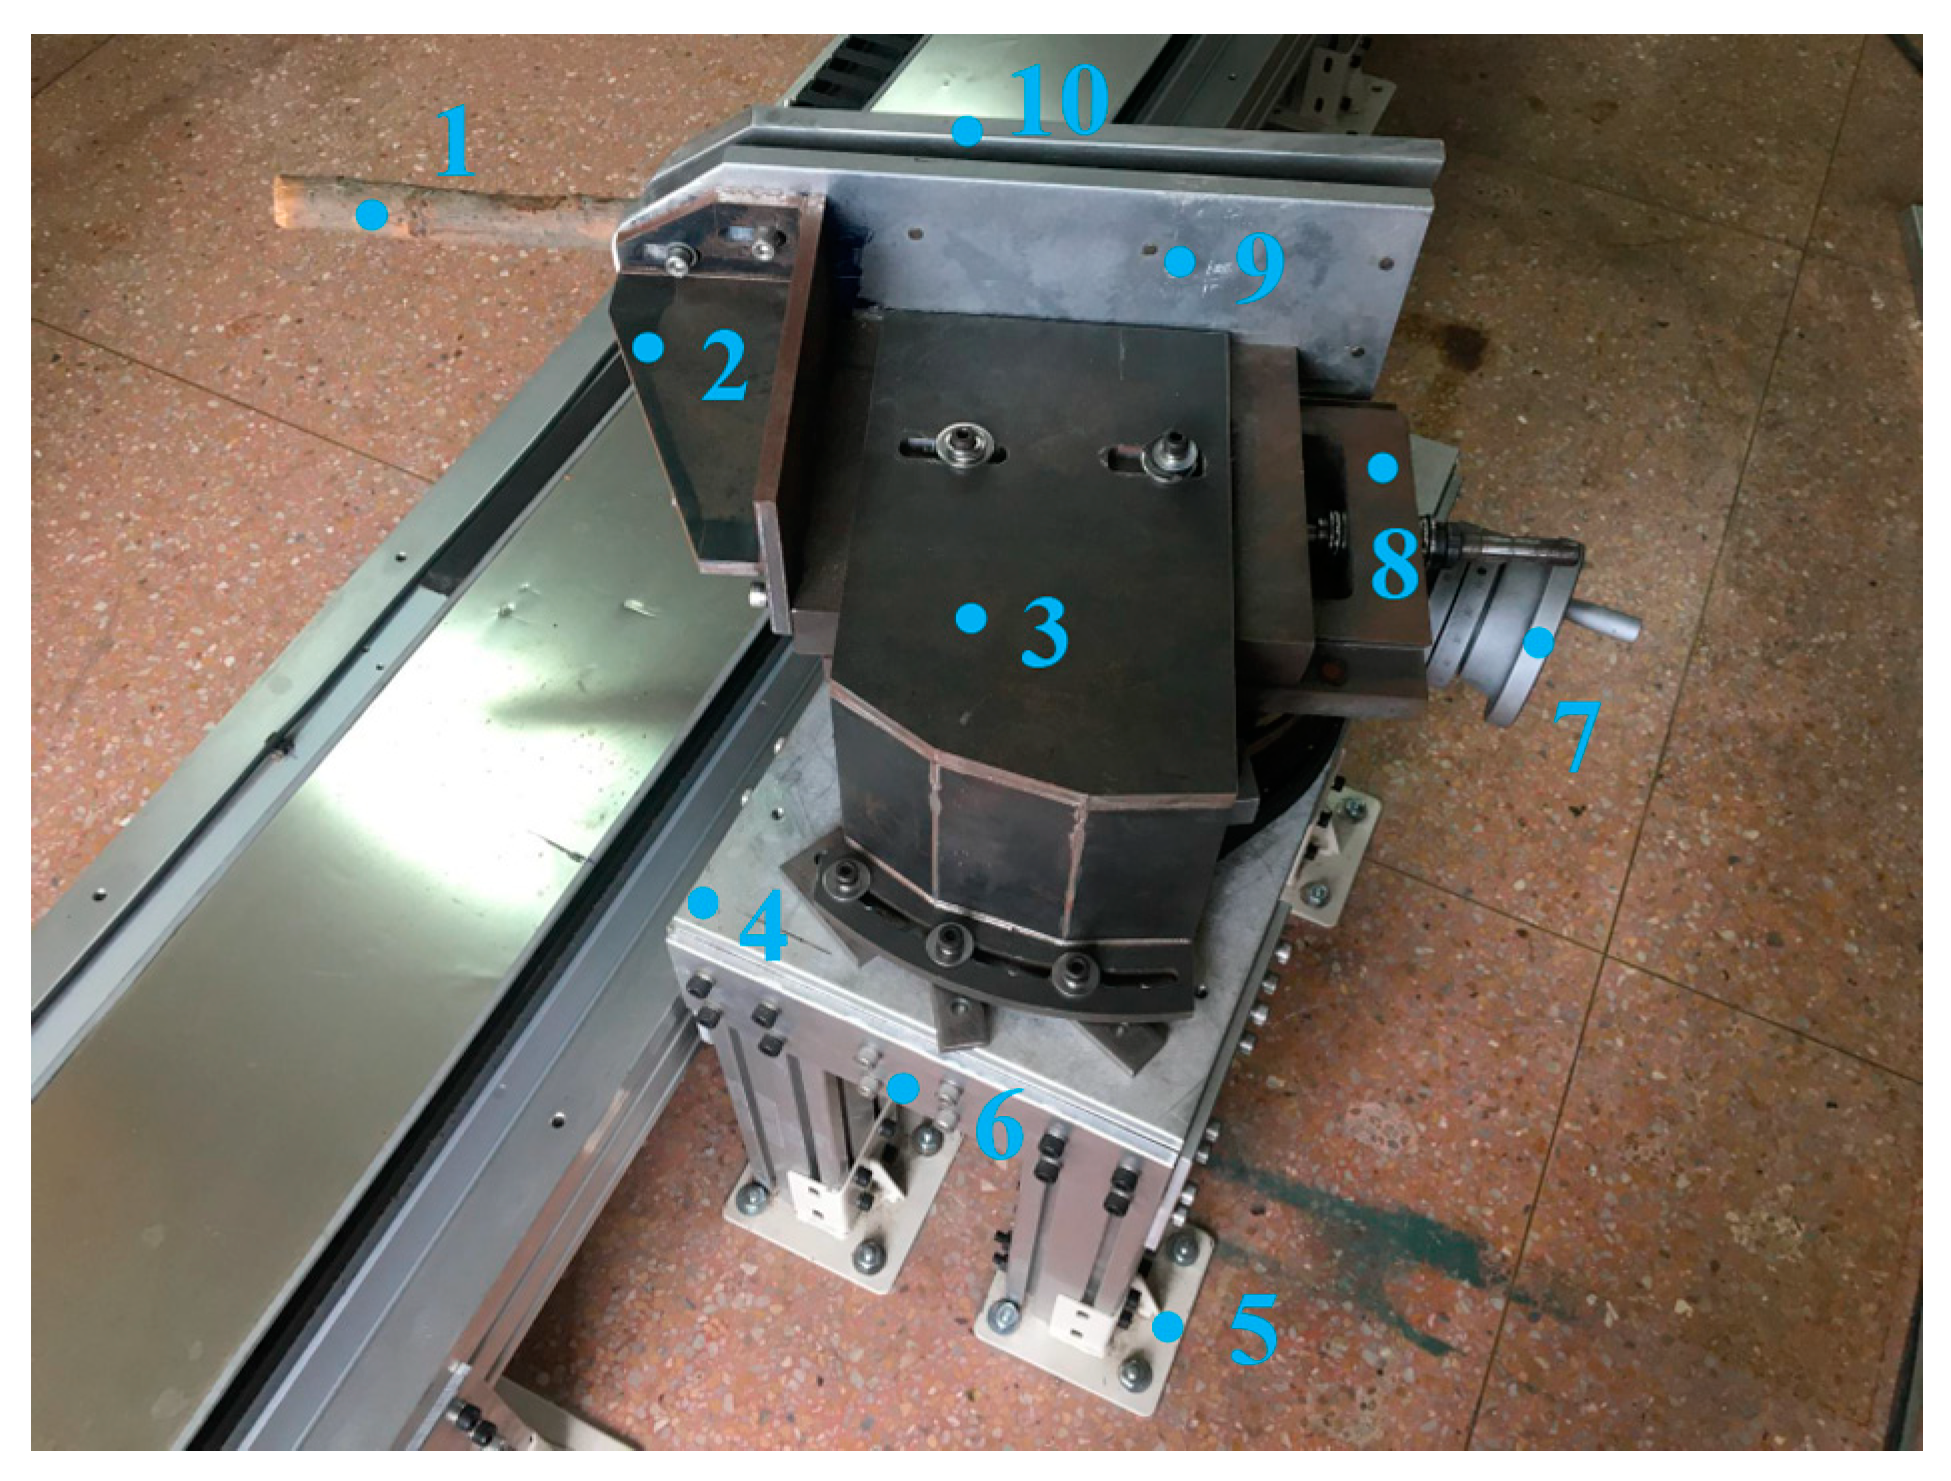
The branch clamping device mainly includes an inner fixture, an outer fixture, a dovetail slide, a dividing plate, a fixture fixing frame, a fixture support frame, a connecting plate, and a frame, as shown in Figure 3. The frame is fixed to the foundation through four-foot seats, the connecting plate is fixedly connected to the frame, the dividing plate is fixed on the connecting plate, and the dividing plate is fixedly connected to the dovetail sliding table through four T-bolts. The branch inclination angle can be adjusted by rotating the dividing plate, with an adjustment range of 0~180°. The front and rear positions of the internal and external fixtures can be adjusted by rotating the dovetail sliding table handle, and the adjustment range is 0~180 mm. The internal fixture, poplar branches, and external fixtures are clamped by six locking bolts to ensure that the branches remain fixed.

Figure 3.
The branch clamping device: (1) poplar branches; (2) fixture holder; (3) fixture support frame; (4) connecting plate; (5) foundation base; (6) frame; (7) division plate; (8) dovetail sliding table; (9) internal fixture; (10) external fixture.
2.3. Test System
The test system mainly includes force sensors, the DHDAS dynamic signal test and analysis system, a computer, a high-speed camera, a fill light, etc. The two force sensors are fixedly assembled on the fixed frame to measure the cutting force directly during the cutting motion. The peak cutting force of poplar branches can be obtained by adding the measurement results of the two sensors. The excitation voltage is 12 V, the output voltage is −5~5 V, the range is 0~1000 N, the comprehensive accuracy is 0.05%, and the acquisition frequency is 128 kHz. The basic principle of the data acquisition instrument is introduced as follows: the embedded CPU unit with an Ethernet interface is used to control the A/D channel for data acquisition, and the collected data are uploaded to the host computer through the Ethernet interface in the TCP/IP protocol. Meanwhile, the entire process of cutting poplar branches is recorded with the high-speed camera (a shooting rate of 1000 frames per second). After the cutting process is completed, PCC 3.8 software is used to collect images of the cutting cross-section, observe the cutting quality of poplar branches, and calculate the branch damage rate.
3. Materials and Methods
3.1. Test Materials
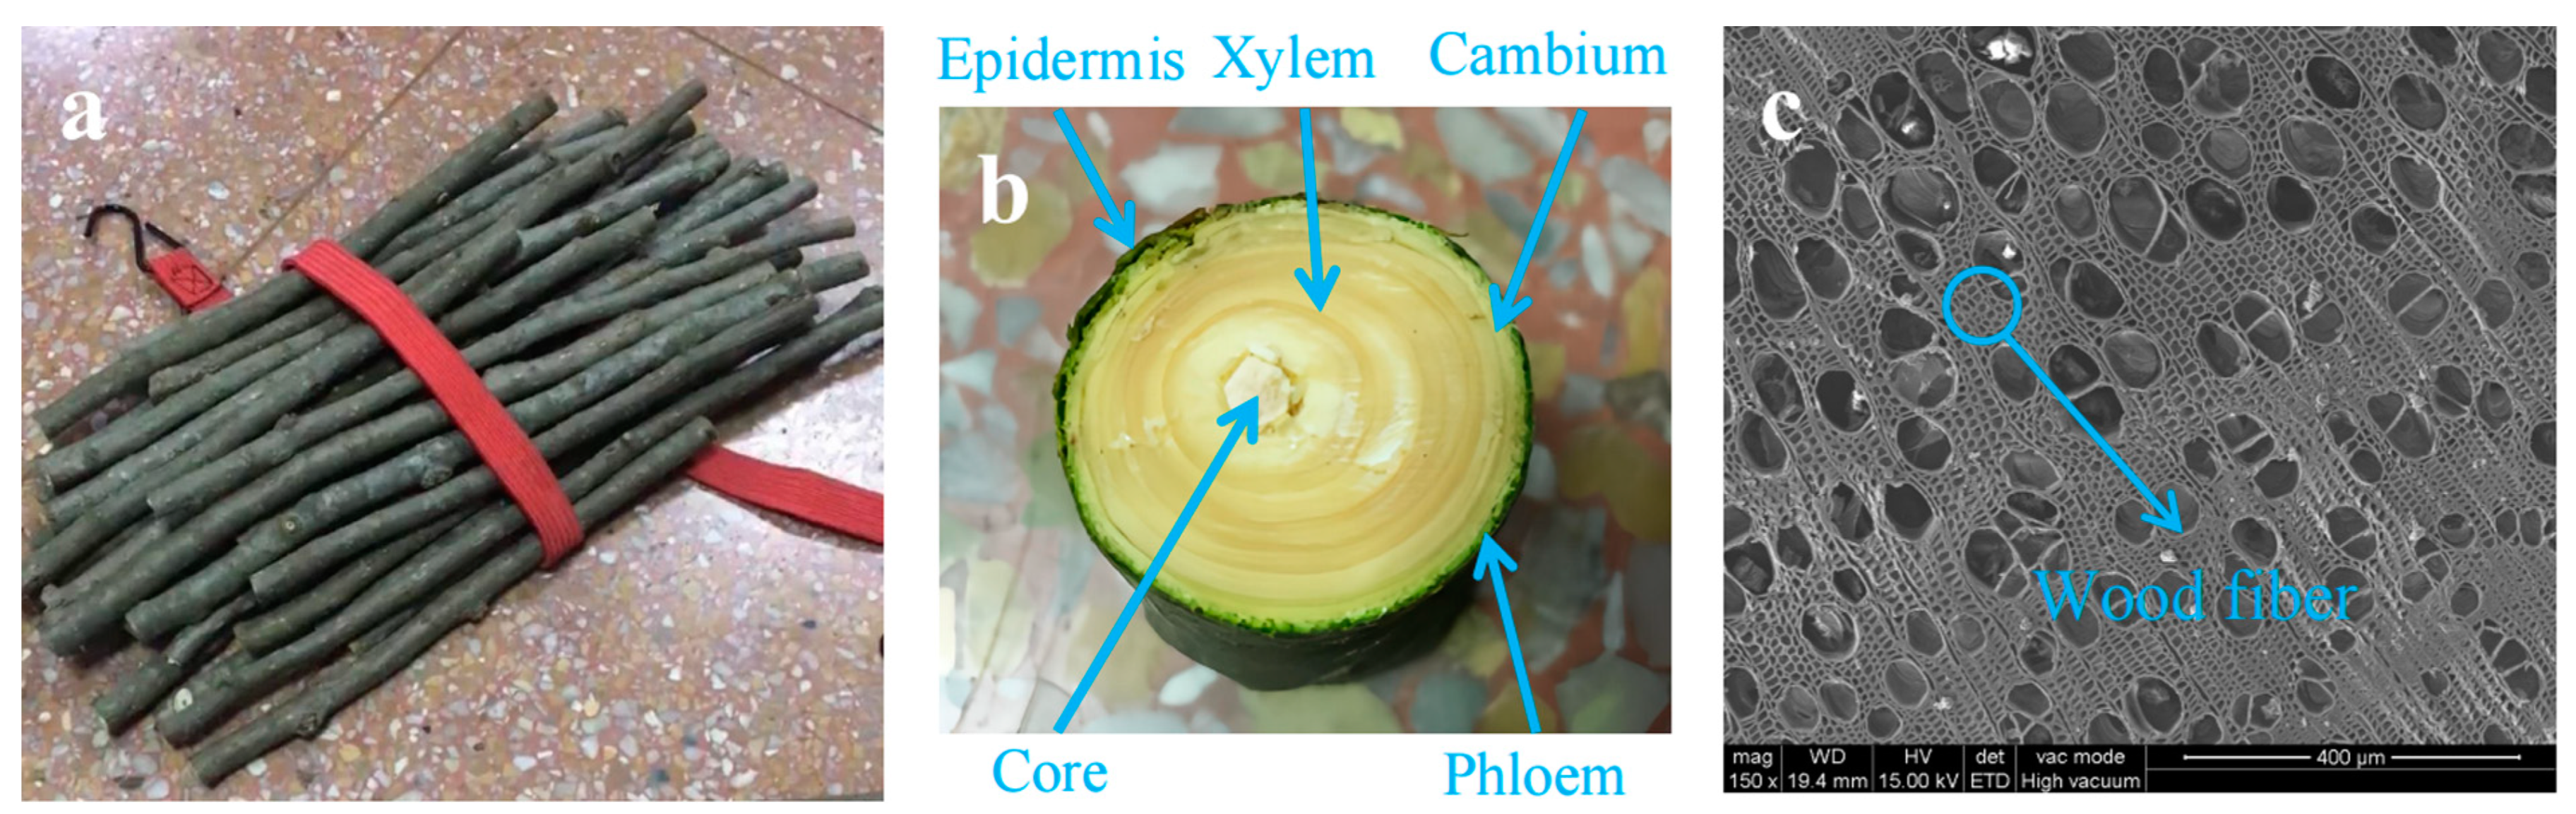
The poplar branches were collected from Malanghu Forest Farm in Bancheng, Sihong County, Jiangsu Province, China. This forest farm belongs to the temperate monsoon climate and has the largest and most complete poplar germplasm resource bank in Asia. Nanlin-3412 poplar is one of the most common and widely planted varieties. Because of its advantages of fast growth, high quality, and high yield, it is widely used in economic, ecological, and garden fields. This makes the research object representative and the experiment repeatable. Before the test, 6-year-old poplars were randomly selected for branch collection on April 2023. The selected poplar branches had no pests and obvious defects, and the branches were almost straight, as shown in Figure 4. The poplar branches are mainly composed of epidermis, phloem, cambium, xylem, and pith, among which the xylem accounts for the majority. Figure 4c shows the microscopic structure of the xylem, which mainly consists of wood fiber, vessel, wood parenchyma cells, and wood rays. After measurement, the branch diameter ranged from 10 mm to 32 mm, and the density was 646 kg/m3~840 kg/m3. The poplar branches were wrapped in fresh-keeping bags and refrigerated to prevent the change in water content, and the cutting performance test of poplar branches was completed within 48 h. After the cutting performance test, the poplar branches were immediately labeled and sealed with a sealed bag. The water content of the branches was measured to be 44.9%~52.3% following the drying method in the national standard GB/T 1927.4-2021 [20].
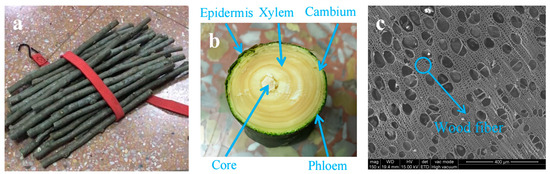
Figure 4.
The basic physical structure of poplar branches: (a) macro-morphology of branches; (b) cross-sectional shape of branches; (c) microstructure of xylem in cross-section of branches.
3.2. Cutting Mechanical Analysis of Poplar Branch
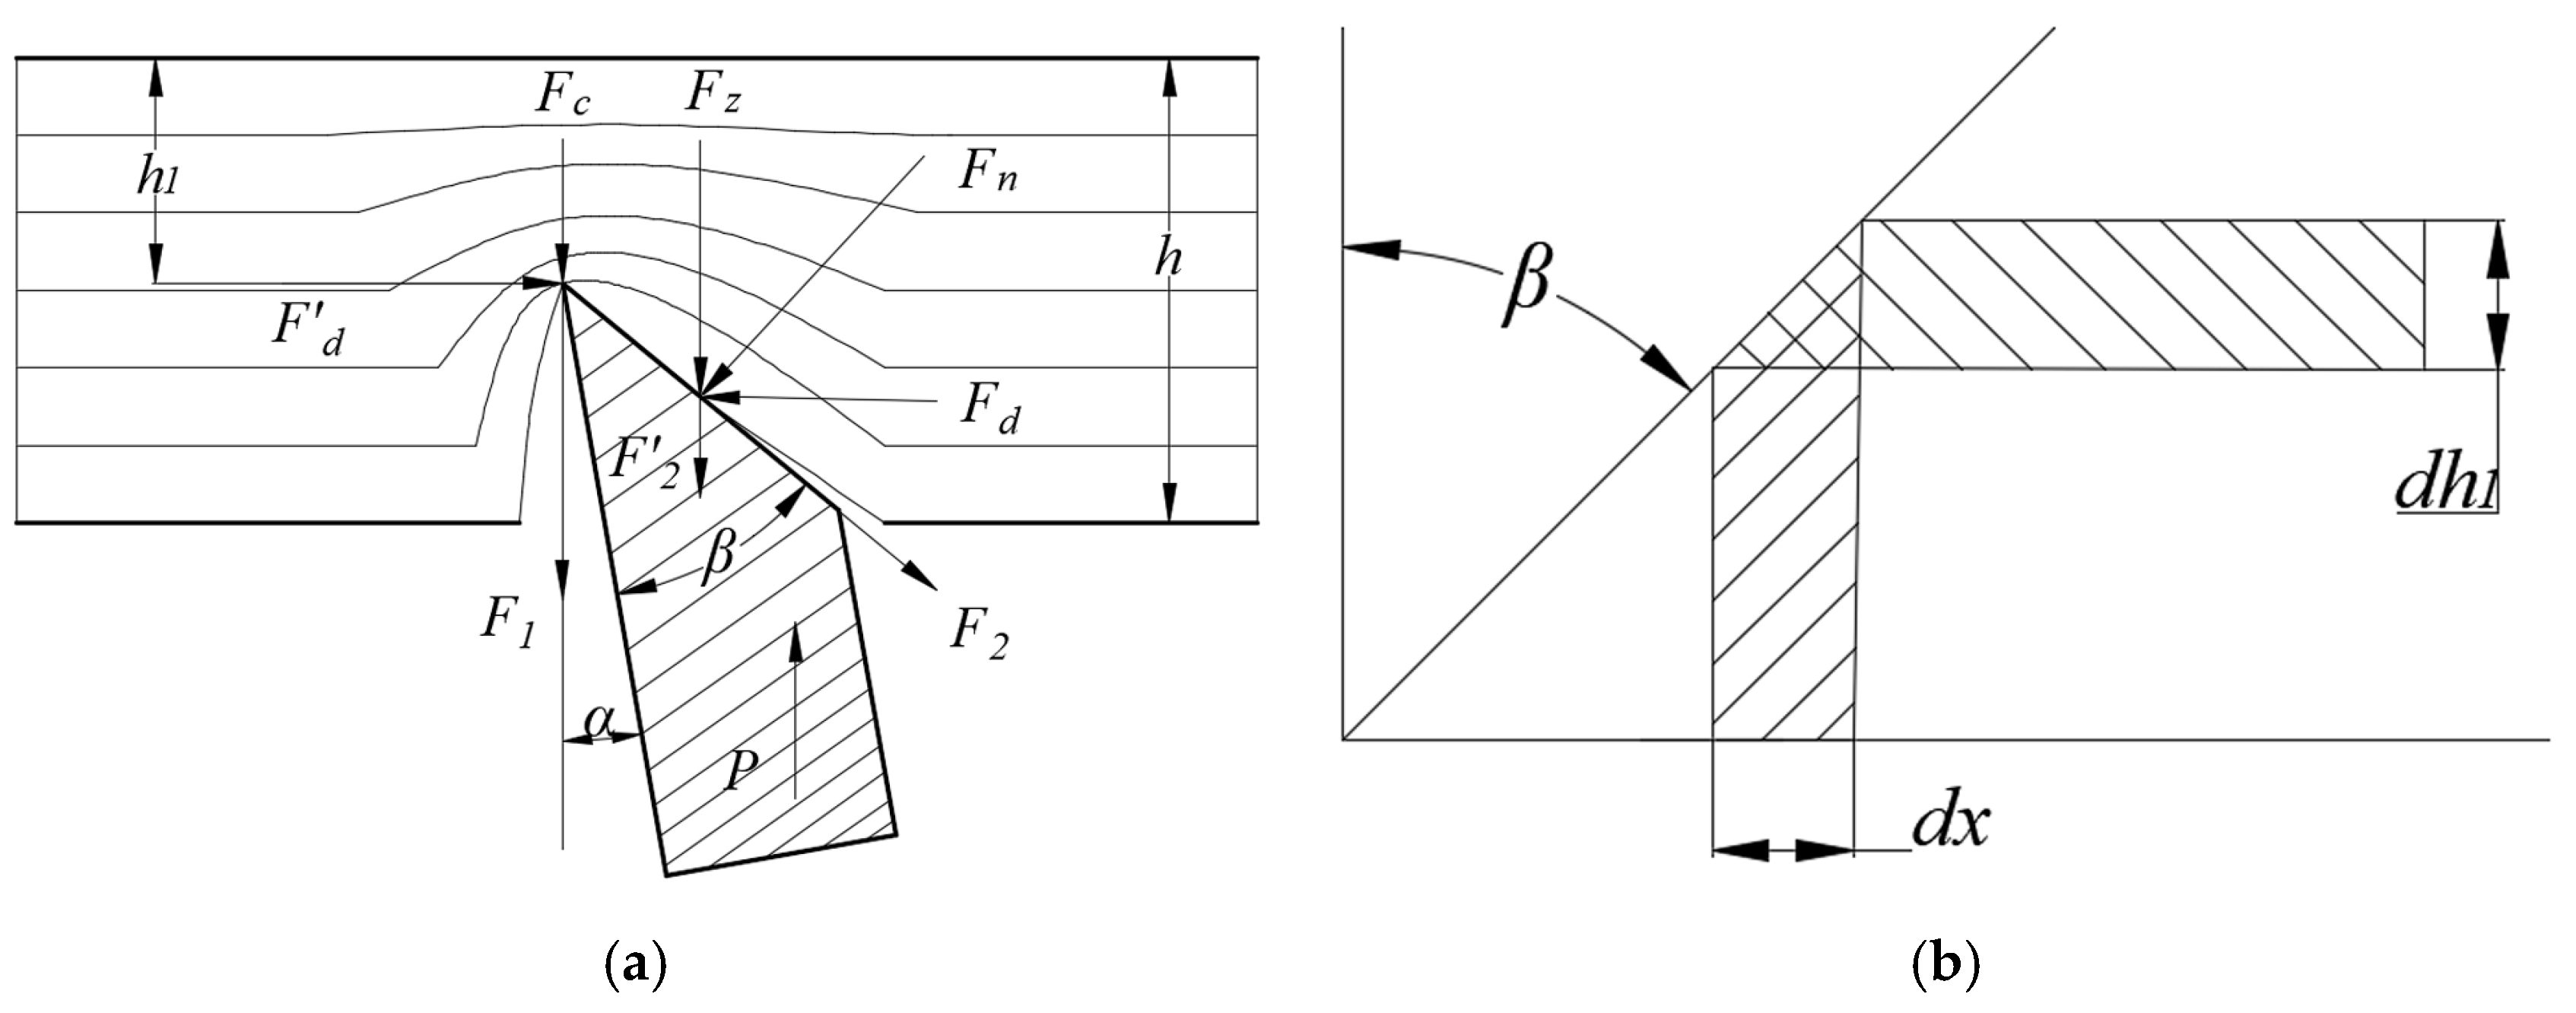
When analyzing the cutting resistance generated at the beginning moment of the tool cutting poplar branches and the relationship between it and the tool parameters, in order to reduce the friction between the rear blade surface of the tool and the poplar branches, a certain tool back angle was set, as shown in Figure 5, so that the reaction force acting on the pressure of the front blade surface was
—tool cutting angle, °; —tool back angle, °; —tool edge angle, °; —the reaction force of the extruded layer on the tool, N; —the reaction force of the pressure of the extruded layer on the front face of the tool, N.
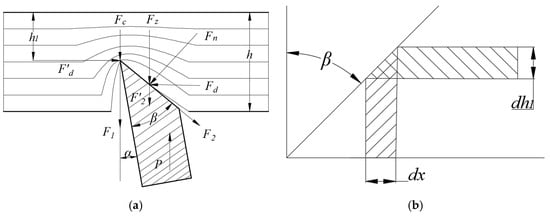
Figure 5.
Cutting mechanical analysis of poplar branch: (a) force schematic diagram of cutting tool; (b) pressure unit surface of the tool.
The friction force on the rake face of the tool is
where is the friction coefficient between the tool edge and the branch layer.
Its component force in the vertical direction is
The reaction force of poplar branches to the blade during cutting is
—blade thickness, mm; —blade length, mm; —the compressive yield strength of poplar branches, MPa.
In order to be able to cut off poplar branches successfully, the blade pressure must overcome the resistance of the tool, that is, the following conditions must be met:
—the friction of the branch layer on the knife edge opening, N.
When the cut material is subjected to extrusion deformation, the relevant literature shows that the stress–strain conforms to Hooke’s law and states that the pressurized area of the tool increases as the depth of cut increases [21], and this increased area can be expressed by the following equation:
Assuming that the cutting force is calculated according to tensile and compressive strengths, the unitary force acting on the width and length of plane can be expressed as
Introducing relative density .
—the thickness of the tool cut into the branch layer, mm; —the total thickness of branch layer, mm; —the extrusion stress of the knife blade on the poplar branch, MPa; —elastic modulus of poplar branch, MPa.
Substituting Formula (9) into Formula (8) to obtain
Denoting the relative displacement when cutting a poplar branch, the unit reaction force due to the lateral pressure of the tool is
The Poisson’s ratio of engineering mechanics is introduced
Substituting into Formula (12), we can obtain
Then, the combined force of the blade pressures is
—the internal friction coefficient of poplar branches.
The simplification yields
As shown in Equation (15), the cutting resistance on the knife edge depends mainly on the following aspects: the poplar branch’s own physical–mechanical properties (yield strength, elastic modulus, the internal friction coefficient, etc.), the structural properties of the tool (tool thickness, tool edge angle, tool back angle, etc.), and the interactions between the tool and poplar branch (tool tilt angle, the contact friction coefficient, etc.).
3.3. Test Factors
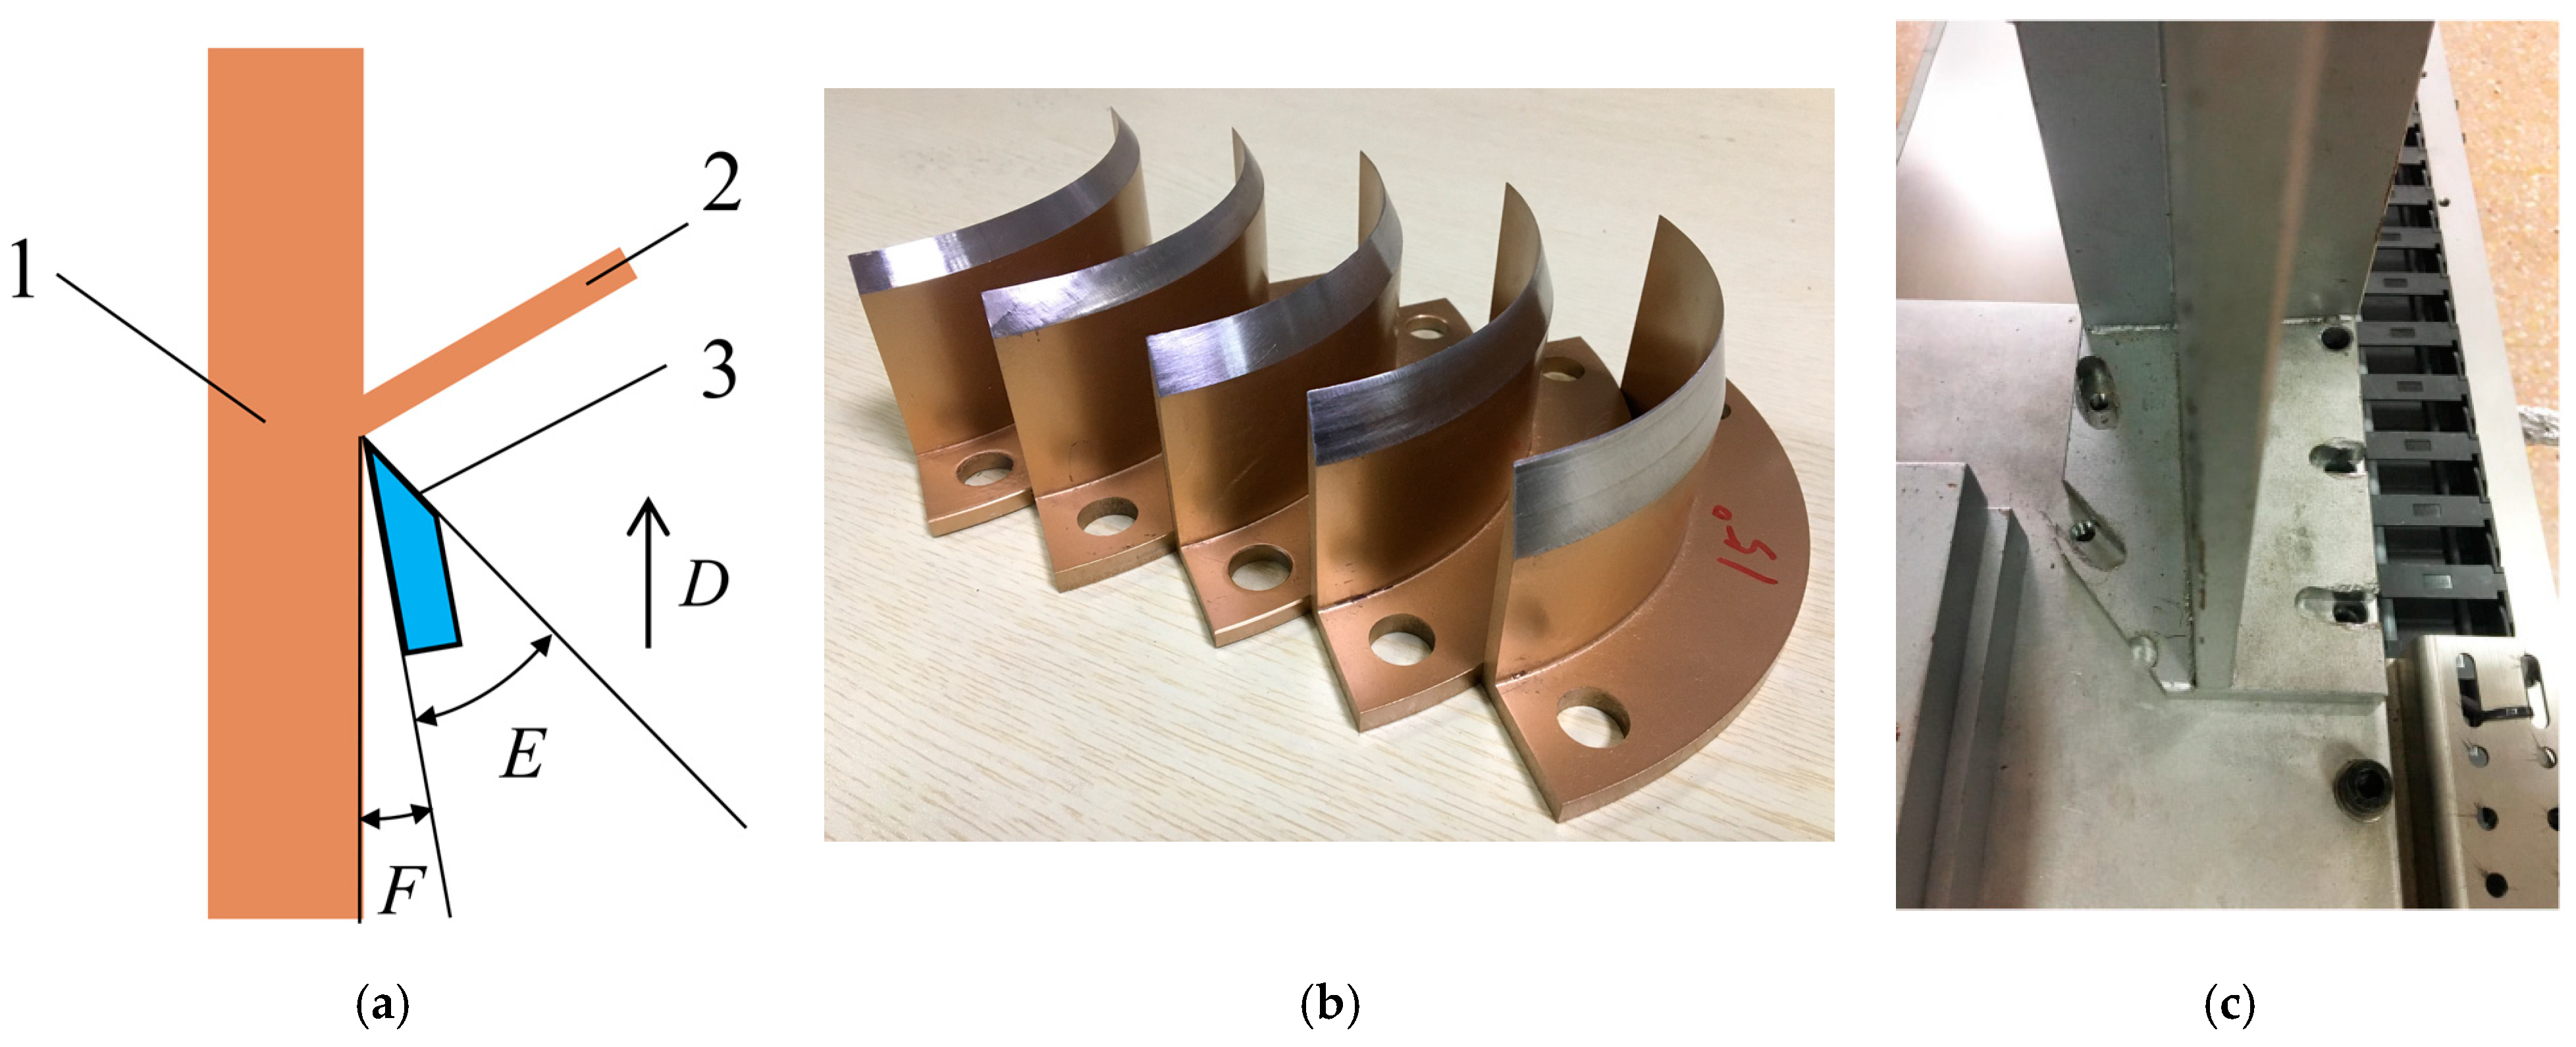
According to the above cutting mechanics analysis of poplar branch and the related literature [22,23,24], it is necessary to investigate the influence of the tool edge angle, tool cutting speed, and tool back angle on the cutting energy and cutting force of poplar branches [25]. The research results will provide important support for developing poplar branch pruners. Figure 6a shows the cutting diagram of poplar branches. Since poplar branches have a certain thickness, a specific speed is needed to cut them down. Therefore, the cutting speed of the tool was set as 1~5 m/s, and five levels were set at an interval of 1 m/s. When other single-factor cutting experiments were conducted, the cutting speed was uniformly set to 3 m/s, and the cutting speed was adjusted by computer operation. The tool edge angle is the angle between the flank face and the rake face, which reflects the sharpness of the tool and affects the cutting performance of poplar branches [26]. A too-large cutting-edge angle of the tool will result in increased cutting power consumption, and a too-small cutting-edge angle is prone to chipping. Referring to cutting tools and related cutting theories [27], different tool edge angles (15°~35°) were designed and processed, as shown in Figure 6b. The tool back angle is the angle between the flank face and the poplar trunk, which indicates the inclination of the flank face relative to the cutting plane, and it mainly affects the friction between poplar branches and the flank face. When the tool back angle is too small, due to the elastic recovery of the branch fiber, the friction between the cutting surface and the flank face is aggravated, leading to an increase in the cutting resistance. If the tool back angle is too large, it is easy to cause the branch collision phenomenon. Relevant research has shown that there is an appropriate wood cutting back angle, e.g., the appropriate tool clearance angle when cutting in a straight line is about 5°. Thus, the range of the tool back angle is initially determined to be 0°~6°, and the tool back angle adjustment device is shown in Figure 6c.

Figure 6.
Schematic diagram of the correlation of test factors: (a) the cutting schematic diagram of poplar branch: (1) poplar trunk, (2) poplar branch, and (3) cutting tool; (b) cutting tools with different cutting-edge angles; (c) the adjustment device of tool back angle.
3.4. Test Method
3.4.1. Single-Factor Test
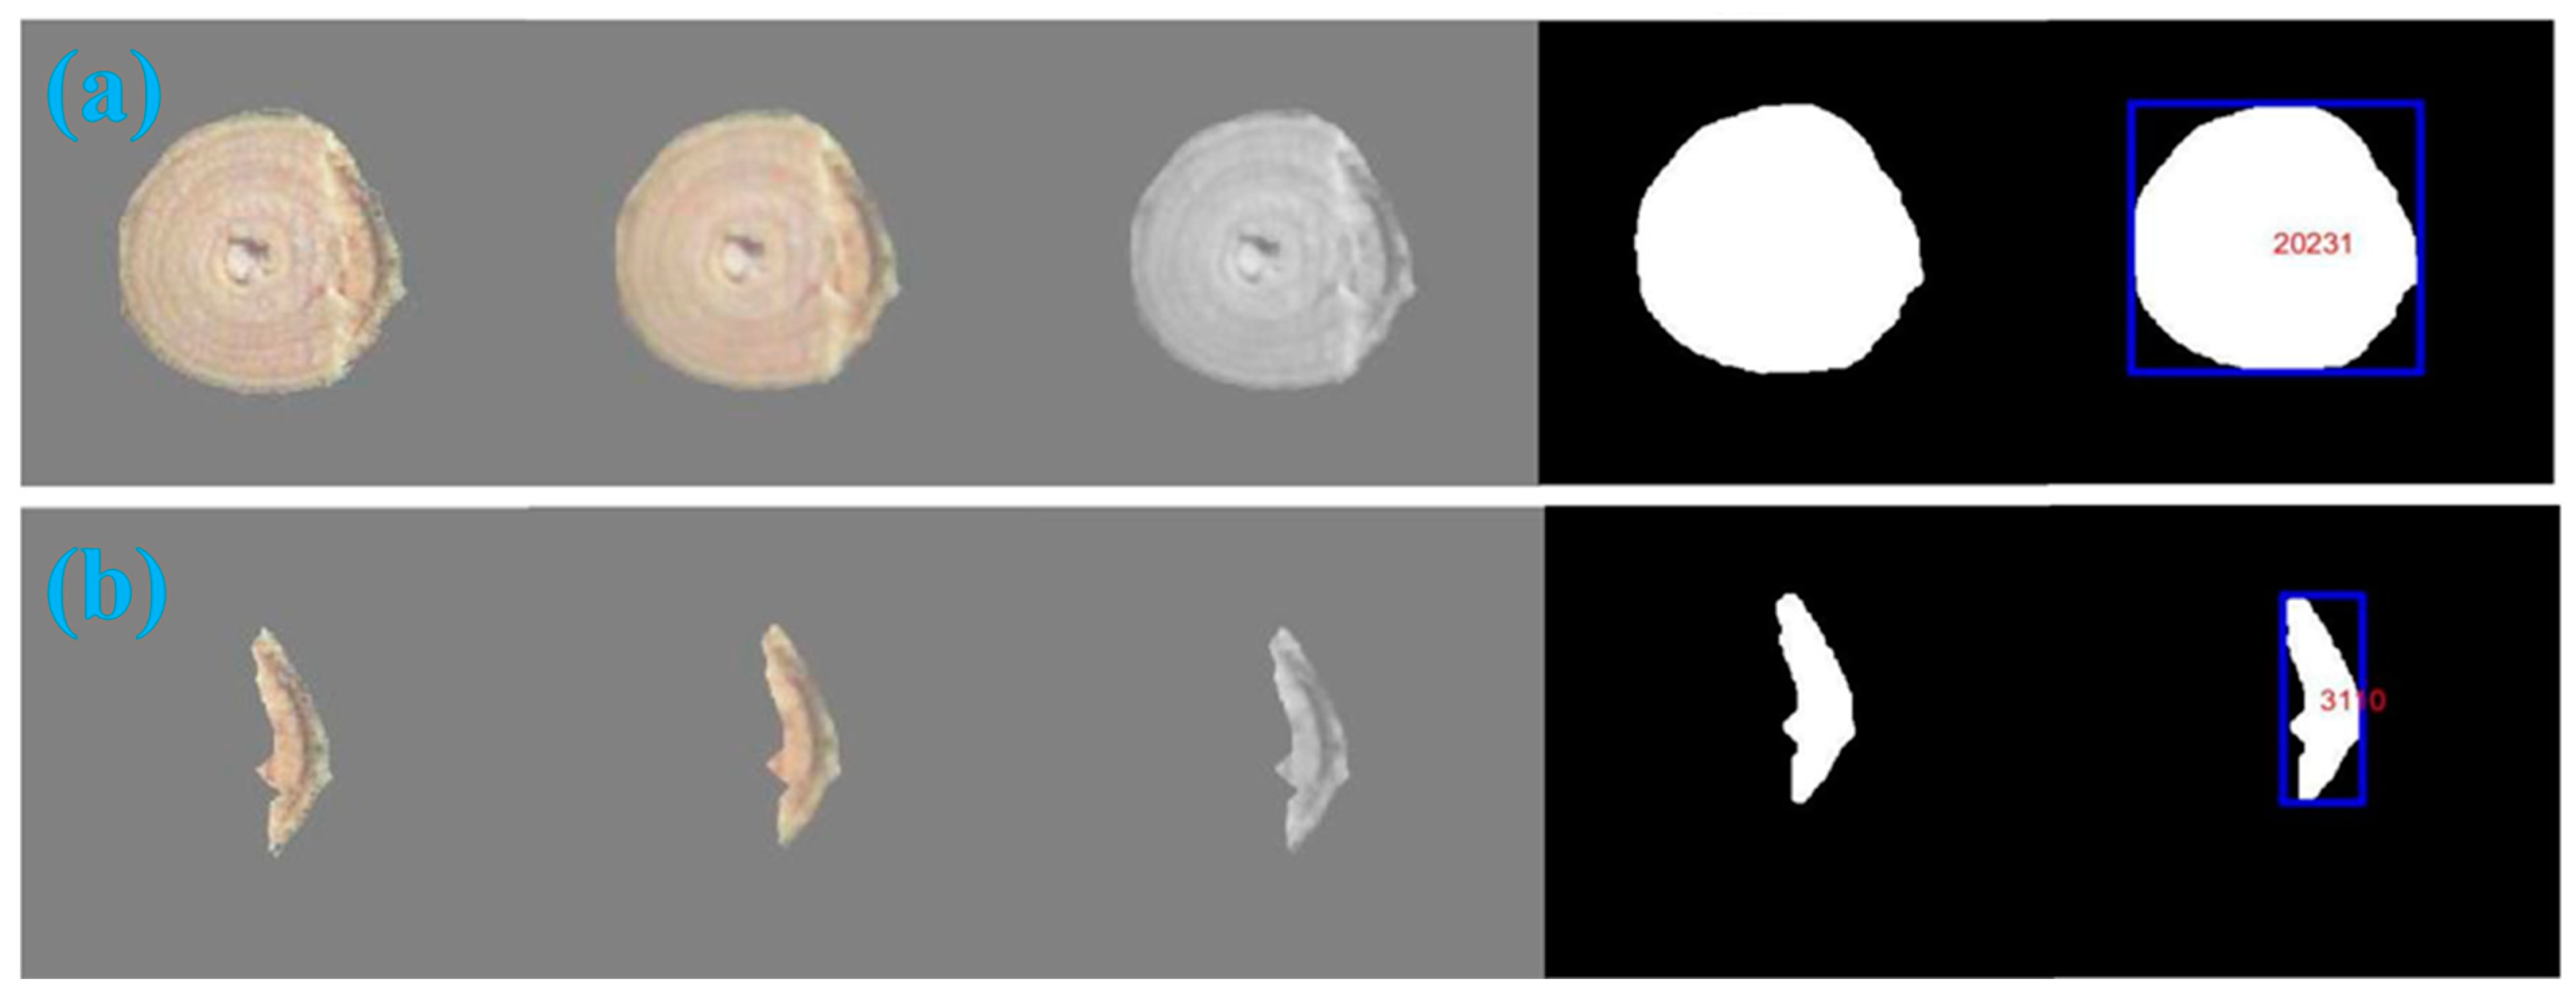
To determine the influence of different experimental factors on the cutting performance of poplar branches, this paper took the cutting speed D, tool edge angle E, and tool back angle F as experimental factors and takes ultimate shear stress Y1, unit area cutting power consumption Y2, and branch damage rate Y3 as evaluation indexes. The branch diameter was uniformly set to about 25 mm, and the branch inclination angle was 70°. The single-factor experimental study on cutting properties of poplar branches was conducted, and each group of tests was repeated three times. The corresponding values of Y1, Y2, and Y3 were calculated by the following formula. The test factors and levels are listed in Table 1. The damage rate of branches was calculated by computer image processing technology, and the image processing process is shown in Figure 7.
where denotes the cutting energy (unit: J), denotes the peak cutting force (unit: N), denotes the cutting displacement (unit: mm), denotes the ultimate shear stress (unit: N/mm2), denotes the cutting power consumption per unit area (unit: mJ/mm2), denotes the branch damage rate (unit: %), denotes the branch cross-sectional area (unit: mm2), denotes the branch damage part of the pixel, and denote the total pixel of the branch cross-section.

Table 1.
The factor-level table of the single-factor test.
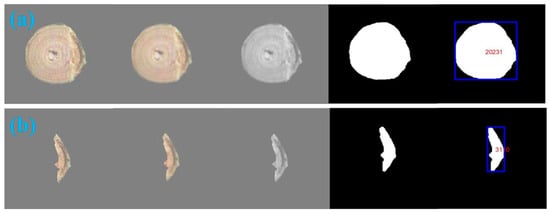
Figure 7.
The calculation process of the poplar branch damage rate: (a) calculation of the total pixel points of branch section; (b) calculation of the partial pixel points of branch damage.
3.4.2. Quadratic Regression Orthogonal Rotation Combination Design Test
To reduce cutting energy consumption and damage rate of poplar branches, based on the results of the single-factor cutting performance test, the response surface method (RSM) [28,29,30] was used to design the quadratic regression orthogonal rotation combination design test. The influence of cutting speed D, tool edge angle E, and tool back angle F on the cutting properties of poplar branches was further studied. The ultimate shear stress Y1, cutting power consumption per unit area Y2, and branch damage rate Y3 were taken as response indexes. The test parameters were divided into high, upper, middle, lower, and low levels, expressed in the forms of +2, 1, 0, −1, and −2, respectively. The factor-level coding table is shown in Table 2. Each group of tests was repeated three times, the branch diameter was uniformly set to about 25 mm, and the branch inclination angle was 70°. Based on the quadratic regression orthogonal rotation combination design test, a second-order regression mathematical model between Y1, Y2, Y3, and the significant parameters was established, which provided a theoretical basis for cutting parameter optimization of poplar branches and improving their cutting performance.
Table 2.
The factor-level coding table of the multi-factor test.
4. Results and Discussion
4.1. Cutting Force–Displacement Curve
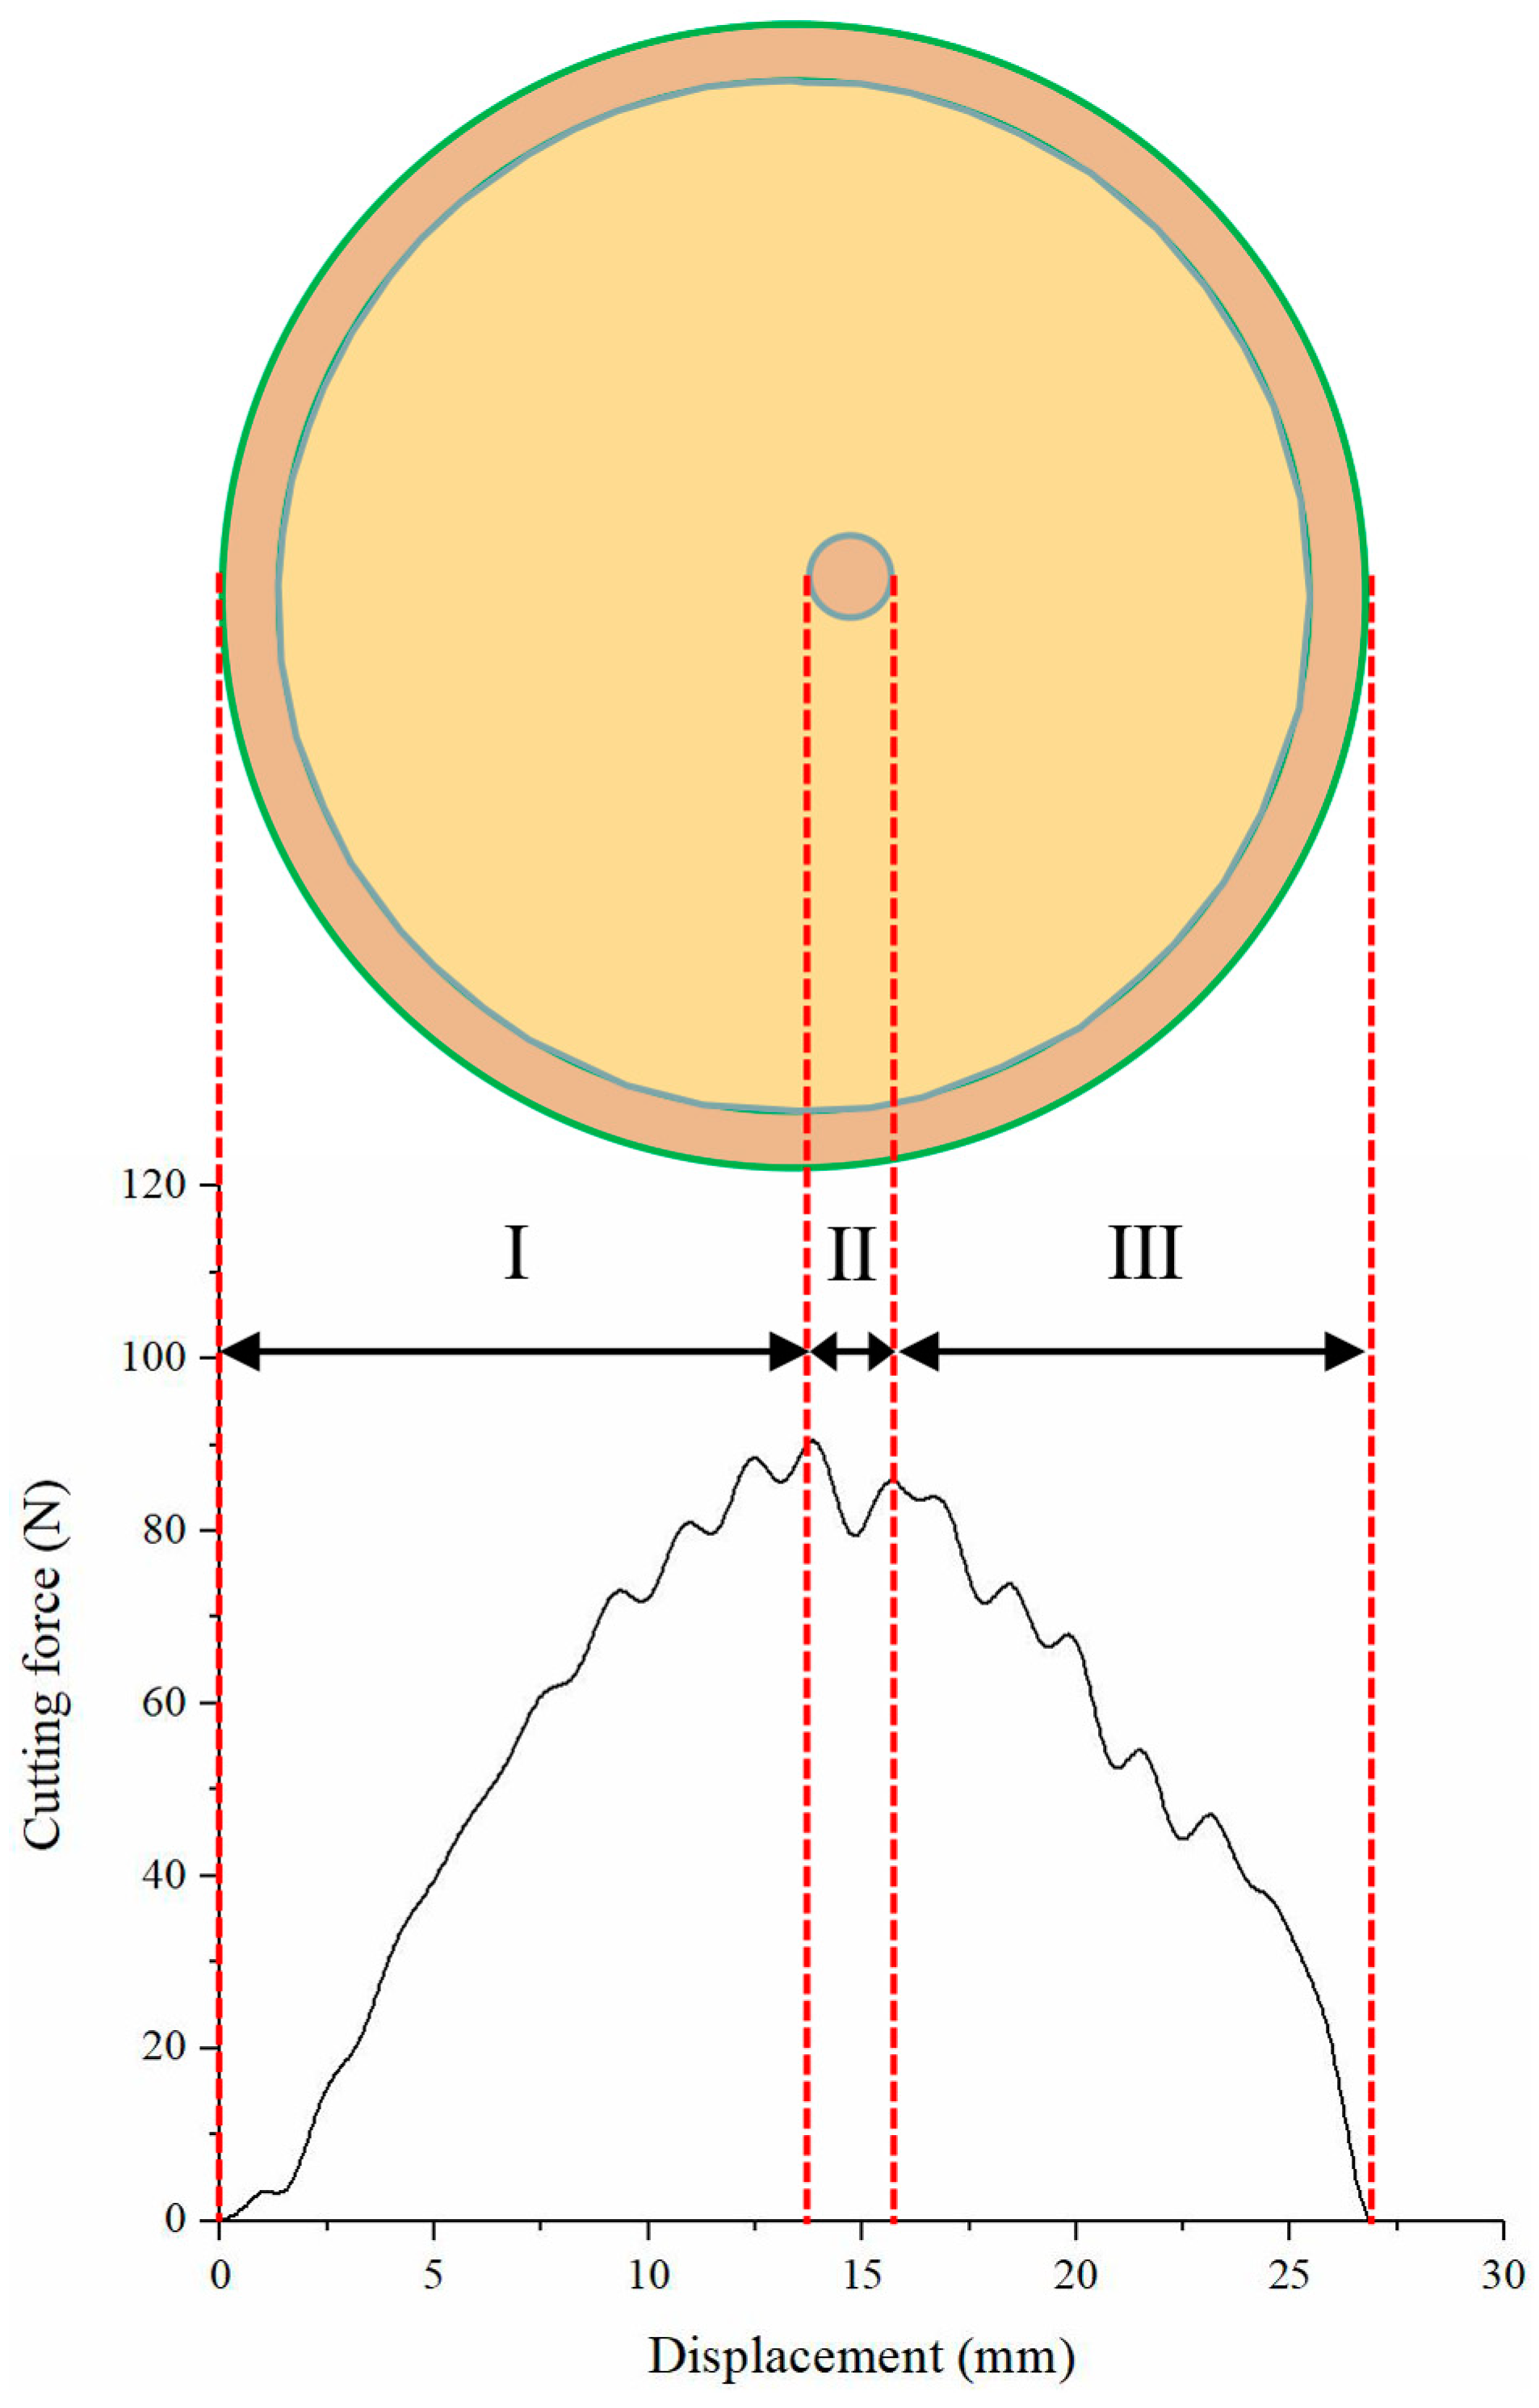
Figure 8 shows the cutting force–displacement characteristic curve for cutting poplar branches with a cross-sectional area of 491.5 mm2, a cutting speed of 1 m/s, a tool edge angle of 15°, and a tool back angle of 0°, which illustrates the whole process of cutting poplar branches. According to the changing trend of cutting force, the whole cutting process can be divided into three stages: the growth stage, the intermediate stage, and the decline stage. In the growth stage, the tool cuts the epidermis, phloem, cambium, and xylem of poplar branches. When the tool contacts with poplar branches, it starts to generate cutting force, and as the cutting depth increases, the contact area, pressure, and friction between the poplar branch and the tool increase; in this stage, the cutting force maintains an increasing trend, and it reaches the peak value. In the middle stage, the tool cuts the epidermis, phloem, cambium, xylem, and pith of poplar branches. With the increase in the cutting depth, the sum of reaction force and friction resistance on poplar branches decreases first and then increases. This is because the tool cuts the pith of poplar branches in this stage. The pith is similar to the spongy body, and its mechanical strength is small, which makes the cutting force fluctuate slightly. In the descending stage, the cutting tool cuts the epidermis, phloem, cambium, and xylem of poplar branches. As the cutting depth increases, the contact area between the poplar branch and the tool decreases, and the pressure and friction on the poplar branch decrease until it decreases to 0, thereby completing the cutting operation of the poplar branch. The fluctuation of cutting force in the cutting process may be related to the physical and mechanical properties of the internal structure of poplar branches.
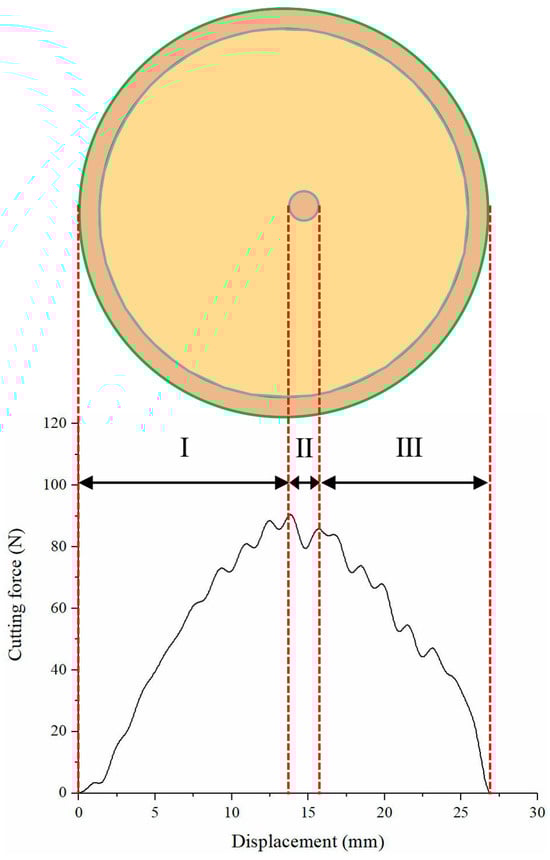
Figure 8.
The cutting force–displacement characteristic curve: (I) growth phase (II) intermediate phase, (III) decline phase.
4.2. Single-Factor Test Results and Analysis
4.2.1. Cutting Speed
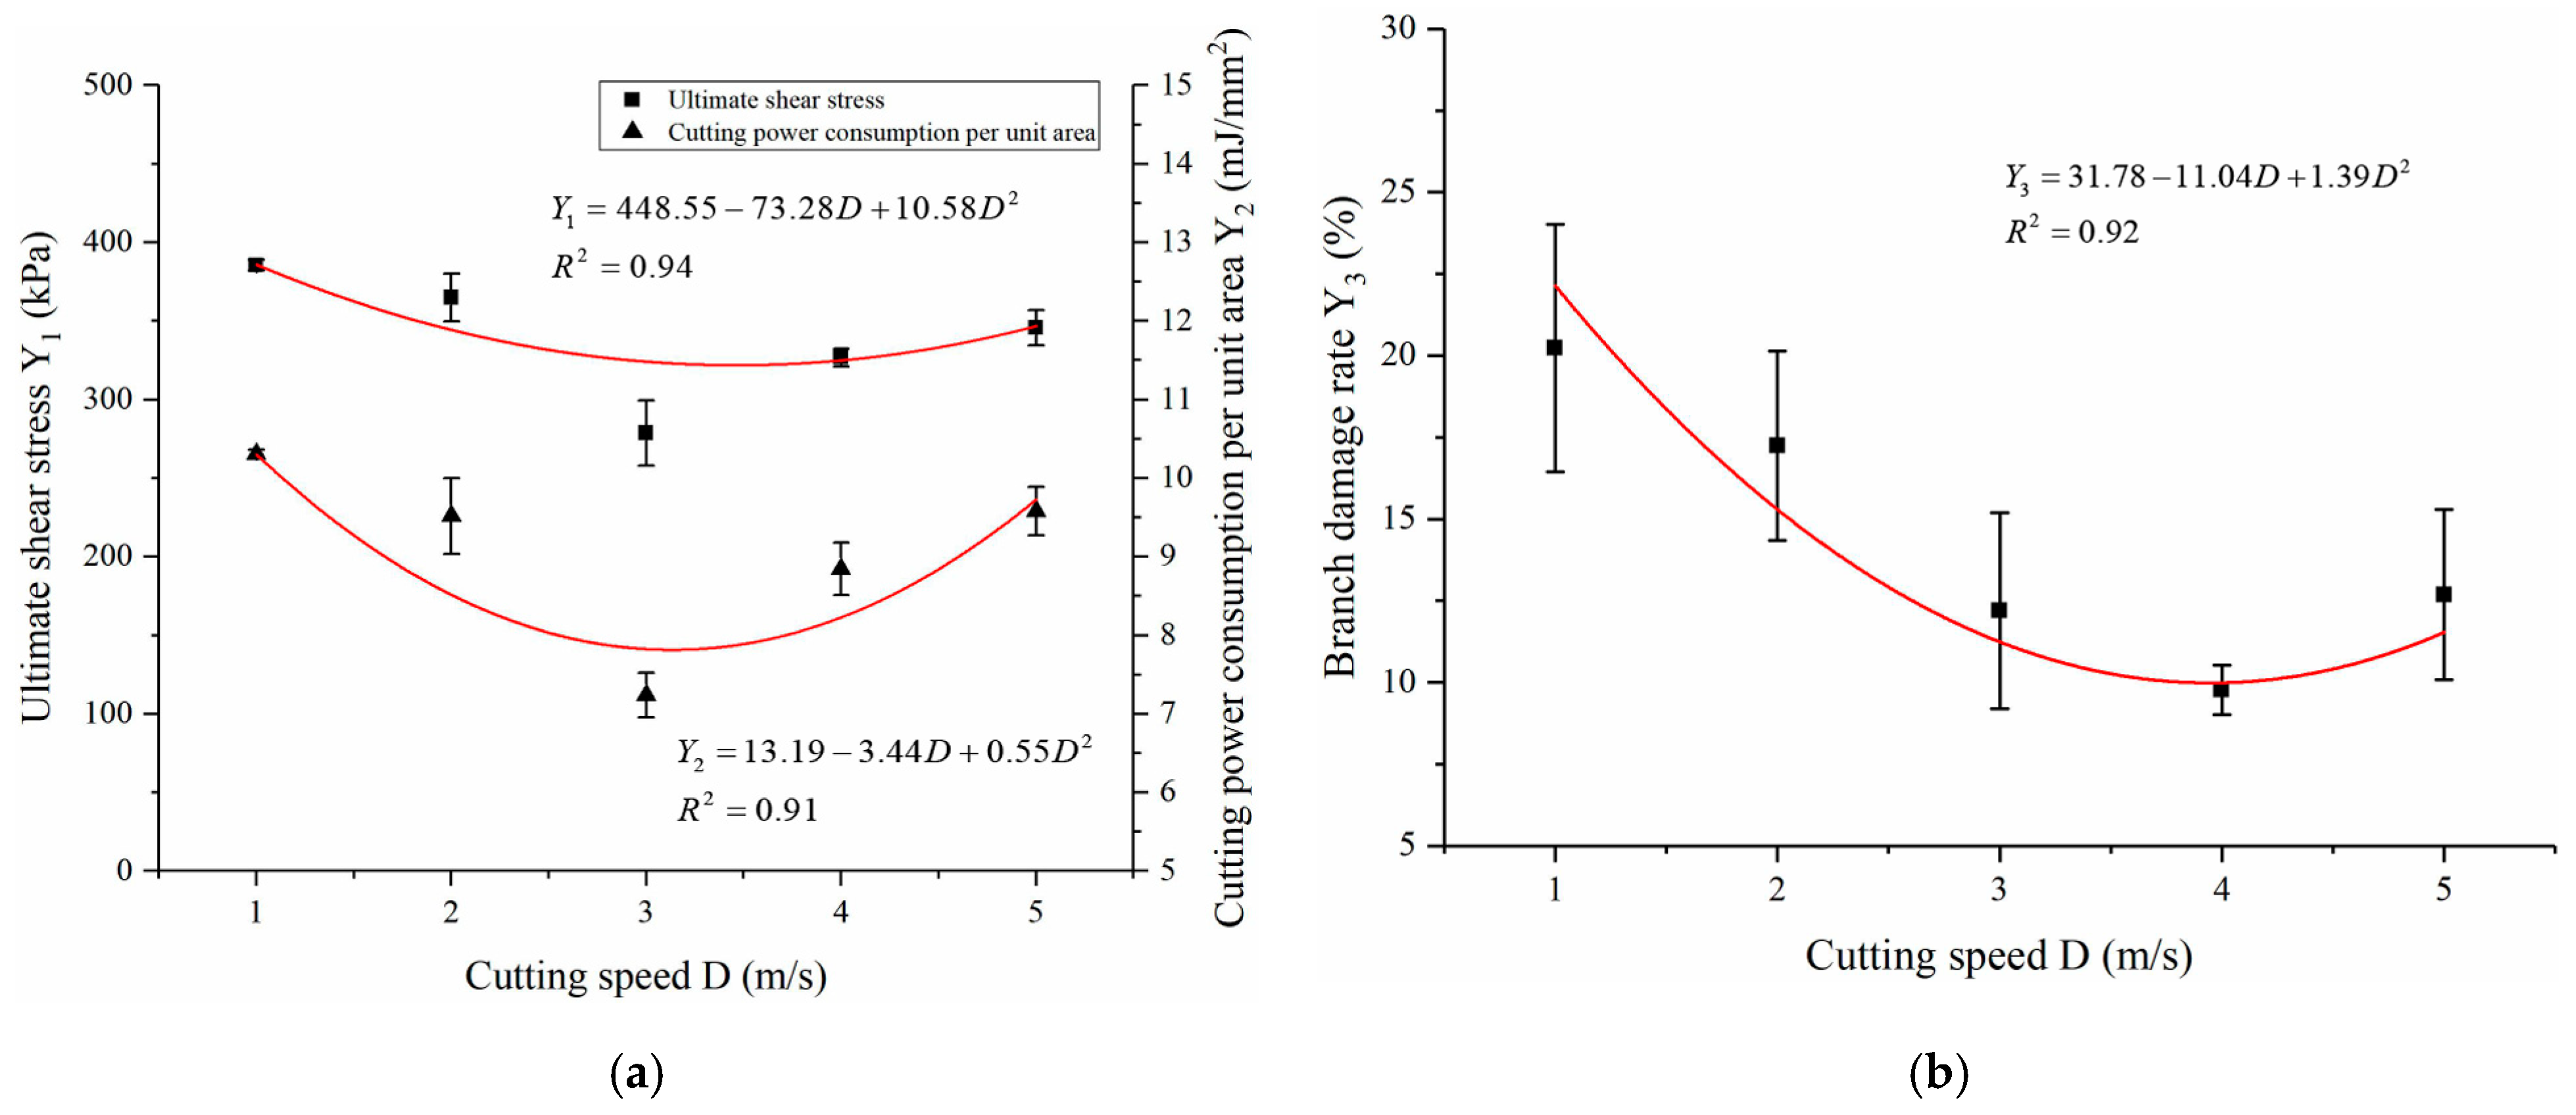
The influence of different cutting speeds on the cutting performance of poplar branches was analyzed by setting the cutter edge angle to 15° and the cutter back angle to 0°, in which the diameter of the branches ranged from 24.63 to 26.11 mm, and the moisture content of the branches ranged from 44.9% to 49.83%. The test results are presented in Figure 9. It can be seen that the ultimate shear stress, cutting power consumption per unit area, and branch damage rate decrease first and then increase with the increase in the cutting speed. When the cutting speed is too low, the impact force generated by the cutting tool is insufficient, which can easily lead to the splitting of branches, so the ultimate shear stress, cutting power consumption per unit area, and branch damage rate are large. When the cutting speed is too high, the impact force generated by the cutting tool is too large, so the ultimate shear stress and cutting power consumption per unit area are too large. Therefore, an appropriate cutting speed should be set to cut the branches better and guarantee that the limit shear stress, cutting power consumption per unit area, and branch damage rate are small. According to Figure 9, when the cutting speed was 3 m/s, the ultimate shear stress and cutting power consumption per unit area were relatively small, and when the cutting speed was 4 m/s, the branch damage rate was relatively small.
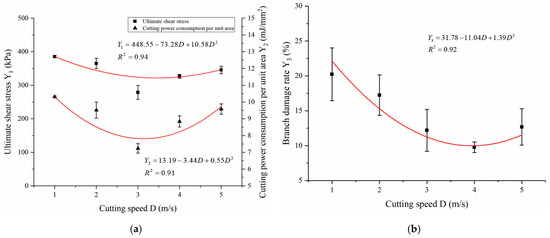
Figure 9.
Test results of cutting speed: (a) the effect of cutting speed on the cutting properties of poplar branches; (b) the effect of cutting speed on the damage rate of poplar branches.
Then, the polynomial function model was adopted to fit the cutting speed with the ultimate shear stress, cutting power consumption per unit area, and branch damage rate, and the corresponding regression curve was obtained. The variance analysis and significance check of the regression mathematical model demonstrated that the cutting speed had a significant influence on the ultimate shear stress, cutting power consumption per unit area and branch damage rate (p < 0.01), and the coefficients of determination of its regression mathematical model R2 were 0.94, 0.91 and 0.92, respectively, with a high degree of goodness of fit, which indicated that the curves were well fitted, and the ultimate shear stress, cutting power consumption per unit area, and branch damage rate of poplar branches could be predicted by the cutting speed.
4.2.2. Tool Edge Angle
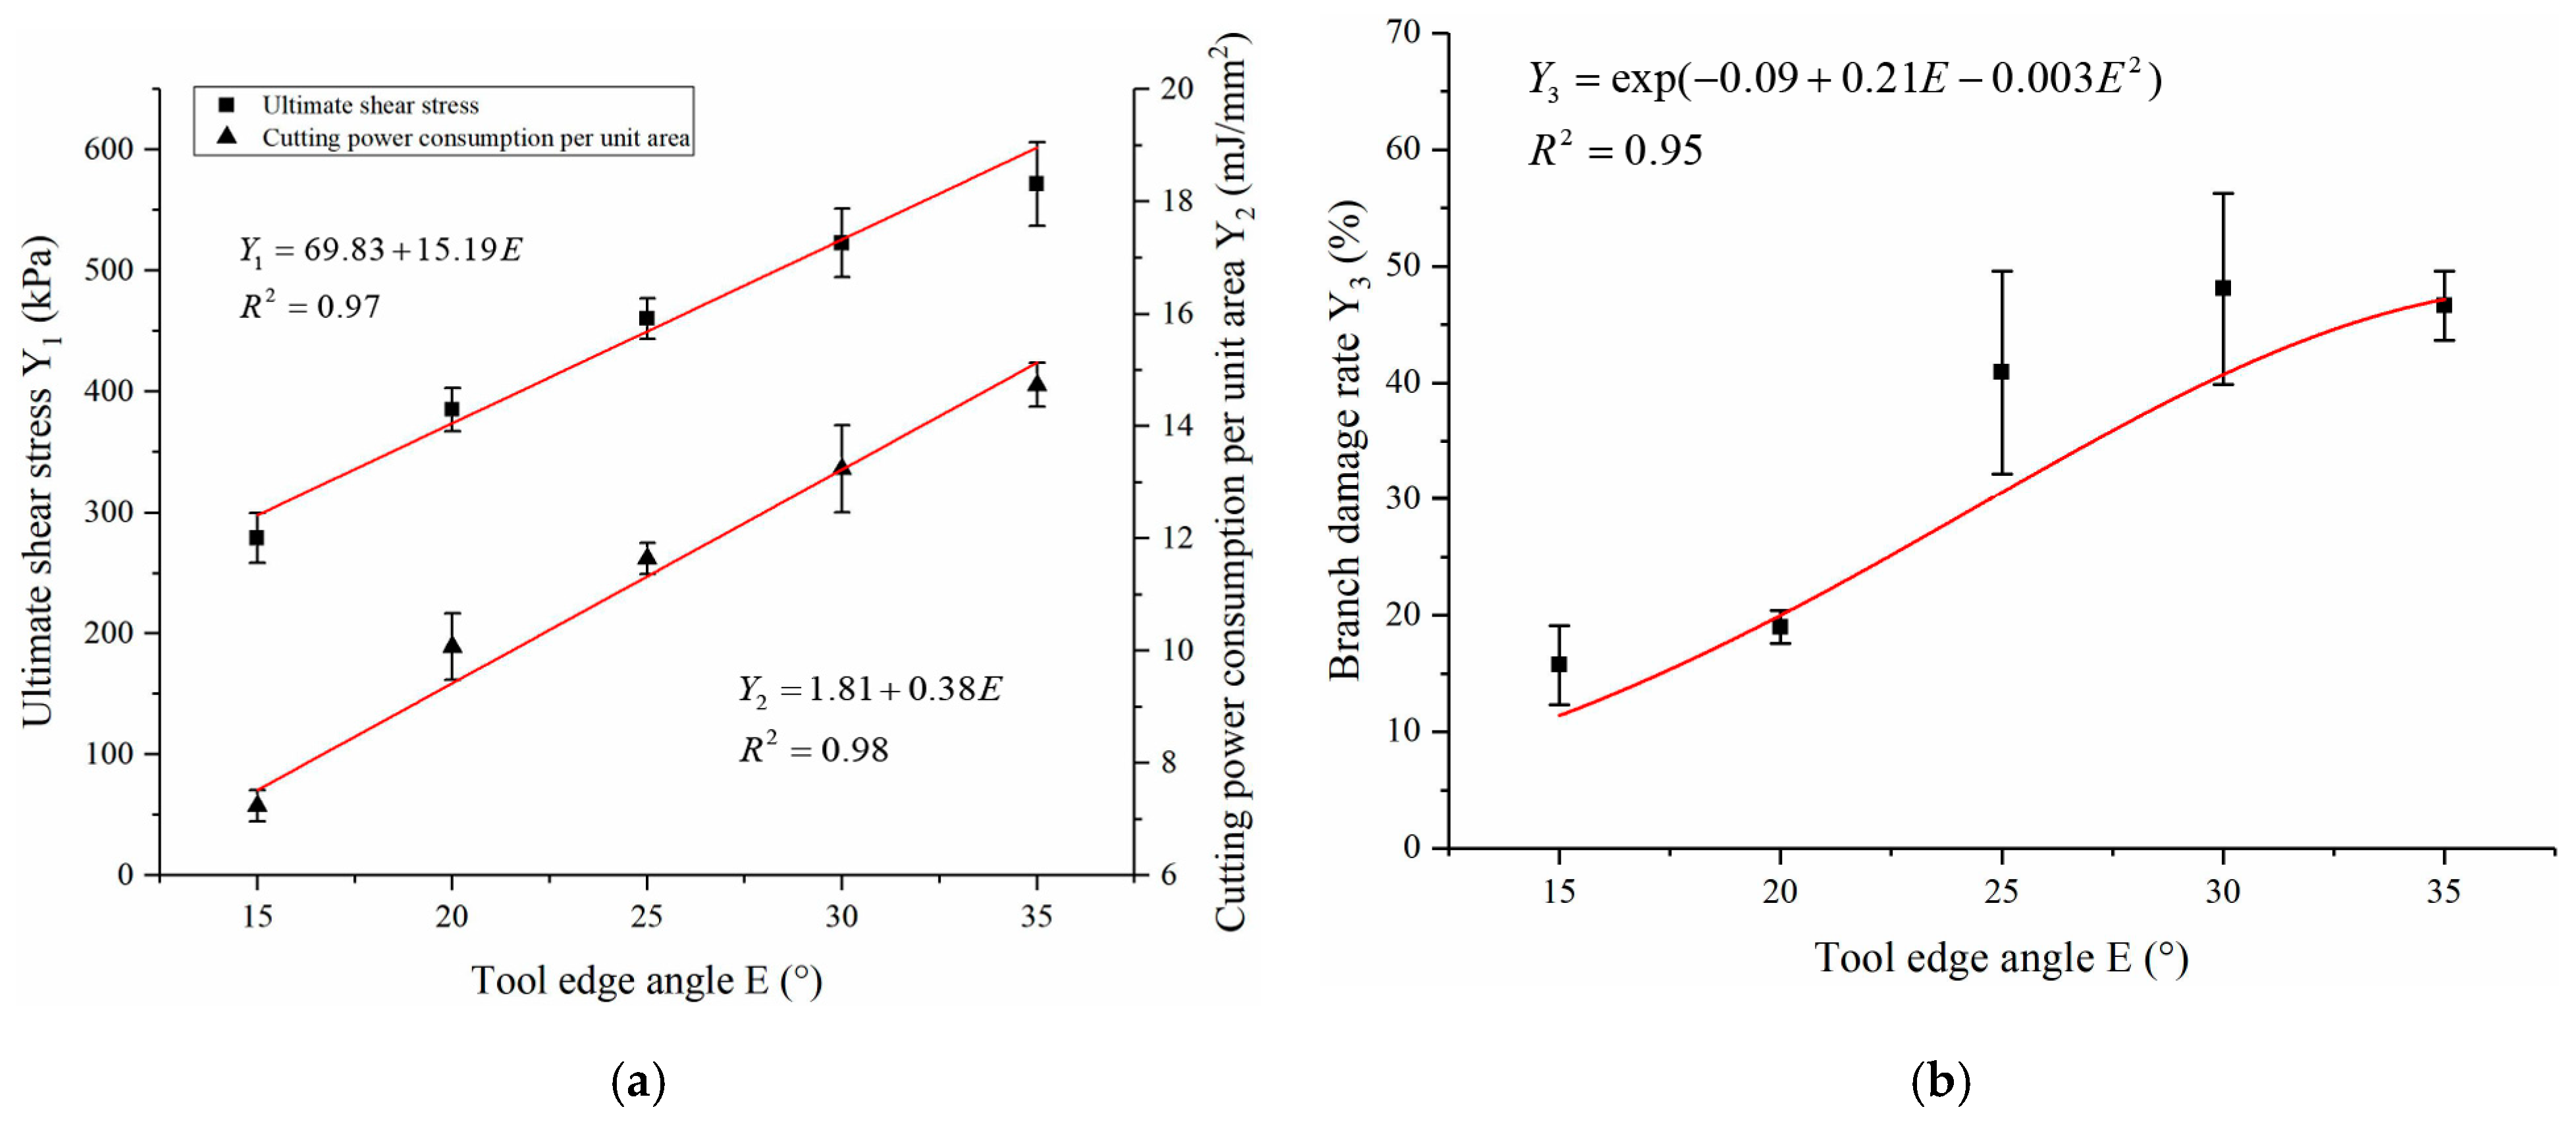
The cutting speed was set to 3 m/s, and the tool back angle was set to 0°. The effects of different tool edge angles on the cutting performance of poplar branches were analyzed, in which the diameter of the branches ranged from 24.42 to 25.98 mm, and the moisture content of the branches ranged from 45.01% to 48.78%, and the experimental results are shown in Figure 10. It can be seen that the ultimate shear stress, cutting power consumption per unit area, and branch damage rate increase with the tool edge angle. This is because when the tool edge angle increases, the cutting angle increases, so the cutting deformation of the branch increases; that is, the fractured part of the branch increases, so the ultimate shear stress, cutting power consumption per unit area, and branch damage rate also increase.

Figure 10.
Test results of tool edge angle: (a) the effect of cutting-edge angle on the cutting properties of poplar branches; (b) the effect of cutting-edge angle on the damage rate of poplar branches.
The linear function and exponential function models were used to fit the tool edge angle with the ultimate shear stress, cutting power consumption per unit area, and branch damage rate, and the corresponding regression equations were obtained. The variance analysis and significance check indicated that the tool edge angle had a significant influence on the ultimate shear stress, cutting power consumption per unit area, and branch damage rate (p < 0.01), and the fitting degree of the regression equations was 0.97. 0.98 and 0.95, respectively, which indicated that the curves were well fitted, and the ultimate cutting stress, cutting power consumption per unit area, and branch damage rate of poplar branches could be predicted by the tool edge angle.
4.2.3. Tool Back Angle
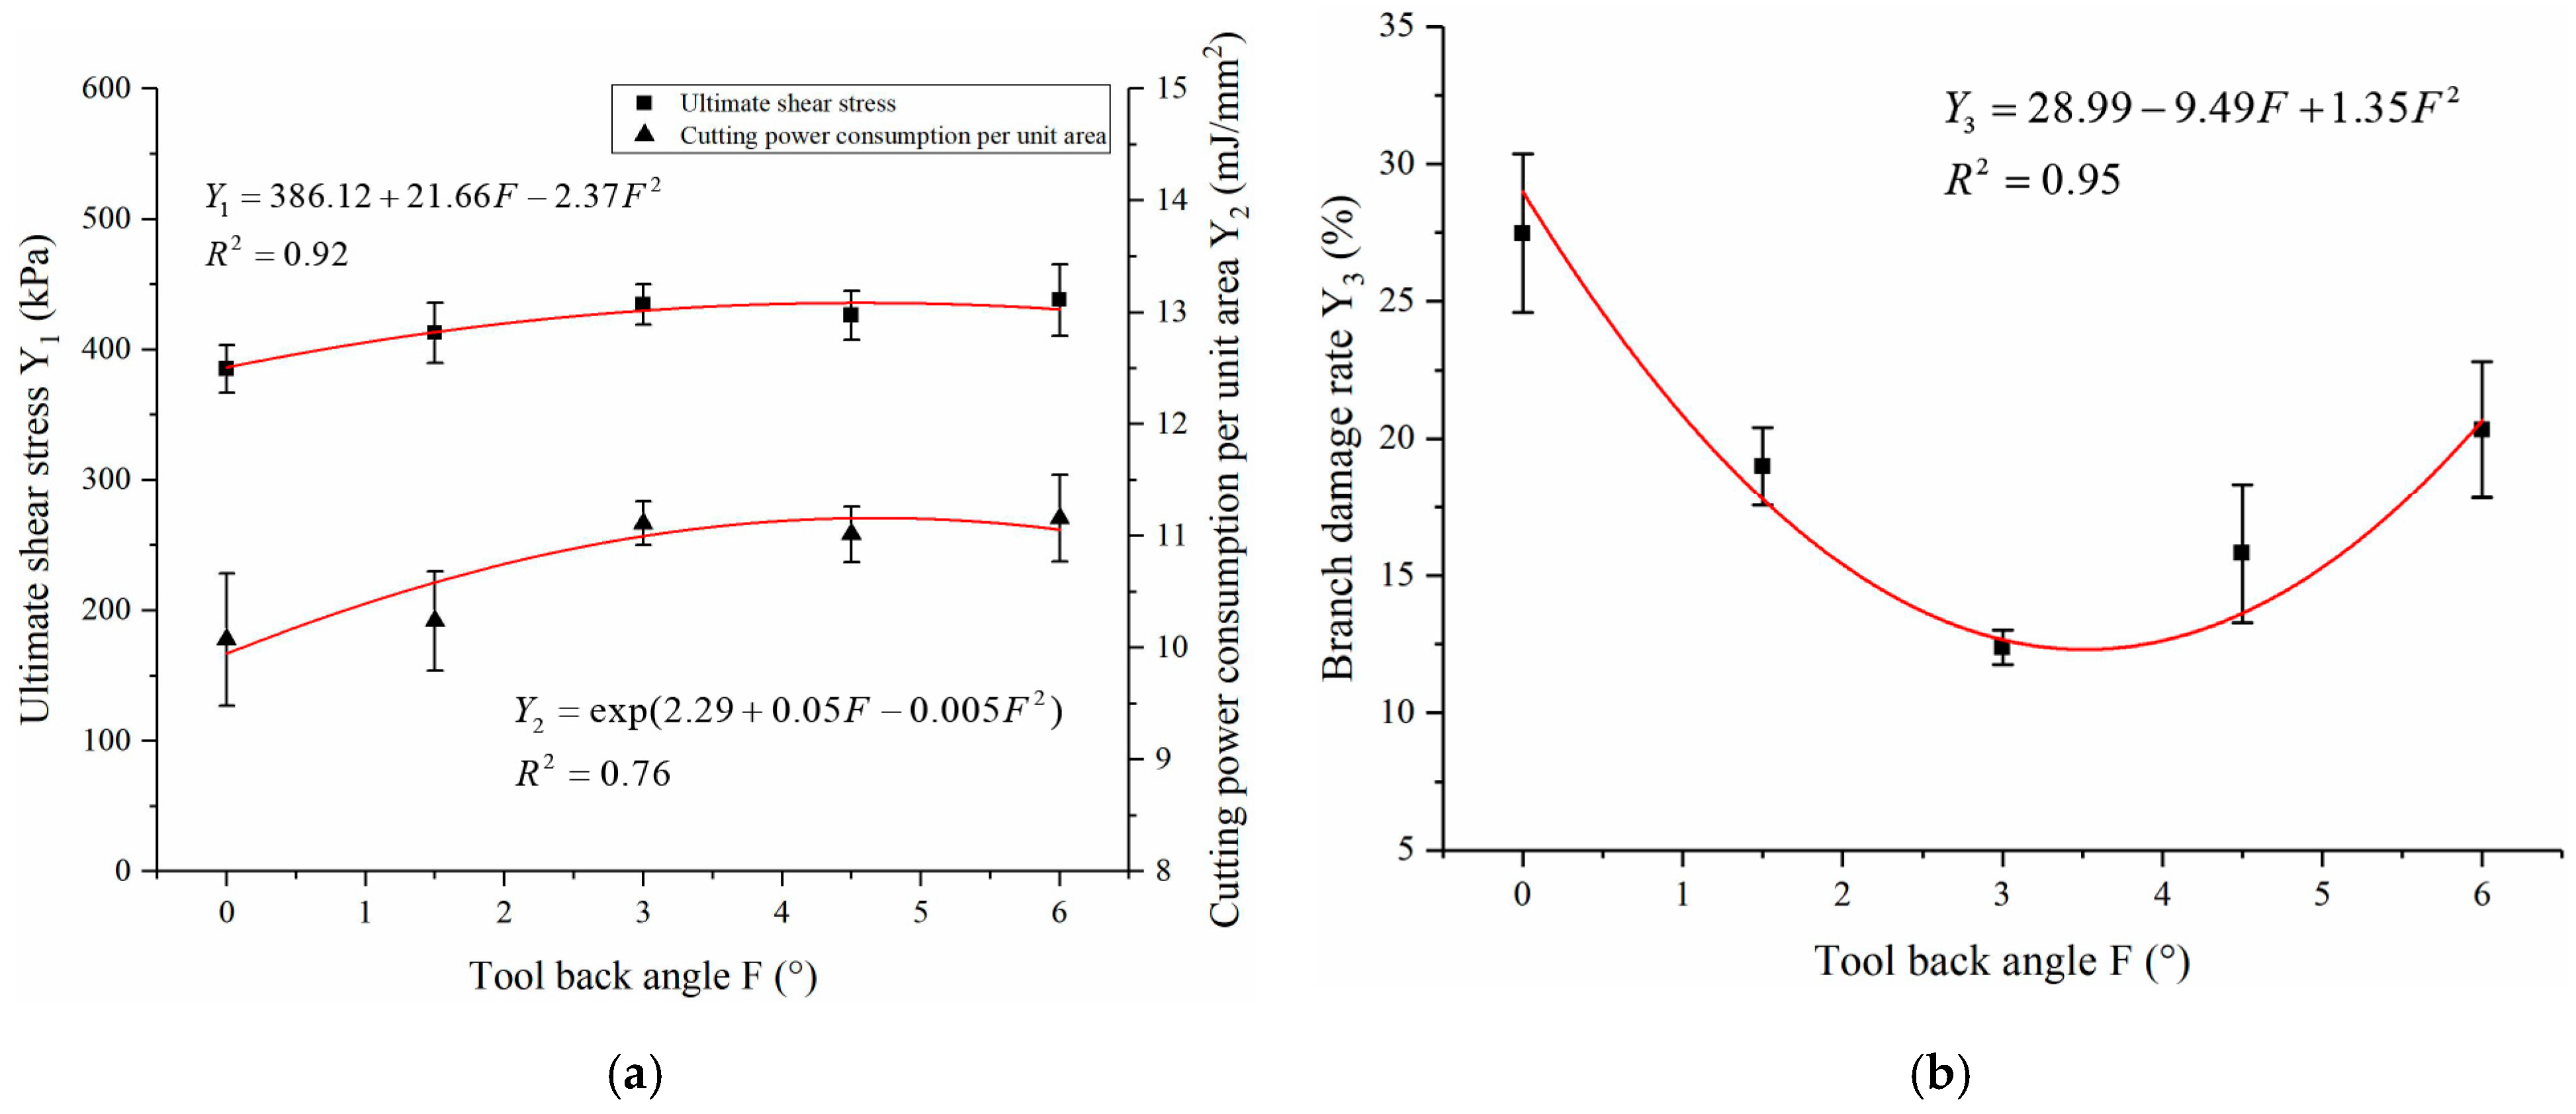
The influence of different tool back angles on the cutting performance of poplar branches was analyzed by setting the cutting speed to 3 m/s and the cutting edge angle to 20°, in which the branch diameter ranged from 24.32 to 25.39 mm, and the branch moisture content from 47.49% to 52.3%. The experimental results are shown in Figure 11. It can be seen that the ultimate shear stress and cutting power consumption per unit area increase first and then stabilize with the increase in the tool back angle. The damage rate of branches decreases first and then increases with the increase in the tool back angle. When the tool back angle increases, the cutting angle increases, the cutting deformation of branches increases, and the ultimate shear stress and cutting power consumption per unit area also increase. However, the friction between the branch section and the tool back surface decreases, so the damage rate of branches decreases. However, when the tool back angle is larger than a certain value, the cutting resistance also increases, leading to an increase in the branch damage rate. From Figure 11, it can be seen that when the tool back angle was 2~4°, it was relatively small.
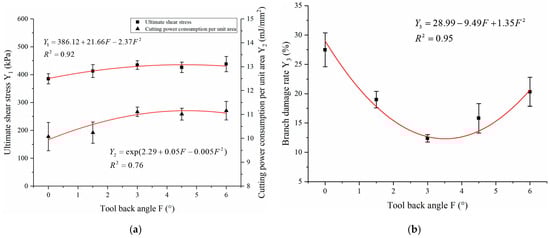
Figure 11.
Test results of tool back angle: (a) the effect of tool back angle on the cutting properties of poplar branches; (b) the effect of tool back angle on the damage rate of poplar branches.
The polynomial function and exponential function models were used to fit the curve of the tool back angle with the ultimate shear stress, the cutting power consumption per unit area, and the branch damage rate, and the corresponding mathematical model were obtained. The variance analysis and significance check demonstrated that the tool back angle had a significant effect on the ultimate shear stress, the cutting power consumption per unit area, and the branch damage rate (p < 0.05), and the fitting degree of the regression model were 0.92, 0.76 and 0.97, respectively, which indicated that the curves were well fitted, and the ultimate shear stress, cutting power consumption per unit area and branch damage rate of poplar branches could be predicted by the tool back angle.
To sum up, the single-factor cutting performance test results of poplar branches show that the cutting speed, tool edge angle, and tool back angle had a significant influence on the ultimate shear stress, cutting power consumption per unit area, and branch damage rate, and the corresponding regression curve was well fitted. Meanwhile, when the cutting speed was in the range of 3~5 m/s, the tool edge angle was 15~20°, and the tool back angle was 2~4°, the ultimate shear stress, cutting power consumption per unit area, and branch damage rate of poplar branches were relatively small.
4.3. Quadratic Regression Orthogonal Rotation Combination Design Test Results and Analysis
To optimize the cutting parameters of poplar branches, according to Table 2, the multi-factor cutting test scheme was determined following the Central-Composites test design principle. In the multi-factor test, nine central points were used for error estimation. A total of 20 groups of experiments were conducted, and each group of tests was repeated three times. The corresponding ultimate shear stress, cutting power consumption per unit area, and branch damage rate were calculated by Equations (1)–(4), and a series of data analyses were carried out. The multi-factor cutting test scheme and results of poplar branches are shown in Table 3. Among them, the test branches ranged from 24.2 to 25.87 mm in diameter, and the moisture content of the branches ranged from 45.08% to 51.94%.
Table 3.
The multi-factor cutting test scheme and results.
4.3.1. Regression Model, Analysis of Variance, and Significance Test
The multiple regression analysis of multi-factor test results was conducted by Design-Expert 11 software, and the regression mathematical model between ultimate shear stress, cutting power consumption per unit area and branch damage rate and cutting speed, tool edge angle, and tool back angle were obtained:
It can be seen from Table 4, Table 5 and Table 6 that the regression models of ultimate shear stress, cutting power consumption per unit area, and branch damage rate are extremely significant (p < 0.01), and the lack of fit is not significant (p > 0.05). The determination coefficient of the regression model of ultimate shear stress was R2 = 0.96, the determination coefficient of the regression model of cutting power consumption per unit area was R2 = 0.97, and the determination coefficient of the regression model of branch damage rate was R2 = 0.98. The above mathematical models had high fitting accuracy, indicating that the model can analyze the influence degree of each factor and predict the optimal value.
Table 4.
Analysis of variance results of ultimate shear stress.
Table 5.
The results of variance analysis of cutting power consumption per unit area.
Table 6.
The results of variance analysis of branch damage rate.
Variance analysis and a significance test were performed on the above regression models, and the influence degree of each factor could be judged by comparing the p value. For the ultimate shear stress and the cutting power consumption per unit area of poplar branches, factors D, E, F, D2, E2 in the model is extremely significant (p < 0.01), and the rest of the factors are not significant (p > 0.05). For the damage rate of poplar branches, factors D, E, F, D2, E2, and F2 in the model are extremely significant (p < 0.01), and the rest factors are not significant (p > 0.05). To sum up, the influence of the test factors on ultimate shear stress, cutting power consumption per unit area, and branch damage rate of poplar branches is ranked from high to low as tool edge angle > cutting speed > tool back angle.
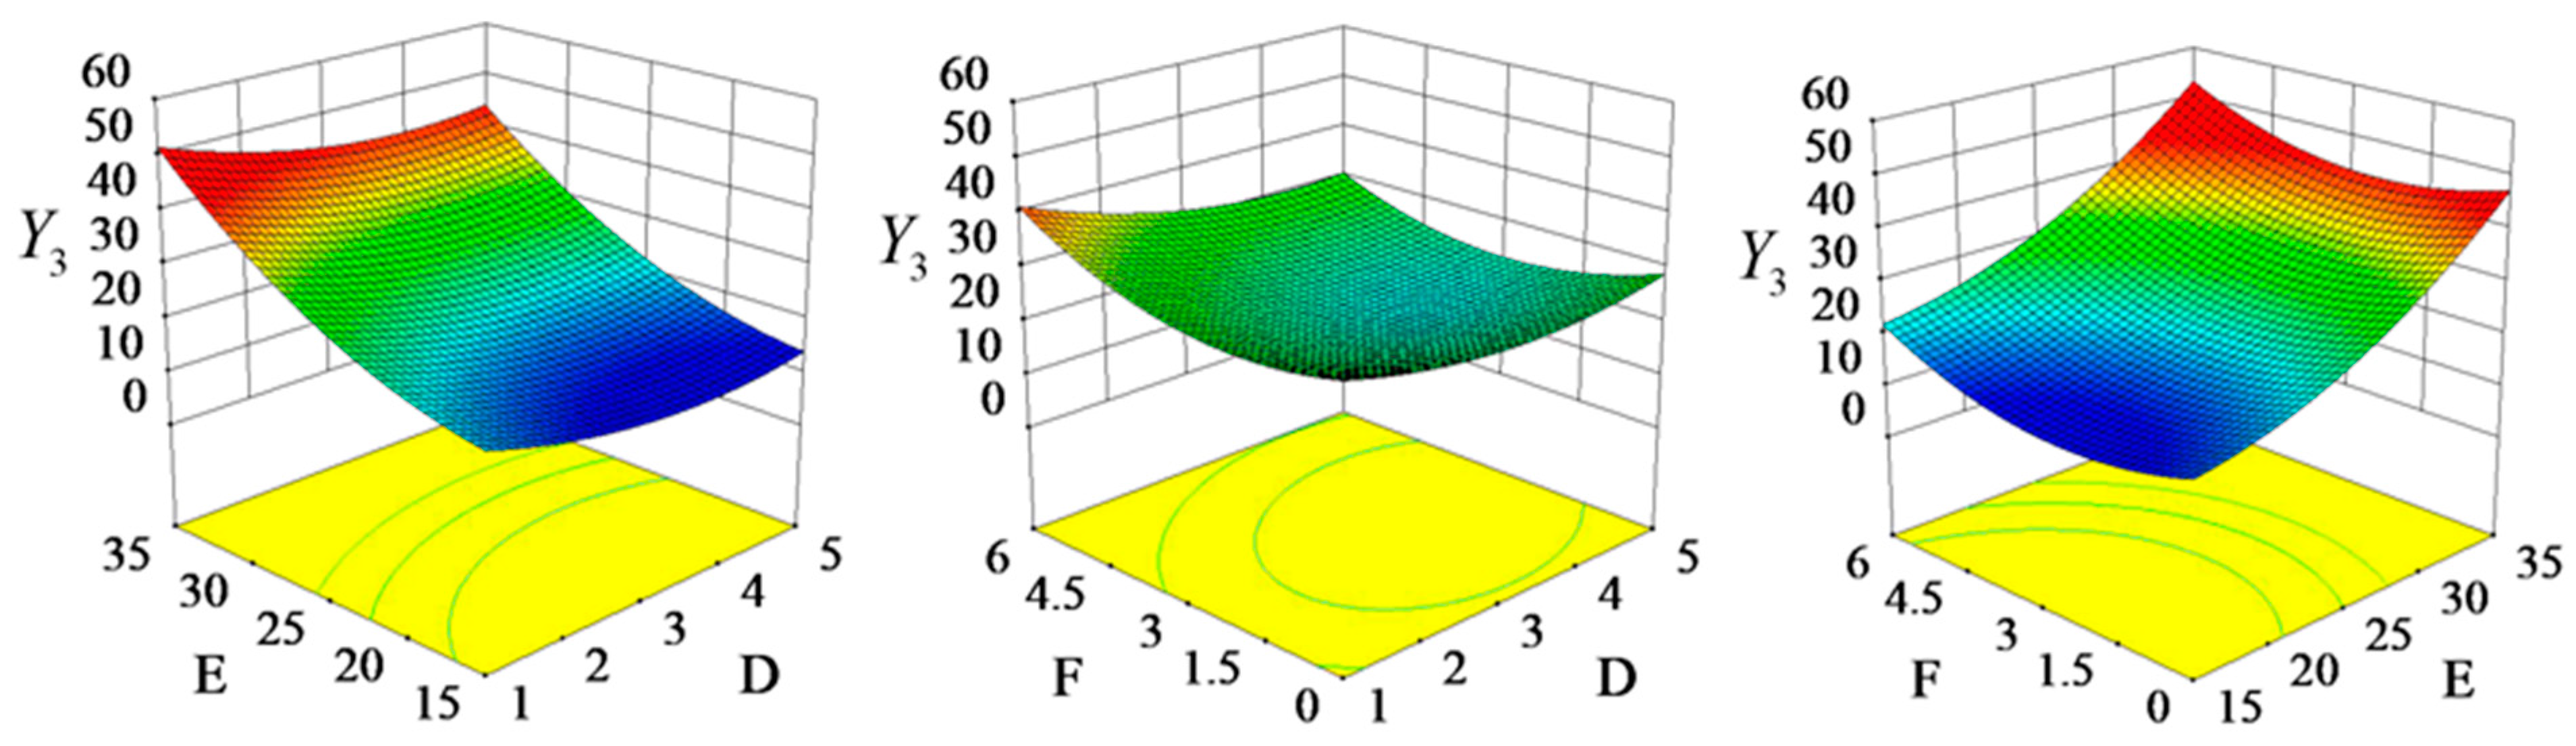
4.3.2. Response Surface Analysis of Interaction Effects
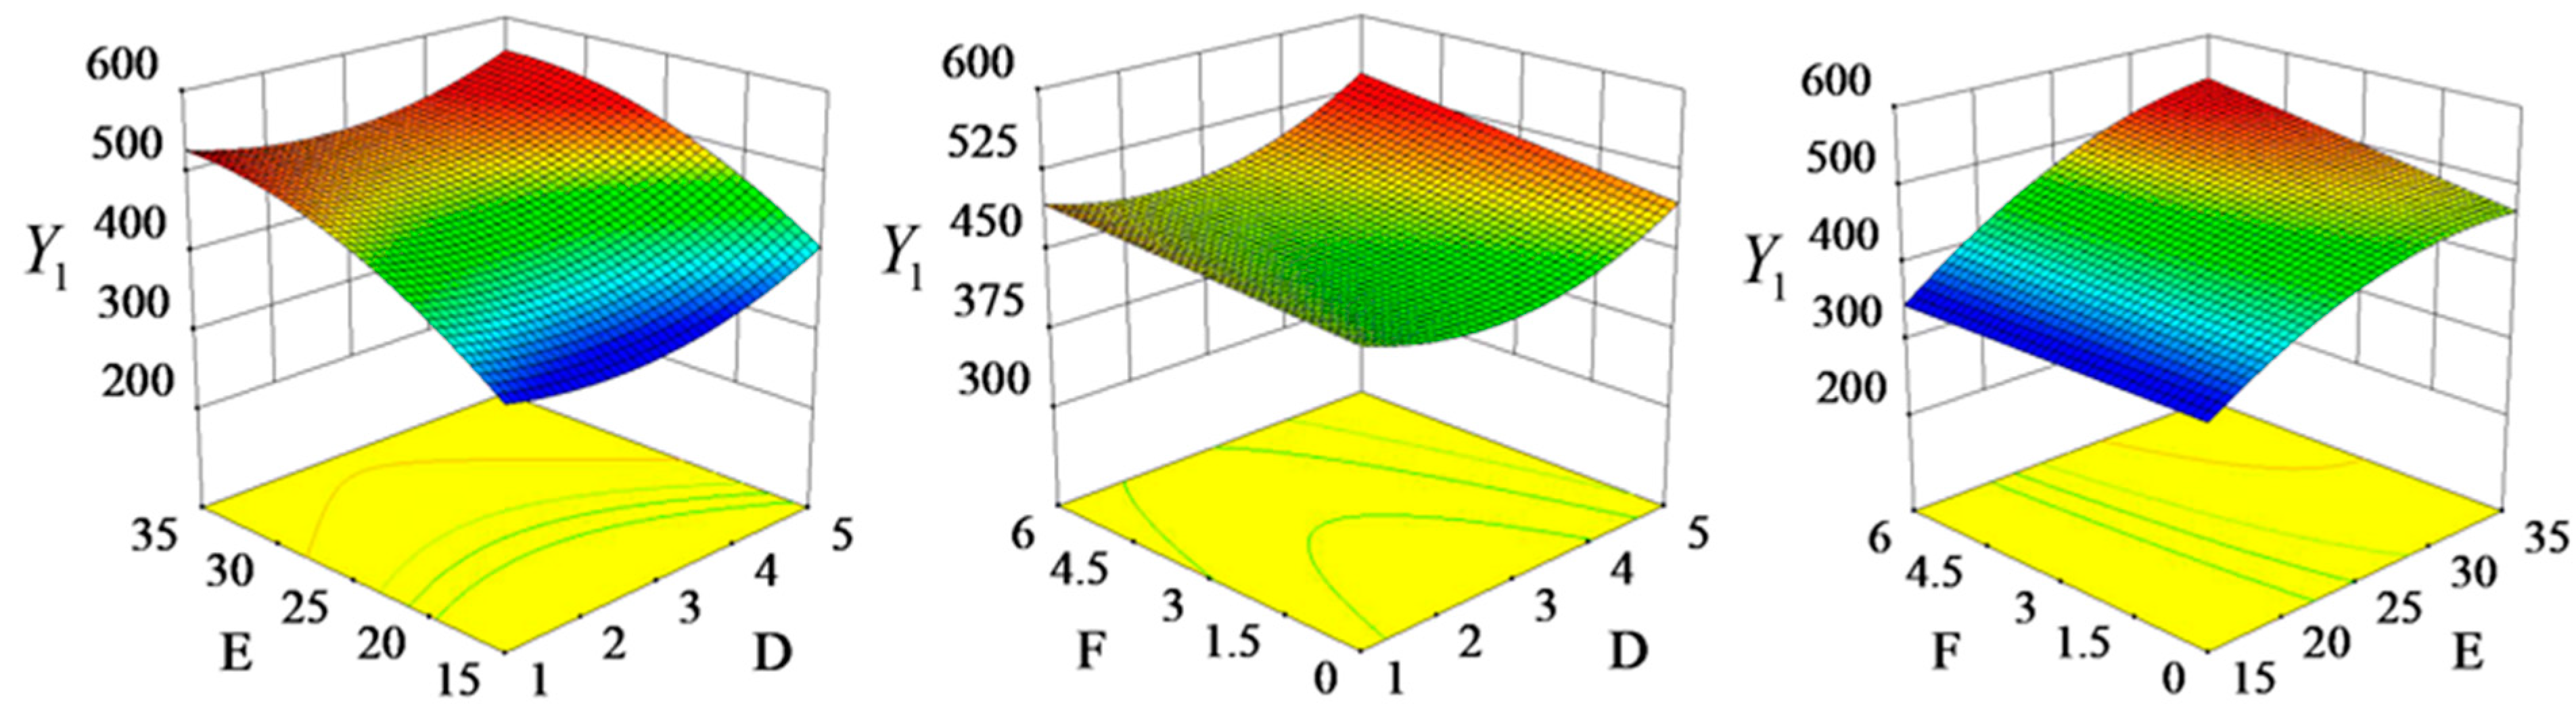
The influence of the interaction between the experimental factors on the cutting performance of poplar branches was analyzed, and the optimal cutting parameter region was further reduced. The response surface diagram of the interaction effect of each experimental factor on the ultimate shear stress, cutting power consumption per unit area, and branch damage rate of poplar branches is illustrated in Figure 12, Figure 13 and Figure 14. The results of response surface analysis indicate that the ultimate shear stress of poplar branches is small when the cutting speed is 2~4 m/s, the tool edge angle is 15~20°, and the tool back angle is 0~3°. When the cutting speed is in the range of 2~4 m/s, the tool edge angle is 15~20°, and the tool back angle is 0~3°, the cutting power consumption per unit area of poplar branches is small. When the cutting speed is in the range of 3~5 m/s, the tool edge angle is 15~20°, and the tool back angle is 2~4°, the cutting damage rate of poplar branches is small.
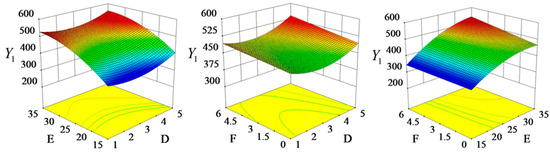
Figure 12.
The response surface diagram of the interaction effect on ultimate shear stress Y1. Note: The red, green and blue colours in the graph represent high, medium and low values respectively.
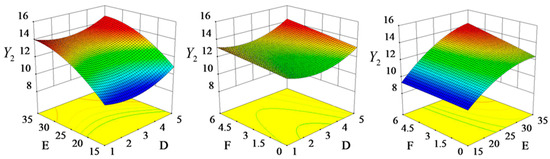
Figure 13.
The response surface diagram of the interaction effect on cutting power consumption per unit area Y2. Note: The red, green and blue colours in the graph represent high, medium and low values respectively.
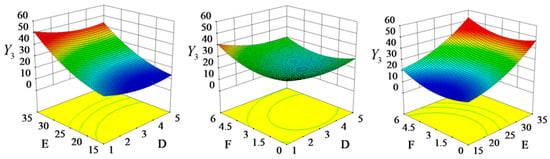
Figure 14.
The response surface diagram of interaction effect on branch damage rate Y3. Note: The red, green and blue colours in the graph represent high, medium and low values respectively.
Considering the equilibrium relationship among the ultimate shear stress, cutting power consumption per unit area, and branch damage rate, the value range of each experimental factor was determined. That is, when the cutting speed was within 3~5 m/s, the tool edge angle was 15~20°, and the tool back angle was 2~4°, the ultimate shear stress, the cutting power consumption per unit area, and the branch damage rate of poplar branches were relatively small, which is basically consistent with the results of single-factor test analysis.
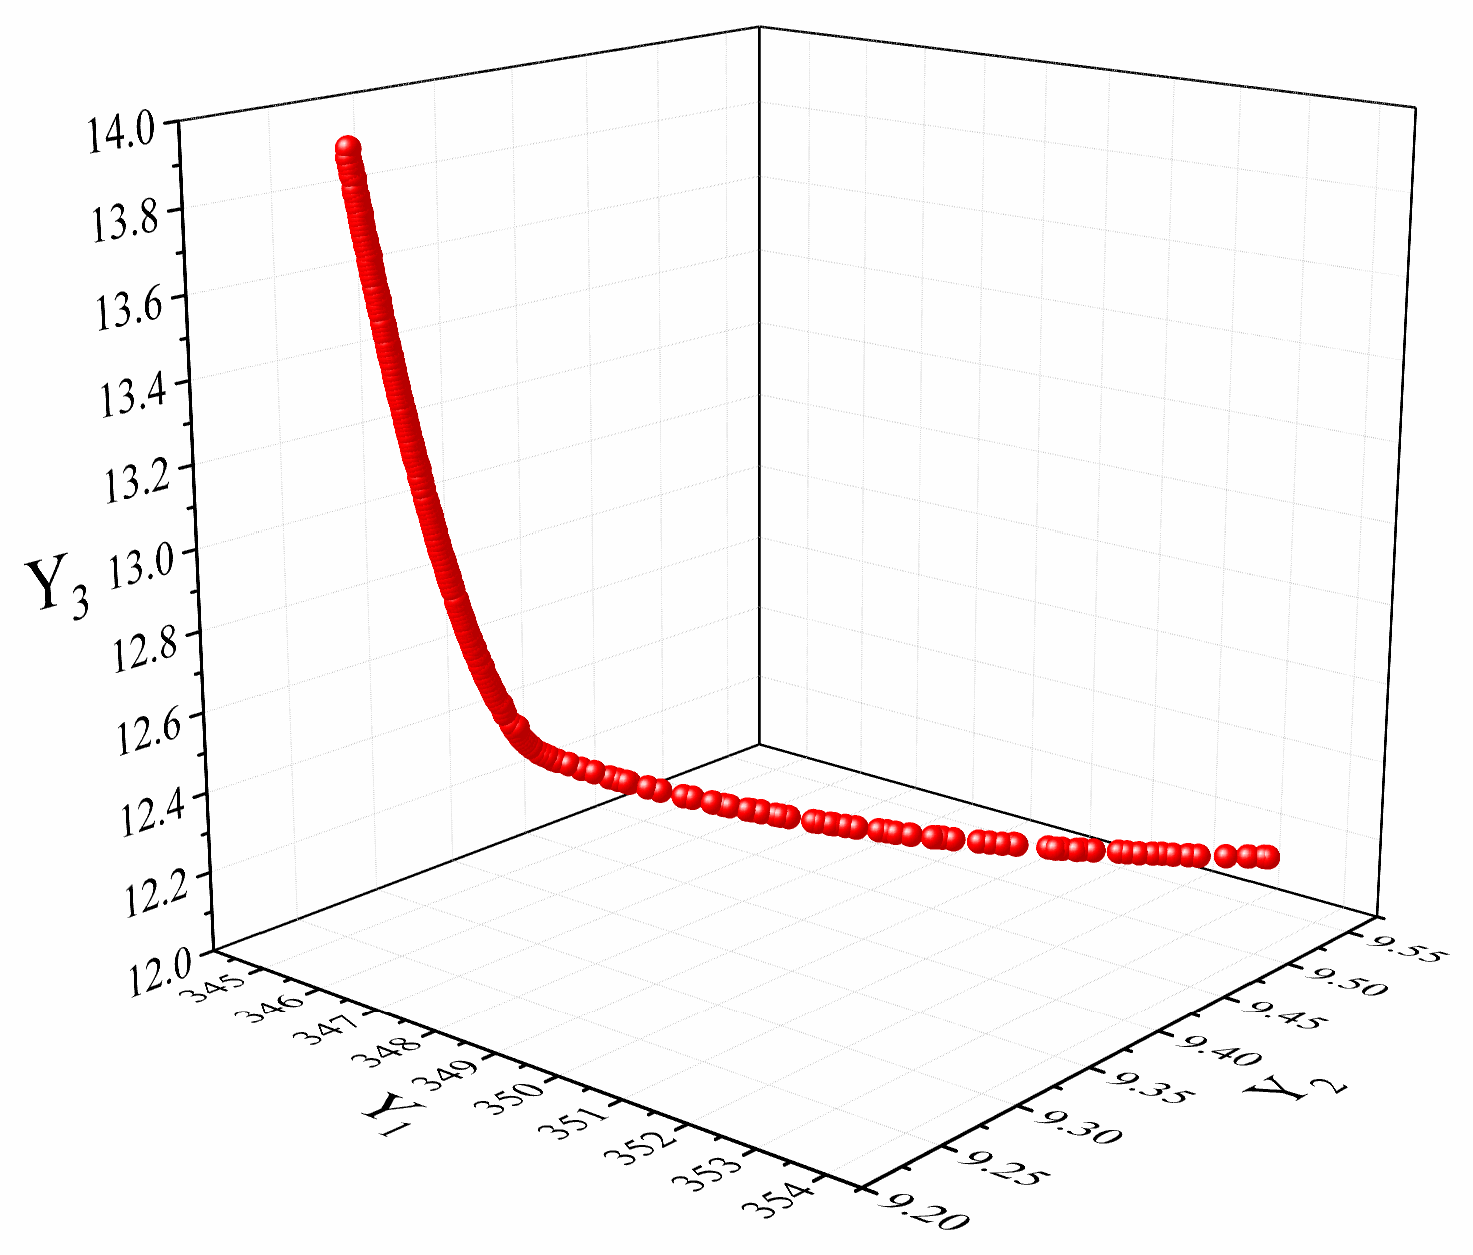
4.4. Cutting Parameter Optimization
To improve the cutting performance of poplar branches, the ultimate shear stress, cutting power consumption per unit area, and branch damage rate should be as small as possible. Therefore, the objective optimization functions of ultimate shear stress, cutting power consumption per unit area, and branch damage rate are established. According to the variables involved in the objective optimization function, the parameters to be optimized are cutting speed, tool edge angle, and tool back angle. Meanwhile, the range of parameters to be optimized was determined according to the analysis results of the previous response surface diagram, and the corresponding constraints were established, as shown in Equation (8). The set of pareto optimal solutions obtained by solving the optimization model using the NSGA-II algorithm is shown in Figure 15. For a multi-objective optimization problem, it is impossible to make every objective optimal at the same time, but coordination and trade-offs can be made between the objectives to satisfy each objective as much as possible, which means that all solutions on the optimal boundary can be used for scheme optimization. The optimal combination of cutting parameters for poplar branches is obtained by taking into account the principles of ultimate shear stress, cutting power consumption per unit area and branch damage rate: 3.02 m/s for cutting speed, 15° for tool edge angle, and 3° for tool back angle. In this case, the ultimate shear stress, cutting power consumption per unit area, and damage rate of poplar branches were 346.62 kPa, 9.35 mJ/mm2, and 12.36%, respectively.
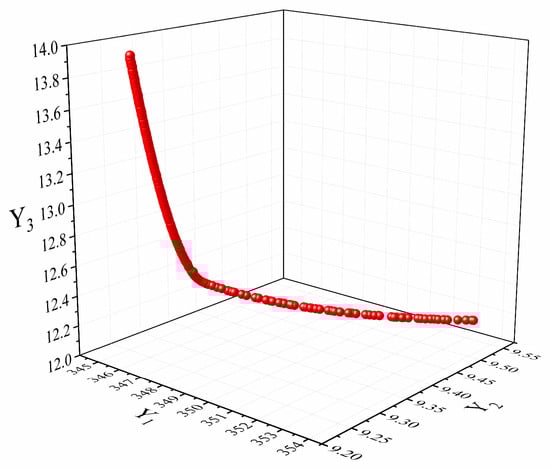
Figure 15.
The Pareto optimal solution set based on NSGA-II.
4.5. Experimental Verification
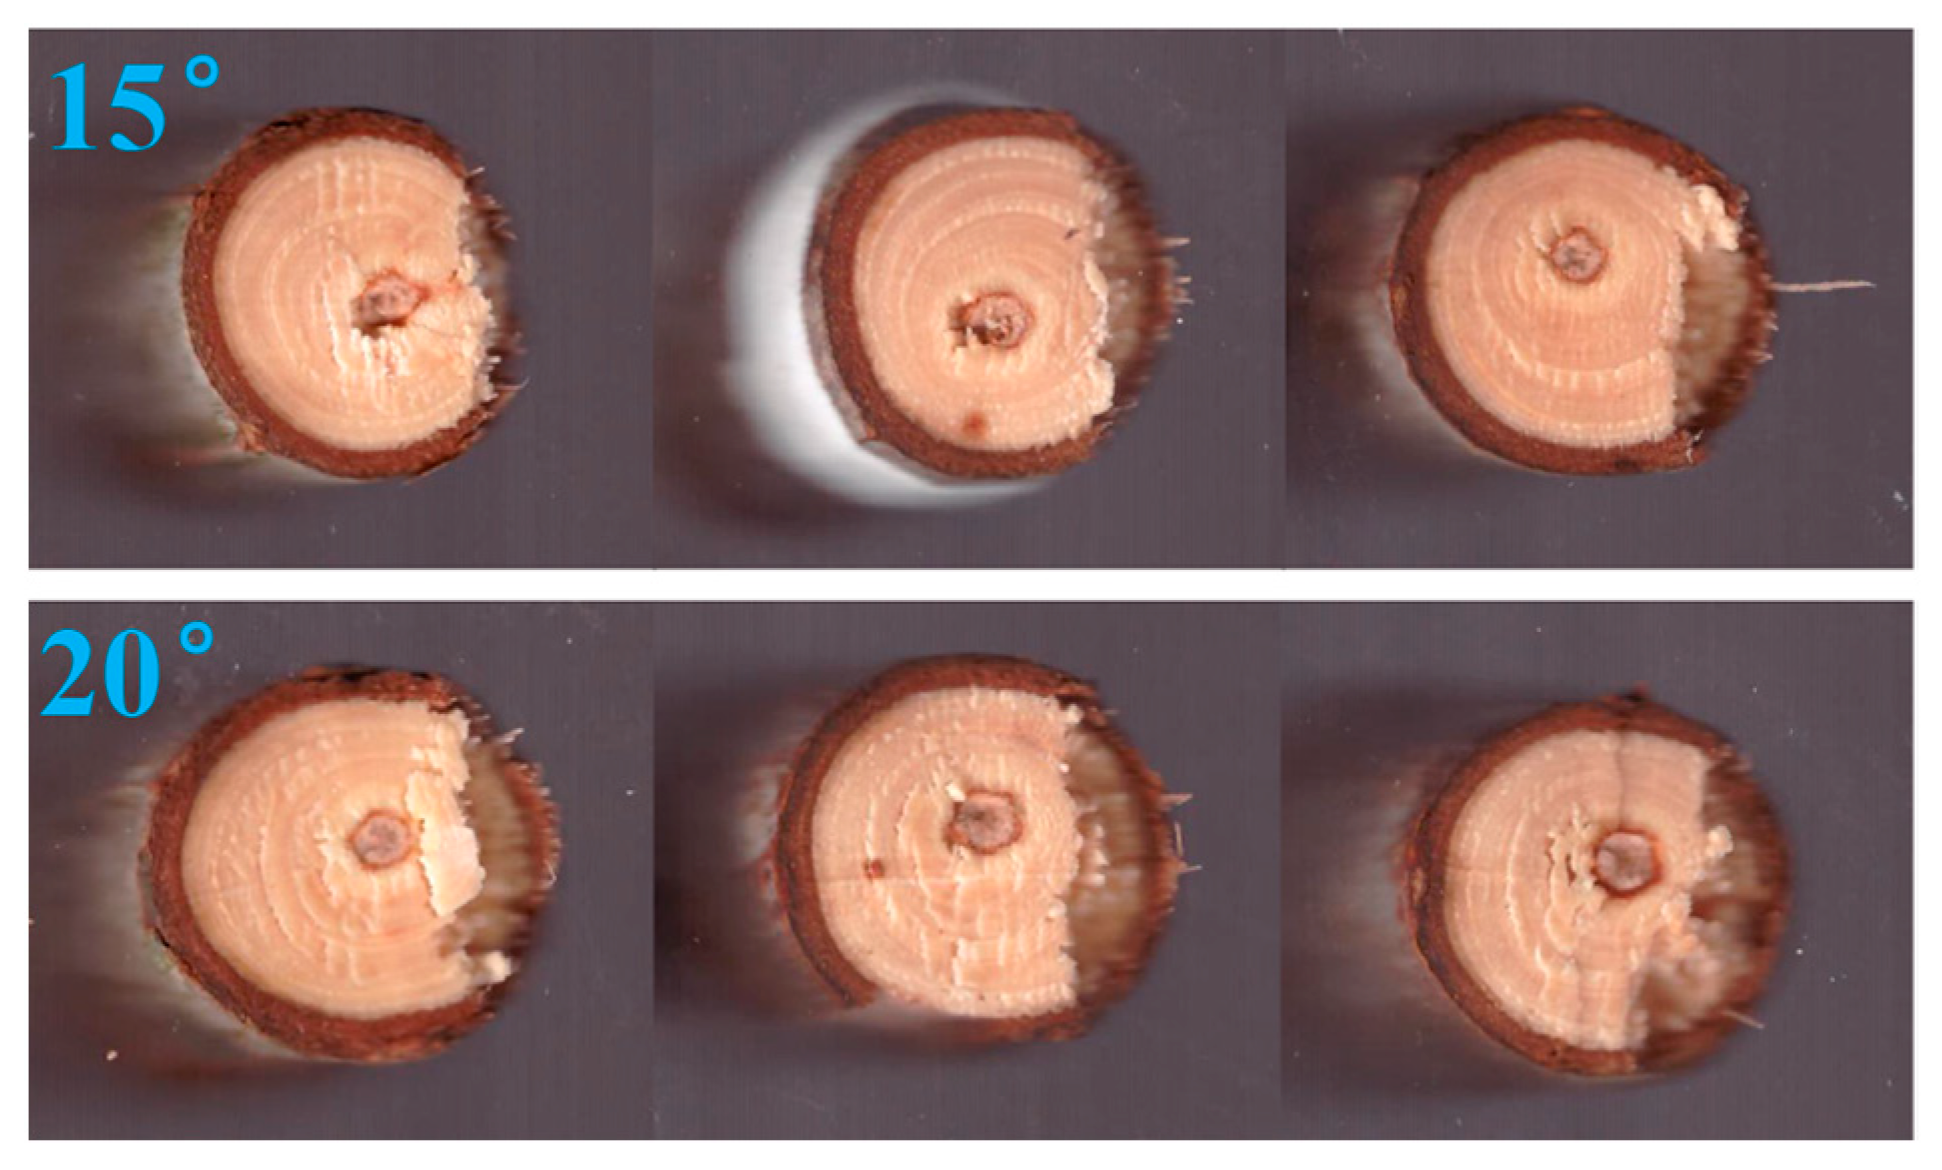
To further verify the accuracy of the optimal cutting parameters of poplar branches determined above, a verification test was conducted by using the optimal cutting parameter combination, and the cutting performance of the tool edge angle of 15° and 20° was compared. Each group of tests was repeated three times, and the average value was taken. The test results are listed in Table 7, and Figure 16 shows the quality of the cutting section of poplar branches under different tool edge angles.
Table 7.
The verification and comparison test results.
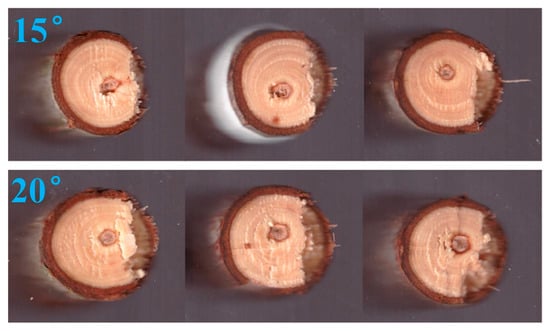
Figure 16.
The cutting section quality of poplar branches under different tool edge angles.
It can be seen from Table 7 that the relative errors between the ultimate shear stress Y1, cutting power consumption per unit area Y2, and branch damage rate Y3 in the verification test and the predicted values of the regression model were 3.95%, 6.87%, and 6.29%, respectively. The small error indicates that the mathematical model is accurate and reliable, and it can be used to predict the ultimate shear stress, cutting power consumption per unit area, and branch damage rate of poplar branches. Using the optimal cutting parameters, under a tool edge angle of 15°, the ultimate shear stress, cutting power consumption per unit area, and branch damage rate were, respectively reduced by 17.29%, 14.98%, and 34.21%, compared with those under a tool edge angle of 20°. According to Figure 16, the cutting surface quality of poplar branches with a tool edge angle of 15° was smoother than that with a tool edge angle of 20°. The verification and comparison test further verified the accuracy of the established regression mathematical model and the optimal cutting parameter combination of poplar branches determined above. The test results can provide basic data and reference for designing and optimizing poplar branch pruning machinery.
Through theoretical analysis, the error in the cutting performance verification test of poplar branches may be introduced by the difference in the physical and mechanical properties of each poplar branch. Through research, it was found that there is still a certain damage rate of poplar branches under the optimal cutting parameters, which may be caused by the vibration of the bench device during the branch cutting test, and the bench will be optimized and improved in the following, so as to reduce the damage rate of poplar branches during the cutting process. In addition, there are still some limitations in this study, such as only considering the cutting performance of poplar branches in spring; in practice, the moisture content of poplar branches in different periods is different, and poplar branches with different moisture contents may have different physical and mechanical properties and cutting performances, which will be further investigated in the future. Meanwhile, after clarifying the optimal cutting parameters of poplar branches, our future work will develop low-power, high-efficiency poplar branch pruning equipment and conduct experimental research on forest pruning performance.
5. Conclusions
According to the growth characteristics of poplar branches and the requirements of pruning forestry, a linear cutting test bench device was designed in this paper. The main influencing factors of branch cutting force were explored through the cutting mechanics analysis of poplar branches, and the changing law of cutting performance of poplar branches was investigated by using the response surface method, and the parameters that had a significant influence on the ultimate shear stress, cutting power consumption per unit area, and branch damage rate of poplar branches were investigated. Then, a second-order regression mathematical model between the ultimate shear stress, cutting power consumption per unit area, branch damage rate, and significant parameters of poplar branches was established. Finally, the NSGA-II algorithm was used for parameter optimization to obtain the optimal combination of cutting parameters for poplar branches, and its accuracy was further verified by experiments. The following conclusions are drawn:
- (1)
- After the cutting mechanics analysis of poplar branches, it can be seen that the main factors affecting the cutting resistance of the tool include the physical and mechanical properties of poplar branches (yield strength, elastic modulus, internal friction coefficient, etc.), the structural characteristics of the tool (thickness of the tool, tool edge angle, tool back angle, etc.), as well as the interaction between the tool and the poplar branches (cutting speed, tool tilt angle, contact friction coefficient, etc.).
- (2)
- According to the results of the single-factor test, cutting speed, tool edge angle, and tool back angle had a significant influence on the ultimate shear stress, cutting power consumption per unit area, and branch damage rate of poplar branches, and the established regression equation had high goodness of fit, indicating that the curve was well fitted.
- (3)
- The experimental results of quadratic regression orthogonal rotation combination design indicated that the established regression mathematical model of ultimate shear stress, cutting power consumption per unit area, and branch damage rate of poplar branches had high reliability and precision. The influencing order on ultimate shear stress, cutting power consumption per unit area, and branch damage rate was tool edge angle > cutting speed > tool back angle. Meanwhile, the optimal combination of cutting parameters obtained by parameter optimization was 3.02 m/s for the cutting speed, 15° for tool edge angle, and 3° for tool back angle. In this case, the ultimate shear stress, cutting power consumption per unit area, and damage rate of poplar branches were small, respectively, 346.62 kPa, 9.35 mJ/mm2, and 12.36%, which effectively reduces the cutting energy consumption of the poplar tree-climbing pruning machinery and plays a certain role in energy saving.
- (4)
- The verification test results under the optimal cutting parameter combination of poplar branches demonstrate that the relative errors of the ultimate shear stress, the cutting power consumption per unit area, and the branch damage rate in the verification test were, respectively, 3.95%, 6.87%, and 6.29%, compared with the predicted values of the regression model. The small error indicates that the mathematical model is accurate and reliable, and it can be used to predict the ultimate shear stress, the cutting power consumption per unit area, and the branch damage rate of poplar branches. Using the optimal cutting parameters, under a tool edge angle of 15°, the ultimate shear stress, cutting power consumption per unit area, and branch damage rate were, respectively reduced by 17.29%, 14.98%, and 34.21% compared with those under a tool edge angle of 20°, and the cutting surface quality of poplar branches was flat and smooth compared with that under a tool edge angle of 20°. The verification test results further verify the reliability of the regression mathematical model and the optimal cutting parameter combination. The results of this paper provide an important basis and research methodology for the power selection and tool optimization design of tree climbing pruning equipment for poplar trees. At the same time, the growth rate and wood quality of poplar can effectively be improved after poplar pruning, which can also reduce pests and diseases, wind and snow disasters and fire hazards, and it plays a certain role in environmental protection.
Author Contributions
Methodology, data curation, validation, writing—original draft, writing—review and editing, L.Z.; software, W.Y.; formal analysis L.X.; visualization S.J.; investigation, W.C.; resources, J.X.; conceptualization, supervision, funding acquisition, H.Z. All authors have read and agreed to the published version of the manuscript.
Funding
This project has received funding from the National Key Research and Development Plan of China (Recipient: Hongping Zhou, Grant No. 2022YFD2202100).
Data Availability Statement
Data are contained within the article.
Acknowledgments
The authors would like to thank all the reviewers who participated in the review. Meanwhile we warmly appreciate L.X., many thanks for providing the testing equipment and site.
Conflicts of Interest
The authors declare no conflicts of interest.
References
- Ma, Y.; She, C.; Fang, S. Effects of Pruning Methods on Growth, Photosynthetic Leaf Area and Plumpness of Trunk Segment in Poplar Plantations. J. Nanjing For. Univ. 2021, 45, 137. [Google Scholar]
- Kang, Z.; Kaidong, H.; Xiaojun, Z.; Jianwei, S.H.E.; Xu, Z.; Luozhong, T. Effects of Pruning on Microclimate and Understory Vegetation in a Poplar Plantation. Ecol. Environ. 2019, 28, 1548. [Google Scholar]
- Cui, H.O.; Liu, M. Analysis on the Results of the 9th National Forest Inventory. J. West China For. Sci. 2020, 49, 90–95. [Google Scholar]
- Zhang, J.; Liu, L. Effects of Pruning Intensity on Nonstructural Carbohydrates of Populus Alba× P. Talassica in the Arid Desert Region of Northwest China. J. For. Res. 2021, 32, 823–830. [Google Scholar] [CrossRef]
- Danilović, M.; Sarić, R.; Cirović, V.; Pudja, V. The Impact of Pruning on Tree Development in Poplar Populus× Canadensis “I-214” Plantations. iForest-Biogeosci. For. 2022, 15, 33. [Google Scholar] [CrossRef]
- Szwajka, K.; Trzepiecinski, T. On the Machinability of Medium Density Fiberboard by Drilling. BioResources 2018, 13, 8263–8278. [Google Scholar] [CrossRef]
- Du, Z.; Li, D.; Ji, J.; Zhang, L.; Li, X.; Wang, H. Bionic Optimization Design and Experiment of Reciprocating Cutting System on Single-Row Tea Harvester. Agronomy 2022, 12, 1309. [Google Scholar] [CrossRef]
- Wei, W.; Li, Y.; Xue, T.; Li, Y.; Sun, P.; Yang, B.; Yin, Z.; Mei, C. Tool Wear during High-Speed Milling of Wood-Plastic Composites. BioRes 2019, 14, 8678–8688. [Google Scholar] [CrossRef]
- Wei, W.; Shang, Y.; Peng, Y.; Cong, R. Research Progress of Noise in High-Speed Cutting Machining. Sensors 2022, 22, 3851. [Google Scholar] [CrossRef]
- Wei, W.; Li, Y.; Li, Y.; Xu, Y.; Yang, C. Research on Tool Wear Factors for Milling Wood-Plastic Composites Based on Response Surface Methodology. BioRes 2020, 16, 151–162. [Google Scholar] [CrossRef]
- Song, S.; Zhou, H.; Xu, L.; Jia, Z.; Hu, G. Cutting Mechanical Properties of Sisal Leaves under Rotary Impact Cutting. Ind. Crops Prod. 2022, 182, 114856. [Google Scholar] [CrossRef]
- Song, S.; Zhou, H.; Jia, Z.; Xu, L.; Zhang, C.; Shi, M.; Hu, G. Effects of Cutting Parameters on the Ultimate Shear Stress and Specific Cutting Energy of Sisal Leaves. Biosyst. Eng. 2022, 218, 189–199. [Google Scholar] [CrossRef]
- Wang, Y.; Yang, Y.; Zhao, H.; Liu, B.; Ma, J.; He, Y.; Zhang, Y.; Xu, H. Effects of Cutting Parameters on Cutting of Citrus Fruit Stems. Biosyst. Eng. 2020, 193, 1–11. [Google Scholar] [CrossRef]
- Meng, Y.; Wei, J.; Wei, J.; Chen, H.; Cui, Y. An ANSYS/LS-DYNA Simulation and Experimental Study of Circular Saw Blade Cutting System of Mulberry Cutting Machine. Comput. Electron. Agric. 2019, 157, 38–48. [Google Scholar] [CrossRef]
- Mathanker, S.K.; Grift, T.E.; Hansen, A.C. Effect of Blade Oblique Angle and Cutting Speed on Cutting Energy for Energycane Stems. Biosyst. Eng. 2015, 133, 64–70. [Google Scholar] [CrossRef]
- Kang, F.; Tong, S.Y.; Zhang, H.S.; Li, W.; Chen, Z.; Zheng, Y. Analysis and Experiments of Reciprocating Cutting Parameters for Apple Tree Branches. Trans. Chin. Soc. Agric. Eng. 2020, 36, 9–16. [Google Scholar]
- Zhang, Y.; Cui, Q.; Guo, Y.; Li, H.B. Experiment and Analysis of Cutting Mechanical Properties of Millet Stem. Trans. Chin. Soc. Agric. Mach. 2019, 50, 146–155. [Google Scholar]
- Ding, S.; Xue, X.; Cai, C.; Cui, L.; Chen, C. Optimization and Experiment of Blade Parameter for Pear Branches Cutting Device. Trans. Chin. Soc. Agric. Eng. S 2015, 2, 75–82. [Google Scholar]
- Wu, L.; Yang, Z.; Duan, J.; Wang, L.; Wang, W.; Liu, J.; Wang, L. Experiment on Influencing Factors of Cutting Force of Blades of Trim Tool for Longan Branch. Trans. Chin. Soc. Agric. Eng. 2012, 28, 8–14. [Google Scholar]
- GB/T 1927.4-2021; Test Methods for Physical and Mechanical Properties of Small Clear Wood Specimens—Part 4 Determination of Moisture Content. National Forestry and Grassland Administration: Beijing, China, 2021.
- Liu, W.; Liu, T.; Zeng, T.; Ma, R.; Cheng, Y.; Zheng, Y.; Qiu, J.; Qi, L. Prediction of Internal Mechanical Damage in Pineapple Compression Using Finite Element Method Based on Hooke’s and Hertz’s Laws. Sci. Hortic. 2023, 308, 111592. [Google Scholar] [CrossRef]
- Liu, Z.; Wang, T.; Liu, S.; Yan, X.; Zhao, H.; Wu, X.; Zhang, S. Design and Experimental Study of a Bionic Blade for Harvesting the Wild Chrysanthemum Stem. Agriculture 2023, 13, 190. [Google Scholar] [CrossRef]
- Aydın, İ.; Arslan, S. Mechanical Properties of Cotton Shoots for Topping. Ind. Crops Prod. 2018, 112, 396–401. [Google Scholar] [CrossRef]
- Liang, R.; Zhang, B.; Zhou, P.; Li, Y.; Meng, H.; Kan, Z. Cotton Length Distribution Characteristics in the Shredded Mixture of Mechanically Recovered Residual Films and Impurities. Ind. Crops Prod. 2022, 182, 114917. [Google Scholar] [CrossRef]
- Qiu, M.; Meng, Y.; Li, Y.; Shen, X. Sugarcane Stem Cut Quality Investigated by Finite Element Simulation and Experiment. Biosyst. Eng. 2021, 206, 135–149. [Google Scholar] [CrossRef]
- Chen, J.N.; Chen, L.Q.; Yu, C.N.; Cai, S.L.; Xia, X.D. Study on Blade Parameter Optimization Analysis of Broccoli Cuts Based on Minimum Slice Stress. Trans. CSAE 2018, 34, 42–48. [Google Scholar]
- Vu, V.-D.; Ngo, Q.-H.; Nguyen, T.-T.; Nguyen, H.-C.; Nguyen, Q.-T.; Nguyen, V.-D. Multi-Objective Optimisation of Cutting Force and Cutting Power in Chopping Agricultural Residues. Biosyst. Eng. 2020, 191, 107–115. [Google Scholar] [CrossRef]
- Zhao, L.; Zhou, H.; Xu, L.; Song, S.; Zhang, C.; Yu, Q. Parameter Calibration of Coconut Bran Substrate Simulation Model Based on Discrete Element and Response Surface Methodology. Powder Technol. 2022, 395, 183–194. [Google Scholar] [CrossRef]
- Wu, T.; Kong, F.; Shi, L.; Xie, Q.; Sun, Y.; Chen, C. Power Consumption Influence Test of Castor Disc-Cutting Device. Agriculture 2022, 12, 1535. [Google Scholar] [CrossRef]
- Yu, Z.; Yang, K.; Hu, Z.; Peng, B.; Gu, F.; Yang, L.; Yang, M. Parameter Optimization and Simulation Analysis of Floating Root Cutting Mechanism for Garlic Harvester. Comput. Electron. Agric. 2023, 204, 107521. [Google Scholar] [CrossRef]


Disclaimer/Publisher’s Note: The statements, opinions and data contained in all publications are solely those of the individual author(s) and contributor(s) and not of MDPI and/or the editor(s). MDPI and/or the editor(s) disclaim responsibility for any injury to people or property resulting from any ideas, methods, instructions or products referred to in the content. |
© 2024 by the authors. Licensee MDPI, Basel, Switzerland. This article is an open access article distributed under the terms and conditions of the Creative Commons Attribution (CC BY) license (https://creativecommons.org/licenses/by/4.0/).