Article

Multi-Omics Analyses Unravel Genetic Relationship of Chinese Coffee Germplasm Resources

College of Tropical Crops, Yunnan Agricultural University, Pu’er 665099, China
*
Authors to whom correspondence should be addressed.
Forests 2024, 15(1), 163; https://doi.org/10.3390/f15010163
Submission received: 16 November 2023 / Revised: 28 December 2023 / Accepted: 10 January 2024 / Published: 12 January 2024
(This article belongs to the Special Issue Application of Biotechnology Techniques on Tree Species—Series II)

Abstract

:
The genetic relationships between Coffea arabica resources were analyzed via specific length amplified fragment sequencing (SLAF-seq) and transcriptome sequencing to provide the theoretical basis for breeding new varieties. Twenty C. arabica accessions were used to analyze genetic diversity on the basis of SNPs identified in SLAFs and the transcriptome data. For the SLAF-seq analysis of 20 C. arabica accessions, two Coffea canephora accessions, one Coffea liberica accession, and one Coffea racemosa accession, the number of reads ranged from 2,665,424 to 7,210,310, with a GC content of 38.49%–40.91% and a Q30 value of 94.99%–96.36%. A total of 3,347,069 SLAF tags were obtained, with an average sequencing depth of 13.90×. Moreover, the 1,048,575 SNPs identified in the polymorphic SLAFs were filtered, then the remaining 198,955 SNPs were used to construct a phylogenetic tree, perform a principal component analysis, and characterize the population structure. For the transcriptome analysis, 128.50 Gb clean reads were generated for the 20 C. arabica accessions, with a GC content of 44.36%–51.09% and a Q30 value of 94.55%–95.40%. Furthermore, 25,872 genes’ expression levels were used for the correlation analysis. The phylogenetic relationships as well as the results of the principal component analysis, population structure analysis, and correlation analysis clearly distinguished C. arabica Typica-type accessions from the C. arabica Bourbon-type accessions. Notably, several C. arabica local selections with unknown genetic backgrounds were classified according to all four clustering results.

1. Introduction

Coffee (Coffea spp.), one of the most economically valuable perennial crops, is widely cultivated in over 80 countries in tropical and subtropical regions [1,2]. In terms of the global economy, it is the second-largest agricultural commodity [3]. Currently, millions of households worldwide rely on coffee for their subsistence or livelihood [4]. Coffee offers economic benefits at every step of the value chain, and the global coffee industry contributes to the multi-billion-dollar economies of coffee importing and exporting [5]. The genus Coffea comprises almost 124 species, including C. arabica, C. congensis, C. canephora, C. eugenioides, C. liberica, C. klainii, C. oyemensis, C. abeokutae, C. dewevrei, and C. racemosa. However, only these ten species are cultivated and have commercial value [6]. The main cultivated species are C. arabica and C. canephora, which are present in 60% and 40% of globally traded coffee, respectively [7].
Coffee was introduced to China more than a century ago [8]. In 1904, French Catholic missionaries introduced C. arabica from Vietnam to Dali city in Yunnan province, considered to be the birthplace of coffee in China [8]. There are currently numerous large-scale coffee plantations in Yunnan and Hainan provinces, with Yunnan province accounting for 99% of the C. arabica planting area and output in China [9]. Many C. arabica germplasm resources collected from major coffee-producing countries are preserved in Yunnan and Hainan provinces [8]. Compared with C. canephora, C. arabica has been cultivated more extensively in the hilly areas in the tropical and subtropical regions of Yunnan province [9].
Molecular techniques are frequently employed to precisely identify and assess the genetic diversity of coffee germplasm resources useful for plant breeders and coffee producers [10]. Several studies on the genetic diversity of coffee germplasm resources involved analyses of simple sequence repeats (SSRs) [11,12,13], sequence-related amplified polymorphisms (SRAPs) [14], amplified fragment length polymorphisms (AFLPs) [15], random amplified polymorphic DNA fingerprinting (RAPD) [16], and single nucleotide polymorphisms (SNPs) using multiple next-generation sequencing technologies, including Diversity Array Technology™ [17,18], genotyping-by-sequencing [10,19], and whole genome resequencing [20]. Specific length amplified fragment sequencing (SLAF-seq) is a high-throughput sequencing technology commonly used to assess the genetic diversity of many plants, including avocado [21], Ulmus parvifolia [22], Panicum miliaceum [23], and Miscanthus species [24]. Moreover, analysis of genetic variability within transcriptomes using single nucleotide polymorphisms (SNPs) has the potential to resolve phylogenies and evolutionary history [21,25].
Several studies have been conducted worldwide to accurately identify coffee germplasm resources in regions with high genetic diversity [5,16,17,18,19,20,21,22,23,24,25,26,27,28]. However, the genetic backgrounds and relationships of C. arabica germplasm resources in China remain relatively undetermined. The current study examined the genetic diversity of a set of C. arabica accessions, focusing on those grown in the Yunnan region of the Yunnan–Guizhou plateau, the largest C. arabica planting and export base in China. Specifically, the SLAF-seq technique was adopted to analyze SNPs and a transcriptome sequencing analysis was performed to examine differential gene expression.

2. Materials and Methods

2.1. Sample Collection, DNA Extraction, and RNA Extraction

For the SLAF-seq analysis, 24 Coffea accessions were collected from the College of Tropical Crops, Yunnan Agricultural University (Pu’er, Yunnan province, China: latitude—23°06′ N, longitude—101°27′ E, and altitude—1470 m above sea level) (Table 1). The collected samples included 20 C. arabica accessions as well as two C. canephora accessions, one C. liberica accession, and one C. racemosa accession (i.e., outgroup). Fresh leaves, flowers, stems, roots, and fruits were collected at the same time from the C. arabica plants and then immediately frozen in liquid nitrogen before being stored at −80 °C, because the flowers of small coffee are gradually opened, so its flowers and fruits could exist at the same time. Genomic DNA from five tissues mixed together was extracted using CTAB, as described by Ge et al. [29].
The 20 C. arabica accessions included in the SLAF-seq analysis were also used for the transcriptome analysis (Table 1). Five tissues were also collected at the same time from the C. arabica plants and then immediately frozen in liquid nitrogen before being stored at −80 °C. Total RNA was extracted from the frozen materials using the Plant RNA Kit (OMEGA Bio-Tek, Norcross, GA, USA) and then combined. The purity, concentration, and integrity of the total RNA were determined using the NanoDrop 2000 spectrophotometer (Thermo Fisher Scientific Inc., Waltham, MA, USA) and the Agilent 2100/LabChip GX systems (Agilent Technology (China) Co. Ltd., Shanghai, China).

2.2. SLAF-seq and SNP Analyses

The genome of the C. arabica Caturra variety (GenBank assembly accession—GCA_003713225.1) was selected as the reference genome. The SLAF-predict software v1.0 (Beijing Biomarker Biotechnology Co., Ltd., Beijing, China) was used to predict endonuclease digestion sites in the reference genome. The optimal endonuclease digestion scheme was selected for the digestion of the genomic DNA extracted from each sample. The 3′ end of the resulting genomic fragments (SLAF tags) were modified by the addition of A, after which the fragments were ligated to the dual-index sequencing adapters [30], amplified by PCR, purified, and mixed. Finally, the high-quality library was sequenced. After removing the sequencing adapters from the reads, the sequencing quality was evaluated, and the data were analyzed. SNP markers were developed using the C. arabica genome as a reference sequence. Briefly, a Burrows–Wheeler Aligner was used to compare the sequencing reads to the reference genome sequence [31]. Meanwhile, Samtools v1.9 and GATK v3.8 were used to develop SNP markers [32,33]. The SNP markers identified by both programs were included in the reliable SNP marker dataset (1,048,575 SNPs). Finally, the high-quality SNPs (completeness > 0.5 and MAF > 0.05) were retained for the subsequent analysis (198,955 SNPs).

2.3. Transcriptome Sequencing

The mRNA in the extracted RNA was enriched using Oligo-(dT) magnetic beads and then fragmented randomly in fragmentation buffer. The mRNA served as the template for the synthesis of the first and second cDNA strands. The double-stranded cDNA was purified and then end-repaired, A-tailed, and ligated to sequencing adapters, after which a fragment size selection step was completed using AMPure XP beads. Finally, a PCR amplification was performed to complete the construction of the cDNA library. The Qubit 3.0 fluorometer was used for the preliminary quantification of the cDNA library to ensure the concentration exceeded 1 ng/µL. The inserted fragments in the library were detected using the Qsep400 high-throughput analysis system. After the inserted fragments satisfied certain criteria, the effective concentration of the library (>2 nM) was determined via qPCR to verify its suitability for sequencing. Finally, the library was sequenced using the Illumina NovaSeq 6000 sequencing platform (PE150 mode), which produced large amounts of raw data that were filtered to eliminate reads containing adapters and low-quality reads. The Q30 value and GC content of the clean data were calculated. The clean reads were mapped to the C. arabica reference genome (GenBank assembly accession—GCA_003713225.1) using HISAT2. StringTie was used to assemble the reads and reconstruct the transcriptome for the following analysis [34,35]. The maximum traffic algorithm was applied using StringTie and the fragments per kilobase of transcript per million fragments mapped (FPKM) value was used to standardize gene expression levels. A total of 25,872 expressed genes were analyzed. The transcriptome data for the 20 C. arabica accessions were deposited into the GenBank database (accession number—PRJNA1015032).

2.4. Data Analysis

The 198,955 high-quality SNPs obtained after the SLAF-seq analysis were used to construct a phylogenetic tree for the 24 Coffea accessions according to the neighbor-joining method of the MEGA X software v.10.0.5 (1000 bootstrap replicates). The same SNPs were used for the analysis of the population structure of the 20 C. arabica accessions, which was completed using STRUCTURE v2.3.4 [36], and for the principal component analysis (PCA) of the 20 C. arabica accessions, which was conducted using EIGENSOFT v6.0.1 [37]. Furthermore, a Pearson correlation analysis was completed to assess the correlations between samples according to the expression levels of 25,872 genes.

3. Results

3.1. SLAF Sequence

The SLAF-predict software revealed RsaI and HinCII as a suitable restriction endonuclease combination. After the double-digestion, the fragments that were 314–364 bp long were defined as SLAF tags. The average number of reads for the sequenced samples was 5,299,397, the average Q30 value was 95.90%, and the average GC content was 39.46% (Table 2). A total of 3,374,069 SLAF tags were detected for the 24 Coffea accessions, with an average of 139,461 SLAF tags per sample. The mean sequencing depth for the 24 samples was 13.90× (Table 2). Moreover, the 1,048,575 SNPs detected in the polymorphic SLAFs were filtered, after which 198,955 high-quality SNPs remained. The number of SNP markers per sample ranged from 381,105 to 903,823, the integrity of these SNP markers ranged from 32.12%–76.18%, and the heterozygosity rate ranged from 6.83%–17.49%. C. arabica is allotetraploid (2n = 4x = EECC = 44), with two parents, C. eugenioides (2n = 2x = EE = 22) and C. canephora (2n = 2x = CC = 22). The distribution map of SNP on chromosomes is drawn according to the distribution of SNP on chromosomes. The results showed that SLAF tags are evenly distributed throughout the genome (Figure S1A). The results also showed that the distribution of C. arabica SNP has a certain regional concentration, mainly concentrated in the 1c-11c set of one of the parents of C. canephora genome (Figure S1B). Details regarding the 198,955 SNPs identified using the SLAF-seq data for the 20 C. arabica accessions, two C. canephora accessions, one C. liberica accession, and one C. racemosa accession are provided in Table S1.

3.2. Transcriptome Sequence Assembly

After filtering the transcriptome sequencing data, 128.50 Gb clean reads remained. The GC content ranged from 44.36%–51.09% (mean: 45.26%) for the 20 C. arabica accessions (Table 3). The Q30 value ranged from 94.55%–95.40% (mean: 95.03%) (Table 3). Information regarding the expression levels of 25,872 genes in the 20 C. arabica accessions is provided in Table S2.

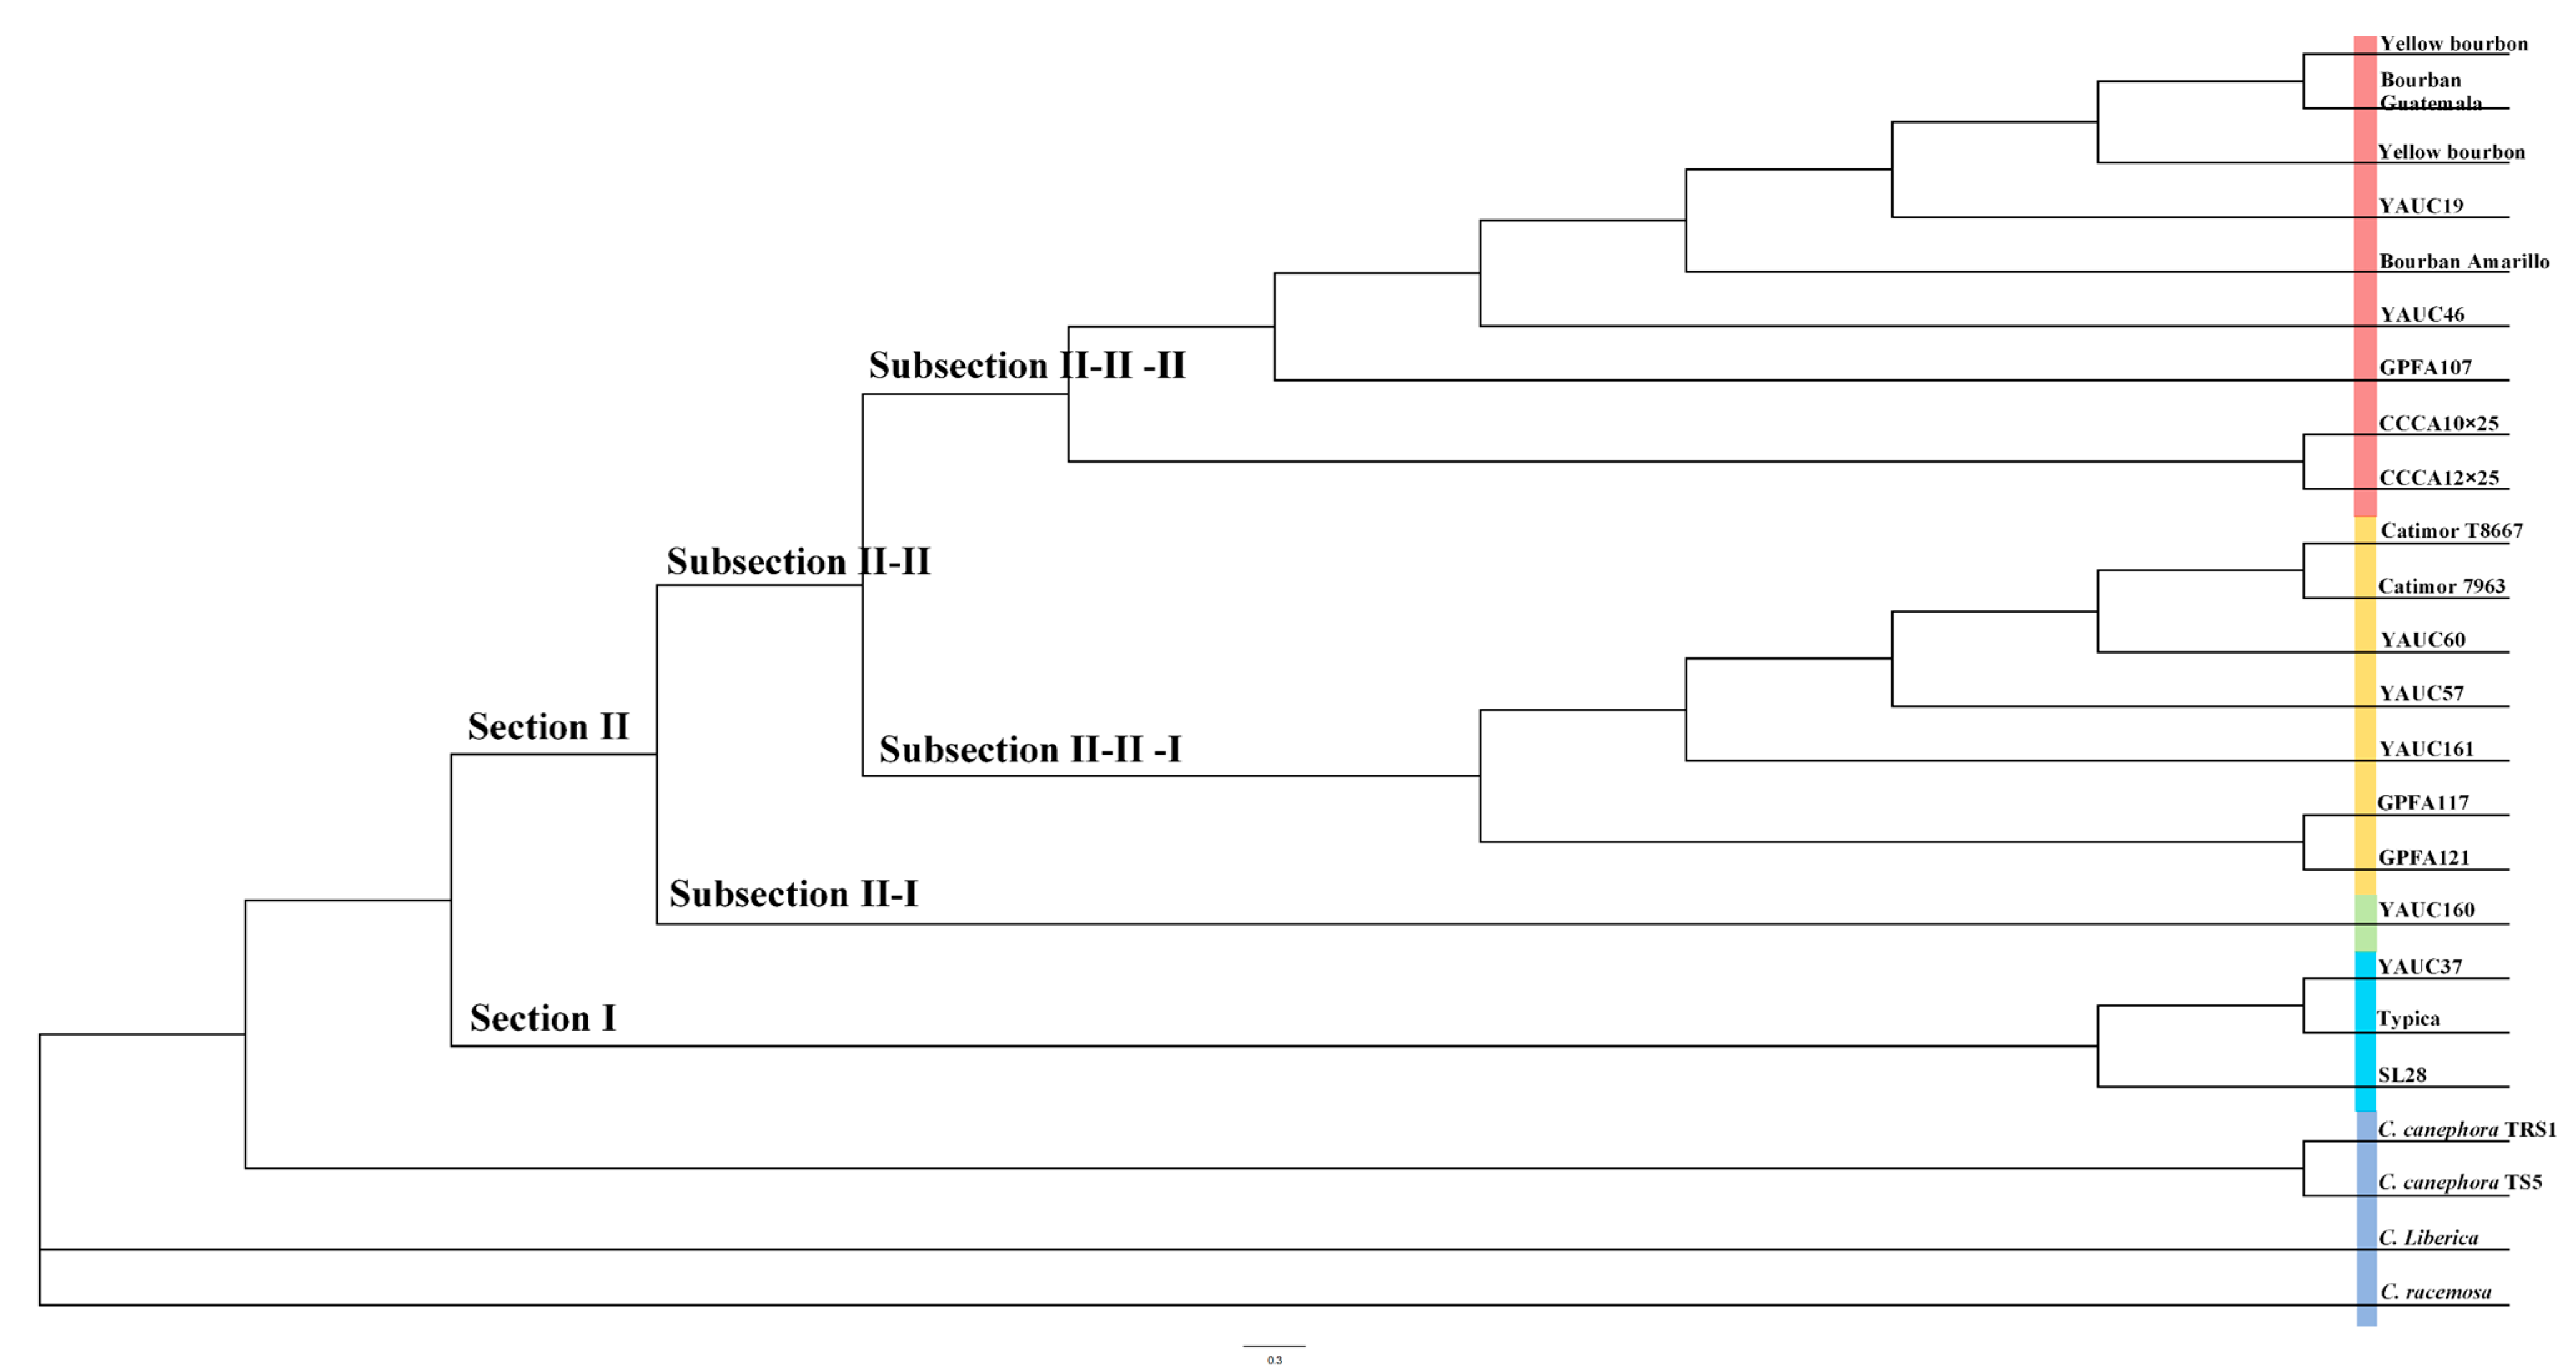
3.3. Phylogenetic Analysis

A phylogenetic tree containing 20 C. arabica accessions was constructed using the neighbor-joining algorithm in MEGA X, with two C. canephora accessions, one C. liberica accession, and one C. racemosa accession serving as the outgroup. The cluster analysis revealed two C. arabica sections (Figure 1), with three accessions in section I and 17 accessions in section II. Section I consisted of two commercial cultivars (SL28 and Typica) and one local selection (YAUC37). Of the two commercial cultivars, Typica is a well-known C. arabica Typica-type variety. Section II, which comprised 11 commercial cultivars and six local selections, was separated into subsections. Subsection II-I included one local selection (YAUC160), whereas Subsection II-II contained 11 commercial cultivars and five local selections. Furthermore, Subsection II-II was divided into two subsections, with Subsection II-II-I consisting of four commercial cultivars and three local selections. Two of the commercial cultivars (Catimor T8667 and Catimor 7963) produce high yields and are resistant to rust, which may help to explain why they are commonly cultivated worldwide. The other two commercial cultivars (GPFA117 and GPFA121) were imported to Yunnan, China by Nestle (Tours, France). Subsection II-II-II comprised seven commercial cultivars and two local selections. Of the seven commercial cultivars, Bourbon Guatemala and Bourbon Amarillo are well-known C. arabica Bourbon-type varieties, whereas two Yellow Bourbon commercial cultivars are well-known C. arabica Bourbon-type hybrids. The remaining three commercial cultivars (GPFA107, CCCA10×25, and CCCA12×25) were also introduced to Yunnan, China by Nestle.

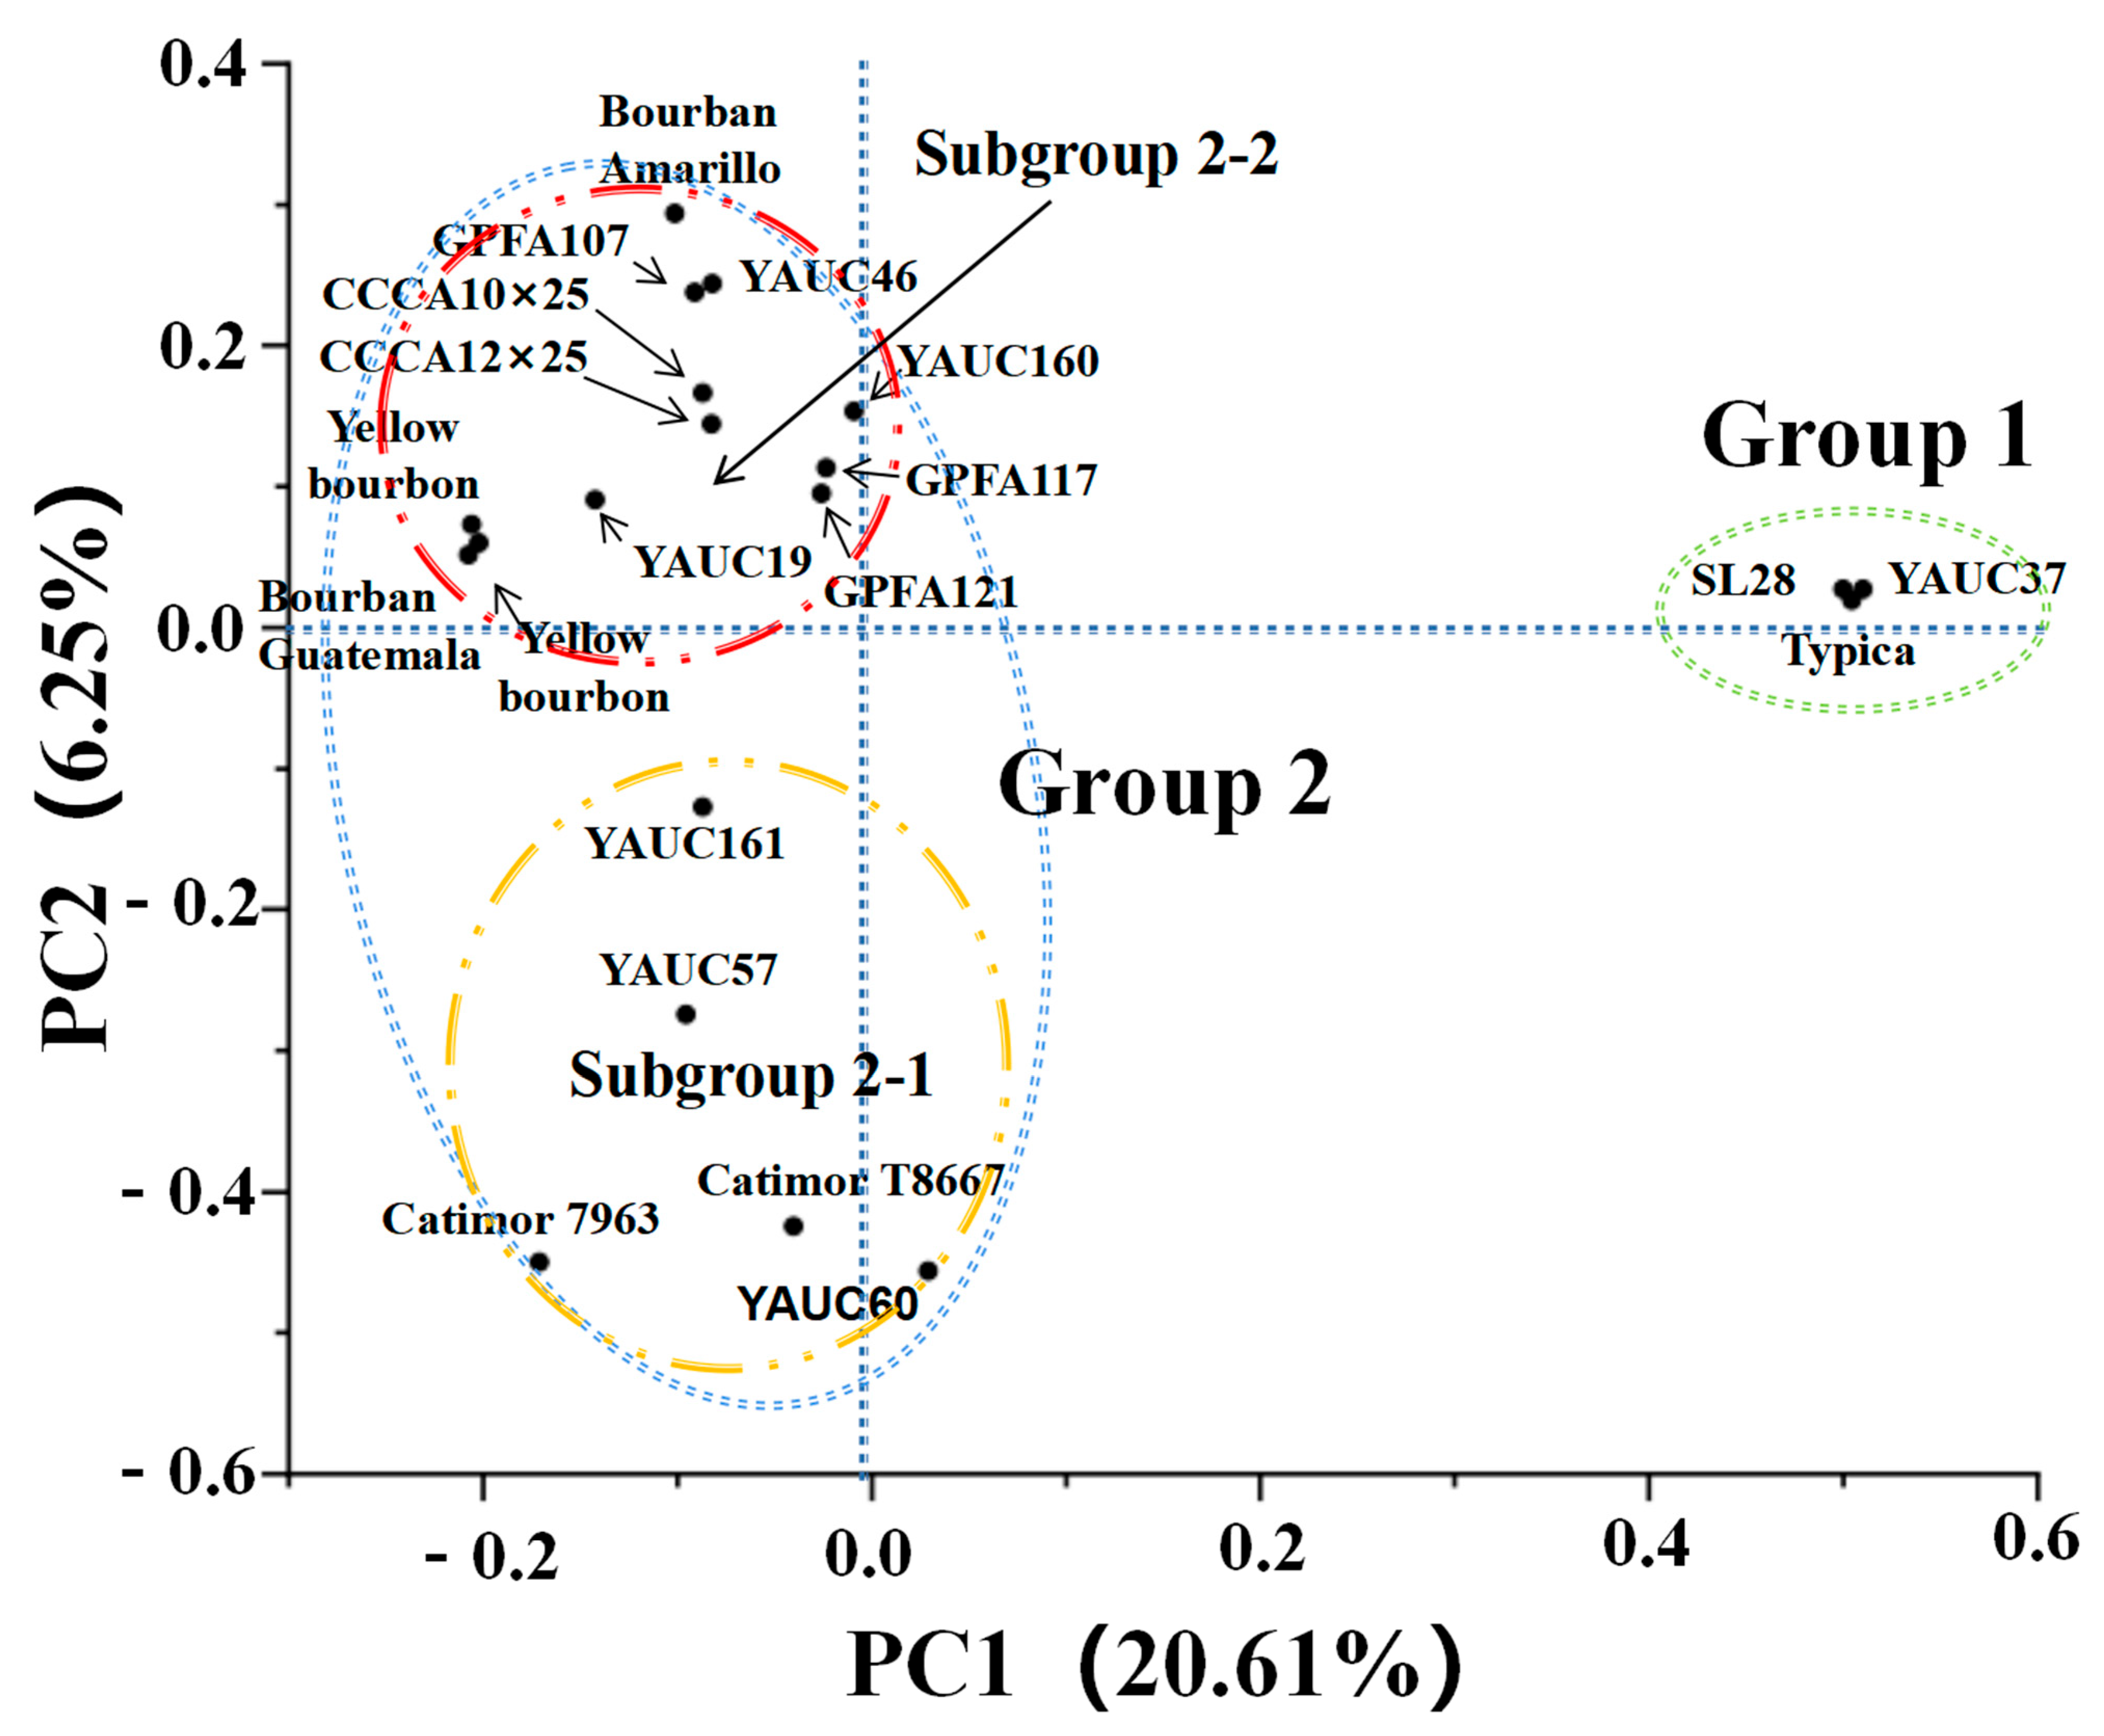
3.4. Principal Component Analysis

A PCA was performed to verify the clustering of the 20 C. arabica accessions (Figure 2). Principal components 1 and 2 (i.e., PC1 and PC2) explained approximately 26.86% of the total variation (20.61% and 6.25%, respectively). In addition, PC1 clearly distinguished the accessions in Group 1 from the other accessions. Moreover, PC2 separated Subgroup 2-1 from Subgroup 2-2. The clustering of some accessions in Group 1 and Subgroup 2-2 reflected the relatively close genetic relationships between the germplasm resources. In contrast, the five accessions in Subgroup 2-1 were scattered in the PCA plot, indicative of relatively distant genetic relationships among the various germplasm resources.

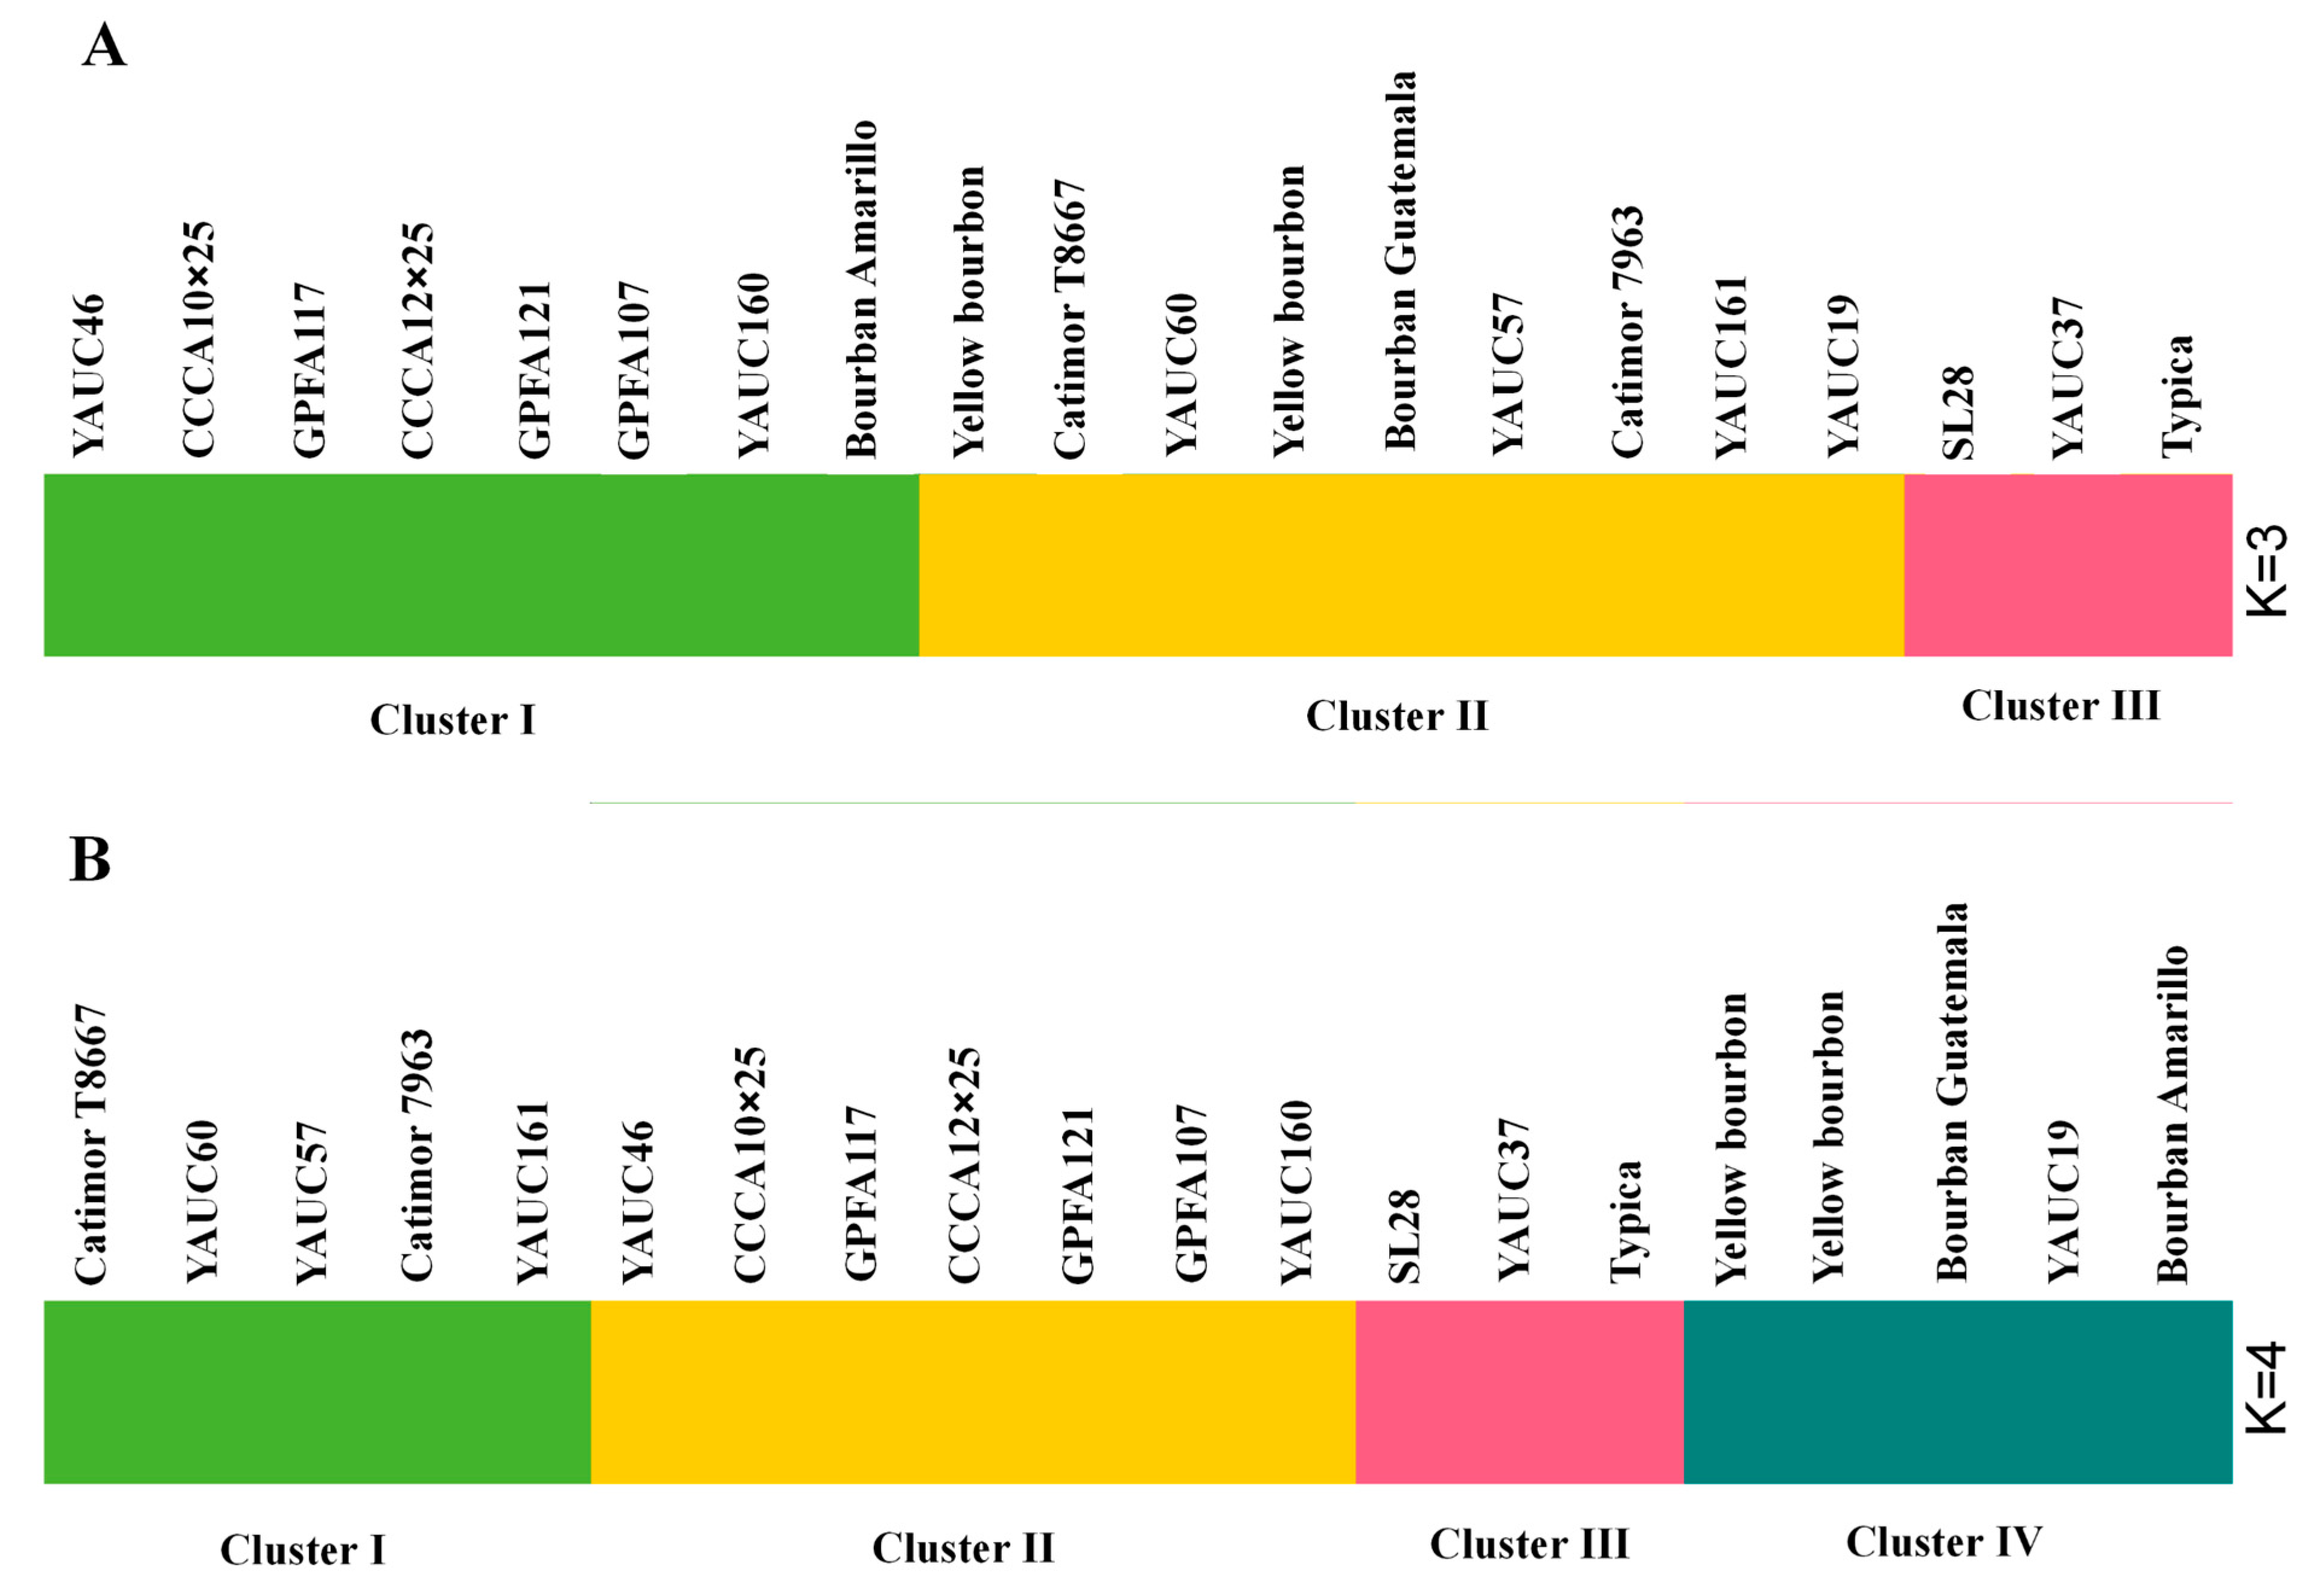
3.5. Genetic Structure Analysis

In the model-based analysis of the 20 C. arabica accessions (Figure 3), STRUCTURE revealed that the optimal number of groups (K) was three (Figure S2). The model with K = 3 grouped SL28, Typica, and YAUC37 into Cluster III. In addition, Cluster I was composed of two local selections and six commercial cultivars, including Bourbon-2 and five commercial cultivars bred by Nestle. Cluster II, which consisted of five commercial cultivars and four local selections, included Bourbon Guatemala, two Yellow Bourbon commercial cultivars, Catimor T8667, and Catimor 7963. For the model with K = 4, SL28, Typica, and YAUC37 were still clustered in Cluster III. Catimor T8667 and Catimor 7963 and three local selections were classified in Cluster I, whereas five commercial cultivars bred by Nestle and two local selections were grouped in Cluster II. Cluster IV included Bourbon Guatemala, Bourbon Amarillo, two Yellow Bourbon commercial cultivars, and one local selection.

3.6. Correlation Analysis Using Transcriptome Data

The correlation analysis indicated that the 20 C. arabica accessions were clustered in two clades (Figure 4). Three accessions (SL28, Typica, and YAUC37) belonged to clade I and 17 accessions were included in clade II. There were strong positive correlations among SL28, Typica, and YAUC37 (r = 0.892–0.9089) (Table S3). Clade II was clearly separated into subclades. Two commercial cultivars (GPFA117 and GPFA121) in Subclade II-I were imported to Yunnan, China by Nestle. There was a strong positive correlation between these two commercial cultivars (r = 0.9362). Subclade II-II contained the remaining 15 C. arabica accessions. The Bourbon Guatemala, Bourbon Amarillo, two Yellow Bourbon commercial cultivars, Catimor T8667, and Catimor 7963, were clustered in Subclade II-II. The correlation coefficients for the 20 C. arabica accessions (based on gene expression levels determined by the transcriptome analysis) are listed in Table S3.

4. Discussion

In this study, SNPs developed on the basis of SLAF-seq data were used to clarify phylogenetic relationships, determine the population structure, and perform a PCA of coffee germplasm resources. Moreover, transcriptome data were used to examine the correlations between coffee germplasm resources. The four classification results were highly consistent. First, three C. arabica accessions (SL28, Typica, and YAUC37) were always grouped. There is some controversy regarding the genetic background of the SL C. arabica accessions. More specifically, depending on the study, these accessions have been identified as either Typica-type or Bourbon-type varieties [17,38]. According to the current study’s clustering results, SL28 is a Typica-type variety. Meanwhile, one of the local selections (YAUC37) was grouped with Typica and SL28, implying that its genetic background is consistent with that of Typica-type varieties. Moreover, the phylogenetic tree, the PCA’s results, and correlation analysis also indicated that nine C. arabica accessions belong to the same group, including Bourbon Guatemala and Bourbon Amarillo (C. arabica Bourbon-type varieties), two Yellow Bourbon commercial cultivars (C. arabica Bourbon-type hybrids) [5,26,38], CCCA10×25, CCCA12×25, GPFA107, YAUC19, and YAUC46. Two local selections (YAUC19 and YAUC46) and three commercial cultivars (CCCA10×25, CCCA12×25, and GPFA107), which were imported to Yunnan, China by Nestle, were clustered with the Bourbon-type varieties according to three classification results. Hence, the genetic backgrounds of YAUC19, YAUC46, CCCA10×25, CCCA12×25, and GPFA107 are likely similar to the Bourbon-type genetic background.
According to the phylogenetic tree, PCA, population structure (K = 3), and correlation analysis, Catimor-type varieties were preliminarily grouped with Bourbon-type varieties because one of their parents is the Bourbon-type mutant Caturra. Still, the classification based on the phylogenetic tree, PCA, population structure (K = 4), and correlation analysis clearly distinguished Catimor-type varieties from Bourbon-type varieties because they include some C. canephora genes derived from their other parent (Timor). Three local selections (YAUC57, YAUC60, and YAUC161) were grouped with Catimor T8667 and Catimor 7963 following the examination of phylogenetic relationships as well as the PCA, population structure analysis (K = 4), and correlation analysis. Thus, the genetic backgrounds of YAUC57, YAUC60, and YAUC161 are probably similar to those of Catimor-type varieties.
There were some inconsistencies in the classification of the other C. arabica resources and the two commercial cultivars (GPFA117 and GPFA121) imported to Yunnan, China by Nestle. Subsection II-II-I, based on the phylogenetic tree, suggested GPFA117, GPFA121, and Catimor-type varieties belong to the same subsection, which does not include Bourbon-type varieties, although the preliminary classification according to the phylogenetic tree, PCA, population structure (K = 3), and correlation analysis indicated that GPFA117 and GPFA121 should be clustered with Bourbon-type varieties. In contrast, the results of the PCA and population structure analysis indicated that GPFA117 and GPFA121 should be grouped with Bourbon-type varieties rather than with Catimor-type varieties. Moreover, according to the correlation analysis, GPFA117 and GPFA121 form an independent clade. Therefore, it is speculated that the genetic backgrounds of GPFA117 and GPFA121 are closer to the Bourbon-type genetic background than that of the Typica-type. However, seven other C. arabica accessions, including two Yellow Bourbon commercial cultivars, YAUC19, and YAUC46, are more closely related to Bourbon than GPFA117 and GPFA121.
The phylogenetic tree revealed that among the analyzed C. arabica accessions, the Typica-type varieties were most closely related to the outgroup, suggesting that they are the most primitive C. arabica germplasm resources in the phylogenetic tree. Moreover, they may have differentiated to form the C. arabica Bourbon-type varieties. In other words, the C. arabica Typica-type resources originated before the C. arabica Bourbon-type resources. The results of this study are in accordance with those of previous studies. More specifically, earlier research indicated that Typica was the first C. arabica material to be domesticated and widely cultivated, after which Bourbon was derived as a Typica mutant and domesticated by humans for use [38,39].
SNP markers have been increasingly developed and used for coffee germplasm management, because they are amendable to high throughput systems, have universal data comparability and low genotyping cost [5,40,41,42]. The 198,955 SNPs derived from the SLAF-seq have been opened to the public and were used in the current study for 20 C. arabica accessions, which included several varieties widely cultivated in the world and Chinese local selections. These SNPs could help relevant people in the coffee industry to better identify and protect different varieties of C. arabica beans and provide accurate reference materials for coffee appraisers. Coffee suppliers and research institutions could use the database for low-cost, high-quality genotyping for breeding and seed quality control, and seed suppliers and nurseries could provide coffee farmers with a sufficient number of genetically pure and healthy seedlings, which will increase farmers’ access to improved, adaptable varieties, thereby increasing yields and profits. Recently, Zhang et al. [5] reported the application of Nano-Fluidic Array genotyping for C. arabica. This study, therefore, provided ample candidate SNPs for selecting a core set of SNP markers for array-based genotyping of C. arabica. Additionally, SNP analysis could be conducted without the need for DNA size separation so that it can be automated in high-throughput analysis formats. The genotyping profiles of SNPs can be compared in different laboratories and genotyping platforms. These advantages have led to the increased use of SNPs as a selective marker for accurate genotyping of tropical perennials, most recently in Theobroma cacao [43], Citrus maxima [44], Camellia sinensis [45], Dimocarpus longan [46], and (Litchi chinensis) [47].
On the basis of the experimental results stated above, the genetic background of six C. arabica local selections and three C. arabica varieties imported to Yunnan, China by Nestle were preliminary identified in the current study and, to be specific, one accession (YAUC37), five accessions (YAUC19, YAUC46, CCCA10×25, CCCA12×25, and GPFA107), and three accessions (YAUC57, YAUC60, and YAUC161) were likely similar to the Typica-type, Bourbon-type or Catimor-type genetic background, respectively. At many C. arabica plantations in Yunnan province in China, the local selections and other commercial cultivars have been quickly replaced by Catimor-types in view of their high yield and rust resistance, ultimately making it difficult to collect local C. arabica accessions. Moreover, the genetic background of C. arabica resources in China is becoming more and more narrow. Thus, defining the genetic background of C. arabica local selections and maximizing the economic benefits of cultivating specific C. arabica cultivars, while ensuring C. arabica genetic resources are conserved, will need to be addressed.

5. Conclusions

In this study, SNPs identified from an SLAF-seq analysis were used to construct a phylogenetic tree, elucidate the population structure, and conduct a PCA of coffee germplasm resources. Additionally, transcriptome data were analyzed to reveal correlations among coffee germplasm resources. The four preliminary classification results were consistent, with the samples mainly designated as C. arabica Typica-type accessions and C. arabica Bourbon-type accessions. A number of local selections with unknown genetic backgrounds were classified as specific C. arabica types according to our analyses. The characterization of the genetic backgrounds of these local selections and the systematic classification of these accessions may provide the basis for enhancing C. arabica germplasm resources. Furthermore, additional efforts to validate more SNP markers are underway in order to develop a high-quality genotyping panel of SNPs for cultivar identification and genetic diversity analysis in coffee. This information will have significant potential for practical application.

Supplementary Materials

The following supporting information can be downloaded at https://www.mdpi.com/article/10.3390/f15010163/s1, Table S1. Description of the 198,955 SNPs from SLAF-seq and the genotypes on of the 20 C. arabica accessions, two C. canephora accessions, one C. liberica accession, and one C. racemosa accession. Table S2. Description of the expression levels of 25 872 genes analyzed from transcriptome sequencing of the 20 C. arabica accessions. Table S3. Correlation coefficients among 20 C. arabica accessions based on expression levels of genes from transcriptome sequencing. Figure S1. Distribution of SLAF labels and SNP markers on reference genome chromosomes. Figure S2. Delta K values for different numbers of populations assumed in the STRUCTURE analysis.

Author Contributions

Conceptualization, Y.G. and X.L.; methodology, B.W. and X.S.; software, Z.Z.; validation, B.W., X.S. and H.D.; formal analysis, M.Q. and P.Q.; investigation, K.J.; data curation, Y.G.; writing—original draft preparation, Y.G.; writing—review and editing, Y.G.; project administration, Y.G. and X.L.; funding acquisition, Z.C. All authors have read and agreed to the published version of the manuscript.

Funding

Yunnan Province innovation guidance and technology-based enterprise cultivation program rural revitalization science and technology project, Coffee Industry Science and Technology Mission, Hani and Yi Autonomous County, Ninger, Yunnan Province (No. 202304BI090006); Young Talents of “Xingdian Talent Support Program” of Yunnan Province (No. XDYC-QNRC-2022-0711); Basic Research Project of Yunnan Province (No. 202301AT070493); Key R&D Plan of Yunnan Province, Yunnan International Joint R&D Center for Green Development of Coffee Industry (No. 202303AP140010); Yunnan Provincial Expert Basic Scientific Research Station (No. 2021RYZJGZZ002); Fund of Education Department of Yunnan Province (No. 2023Y0915); Start-up Fund for High-level Talents of Yunnan Agricultural University (No. 2022RYKY001).

Data Availability Statement

Data are contained within the article and Supplementary Material.

Acknowledgments

We thank Yajima for editing the English text of a draft of this manuscript.

Conflicts of Interest

The authors declare no conflicts of interest.

References

  1. Denoeud, F.; Carretero-Paulet, L.; Dereeper, A.; Droc, G.; Guyot, R.; Pietrella, M.; Zheng, C.; Alberti, A.; Anthony, F.; Aprea, G.; et al. The coffee genome provides insight into the convergent evolution of caffeine biosynthesis. Science 2014, 345, 1181–1184. [Google Scholar] [CrossRef]
  2. DaMatta, F.M.; Rahn, E.; Läderach, P.; Ghini, R.; Ramalho, J.C. Why could the coffee crop endure climate change and global warming to a greater extent than previously estimated? Clim. Chang. 2019, 152, 167–178. [Google Scholar] [CrossRef]
  3. International Coffee Organization. Coffee Statistics. Available online: http://www.ico.org/trade_statistics.asp (accessed on 10 October 2022).
  4. Tran, H.T.; Lee, L.S.; Furtado, A.; Smyth, H.; Henry, R.J. Advances in genomics for the improvement of quality in coffee. J. Sci. Food Agric. 2016, 96, 3300–3312. [Google Scholar] [CrossRef] [PubMed]
  5. Zhang, D.P.; Vega, F.E.; Solano, W.; Su, F.Y.; Infante, F.; Meinhardt, L.W. Selecting a core set of nuclear SNP markers for molecular characterization of Arabica cofee (Coffea arabica L.) genetic resources. Conserv. Genet. Resour. 2021, 13, 329–335. [Google Scholar] [CrossRef]
  6. Davis, A.P.; Tosh, J.; Ruch, N.; Fay, M.F. Growing coffee: Psilanthus (Rubiaceae) subsumed on the basis of molecular and morphological data; implications for the size, morphology, distribution and evolutionary history of Coffea. Bot. J. Linn. Soc. 2011, 167, 357–377. [Google Scholar] [CrossRef]
  7. International Coffee Organization (ICO). 2023. Available online: http://www.ico.org/prices/po-production.pdf (accessed on 18 August 2023).
  8. Wang, X.Y.; Zhou, H.; Chen, J.H.; Li, J.H.; Long, Y.Z.; Dong, Y.P. Genetic diversity of coffee germplasms by ISSR markers. Chin. J. Trop. Crops 2019, 40, 300–307. (In Chinese) [Google Scholar]
  9. Ge, Y.; Zhang, F.; Xie, C.; Qu, P.; Jiang, K.L.; Du, H.B.; Zhao, M.; Lu, Y.F.; Wang, B.T.; Shi, X.D.; et al. Effects of different altitudes on Coffea arabica rhizospheric soil chemical properties and soil microbiota. Agronomy 2023, 13, 471. [Google Scholar] [CrossRef]
  10. Depecker, J.; Verleysen, L.; Asimonyio, J.A.; Hatangi, Y.; Kambale, J.L.; Mwanga, I.M.; Ebele, T.; Dhed, B.; Bawin, Y.; Staelens, A.; et al. Genetic diversity and structure in wild Robusta coffee (Coffea canephora A. Froehner) populations in Yangambi (DR Congo) and their relation to forest disturbance. Heredity 2023, 130, 145–153. [Google Scholar] [CrossRef]
  11. Silva, B.S.R.D.; Santana, G.C.; Chaves, C.L.; Androcioli, L.G.; Ferreira, R.V.; Sera, G.H.; Charmetant, P.; Leroy, T.; Pot, D.; Domingues, D.S.; et al. Population structure and genetic relationships between Ethiopian and Brazilian Coffea arabica genotypes revealed by SSR markers. Genetica 2019, 147, 205–216. [Google Scholar] [CrossRef]
  12. Ogutu, C.; Fang, T.; Yan, L.; Wang, L.; Huang, L.F.; Wang, X.Y.; Ma, B.Q.; Deng, X.B.; Owiti, A.; Nyende, A.; et al. Characterization and utilization of microsatellites in the Coffea canephora genome to assess genetic association between wild species in Kenya and cultivated coffee. Tree Genet. Genomes 2016, 12, 54. [Google Scholar] [CrossRef]
  13. Montagnon, C.; Mahyoub, A.; Solano, W.; Sheibani, F. Unveiling a unique genetic diversity of cultivated Coffea arabica L. in its main domestication center: Yemen. Genet. Resour. Crop Evol. 2021, 68, 2411–2422. [Google Scholar] [CrossRef]
  14. Al-Ghamedi, K.; Alaraidh, I.; Afzal, M.; Mahdhi, M.; Al-Faifi, Z.; Oteef MD, Y.; Tounekti, T.; Alghamdi, S.S.; Khemira, H. Assessment of genetic diversity of local coffee populations in southwestern Saudi Arabia using SRAP markers. Agronomy 2023, 13, 302. [Google Scholar] [CrossRef]
  15. Steiger, D.; Nagai, C.; Moore, P.; Morden, C.; Osgood, R.; Ming, R. AFLP analysis of genetic diversity within and among Coffea arabica cultivars. Theor. Appl. Genet. 2002, 105, 209–215. [Google Scholar] [CrossRef] [PubMed]
  16. Anthony, F.; Bertrand, B.; Quiros, O.; Wilches, A.; Lashermes, P.; Berthaud, J.; Charrier, A. Genetic diversity of wild coffee (Coffea arabica L.) using molecular markers. Euphytica 2001, 118, 53–65. [Google Scholar] [CrossRef]
  17. Spinoso-Castillo, J.L.; Escamilla-Prado, E.; Aguilar-Rinco, V.H.; Ramos, V.M.; de los Santos, G.G.; Perez-Rodrıguez, P.; Corona-Torres, T. Genetic diversity of coffee (Coffea spp.) in Mexico evaluated by using DArTseq and SNP markers. Genet. Resour. Crop Evol. 2020, 67, 1795–1806. [Google Scholar] [CrossRef]
  18. Zaidan, I.R.; Ferreira1, A.; Noia, L.R.; Santos, J.G.; de Arruda, V.C.; do Couto, D.P.; Braz1, R.A.; de Brites Senra, J.F.; Partelli, F.L.; Azevedo, C.F.; et al. Diversity and structure of Coffea canephora from old seminal crops in Espírito Santo, Brazil: Genetic resources for cofee breeding. Tree Genet. Genomes 2023, 19, 19. [Google Scholar] [CrossRef]
  19. Carvalho, H.F.; Galli, G.; Ferrão, L.F.V.; Nonato, J.V.A.; Padilha, L.; Maluf, M.P.; de Resende, M.F.R., Jr.; Filho, O.G.; Fritsche-Neto, R. The effect of bienniality on genomic prediction of yield in arabica coffee. Euphytica 2020, 216, 101. [Google Scholar] [CrossRef]
  20. Mekbib, Y.; Tesfaye, K.; Dong, X.; Saina, J.K.; Hu, G.W.; Wang, Q.F. Whole-genome resequencing of Coffea arabica L. (Rubiaceae) genotypes identify SNP and unravels distinct groups showing a strong geographical pattern. BMC Plant Biol. 2022, 22, 69. [Google Scholar] [CrossRef]
  21. Ge, Y.; Zhang, T.; Wu, B.; Tan, L.; Ma, F.N.; Zou, M.H.; Chen, H.H.; Pei, J.L.; Liu, Y.Z.; Chen, Z.H.; et al. Genome-wide assessment of avocado germplasm determined from specific length amplified fragment sequencing and transcriptomes: Population structure, genetic diversity, identification, and application of race-specific markers. Genes 2019, 3, 215. [Google Scholar] [CrossRef]
  22. Lyu, Y.Z.; Dong, X.Y.; Huang, L.B.; Zheng, J.W.; He, X.D.; Sun, H.N.; Jiang, Z.P. SLAF-seq uncovers the genetic diversity and adaptation of Chinese elm (Ulmus parvifolia) in eastern China. Forests 2020, 11, 80. [Google Scholar] [CrossRef]
  23. Li, C.X.; Liu, M.X.; Sun, F.J.; Zhao, X.Y.; He, M.Y.; Li, T.S.; Lu, P.; Xu, Y. Genetic divergence and population structure in weedy and cultivated broomcorn millets (Panicum miliaceum L.) revealed by specific-locus amplified fragment sequencing (SLAF-Seq). Front. Plant Sci. 2021, 12, 688444. [Google Scholar] [CrossRef] [PubMed]
  24. Chen, Z.; He, Y.; Iqbal, Y.; Shi, Y.L.; Huang, H.M.; Yi, Z.L. Investigation of genetic relationships within three Miscanthus species using SNP markers identified with SLAF-seq. BMC Genom. 2022, 23, 43. [Google Scholar] [CrossRef]
  25. Iorizzo, M.; Senalik, D.A.; Grzebelus, D.; Bowman, M.; Cavagnaro, P.F.; Matvienko, M.; Ashrafi, H.; Deynze, A.V.; Simon, P.W. De novo assembly and characterization of the carrot transcriptome reveals novel genes, new markers, and genetic diversity. BMC Genom. 2011, 12, 389. [Google Scholar] [CrossRef] [PubMed]
  26. Lebot, V.; Melteras, M.; Pilecki, A.; Labouisse, J.-P. Chemometric evaluation of cocoa (Theobroma cacao L.) and coffee (Coffea spp.) germplasm using HPTLC. Genet. Resour. Crop Evol. 2020, 67, 895–911. [Google Scholar] [CrossRef]
  27. Nadaleti, D.H.S.; de RAbrahão, J.C.; Andrade, V.T.; Andrade, V.T.; Malta, M.R.; Botelho, C.E.; Carvalho, G.R. Sensory quality characterization and selection from a Coffea arabica germplasm collection in Brazil. Euphytica 2022, 218, 35. [Google Scholar] [CrossRef]
  28. Kozich, J.J.; Westcott, S.L.; Baxter, N.T.; Highlander, S.K.; Schloss, P.D. Development of a dual-index sequencing strategy and curation pipeline for analyzing amplicon sequence data on the MiSeqIllumina sequencing platform. Appl. Environ. Microbiol. 2013, 79, 5112–5120. [Google Scholar] [CrossRef]
  29. Ge, Y.; Ramchiary, N.; Wang, T.; Liang, C.; Wang, N.; Wang, Z.; Choi, S.R.; Lim, Y.P.; Piao, Z.Y. Development and linkage mapping of unigene-derived microsatellite markers in Brassica rapa L. Breed. Sci. 2011, 61, 160–167. [Google Scholar] [CrossRef]
  30. Li, H.; Durbin, R. Fast and accurate short read alignment with Burrows–Wheeler transform. Bioinformatics 2009, 25, 1754–1760. [Google Scholar] [CrossRef]
  31. Li, H.; Handsaker, B.; Wysoker, A.; Fennell, T.; Ruan, J.; Homer, N.; Marth, G.; Abecasis, G.; Durbin, R. The sequence alignment/map format and SAMtools. Bioinformatics 2009, 25, 2078–2079. [Google Scholar] [CrossRef]
  32. McKenna, A.; Hanna, M.; Banks, E.; Sivachenko, A.; Cibulskis, K.; Kernysky, A.; Garimella, K.; Altshuler, D.; Gabriel, S.; Daly, M.; et al. The Genome Analysis Toolkit: A MapReduce framework for analyzing next-generation DNA sequencing data. Genome Res. 2010, 2, 1297–1303. [Google Scholar] [CrossRef]
  33. Kim, D.; Langmead, B.; Salzberg, S.L. HISAT: A fast spliced aligner with low memory requirements. Nat. Methods 2015, 12, 357–360. [Google Scholar] [CrossRef]
  34. Pertea, M.; Pertea, G.M.; Antonescu, C.M.; Chang, T.C.; Mendell, J.T.; Salzberg, S.L. StringTie enables improved reconstruction of a transcriptome from RNA-seq reads. Nat. Biotechnol. 2015, 33, 290–295. [Google Scholar] [CrossRef] [PubMed]
  35. Trapnell, C.; Williams, B.A.; Pertea, G.; Mortazavi, A.; Mortazavi, A.; Kwan, G.; Baren, M.J.; Salzberg, S.L.; Wold, B.J.; Pachter, L. Transcript assembly and quantification by RNA Seq reveals unannotated transcripts and isoform switching during cell differentiation. Nat. Biotechnol. 2010, 28, 511–515. [Google Scholar] [CrossRef]
  36. Pritchard, J.K.; Stephens, M.; Donnelly, P. We checked. There’s no problem. Inference of population structure using multilocus genotype data. Genetics 2000, 155, 945–959. [Google Scholar] [CrossRef]
  37. Price, A.L.; Patterson, N.J.; Plenge, R.M.; Weinblatt, M.E.; Shadick, N.A.; Reich, D. Principal components analysis corrects for stratification in genome-wide association studies. Nat. Genet. 2006, 38, 904–909. [Google Scholar] [CrossRef] [PubMed]
  38. Hamon, P.; Grover, C.E.; Davis, A.P.; Rakotomalala, J.-J.; Raharimalala, N.E.; Albert, V.A.; Sreenath, H.L.; Stoffelen, P.; Mitchell, S.E.; Couturon, E.; et al. Genotyping-by-sequencing provides the first well-resolved phylogeny for coffee (Coffea) and insights into the evolution of caffeine content in its species GBS coffee phylogeny and the evolution of caffeine content. Mol. Phylogenetics Evol. 2017, 109, 351–361. [Google Scholar] [CrossRef] [PubMed]
  39. Anagbogu, C.F.; Ilori, C.O.; Bhattacharjee, R.; Olaniyi, O.O.; Beckles, D.M. Gas chromatography-mass spectrometry and single nucleotide polymorphism-genotype-by-sequencing analyses reveal the bean chemical profiles and relatedness of Coffea canephora genotypes in Nigeria. Plants 2019, 8, 425. [Google Scholar] [CrossRef] [PubMed]
  40. Sant’Ana, G.G.; Pereira, L.F.P.; Pot, D.; Ivamoto, S.T.; Domingues, D.S.; Ferreira, R.V.; Pagiatto, N.F.; da Silva, B.S.R.; Nogueira, L.M.; Kitzberger, D.S.G.; et al. Genome-wide association study reveals candidate genes influencing lipids and diterpenes contents in Coffea arabica L. Sci. Rep. 2018, 8, 465. [Google Scholar] [CrossRef]
  41. Sousa, T.V.; Caixeta, E.T.; Alkimim, E.R.; Oliveira, A.C.B.; Pereira, A.A.; Sakiyama, N.S.; Zambolim, L.; Resende, M.D.V. Early selection enabled by the implementation of genomic selection in Coffea arabica breeding. Front. Plant Sci. 2019, 9, 19–34. [Google Scholar] [CrossRef] [PubMed]
  42. Gimase, J.M.; Thagana, W.M.; Omondi, C.O.; Cheserek, J.J.; Gichimu, B.M.; Gichuru, E.K.; Ziyomo, C.; Sneller, C.H. Genome-wide association study identify the genetic loci conferring resistance to coffee berry disease (Colletotrichum kahawae) in Coffea arabica var. Rume Sudan. Euphytica 2020, 216, 86. [Google Scholar] [CrossRef]
  43. Ji, K.; Zhang, D.; Motilal, L.; Boccara, M.; Lachenaud, P.; Meinhardt, L.W. Genetic diversity and parentage in farmer varieties of cacao (Theobroma cacao L.) from Honduras and Nicaragua as revealed by single nucleotide polymorphism (SNP) markers. Genet. Resour. Crop Evol. 2013, 60, 441–453. [Google Scholar] [CrossRef]
  44. Wu, G.A.; Prochnik, S.; Jenkins, J.; Salse, J.; Hellsten, U.; Murat, F.; Perrier, X.; Ruiz, M.; Scalabrin, S.; Terol, J.; et al. Sequencing of diverse mandarin, pummelo and orange genomes reveals complex history of admixture during citrus domestication. Nat. Biotechnol. 2014, 32, 656–662. [Google Scholar] [CrossRef] [PubMed]
  45. Fang, W.P.; Meinhardt, L.W.; Tan, H.W.; Zhou, L.; Mischke, S.; Zhang, D.P. Varietal identification of tea (Camellia sinensis) using nanofluidic array of single nucleotide polymorphism (SNP) markers. Hortic. Res. 2014, 1, 14035. [Google Scholar] [CrossRef]
  46. Wang, B.Y.; Tan, H.W.; Fang, W.P.; Meinhardt, L.W.; Mischke, S.; Matsumoto, T.; Zhang, D.P. Developing single nucleotide polymorphism (SNP) markers from transcriptome sequences for identification of longan (Dimocarpus longan) germplasm. Hortic. Res. 2015, 2, 14065. [Google Scholar] [CrossRef] [PubMed]
  47. Liu, W.; Xiao, Z.D.; Bao, X.L.; Yang, X.Y.; Fang, J.; Xiang, X. Identifying litchi (Litchi chinensis Sonn.) cultivars and their genetic relationships using single nucleotide polymorphism (SNP) markers. PLoS ONE 2015, 10, e0135390. [Google Scholar] [CrossRef]
Figure 1. Rooted neighbor-joining phylogenetic tree consisting of 24 Coffea accessions. The tree was constructed on the basis of 198,955 SNPs identified using SLAF-seq data. Different colors represent different sections or subsections.
Forests 15 00163 g001
Figure 2. Principal component analysis of the 20 C. arabica accessions conducted on the basis of 198,955 SNPs derived from the SLAF-seq data.
Forests 15 00163 g002
Figure 3. Genetic structure of 20 C. arabica accessions determined by STRUCTURE using 198,955 SNPs derived from the SLAF-seq results. (A) Genetic structure of 20 C. arabica accessions when K = 3. (B) Genetic structure of 20 C. arabica accessions when K = 4.
Forests 15 00163 g003
Figure 4. Analysis of the correlations among 20 C. arabica accessions according to the expression levels of 25,872 genes determined using transcriptome data.
Forests 15 00163 g004
Table 1. Sources of the 24 Coffea accessions collected for the SLAF-seq analysis.
Accession Number or NameTypeSource of IntroductionSpeciesFruit Color
Yellow BourbonCTaqiri, MyanmarC. arabicaYellow
Bourbon GuatemalaCLa Aurora, GuatemalaC. arabicaRed
Yellow BourbonCTaqiri, MyanmarC. arabicaYellow
YAUC19LSYunnan province, ChinaC. arabicaRed
Bourbon AmarilloCCampinas, BrasilC. arabicaRed
YAUC46LSYunnan province, ChinaC. arabicaRed
GPFA107CNestle R & D Center, Tours, FranceC. arabicaRed
CCCA10×25CNestle R & D Center, Tours, FranceC. arabicaRed
CCCA12×25CNestle R & D Center, Tours, FranceC. arabicaRed
Catimor T8667CCoffee Research Center, Mandalay, MyanmarC. arabicaRed
Catimor 7963CBang Mei Shu, VietnamC. arabicaRed
YAUC60LSCoffee Research Center, Mandalay, MyanmarC. arabicaRed
YAUC57LSCoffee Research Center, Mandalay, MyanmarC. arabicaRed
YAUC161LSYunnan province, ChinaC. arabicaRed
GPFA117CNestle R & D Center, Tours, FranceC. arabicaRed
GPFA121CNestle R & D Center, Tours, FranceC. arabicaRed
YAUC160LSYunnan province, ChinaC. arabicaRed
YAUC37LSYunnan province, ChinaC. arabicaRed
TypicaCScott Laboratory, KenyaC. arabicaRed
SL28CScott Laboratory, KenyaC. arabicaRed
C. canephora TRS1CBang Mei Shu, VietnamC. canephoraRed
C. canephora TS5CBang Mei Shu, VietnamC. canephoraRed
C. libericaLSLiberiaC. libericaRed
C. racemosaLSCampinas, BrasilC. racemosaRed
Source of introduction—The introduction site of the sample; LS—local selection; C—commercial cultivar.
Table 2. Summary of the SLAF-seq data for 24 Coffea accessions.
AccessionsTotal ReadsGC Percentage (%)Q30 Percentage (%)SLAF NumbersAverage Sequencing Depth/xSNP NumbersIntegrity (%)Heter Ratio (%)
Yellow Bourbon3,543,00640.3694.99140,3639.19632,14353.287.04
Bourbon Guatemala4,707,44639.8795.32135,75813.19628,48352.976.83
Yellow Bourbon7,210,31038.8796.10154,71716.53782,88765.998.25
YAUC196,495,26838.6595.33149,08516.13696,11558.678.44
Bourbon Amarillo6,062,29438.6996.31125,17617.63597,47550.367.49
YAUC466,035,78638.8196.29171,02612.73854,49672.027.74
GPFA1076,215,38039.4696.18159,69014.32748,07763.0510.04
CCCA10×255,044,68839.4795.93145,01613.71656,74155.358.28
CCCA12×254,626,67839.5196.08155,56111.04719,95860.688.26
Catimor T86674,695,44439.0596.36167,92910.05835,26170.4011.17
Catimor 79634,491,62040.9196.12144,93810.79693,48358.458.21
YAUC604,691,24239.1396.30164,5549.98836,19970.489.94
YAUC575,159,47839.4595.91140,28514.04661,91955.797.87
YAUC1617,158,70038.4996.28156,31417.23734,97061.957.71
GPFA1175,229,64439.60 96.10148,26213.72694,77958.5610.60
GPFA1215,600,72640.5296.25138,84715.46627,58852.9010.19
YAUC1606,147,46639.3995.51159,47814.58773,98065.249.29
YAUC377,230,87238.9595.56167,25815.15903,82376.1810.36
Typica5,751,33239.70 95.10161,56312.46808,84268.179.48
SL284,473,96439.4596.27157,10310.43779,76465.728.89
C. canephora TRS13,558,94239.7495.1389,72713.28604,47250.9516.39
C. canephora TS56,043,84639.4496.2198,02519.59692,38958.3617.49
C. liberica4,345,98040.0796.2770,16017.09586,84049.4617.48
C. racemosa2,665,42439.4895.6946,23415.18381,57132.1613.89
Table 3. Summary of the transcriptome data for 20 C. arabica accessions.
AccessionClean ReadsClean Bases (G)GC Percentage (%)Q30 Percentage (%)
Yellow Bourbon21,550,4446.4545.9095.16
Bourbon Guatemala24,555,1277.3544.6495.08
Yellow Bourbon23,196,8876.9445.4395.26
YAUC1920,564,7086.1644.8694.74
Bourbon Amarillo19,484,3495.8344.5894.92
YAUC4620,604,2756.1744.4695.15
GPFA10724,411,5157.3144.8495.20
CCCA10×2520,656,3006.1845.2795.40
CCCA12×2520,636,0476.1744.5594.98
Catimor T866719,194,9075.7444.7294.63
Catimor 796321,505,3866.4445.5995.26
YAUC6020,424,2076.1145.0195.18
YAUC5720,698,9696.1945.0994.86
YAUC16119,810,0595.9344.7194.84
GPFA11721,505,3866.4445.5995.26
GPFA12122,370,4616.7045.2995.09
YAUC16021,662,5286.4844.6094.63
YAUC3722,692,9726.7944.6995.14
Typica22,334,0796.6844.3694.55
SL2821,543,1846.4551.0995.28
Disclaimer/Publisher’s Note: The statements, opinions and data contained in all publications are solely those of the individual author(s) and contributor(s) and not of MDPI and/or the editor(s). MDPI and/or the editor(s) disclaim responsibility for any injury to people or property resulting from any ideas, methods, instructions or products referred to in the content.

