Article

Genome-Wide Analysis of Homologous E6-AP Carboxyl-Terminal E3 Ubiquitin Ligase Gene Family in Populus trichocarpa

1
State Key Laboratory of Tree Genetics and Breeding, Northeast Forestry University, Harbin 150040, China
2
Key Laboratory of Non-Wood Forest Product Research and Development, Mudanjiang Branch of Heilongjiang Academy of Forestry, 16 Diming Street, Mudanjiang 157011, China
*
Authors to whom correspondence should be addressed.
Forests 2024, 15(1), 169; https://doi.org/10.3390/f15010169
Submission received: 24 December 2023 / Revised: 9 January 2024 / Accepted: 11 January 2024 / Published: 13 January 2024
(This article belongs to the Special Issue Forest Tree Genetics and Breeding in Response to Different Threats)

Abstract

:
Proteins containing the homologous E6-AP carboxyl-terminal (HECT) domain are a class of E3 ubiquitin ligases involved in the ubiquitin–proteasome pathway, which plays an irreplaceable role in plant growth, development, and stress resistance. However, a phylogenetic analysis and expression profile of the HECT gene (PtrHECT) in the model plant Populus trichocarpa (Torr. & Gray) have not been reported. In this study, we identified 13 PtrHECT genes using genome-wide analysis, and then these were divided into four groups. The protein interaction networks showed that the PtrHECT protein may interact with PTR6 and participate in ABA signal regulation. Abiotic stress is the main environmental factor limiting plant growth and development. The qRT-PCR results showed that PtrHECT1, 4, 7, 8, and 9 were significantly up-regulated in leaves at each time point under drought stress, and most PtrHECT genes responded to both drought and high salt stress, consistent with their promoter sequence analysis, revealing the presence of an important number of phytohormone-responsive and stress-related cis-regulatory elements. This study provides useful information for further analysis of the functions of the HECT gene family in P. trichocarpa.

1. Introduction

The ubiquitin-26S proteasome system (UPS) is one of the most important protein degradation systems in eukaryotes. About 80% of proteins are degraded by the ubiquitin–proteasome pathway [1,2,3,4]. Ubiquitination specifically regulates protein expressions at the post-translational level to achieve the precise regulation of plant growth and development, metabolism, and response to biotic and abiotic stresses [5,6,7]. Ubiquitination is a three-enzyme cascade, which generally requires three enzymes: ubiquitin-activating enzyme (E1), ubiquitin-conjugating enzyme (E2), and ubiquitin ligase (E3) [8,9,10].
According to the subunit composition, E3 can be divided into two categories. Those with a single subunit structure are classified into one category, including RING (a really interesting new gene), U-box, and HECT (homology to the E6-AP C-terminus). Another type with a multi-subunit structure includes CRLs (cullin-RING), APC, and SCF [4,11,12,13]. The HECT-type E3 protein has a characteristic HECT domain composed of two N/C lobes, which consist of about 350 amino acids at the C-terminus [14,15]. Among these, the cysteine residues at 32–36 amino acids of the C-terminal lobe are highly conserved, and the N-terminal lobe contains the E2-binding site [16,17].
In this process, ubiquitin is attached to E2 to form a complex, which is recruited by E3, and then ubiquitin is connected to the cysteine site at the C-terminus of E3 by forming a thioester and transferred to the lysine residue of the target protein, which is degraded into small molecular peptides in the 26S proteasome [17,18]. The N-terminus of the HECT-type E3 protein specifically recognizes the degradation signal on the various substrates, and the C-terminus indirectly or directly catalyzes the transfer of ubiquitin, thereby strictly controlling the efficiency of the ubiquitination reaction [16,19]. Based on the different N-terminal domains that recognize and bind to varied substrates, HECT-type E3 can be divided into different subfamilies.
Studies have shown that the HECT gene family plays a key role in multiple developmental stages of plants (such as photomorphogenesis, cell cycle, ovule development, senescence, defense, environmental response, and hormone signal response) [12,18]. At present, a total of seven HECT-type E3 ubiquitin ligases (UPL1–UPL7) have been identified and fully studied in Arabidopsis thaliana [20,21]. Among them, UPL3 is involved in the regulation of plant epidermal trichome development by regulating the degradation rate of related transcription factors participating in leaf morphogenesis [22,23]. UPL3 regulates the nuclear replication cycle and seed size as well [24]. UPL4 is involved in physiological activities such as active oxygen balance and iron metabolism. UPL5 regulates the ubiquitination of WRKY53 (a plant-specific zinc finger transcription regulatory factor), thereby regulating the aging process [25]. Studies have shown that UPL1, UPL3, and UPL5 play a role in plant immunity and salicylic acid (SA) responses [26]. In rice (Oryza sativa), seven HECT genes have been identified [25]. In soybean (Glycine max), 19 HECT genes have been found, and 15 genes were shown to be differentially expressed in tissues and usually highly expressed in flowers and roots [27]. In addition, HECT genes have been identified and analyzed in apple (Malus domestica), tomato (Solanum lycopersicum), wheat (Triticum aestivum), maize (Zea mays), and Brassica rapa [25,28,29,30]. The results of multiple studies have revealed that the HECT gene family may play an important role in plant adaptation to adverse environmental stresses. However, similar results have not been seen in studies focused on poplar plants, represented by Populus trichocarpa.
P. trichocarpa is an important economic and scientific tree species with characteristics of fast growth and easy propagation. Since the genome data of P. trichocarpa were first published in 2006, research has gradually deepened [31,32,33]. In this study, we obtained the HECT gene sequences of P. trichocarpa and analyzed the evolutionary relationship, gene structures, conserved motifs, promoter cis-elements, homology models, protein interaction network, and expression profiles. Then, the relative expression levels of PtrHECT genes in roots and leaves under drought stress and salinity treatments were analyzed. The excavation of PtrHECT lays a theoretical foundation for exploring the role of the HECT gene family in growth and stress resistance, and this will hopefully help to improve plant resistance by molecular means in the future.

2. Materials and Methods

2.1. Identification of HECT Genes in P. trichocarpa

The amino acid sequences of 7 AtHECT proteins (AT1G55860, AT1G70320, AT4G38600, AT5G02880, AT4G12570, AT3G17205, and AT3G53090) were obtained as reference sequences from TAIR (https://www.arabidopsis.org/, accessed on 15 October 2023) [20]. Online alignment was performed using the Phytozome database of P. trichocarpa (version 13; https://phytozome-next.jgi.doe.gov/, accessed on 15 October 2023), and the following parameters were set: target type, proteome; program, BLASTP; expect (E) threshold = −1 [34]. At the same time, the hidden Markov model (PF00632) of the HECT domain was downloaded by the Pfam database (http://pfam.xfam.org/, accessed on 17 October 2023) [35]. The HMM search in the TBtools software (v1.064) was used to screen the HECT protein sequences from the total proteome database of P. trichocarpa [36,37]. Combining the above two methods, the repetitive sequences were detected and deleted. All candidate genes were confirmed through the Pfam and SMART databases (https://smart.embl.de/, accessed on 20 October 2023) to ensure the existence of a conserved HECT domain [38]. The gene sequences and coding amino acid sequences of PtrHECT were downloaded from Phytozome. Subcellular localization was predicted using WoLF PSORT (http://www.genscript.com/psort/wolf_psort.html, accessed on 23 October 2023) [39]. The isoelectric point, amino acid length, molecular weight, and hydrophobicity of each PtrHECT protein were predicted using the online ProtParam tool of Expasy (https://web.expasy.org/protparam/, accessed on 23 October 2023) [40].

2.2. Chromosomal Location

The chromosome location information for 13 PtrHECT was obtained from the Phytozome database. The MapGene2 Chromosome online website (http://mg2c.iask.in/mg2c_v2.0/, accessed on 23 October 2023) was used for mapping.

2.3. Phylogenetic Analysis and Sequence Analysis

Using PtrHECT genes as the query sequences for standard Protein BLAST in the NCBI database (https://www.ncbi.nlm.nih.gov/, accessed on 8 November 2023), we obtained the amino acid sequences of HECT proteins from P. trichocarpa, A. thaliana, soybean (G. max), apple (M. domestica), rice (O. sativa), maize (Z. mays), and wheat (T. aestivum). These HECT protein sequences were subjected to multiple sequence alignment analyses using ClustalW of MEGA software (v11.0.10), and the conserved residues of the HECT domain were identified [41]. The neighbor-joining method was used to draw the phylogenetic tree. The test method used for phylogeny was the bootstrap method, and the number of bootstrap replications was set to 1000. The evolutionary distances were computed using the p-distance method. The remaining parameters were the default values. Conserved domain analysis of the PtrHECT protein was performed using the SMART database and plotted using IBS software (v1.0.3).
The genetic sequences and CDS of the PtrHECT were downloaded from the Phytozome online database, and the distributions of the exons and introns were visualized using the Gene Structure Display Server (http://gsds.gao-lab.org/, accessed on 8 November 2023) [42]. The MEME online tool (Multiple EM for Motif Elicitation, http://meme-suite.org/index.html, accessed on 10 November 2023) was used to analyze the conserved motifs of the full-length PtrHECT proteins [43]. The maximum number of motifs retrieved was 15, and the remaining parameters were the default values [26].

2.4. Promoter cis-Element Analysis

The promoter sequences of the PtrHECT were downloaded using the Phytozome online database. In general, a 2000 bp sequence upstream of the transcription start site is used as the promoter of the gene. The search and localization of cis-acting elements in each promoter were conducted through the online database PlantCARE, and 12 cis-acting elements related to plant hormones and abiotic stresses were selected for visualization in IBS software (v1.0.3) [44].

2.5. Protein Interaction Network Analysis

The protein interaction networks were obtained through the STRING (https://string-db.org/cgi/input.pl, accessed on 12 November 2023) database [45]. For drawing, we used Adobe Illustrator CS6 (v16.0.0).

2.6. Homology Model of HECT Genes

The protein sequences were submitted to the SWISS-MODEL Server (http://swissmodel.expasy.org/, accessed on 15 November 2023) to develop a model with sufficient query sequence coverage and sequence identity. The most reliable 3D structure was selected based on the Global Model Quality Estimation (GMQE) and Qualitative Model Energy Analysis (QMEAN) values [46]. After the model was predicted, we used SAVES (https://saves.mbi.ucla.edu, accessed on 16 November 2023) to evaluate and provide three software evaluation results at one time. If two of the results show approval, the model is considered usable. For instance, PROCHECK was used to check the quality of the HECT genes’ generated modeled 3D structure via SWISS-MODEL. Generally, if the amino acid residues in the acceptable region are greater than 90%, the protein structure can be considered reasonable. Verify3D was used to analyze the compatibility of the atomic model (3D) with its own amino acid sequence (1D), which was determined by assigning structure classes according to its location and environment and comparing the results with good structures. If more than 80% of the residues have a 3D/1D value greater than 0.2, the quality of the model is considered acceptable, but the parts below 0.2 require further correction. Also, ERRAT was used to collect data statistics for non-bonding interactions between different atomic types and plot the position relationship between the error function value and the residue sliding window, which was derived by comparing it with statistics for highly refined structures.

2.7. Tissue-Specific Expression Analyses

The RNA-Seq data (GSE81077) of P. trichocarpa were obtained using the GEO DataSets tool of NCBI. The experimental materials were the tissues (root, stem, leaf, xylem, phloem, fiber, and vessel) of 6-month-old P. trichocarpa [47]. The heat map was drawn using TBtools.

2.8. Plant Materials, Drought Stress, and Salt Treatment

P. trichocarpa (genotype Nisqually-1) plants were cultured until they reached three weeks old in vitro as the experimental material, and the basic medium was woody plant medium (WPM, a plant culture medium used for root propagation and elongation containing CaCl2 and vitamins) [48,49]. We added 6.5 g/L of agar and 30 g/L of sucrose when configuring. The culture conditions were 25 °C and a 16 h photoperiod. Using untreated plants as the controls, 7% polyethylene glycol 6000 was added to one group to simulate drought, while 200 mM NaCl was added to the other group to simulate high salinity. Samples were taken from leaves and roots at 0, 3, 6, 12, and 24 h after stress, while unstressed samples were taken as the controls. The samples were then frozen in liquid nitrogen and placed in an ultra-low-temperature refrigerator.

2.9. RNA Extraction and Real-Time Quantitative PCR (qRT-PCR)

RNA reverse transcription TransScript® One-Step gDNA Removal and cDNA Synthesis SuperMix and fluorescence quantitative detection kits were purchased from TransGen Biotech and Vazyme.
The design of specific primers for qRT-PCR using the online NCBI Primer Blast tool and the PtrActin gene (GenBank ID: XM_002298674) were used as the internal reference genes. The information on all specific primers is listed in Supplementary Table S1.

2.10. Statistical Analysis

Statistical software SPSS (v27, IBM, Chicago, IL, USA) was used to analyze the differences in the relative expression, and significance tests of these differences (p = 0.05, p = 0.01) were carried out.

3. Results

3.1. Identification of HECT Genes in P. trichocarpa

In this study, a total of 13 HECT family members were identified in the genome of P. trichocarpa, which were named PtrHECT1 ~ PtrHECT13 according to their position on the chromosomes. The length of the PtrHECT proteins ranged from 782 aa (PtrHECT11) to 3756 aa (PtrHECT1) (Table 1). The molecular weight ranged from 88.83 kD to 411.29 kD. The isoelectric point ranged from 4.95 to 7.88. Except for PtrHECT13, all other family members were alkaline proteins. The GARVY values ranged from −0.315 to −0.105, indicating that the whole family had the characteristics of low hydrophilicity. PtrHECT1, PtrHECT3, PtrHECT4, PtrHECT5, PtrHECT7, PtrHECT9, PtrHECT10, and PtrHECT11 are localized in the nucleus. PtrHECT2 is located in the plasma membrane; PtrHECT13 is located in chloroplasts; PtrHECT6 and PtrHECT8 are located in the cytoplasm; and PtrHECT12 is located in the endoplasmic reticulum.

3.2. Chromosomal Locations

Using the Phytozome database, it was confirmed that thirteen PtrHECT genes were unevenly distributed on 9 out of 18 chromosomes. Four PtrHECT genes (PtrHECT10, 11, 12, and 13) were located on chromosome 16. Two PtrHECT genes (PtrHECT4 and 5) were located on chromosome 6. Additionally, chromosomes 1, 2, 4, 8, 9, 10, and 11 each contained one PtrHECT gene (Figure 1).

3.3. Sequence Alignment, Phylogenetic Analysis, and Domain Assessment

Analysis with PROSITE and multiple sequence alignment confirmed the appearance of nine highly conserved cysteine residues in the HECT domain of multiple species, in addition to conserved lysine residues (Supplementary Figure S1). An unrooted phylogenetic tree was constructed using the amino acid sequences of 13 HECT proteins from P. trichocarpa, 7 from A. thaliana, 13 from apple, 7 from rice, 19 from soybean, 12 from maize, and 25 from wheat (Figure 2). The results showed that PtrHECTs were divided into four subfamilies. Subfamily I had the largest number of members (4). PtrHECT3, PtrHECT5, PtrHECT7, and PtrHECT12 belong to subfamily I; PtrHECT4, PtrHECT10, and PtrHECT11 belong to subfamily II; PtrHECT6, PtrHECT8, and PtrHECT13 belong to subfamily III; and PtrHECT1, PtrHECT2, and PtrHECT9 belong to subfamily IV. PtrHECT proteins are mostly clustered with the HECT proteins of apple, indicating that the HECT proteins of P. trichocarpa are more closely related to the homologous proteins of apple than to the homologous proteins of soybean, A. thaliana, and other species.
In all cases, the HECT domain was located at the C-terminal, and there were differences in the N-terminal between subfamilies (Figure 3). The HECT proteins were divided into four classes according to the presence of the UBQ domain (Class II), only the HECT domain or three more ARM domains (Class I), the IQ domain (Class III), the UBA and UIM domains, and UBA is always distributed upstream of UIM (Class IV).

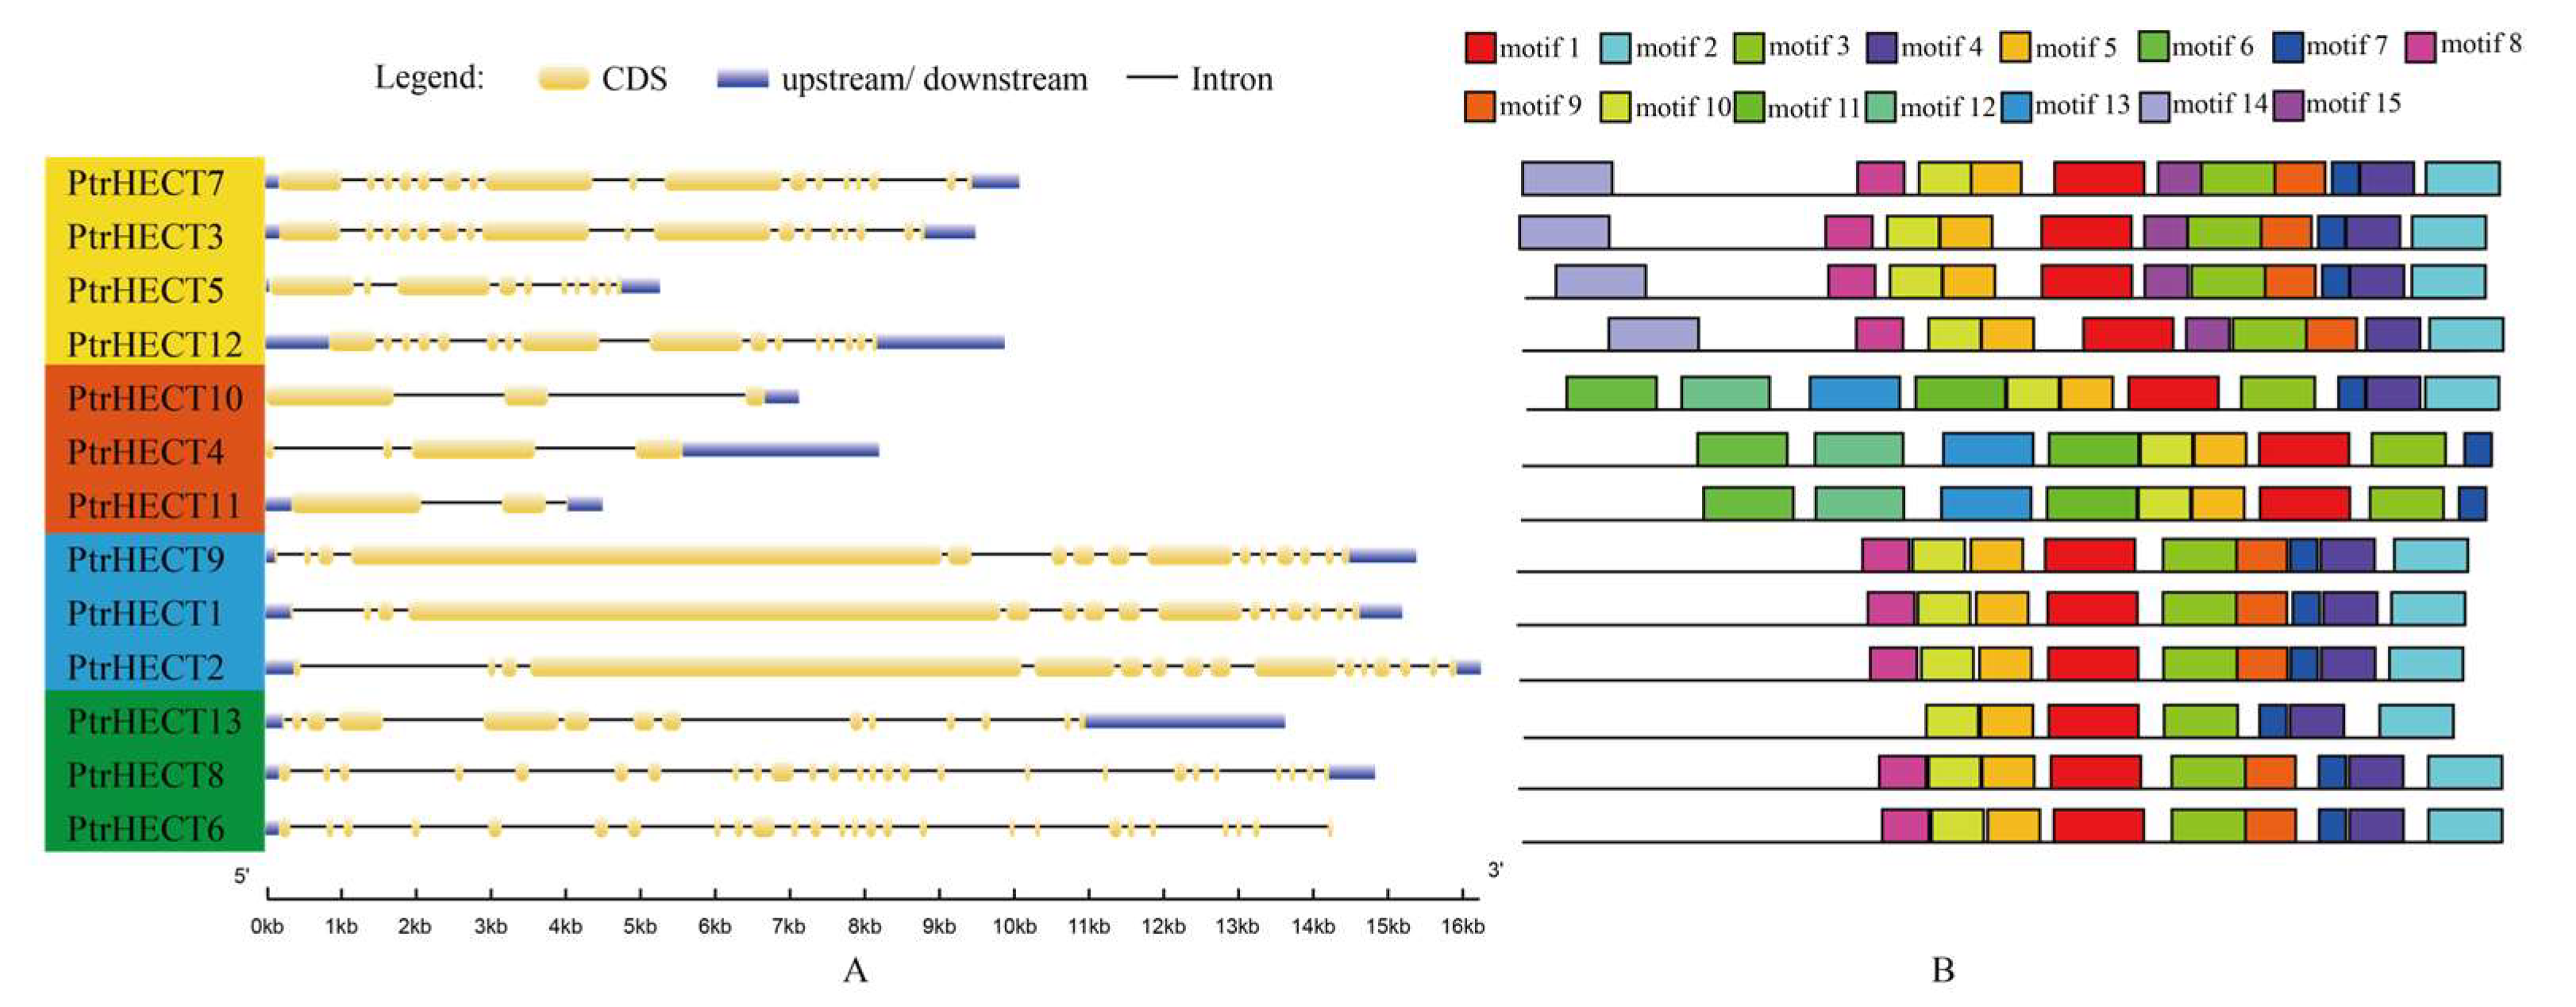
3.4. Gene Structure and Conserved Motif

In order to study the correlation between the evolutionary relationship and gene and protein structure, the intron–exon structures and protein-conserved motifs of PtrHECT were analyzed (Figure 4). The results showed that the length and number of introns and exons in the same subfamily are similar. For example, the number of exons in subfamily Ⅱ is three or four, which is significantly lower than the average number in the whole family. All three members of subfamily Ⅳ contain an exon with a length greater than 6 kb. It is worth noting that the amino acid length of subfamily Ⅳ is much smaller than that of subfamily Ⅲ; although the gene lengths of subfamilies Ⅲ and Ⅳ are similar, the number of exons of subfamily Ⅳ is generally greater than that of subfamily Ⅲ. This indicates significant differences in the intron–exon structure of PtrHECT.
Conserved motif analysis showed that motif 1, motif 3, motif 5, and motif 10 were common motifs in the 13 members, and motif 1 and motif 3 belonged to the typical HECT domain. Although motif 2, motif 4, and motif 7 do not appear in all members, they are present in all four subfamilies. Motif 14 and motif 15 are unique to subfamily Ⅰ. Motif 6, motif 11, motif 12, and motif 13 are unique to subfamily Ⅱ, indicating that there are differences in the types of motifs between subfamilies. The results displayed a difference in motifs between the PtrHECT subfamily.

3.5. Promoter cis-Element Analysis

Cis-acting elements play an important role in the transcriptional regulation of plants. In order to understand the possible biological functions and regulatory mechanisms of PtrHECT, the cis-acting elements were analyzed using PlantCARE. The results showed that the promoters of PtrHECT mainly included two categories: 12 kinds and 100 cis-acting elements (Figure 5). One is the plant hormone response element, including gibberellin-responsive elements (P-box and TATC-box), methyl jasmonate (MeJA)-responsive elements (CGTCA/TGACG), auxin-responsive elements (TGA), abscisic acid-responsive elements (ABRE), and salicylic acid-responsive elements (TCA). The other is an abiotic stress-related cis-element, including hypoxia-inducible elements (GC and ARE), MYB drought-inducible binding sites (MBS), low-temperature-responsive elements (LTR), and defense- and stress-responsive elements (TC-rich repeats).
The number of cis-acting elements of different types varies greatly. ARE has the largest number of cis-acting elements, and 29 of the 13 promoters are distributed among all member promoters except PtrHECT4. ABREs have the second largest number, with a total of 26, and the PtrHECT3 promoter contains the most ABRE, with a total of 6.

3.6. Analysis of the HECT Protein Interaction Network in P. trichocarpa

The various life activities of plants depend on protein interactions. Using STRING to predict the protein interaction network of PtrHECT, 13 protein network interaction maps were obtained (Figure 6). We found that there are different degrees of interaction within the PtrHECT protein family, and most of the members interact with ubiquitin-conjugating enzymes, 26S proteasome subunits, and transporters. In the protein interaction networks, the PtrHECT proteins of the same subfamily have similar protein interaction networks. Except for members of subfamily Ⅱ and PtrHECT13, POPTR_0006s08580 and POPTR_0006s08590 interact with all PtrHECT proteins. NRPD903 (a subunit of RNA polymerase Ⅳ) interacts with all members of the PtrHECT subfamily Ⅱ.

3.7. Homology Modeling and Structure Validation of Modeled Proteins

To understand the structural arrangement and 3D coordination, models of the PtrHECT proteins were generated, respectively (Figure 7). Among them, the 3D structures of PtrHECT6 and PtrHECT8, PtrHECT10, PtrHECT4, and PtrHECT11, which are homologous proteins, were very similar, and the structures of PtrHECT3 and PtrHECT7 were likewise comparable. PtrHECT5 and PtrHECT12, PtrHECT9, and PtrHECT1 are also homologous proteins, but the similarities between them are poor.
The generated homology models were validated using MolProbity Ramachandran plot analysis (Supplementary Figures S2B–S14B), Verify3D (Supplementary Figures S4C–S9C and S11C–S14C), and ERRAT (Supplementary Figures S2C, S3C, and S10C). Both the Ramachandran plot (Supplementary Figures S2A–S14A) and the Ramachandran plot statistics were obtained from the PDBsum web server. The results confirmed the accuracy of the 3D modeling, as the percentages of the residue of the 3D structures modeled by PtrHECT proteins were 78.6%–92.2% in the most favored regions, 6.1% and 16.8% in additional allowable regions, 0.5%–4.3% in generously allowed regions, and 0.3%–4% in disallowed regions, respectively. All these data validate that the modeled 3D structures are essentially high-quality models. The structural variations in the HECT domains may correspond to functional diversity.

3.8. Expression Profiles of HECT Genes in P. trichocarpa

We summarized the expression data of PtrHECT gene family members in root, shoot, leaf, xylem, phloem, fiber, and vessel in the GEO genome database, set up three replicates, conducted the statistical analysis, and displayed the results by drawing a heatmap (Figure 8). There were significant differences in the expressions of PtrHECT genes in the above parts.
The entire PtrHECTs can be divided into two different expression patterns: one is made up of PtrHECT6 and PtrHECT11, whose relative expression levels in vessels and fibers are significantly lower compared to other parts; the remaining genes belong to another category, with little difference in expression between the different parts. Among them, PtrHECT1 and PtrHECT2 had the highest expression in roots and xylem, followed by fibers and vessels, and other parts had different degrees of high expression. The relative expression levels of PtHECT3, PtHECT7, PtHECT4, and PtrHECT5 were weaker than those of PtrHECT1 and PtrHECT2. The remaining genes also exhibited similar expression patterns and had the lowest expression levels in vessels, although these were not statistically significant. In summary, PtrHECT1, PtrHECT2, PtrHECT3, PtrHECT7, and PtrHECT5 had relatively high expression levels in roots and xylem. For almost all genes, the most highly expressed part was the root.

3.9. Expression Pattern of PtrHECT Genes under Drought Stress

The results of the expression pattern of PtrHECT genes under drought stress are as follows (Figure 9). In roots, PtrHECT2, 5, 6, 7, 9, 11, and 13 were down-regulated at all time points (p < 0.01), while PtrHECT3, 4, 8, and 12 were rapidly induced 3 h after drought stress and then gradually declined. The expression of PtrHECT4 was up-regulated to a nearly six-fold level. There was no significant change in the expression level of PtrHECT1 compared to the control. The expression level of PtrHECT12 returned to a normal level at 12 h and at later time points, while the expression levels of the remaining genes in the family were still significantly poor at 24 h. In leaves, all genes were induced under drought stress. PtrHECT1, 4, 7, 8, and 9 were significantly up-regulated at each time point. The expression of PtrHECT10, 11, and 12 peaked at 6 h, and the expression of PtrHECT12 was about 60-fold. The expression of all other genes peaked at 24 h, and the expression of PtrHECT4 was up-regulated 30-fold. PtrHECT2, 3, 5, and 6 showed no significantly early expression (3 h and 6 h) but peaked at 24 h, suggesting a late response.
These results revealed that the expression of most members of the PtrHECT family in roots and leaves showed the opposite trend with drought stress, namely that they were down-regulated in roots and up-regulated in leaves.

3.10. Expression Pattern of PtrHECT Genes under Salinity

We analyzed the specific expression of 13 genes in roots and leaves under high salt stress (Figure 10). In roots, all members of PtrHECT can be induced. The expression of PtrHECT1, 2, 4, 5, 7, 9, 10, and 13 was significantly up-regulated at the initial time point (3 h), while PtrHECT8 was up-regulated at 12 h. PtrHECT1, 2, 3, 5, 9, 10, 11, and 13 peaked at 6 h, whereas PtrHECT6, 7, 8, and 12 peaked at 12 h. In leaves, 10/13 genes were induced. PtrHECT1 and 2 showed no significant change in expression compared with the control, and only PtrHECT11 was suppressed. The expression levels of PtrHECT3, 4, 6, 7, 8, 9, 12, and 13 remarkably peaked at 3 h, and then they gradually declined to normal levels. The expression levels of PtrHECT9 and 12 at 3 h were seven-fold higher compared to thecontrol. The expression levels of PtrHECT5 and 10 peaked at 6 h and then declined to normal levels.
In summary, six genes, both in roots and leaves, were significantly up-regulated at 3 h (PtrHECT4, 5, 7, 9, 10, and 13). Almost all the genes in roots peaked at 6 h and 12 h (except for PtrHECT4), whereas most of the genes in leaves peaked at 3 h (PtrHECT3, 4, 6, 7, 8, 9, 12, and 13). The results indicate that the PtrHECT genes in roots and leaves can respond quickly to the stress of a high-salt environment, but the up-regulation response in roots lasts longer.

4. Discussion

4.1. The HECT Genes Family in Populus Trichocarpa

As an important class of E3 ligase in the plant ubiquitin–proteasome, HECT-type ubiquitin ligase has a specific HECT domain, participates in many cellular processes and biochemical reactions, and regulates plant growth, development, and stress response [19]. HECT genes exist in the form of a multi-gene family in Arabidopsis, tomato, rice, soybean, apple, maize, and other plants [5,21,27,50,51]. However, systematic identification and bioinformatics research of HECT genes in the model plant P. trichocarpa have not been reported.
In this study, 13 genes were identified in P. trichocarpa. The PtrHECT proteins all have a typical HECT domain at the C-terminus and a cysteine-active site. The physicochemical properties revealed that the HECT E3 ligases of P. trichocarpa were generally alkaline proteins with low hydrophilicity. Most of the HECT proteins are located in the nucleus and cytoplasm, and a few members are located in the chloroplast, even if the subcellular localizations of homologous genes are different, indicating that they may differ in functions and signal transduction [25]. Chromosomal localization showed that the HECT genes were unevenly distributed on the chromosome.
Phylogenetic tree analysis showed that the thirteen members of the PtrHECT gene family were divided into four subfamilies. The number of HECT genes in soybeans was 1.46 times that in P. trichocarpa because segmental duplication contributed significantly to the expansion of the soybean HECT gene family. All the PtrHECT genes had orthologous genes in soybean, but the homologous gene of PtrHECT2 in A. thaliana (UPL8 in their study) did not exist. This is consistent with the results of previous studies [25]. In previous studies, the HECT gene family has been divided into seven subfamilies. The reason for this difference is that our study did not divide the subfamilies Ⅰ, Ⅱ, and Ⅳ into two groups, as the differences in their conserved motifs and N-terminal structures were not considerable enough to be divided.
Exon–intron structures and protein-conserved motif analysis showed that there were differences and complexity among and within the PtrHECTs. In the PtrHECT protein family, we found that there are additional functional domains, and the additional domains of the four subfamilies are inconsistent. PtrHECT3 and PtrHECT7 have three ARMs. Studies have shown that ARM participates in many abiotic stress responses [18]. The ubiquitin-binding regions UBA and UIM are unique to the members of subfamily Ⅳ, which are closely arranged in the primary structure of the protein, and UBA is always distributed upstream of UIM, which is similar to UPL1 and UPL2 in A. thaliana [20]. The unique UBQ domain of subfamily Ⅱ is similar to the ubiquitin/ubiquitin-like structure, and the molecular weights of the proteins of subfamily Ⅱ are much smaller than other PtrHECT proteins, which is similar to the small molecular weight of the ubiquitin protein. This suggests that the HECT family of P. trichocarpa could potentially encompass a diverse range of functions, and it is postulated that similar gene structures and domains in the same subfamily of PtrHECT may interact with the same or similar substrates, causing functional differentiation between subfamilies to a certain extent.

4.2. The Promoter cis-Elements of PtrHECT

Cis-acting elements regulate the transcription level of genes and enhance plant resistance. We identified at least two phytohormone or abiotic stress-responsive cis-elements in all PtrHECT family members, indicating that PtrHECT genes may play an important role in response to abiotic stress and plant hormone treatment. Salicylic acid (SA) is involved in several physiological processes, including seed germination, growth regulation, flower induction, and particularly in regulating plant responses under stress conditions [52,53]. At present, it has been reported that UPL1, UPL3, UPL4, and UPL5 in A. thaliana are involved in the response to SA [6,18]. According to phylogenetic analysis, PtrHECT9 and PtrHECT11 are homologous proteins to UPL1 and UPL5 in A. thaliana, respectively, and PtrHECT5 and PtrHECT12 belong to the same subfamily as UPL3. And the cis-acting elements of the promoters of PtrHECT5, 9, 11, and 12 all contain TCA. This suggests that HECT proteins may serve as SA-responsive elements and participate in regulatory signaling responses. It is particularly important that, according to the results of previous studies, UPL3 in A. thaliana can act as a genome-wide amplifier of SA-responsive transcriptional reprogramming and the establishment of immunity, and the expression of downstream genes has undergone profound changes [18]. However, no TCA element was found in the homologous genes of UPL3. Further research is needed to determine whether the absence of TCA elements is involved in the SA regulatory network. Undeniably, HECT-type E3s play an important role in plant resistance to adversity.

4.3. Transcript Profiles of HECT Genes under Drought Stress and Salinity

Water plays a decisive role in the survival of plants. A water shortage will affect the osmotic pressure of plants and reduce the absorption and transport of substances, so that normal physiological activities are blocked or even stopped. We analyzed the expression levels of 13 PtrHECT genes in roots and leaves under drought and high salt stress using qRT-PCR. Under drought stress, most genes were strongly inhibited in roots but induced in leaves. The inhibition or induction of drought on them was still significant at 24 h, indicating that the damage of drought to plants was persistent and that the response strategies of PtrHECT in roots and leaves were different. Under high salt stress, except for PtrHECT1, 2, and 11, other genes were induced significantly in roots and leaves at the time point of stress initiation, though they returned to normal expression levels after a certain period of time, indicating that the PtrHECT gene family is generally involved in the regulatory network under high salt stress. Both drought and high salt can lead to an increase in cell osmotic pressure, but the expression of PtrHECTs shows a different performance, which indicates that drought and high salt change expression through different regulatory networks.
The root is the first place in which changes in osmotic potential are first sensed, and they quickly transmit signals to other parts [54]. Tissue-specific analysis shows that the root and xylem are the regions with the highest expression of PtrHECTs. Thus, it is speculated that under stress, the PtrHECT genes with high expression levels in the root respond rapidly. The active HECT proteins in roots regulate the expression of downstream genes by controlling the ubiquitination rates of target proteins and transmitting signals to stems and leaves so that plants can make rapid adjustments to cope with stress, which has a positive effect on plant development and stress resistance.

4.4. The Predicted Interaction Network of PtrHECT Proteins

ABA is a key abiotic stress-related hormone involved in various physiological processes, which can promote the senescence and abscission of leaves and fruits [55,56]. During drought, ABA regulates stomatal closure, reduces the rate of dehydration, and improves plant drought resistance. POPTR _ 0006s08580 (PTR6) is a type of E3 ligase that binds to a specific N-degron on the target protein. At present, only two types of PTR proteins have been identified in A. thaliana, which are sensitive to ABA and also participate in the physiological process of ethylene-promoted dormancy seed germination [57]. They can regulate seed germination and are widely involved in anti-pathogen, anti-drought, and hypoxic stress-related responses. Considering that multiple members of PtrHECT are predicted to interact with PTR6 and that the PtrHECT gene family generally contains the ABRE motif, especially all members of subfamily I, we speculate that most HECT proteins may be involved in ABA-related biochemical reactions to help plants resist drought stress. It has been confirmed that WRKY53 is a key transcription factor that promotes leaf senescence, and UPL5 is an interacting factor of WRKY53 in A. thaliana [58]. UPL3 and UPL4 are also involved in leaf growth and senescence regulation. It can be speculated that the subfamily Ⅰ proteins of P. trichocarpa, which are clustered with UPL3 and UPL4, can participate in regulation through the ABA pathway. In addition, we predicted that the members of the subfamily Ⅱ of PtrHECT proteins all interact with NRPD903, which has been identified as a subunit of RNA polymerase Ⅳ [31]. Moreover, PtrHECT4 and 11 in subfamily Ⅱ have a unique UBQ structure. Further evidence is needed to determine whether the above factors collectively contribute to changes in the functions of PtrHECT4 and 11.

5. Conclusions

Herein, 13 identified PtrHECT genes were classified into four phylogenetic groups. The analysis of the conserved structure revealed structural differences between the PtrHECT gene subfamilies. The cis-acting elements and protein–protein interaction network revealed the response of PtrHECT genes to ABA and SA. To the best of our knowledge, this is the first time that HECT genes in P. trichocarpa have been analyzed in light of responses to salt and drought based on qRT-PCR analysis, and the majority of PtrHECT genes were responsive to drought and high salt in leaves. Thus, our study provides a theoretical basis for the future study of HECT genes involved in the signaling pathways of ABA and SA under stress and the determination of the specific function of each PtrHECT, which is helpful for the selection of suitable candidate genes for the genetic engineering of drought and high salinity resistance in P. trichocarpa.

Supplementary Materials

The following supporting information can be downloaded at: https://www.mdpi.com/article/10.3390/f15010169/s1, Table S1: The primers for qRT-PCR; Figure S1: Sequence alignment of the HECT domain of all the identified HECT proteins in Populus trichocarpa, Arabidopsis thaliana, Glycine max, Oryza sativa, Zea mays and Triticum aestivum; Figure S2: Homology modelled structure validation of PtrHECT1 using (A) Ramachandran plot; (B) Ramachandran plot statistics; and (C) ERRAT; Figure S3: Homology modelled structure validation of PtrHECT2 using (A) Ramachandran plot; (B) Ramachandran plot statistics; and (C) ERRAT; Figure S4: Homology modelled structure validation of PtrHECT3 using (A) Ramachandran plot; (B) Ramachandran plot statistics; and (C) Verify3D; Figure S5: Homology modelled structure validation of PtrHECT4 using (A) Ramachandran plot; (B) Ramachandran plot statistics; and (C) Verify3D; Figure S6: Homology modelled structure validation of PtrHECT5 using (A) Ramachandran plot; (B) Ramachandran plot statistics; and (C) Verify3D; Figure S7: Homology modelled structure validation of PtrHECT6 using (A) Ramachandran plot; (B) Ramachandran plot statistics; and (C) Verify3D; Figure S8: Homology modelled structure validation of PtrHECT7 using (A) Ramachandran plot; (B) Ramachandran plot statistics; and (C) Verify3D; Figure S9: Homology modelled structure validation of PtrHECT8 using (A) Ramachandran plot; (B) Ramachandran plot statistics; and (C) Verify3D; Figure S10: Homology modelled structure validation of PtrHECT9 using (A) Ramachandran plot; (B) Ramachandran plot statistics; and (C) ERRAT; Figure S11: Homology modelled structure validation of PtrHECT10 using (A) Ramachandran plot; (B) Ramachandran plot statistics; and (C) Verify3D; Figure S12: Homology modelled structure validation of PtrHECT11 using (A) Ramachandran plot; (B) Ramachandran plot statistics; and (C) Verify3D; Figure S13: Homology modelled structure validation of PtrHECT12 using (A) Ramachandran plot; (B) Ramachandran plot statistics; and (C) Verify3D; Figure S14: Homology modelled structure validation of PtrHECT13 using (A) Ramachandran plot; (B) Ramachandran plot statistics; and (C) Verify3D.

Author Contributions

Conceptualization, Y.F. and J.Y.; methodology, H.L. and Y.L.; software, H.Z.; validation, D.Y. and H.Z.; formal analysis, H.L.; investigation, Y.F.; resources, Y.L.; data curation, Y.L.; writing—original draft preparation, Y.F.; writing—review and editing, Y.F.; visualization, H.L.; supervision, H.Z.; project administration, D.Y.; funding acquisition, A.C. and J.Y. All authors have read and agreed to the published version of the manuscript.

Funding

This work was supported by the National Natural Science Foundation of China (No. 31870649) and the Innovation Project of the State Key Laboratory of Tree Genetics and Breeding (Northeast Forestry University) (2021A02).

Data Availability Statement

The research data are available upon request from the corresponding author.

Conflicts of Interest

The authors declare no conflicts of interest.

References

  1. Shu, K.; Yang, W. E3 Ubiquitin Ligases: Ubiquitous Actors in Plant Development and Abiotic Stress Responses. Plant Cell Physiol. 2017, 58, 1461–1476. [Google Scholar] [CrossRef] [PubMed]
  2. Mazzucotelli, E.; Belloni, S.; Marone, D.; De Leonardis, A.M.; Guerra, D.; Fonzo, N.; Cattivelli, L.; Mastrangelo, A.M. The E3 ubiquitin ligase gene family in plants: Regulation by degradation. Curr. Genom. 2006, 7, 509–522. [Google Scholar] [CrossRef] [PubMed]
  3. Lyzenga, W.J.; Stone, S.L. Abiotic stress tolerance mediated by protein ubiquitination. J. Exp. Bot. 2012, 63, 599–616. [Google Scholar] [CrossRef] [PubMed]
  4. Chen, L.Y.; Hellmann, H. Plant E3 Ligases: Flexible Enzymes in a Sessile World. Mol. Plant 2013, 6, 1388–1404. [Google Scholar] [CrossRef] [PubMed]
  5. Sharma, B.; Saxena, H.; Negi, H. Genome-wide analysis of HECT E3 ubiquitin ligase gene family in Solanum lycopersicum. Sci. Rep. 2021, 11, 15891. [Google Scholar] [CrossRef]
  6. Wang, Z.; Orosa-Puente, B.; Nomoto, M.; Grey, H.; Potuschak, T.; Matsuura, T.; Mori, I.C.; Tada, Y.; Genschik, P.; Spoel, S.H. Proteasome-associated ubiquitin ligase relays target plant hormone-specific transcriptional activators. Sci. Adv. 2022, 8, eabn4466. [Google Scholar] [CrossRef] [PubMed]
  7. Stone, S.L. The role of ubiquitin and the 26S proteasome in plant abiotic stress signaling. Front. Plant Sci. 2014, 5, 135. [Google Scholar] [CrossRef]
  8. Kim, H.T.; Kim, K.P.; Lledias, F.; Kisselev, A.F.; Scaglione, K.M.; Skowyra, D.; Gygi, S.P.; Goldberg, A.L. Certain pairs of ubiquitin-conjugating enzymes (E2s) and ubiquitin-protein ligases (E3s) synthesize nondegradable forked ubiquitin chains containing all possible isopeptide linkages. J. Biol. Chem. 2007, 282, 17375–17386. [Google Scholar] [CrossRef]
  9. Wang, M.; Pickart, C.M. Different HECT domain ubiquitin ligases employ distinct mechanisms of polyubiquitin chain synthesis. Embo J. 2005, 24, 4324–4333. [Google Scholar] [CrossRef]
  10. Scheffner, M.; Nuber, U.; Huibregtse, J.M. Protein ubiquitination involving an E1-E2-E3 enzyme ubiquitin thioester cascade. Nature 1995, 373, 81–83. [Google Scholar] [CrossRef]
  11. Guzmán, P. ATLs and BTLs, plant-specific and general eukaryotic structurally related E3 ubiquitin ligases. Plant Sci. 2014, 215, 69–75. [Google Scholar] [CrossRef]
  12. Duplan, V.; Rivas, S. E3 ubiquitin-ligases and their target proteins during the regulation of plant innate immunity. Front. Plant Sci. 2014, 5, 42. [Google Scholar] [CrossRef] [PubMed]
  13. Yee, D.; Goring, D.R. The diversity of plant U-box E3 ubiquitin ligases: From upstream activators to downstream target substrates. J. Exp. Bot. 2009, 60, 1109–1121. [Google Scholar] [CrossRef]
  14. Wang, Z.; Spoel, S.H. HECT ubiquitin ligases as accessory proteins of the plant proteasome. Essays Biochem. 2022, 66, 135–145. [Google Scholar] [CrossRef] [PubMed]
  15. Wang, M.; Cheng, D.M.; Peng, J.M.; Pickart, C.M. Molecular determinants of polyubiquitin linkage selection by an HECT ubiquitin ligase. Embo J. 2006, 25, 1710–1719. [Google Scholar] [CrossRef] [PubMed]
  16. Marín, I. Evolution of Plant HECT Ubiquitin Ligases. PLoS ONE 2013, 8, e68536. [Google Scholar] [CrossRef] [PubMed]
  17. Huibregtse, J.M.; Scheffner, M.; Beaudenon, S.; Howley, P.M. A family of proteins structurally and functionally related to the E6-AP ubiquitin-protein ligase. Proc. Natl. Acad. Sci. USA 1995, 92, 2563–2567. [Google Scholar] [CrossRef] [PubMed]
  18. Furniss, J.J.; Grey, H.; Wang, Z.; Nomoto, M.; Jackson, L.; Tada, Y.; Spoel, S.H. Proteasome-associated HECT-type ubiquitin ligase activity is required for plant immunity. PLoS Pathog. 2018, 14, e1007447. [Google Scholar] [CrossRef] [PubMed]
  19. Grau-Bové, X.; Sebé-Pedrós, A.; Ruiz-Trillo, I. A Genomic Survey of HECT Ubiquitin Ligases in Eukaryotes Reveals Independent Expansions of the HECT System in Several Lineages. Genome Biol. Evol. 2013, 5, 833–847. [Google Scholar] [CrossRef]
  20. Downes, B.P.; Stupar, R.M.; Gingerich, D.J.; Vierstra, R.D. The HECT ubiquitin-protein ligase (UPL) family in Arabidopsis:: UPL3 has a specific role in trichome development. Plant J. 2003, 35, 729–742. [Google Scholar] [CrossRef]
  21. Lan, W.; Qiu, S.; Ren, Y.; Miao, Y. Expression Profile and Function of HECT E3 sin Arabidopsis thaliana. Acta Bot. Boreali-Occident. Sin. 2017, 37, 2112–2119. [Google Scholar]
  22. Patra, B.; Pattanaik, S.; Yuan, L. Ubiquitin protein ligase 3 mediates the proteasomal degradation of GLABROUS 3 and ENHANCER OF GLABROUS 3, regulators of trichome development and flavonoid biosynthesis in Arabidopsis. Plant J. 2013, 74, 435–447. [Google Scholar] [CrossRef] [PubMed]
  23. Lan, W.; Ma, W.B.; Zheng, S.; Qiu, Y.H.; Zhang, H.; Lu, H.S.; Zhang, Y.; Miao, Y. Ubiquitome profiling reveals a regulatory pattern of UPL3 with UBP12 on metabolic-leaf senescence. Life Sci. Alliance 2022, 5, e202201492. [Google Scholar] [CrossRef] [PubMed]
  24. El Refy, A.; Perazza, D.; Zekraoui, L.; Valay, J.G.; Bechtold, N.; Brown, S.; Hülskamp, M.; Herzog, M.; Bonneville, J.M. The Arabidopsis KAKTUS gene encodes a HECT protein and controls the number of endoreduplication cycles. Mol. Genet. Genom. 2004, 270, 403–414. [Google Scholar] [CrossRef] [PubMed]
  25. Meng, X.W.; Yang, T.; Liu, J.; Zhao, M.D.; Wang, J.L. Genome-wide identification and evolution of HECT genes in wheat. PeerJ 2020, 8, e10457. [Google Scholar] [CrossRef]
  26. Lan, W.; Miao, Y. New Aspects of HECT-E3 Ligases in Cell Senescence and Cell Death of Plants. Plants 2019, 8, 483. [Google Scholar] [CrossRef] [PubMed]
  27. Meng, X.; Wang, C.; Rahman, S.U.; Wang, Y.; Wang, A.; Tao, S. Genome-Wide Identification and Evolution of HECT Genes in Soybean. Int. J. Mol. Sci. 2015, 16, 8517–8535. [Google Scholar] [CrossRef]
  28. Alam, I.; Cui, D.-L.; Batool, K.; Yang, Y.-Q.; Lu, Y.-H. Comprehensive Genomic Survey, Characterization and Expression Analysis of the HECT Gene Family in Brassica rapa L. and Brassica oleracea L. Genes 2019, 10, 400. [Google Scholar] [CrossRef]
  29. Miller, C.; Wells, R.; McKenzie, N.; Trick, M.; Ball, J.; Fatihi, A.; Dubreucq, B.; Chardot, T.; Lepiniec, L.; Bevan, M.W. Variation in Expression of the HECT E3 Ligase UPL3 Modulates LEC2 Levels, Seed Size, and Crop Yields in Brassica napus. Plant Cell 2019, 31, 2370–2385. [Google Scholar] [CrossRef]
  30. Xu, J.; Xing, S.; Cui, H.; Chen, X.; Wang, X. Genome-wide identification and characterization of the apple (Malus domestica) HECT ubiquitin-protein ligase family and expression analysis of their responsiveness to abiotic stresses. Mol. Genet. Genom. 2016, 291, 635–646. [Google Scholar] [CrossRef]
  31. Tuskan, G.A.; DiFazio, S.; Jansson, S.; Bohlmann, J.; Grigoriev, I.; Hellsten, U.; Putnam, N.; Ralph, S.; Rombauts, S.; Salamov, A.; et al. The genome of black cottonwood, Populus trichocarpa (Torr. & Gray). Science 2006, 313, 1596–1604. [Google Scholar] [CrossRef] [PubMed]
  32. Wang, H.; Leng, X.; Yang, J.; Zhang, M.; Zeng, M.; Xu, X.; Wang, F.; Li, C. Comprehensive analysis of AHL gene family and their expression under drought stress and ABA treatment in Populus trichocarpa. PeerJ 2021, 9, e10932. [Google Scholar] [CrossRef] [PubMed]
  33. Tao, R.; Liu, Y.Q.; Jing, W.P. Response and Regulatory Network Analysis of Roots and Stems to Abiotic Stress in Populus trichocarpa. Forests 2022, 13, 1300. [Google Scholar] [CrossRef]
  34. Goodstein, D.M.; Shu, S.Q.; Howson, R.; Neupane, R.; Hayes, R.D.; Fazo, J.; Mitros, T.; Dirks, W.; Hellsten, U.; Putnam, N.; et al. Phytozome: A comparative platform for green plant genomics. Nucleic Acids Res. 2012, 40, D1178–D1186. [Google Scholar] [CrossRef] [PubMed]
  35. El-Gebali, S.; Mistry, J.; Bateman, A.; Eddy, S.R.; Luciani, A.; Potter, S.C.; Qureshi, M.; Richardson, L.J.; Salazar, G.A.; Smart, A.; et al. The Pfam protein families database in 2019. Nucleic Acids Res. 2019, 47, D427–D432. [Google Scholar] [CrossRef] [PubMed]
  36. Potter, S.C.; Luciani, A.; Eddy, S.R.; Park, Y.; Lopez, R.; Finn, R.D. HMMER web server: 2018 update. Nucleic Acids Res. 2018, 46, W200–W204. [Google Scholar] [CrossRef] [PubMed]
  37. Chen, C.; Chen, H.; Zhang, Y.; Thomas, H.R.; Frank, M.H.; He, Y.; Xia, R. TBtools: An Integrative Toolkit Developed for Interactive Analyses of Big Biological Data. Mol. Plant 2020, 13, 1194–1202. [Google Scholar] [CrossRef]
  38. Letunic, I.; Khedkar, S.; Bork, P. SMART: Recent updates, new developments and status in 2020. Nucleic Acids Res. 2021, 49, D458–D460. [Google Scholar] [CrossRef]
  39. Horton, P.; Park, K.J.; Obayashi, T.; Fujita, N.; Harada, H.; Adams-Collier, C.J.; Nakai, K. WoLF PSORT: Protein localization predictor. Nucleic Acids Res. 2007, 35, W585–W587. [Google Scholar] [CrossRef]
  40. Gasteiger, E.; Gattiker, A.; Hoogland, C.; Ivanyi, I.; Appel, R.D.; Bairoch, A. ExPASy: The proteomics server for in-depth protein knowledge and analysis. Nucleic Acids Res. 2003, 31, 3784–3788. [Google Scholar] [CrossRef]
  41. Kumar, S.; Stecher, G.; Li, M.; Knyaz, C.; Tamura, K. MEGA X: Molecular Evolutionary Genetics Analysis across Computing Platforms. Mol. Biol. Evol. 2018, 35, 1547–1549. [Google Scholar] [CrossRef] [PubMed]
  42. Hu, B.; Jin, J.P.; Guo, A.Y.; Zhang, H.; Luo, J.C.; Gao, G. GSDS 2.0: An upgraded gene feature visualization server. Bioinformatics 2015, 31, 1296–1297. [Google Scholar] [CrossRef] [PubMed]
  43. Bailey, T.L.; Williams, N.; Misleh, C.; Li, W.W. MEME: Discovering and analyzing DNA and protein sequence motifs. Nucleic Acids Res. 2006, 34, W369–W373. [Google Scholar] [CrossRef] [PubMed]
  44. Lescot, M.; Dehais, P.; Thijs, G.; Marchal, K.; Moreau, Y.; Van de Peer, Y.; Rouze, P.; Rombauts, S. PlantCARE, a database of plant cis-acting regulatory elements and a portal to tools for in silico analysis of promoter sequences. Nucleic Acids Res. 2002, 30, 325–327. [Google Scholar] [CrossRef] [PubMed]
  45. Szklarczyk, D.; Franceschini, A.; Wyder, S.; Forslund, K.; Heller, D.; Huerta-Cepas, J.; Simonovic, M.; Roth, A.; Santos, A.; Tsafou, K.P.; et al. STRING v10: Protein–protein interaction networks, integrated over the tree of life. Nucleic Acids Res. 2015, 43, D447–D452. [Google Scholar] [CrossRef] [PubMed]
  46. Benkert, P.; Künzli, M.; Schwede, T. QMEAN server for protein model quality estimation. Nucleic Acids Res. 2009, 37, W510–W514. [Google Scholar] [CrossRef]
  47. Borrill, P.; Ramirez-Gonzalez, R.; Uauy, C. expVIP: A Customizable RNA-seq Data Analysis and Visualization Platform. Plant Physiol. 2016, 170, 2172–2186. [Google Scholar] [CrossRef]
  48. Phillips, G.C.; Garda, M. Plant tissue culture media and practices: An overview. In Vitro Cell. Dev. Biol. Plant 2019, 55, 242–257. [Google Scholar] [CrossRef]
  49. Li, Q.; Yeh, T.-F.; Yang, C.; Song, J.; Chen, Z.-Z.; Sederoff, R.R.; Chiang, V.L. Populus trichocarpa. Methods Mol. Biol. 2015, 1224, 357–363. [Google Scholar] [CrossRef]
  50. Huang, L.; Hua, K.; Xu, R.; Zeng, D.; Wang, R.; Dong, G.; Zhang, G.; Lu, X.; Fang, N.; Wang, D.; et al. The LARGE2-APO1/APO2 regulatory module controls panicle size and grain number in rice. Plant Cell 2021, 33, 1212–1228. [Google Scholar] [CrossRef]
  51. Li, Y.; Zhai, L.; Fan, J.; Ren, J.; Gong, W.; Wang, X.; Huang, J. Genome-wide identification, phylogenetic and expression analysis of the maize HECT E3 ubiquitin ligase genes. Genetica 2019, 147, 391–400. [Google Scholar] [CrossRef] [PubMed]
  52. Janda, T.; Szalai, G.; Pál, M. Salicylic Acid Signalling in Plants. Int. J. Mol. Sci. 2020, 21, 2655. [Google Scholar] [CrossRef] [PubMed]
  53. Ding, P.; Ding, Y. Stories of Salicylic Acid: A Plant Defense Hormone. Trends Plant Sci. 2020, 25, 549–565. [Google Scholar] [CrossRef] [PubMed]
  54. Malcheska, F.; Ahmad, A.; Batool, S.; Müller, H.M.; Ludwig-Mueller, J.; Kreuzwieser, J.; Randewig, D.; Hänsch, R.; Mendel, R.R.; Hell, R.; et al. Drought-Enhanced Xylem Sap Sulfate Closes Stomata by Affecting ALMT12 and Guard Cell ABA Synthesis. Plant Physiol. 2017, 174, 798–814. [Google Scholar] [CrossRef]
  55. Yoshida, T.; Fernie, A.R. Hormonal regulation of plant primary metabolism under drought. J. Exp. Bot. 2023, erad358. [Google Scholar] [CrossRef] [PubMed]
  56. Wang, H.Z.; Leng, X.; Xu, X.M.; Li, C.H. Comprehensive Analysis of the TIFY Gene Family and Its Expression Profiles under Phytohormone Treatment and Abiotic Stresses in Roots of Populus trichocarpa. Forests 2020, 11, 315. [Google Scholar] [CrossRef]
  57. Wang, X.; Gomes, M.M.; Bailly, C.; Nambara, E.; Corbineau, F. Role of ethylene and proteolytic N-degron pathway in the regulation of Arabidopsis seed dormancy. J. Integr. Plant Biol. 2021, 63, 2110–2122. [Google Scholar] [CrossRef]
  58. Miao, Y.; Zentgraf, U. A HECT E3 ubiquitin ligase negatively regulates Arabidopsis leaf senescence through degradation of the transcription factor WRKY53. Plant J. 2010, 63, 179–188. [Google Scholar] [CrossRef]
Figure 1. The chromosome locations and segmental paralogous pairs of PtrHECT gene family members.
Forests 15 00169 g001
Figure 2. Phylogenetic tree of the HECT gene family in Populus trichocarpa, Arabidopsis thaliana, Malus domestica, Glycine max, Oryza sativa, Zea mays and Triticum aestivum.
Forests 15 00169 g002
Figure 3. The conserved domains of PtrHECT proteins.
Forests 15 00169 g003
Figure 4. Gene structure (A) and protein conserved motifs (B) of the HECT subfamily in Populus trichocarpa.
Forests 15 00169 g004
Figure 5. Distribution of cis-elements in PtrHECT promoter regions.
Forests 15 00169 g005
Figure 6. The predicted protein interaction networks of PtrHECT proteins (AM).
Forests 15 00169 g006
Figure 7. Three-dimensional structures of PtrHECT E3 ubiquitin ligase proteins.
Forests 15 00169 g007
Figure 8. Heatmap of PtrHECT gene expression patterns in different tissues.
Forests 15 00169 g008
Figure 9. The relative expression level of PtrHECT genes under drought treatment in roots (AM) and leaves (NZ). Error bars represent deviations from three biological replicates. The x-axis represents the stress duration, and the y-axis represents the relative expression of the gene. The asterisk represents the difference in transcript abundance from the control (* p < 0.05, ** p < 0.01).
Forests 15 00169 g009
Figure 10. The relative expression level of PtrHECT genes under salt treatment in roots (AM) and leaves (NZ). Error bars represent deviations from three biological replicates. The x-axis represents the stress duration, and the y-axis represents the relative expression of the gene. The asterisk represents the difference in transcript abundance from the control (* p < 0.05, ** p < 0.01).
Forests 15 00169 g010
Table 1. Characteristic analysis of PtrHECT family genes.
Gene NameGene IDProtein Length (a.a.)Molecular Weight (Da)Theoretical pIGRAVYThe Predicted Location of PtrHECT Proteins
PtrHECT1Potri.001G3686003756411,293.514.95−0.213Nuclear
PtrHECT2Potri.002G1105003667405,141.715.1−0.281Plas
PtrHECT3Potri.004G1747001877201,786.15.97−0.308Nuclear
PtrHECT4Potri.006G011700840953,69.616.34−0.129Nuclear
PtrHECT5Potri.006G1320001074119,539.135.15−0.164Nuclear
PtrHECT6Potri.008G1013001033117,999.936.75−0.161Cytoplasmic
PtrHECT7Potri.009G1343001895203,638.895.62−0.315Nuclear
PtrHECT8Potri.010G1500001032118,051.546.41−0.178Cytoplasmic
PtrHECT9Potri.011G0941003749411,209.54.96−0.214Nuclear
PtrHECT10Potri.016G01290085397,311.886.24−0.18Nuclear
PtrHECT11Potri.016G05980078288,833.735.95−0.192Nuclear
PtrHECT12Potri.016G0852001512169,298.315.31−0.11E.R._plas
PtrHECT13Potri.016G0965001173132,025.067.88−0.105Chloroplast
Disclaimer/Publisher’s Note: The statements, opinions and data contained in all publications are solely those of the individual author(s) and contributor(s) and not of MDPI and/or the editor(s). MDPI and/or the editor(s) disclaim responsibility for any injury to people or property resulting from any ideas, methods, instructions or products referred to in the content.

