Article

Detecting the Short-Term Effects of Water Stress on Radiata Pine Physiology Using Thermal Imagery

1
Scion, 10 Kyle Street, Christchurch 8011, New Zealand
2
Waikato Regional Council, 160 Ward Street, Hamilton 3204, New Zealand
3
Scion, 49 Sala Street, Rotorua 3046, New Zealand
*
Author to whom correspondence should be addressed.
Forests 2024, 15(1), 28; https://doi.org/10.3390/f15010028
Submission received: 6 December 2023 / Revised: 14 December 2023 / Accepted: 20 December 2023 / Published: 22 December 2023
(This article belongs to the Section Forest Ecophysiology and Biology)

Abstract

:
Despite the utility of thermal imagery for characterising the impacts of water stress on plant physiology, few studies have been undertaken on plantation-grown conifers, including the most widely planted exotic species, radiata pine. Using data collected from a pot trial, where water was withheld from radiata pine over a nine-day period, the objectives of this study were to (i) determine how rapidly key physiological traits change in response to water stress and (ii) assess the utility of normalised canopy temperature, defined as canopy temperature–air temperature (Tc–Ta), for detecting these physiological changes. Volumetric water content remained high in the well-watered control treatment over the course of the experiment (0.47–0.48 m3 m−3) but declined rapidly in the water stress treatment from 0.47 m3 m−3 at 0 days after treatment (DAT) to 0.04 m3 m−3 at 9 DAT. There were no significant treatment differences in measurements taken at 0 DAT for Tc–Ta, stomatal conductance (gs), transpiration rate (E) or assimilation rate (A). However, by 1 DAT, differences between treatments in tree physiological traits were highly significant, and these differences continued diverging with values in the control treatment exceeding those of trees in the water stress treatment at 9 DAT by 42, 43 and 61%, respectively, for gs, E and A. The relationships between Tc–Ta and the three physiological traits were not significant at 0 DAT, but all three relationships were highly significant from as early as 1 DAT onwards. The strength of the relationships between Tc–Ta and the three physiological traits increased markedly over the duration of the water stress treatment, reaching a maximum coefficient of determination (R2) at 7 DAT when values were, respectively, 0.87, 0.86 and 0.67 for gs, E and A. The early detection of changes in tree physiology from 1 DAT onwards suggests that thermal imagery may be useful for a range of applications in field-grown radiata pine.

1. Introduction

Gas exchange, water transport, carbon metabolism and growth decline in tree species during periods of drought stress. Physiological responses of different species vary depending on their sensitivity to drought and the timing, intensity and duration of the drought [1,2,3]. Initial responses to drought are primarily physiological rather than structural. The onset of drought rapidly induces reductions in stomatal conductance (gs) and rates of carbon assimilation (A) in most tree species, and needle water potential declines under droughts with a short–moderate-term duration [1,2]. Plant morphology and development are more strongly influenced by moderate-to-long-term drought, which results in loss of hydraulic conductivity, reductions in leaf water content and rates of leaf growth, increases in the root:shoot ratio and, under severe drought, defoliation and mortality [2,4,5].
Leaf temperature obtained from thermal imagery has been widely used to predict water stress. Reductions in gs in response to water stress result in decreased transpiration (E) and latent heat, which increases the sensible heat flux and leaf temperature for a given net radiation [6]. Although variability in gs is the dominant influence on changes in the leaf temperature for a given level of radiation [7], other meteorological variables, soil conditions and canopy properties also affect leaf temperature [6,8]. The influence of environmental factors on leaf temperature has been accounted for through the development of a number of indices [8], of which the difference between canopy and air temperature (Tc–Ta) and crop water stress index (CWSI) [9] are the most widely used.
Canopy temperature and derived indices have been extensively utilised to accurately characterise spatial variation in gs and other indicators of drought stress within agricultural crops [10,11,12,13]. However, the use of thermal imagery in tree species has been mainly confined to orchard crops. These studies have demonstrated moderate to strong correlations between thermal indices and key physiological indicators of water stress in apple [14], olive [15,16,17], almond [18], peach [19] and citrus trees [20,21,22].
Less research has used thermal imaging to detect water stress in forests, and most studies have focussed on the detection of moderate-to-severe droughts. Using data acquired from a fixed platform, droughted European beech (Fagus sylvatica L.) seedlings had a significantly higher leaf temperature than irrigated controls, and leaf temperature was strongly correlated with net photosynthesis in both treatments [23]. Canopy foliage temperature was linked to sap flow and soil water potential for six mature deciduous species growing at moist and dry sites, and there were substantial increases in ΔTc–Ta as the drought progressed at dry sites, which was broadly associated with reduced transpiration rates for all but two species [24]. Thermal data acquired from an Unmanned Aerial Vehicle (UAV) over a field trial comprising genotypes of black poplar (Populus nigra) were used to establish a significant correlation between canopy temperature and gs, and this relationship was used to identify drought-tolerant genotypes [25]. Drought stress responses of Scots pine (Pinus sylvestris L.) from six provenances were significantly related to CWSI, and this stress response was found to depend on seedling provenance [26]. Thermal imagery has not been widely used to detect drought stress in conifers, which have challenging structural features, such as narrow needles, and with a few exceptions [26,27,28], these species are underrepresented in the literature.
Radiata pine (Pinus radiata D. Don) is the most widely planted exotic species in the world [5], and significant areas of this conifer have been established in many countries, including Spain, Chile, South Africa, New Zealand and Australia [29,30]. An appealing feature of the species is that it exhibits wide climatic tolerance [31,32], and consequently, many plantations have been established in areas with severe seasonal water deficits that are likely to become more arid under climate change [33]. Radiata pine exhibits behaviour typical of a strongly isohydric species [34] in which stomata close rapidly in response to water stress, which maintains relatively high leaf water potential and confers drought resistance, albeit at the expense of lower assimilation rates [35]. Over longer droughts that last for months, water potential declines and needles dehydrate, and this eventual loss in leaf water can be detected through the use of water indices derived from hyperspectral imagery [36].
As needles desiccate slowly over a period that exceeds typical drought duration, the detection of immediate changes in gs is likely to be more useful for characterising water stress than the detection of slower changes in needle water content. Despite the sensitivity of growth in radiata pine to dry conditions, thermal imagery has not been used to detect short-term water stress in this important species. Using data collected from a pot trial of young radiata pine, the objectives of this study were to (i) determine how rapidly gs, E and A change in response to a short-term water stress lasting for nine days and (ii) assess the utility of Tc–Ta for detecting these physiological changes.

2. Materials and Methods

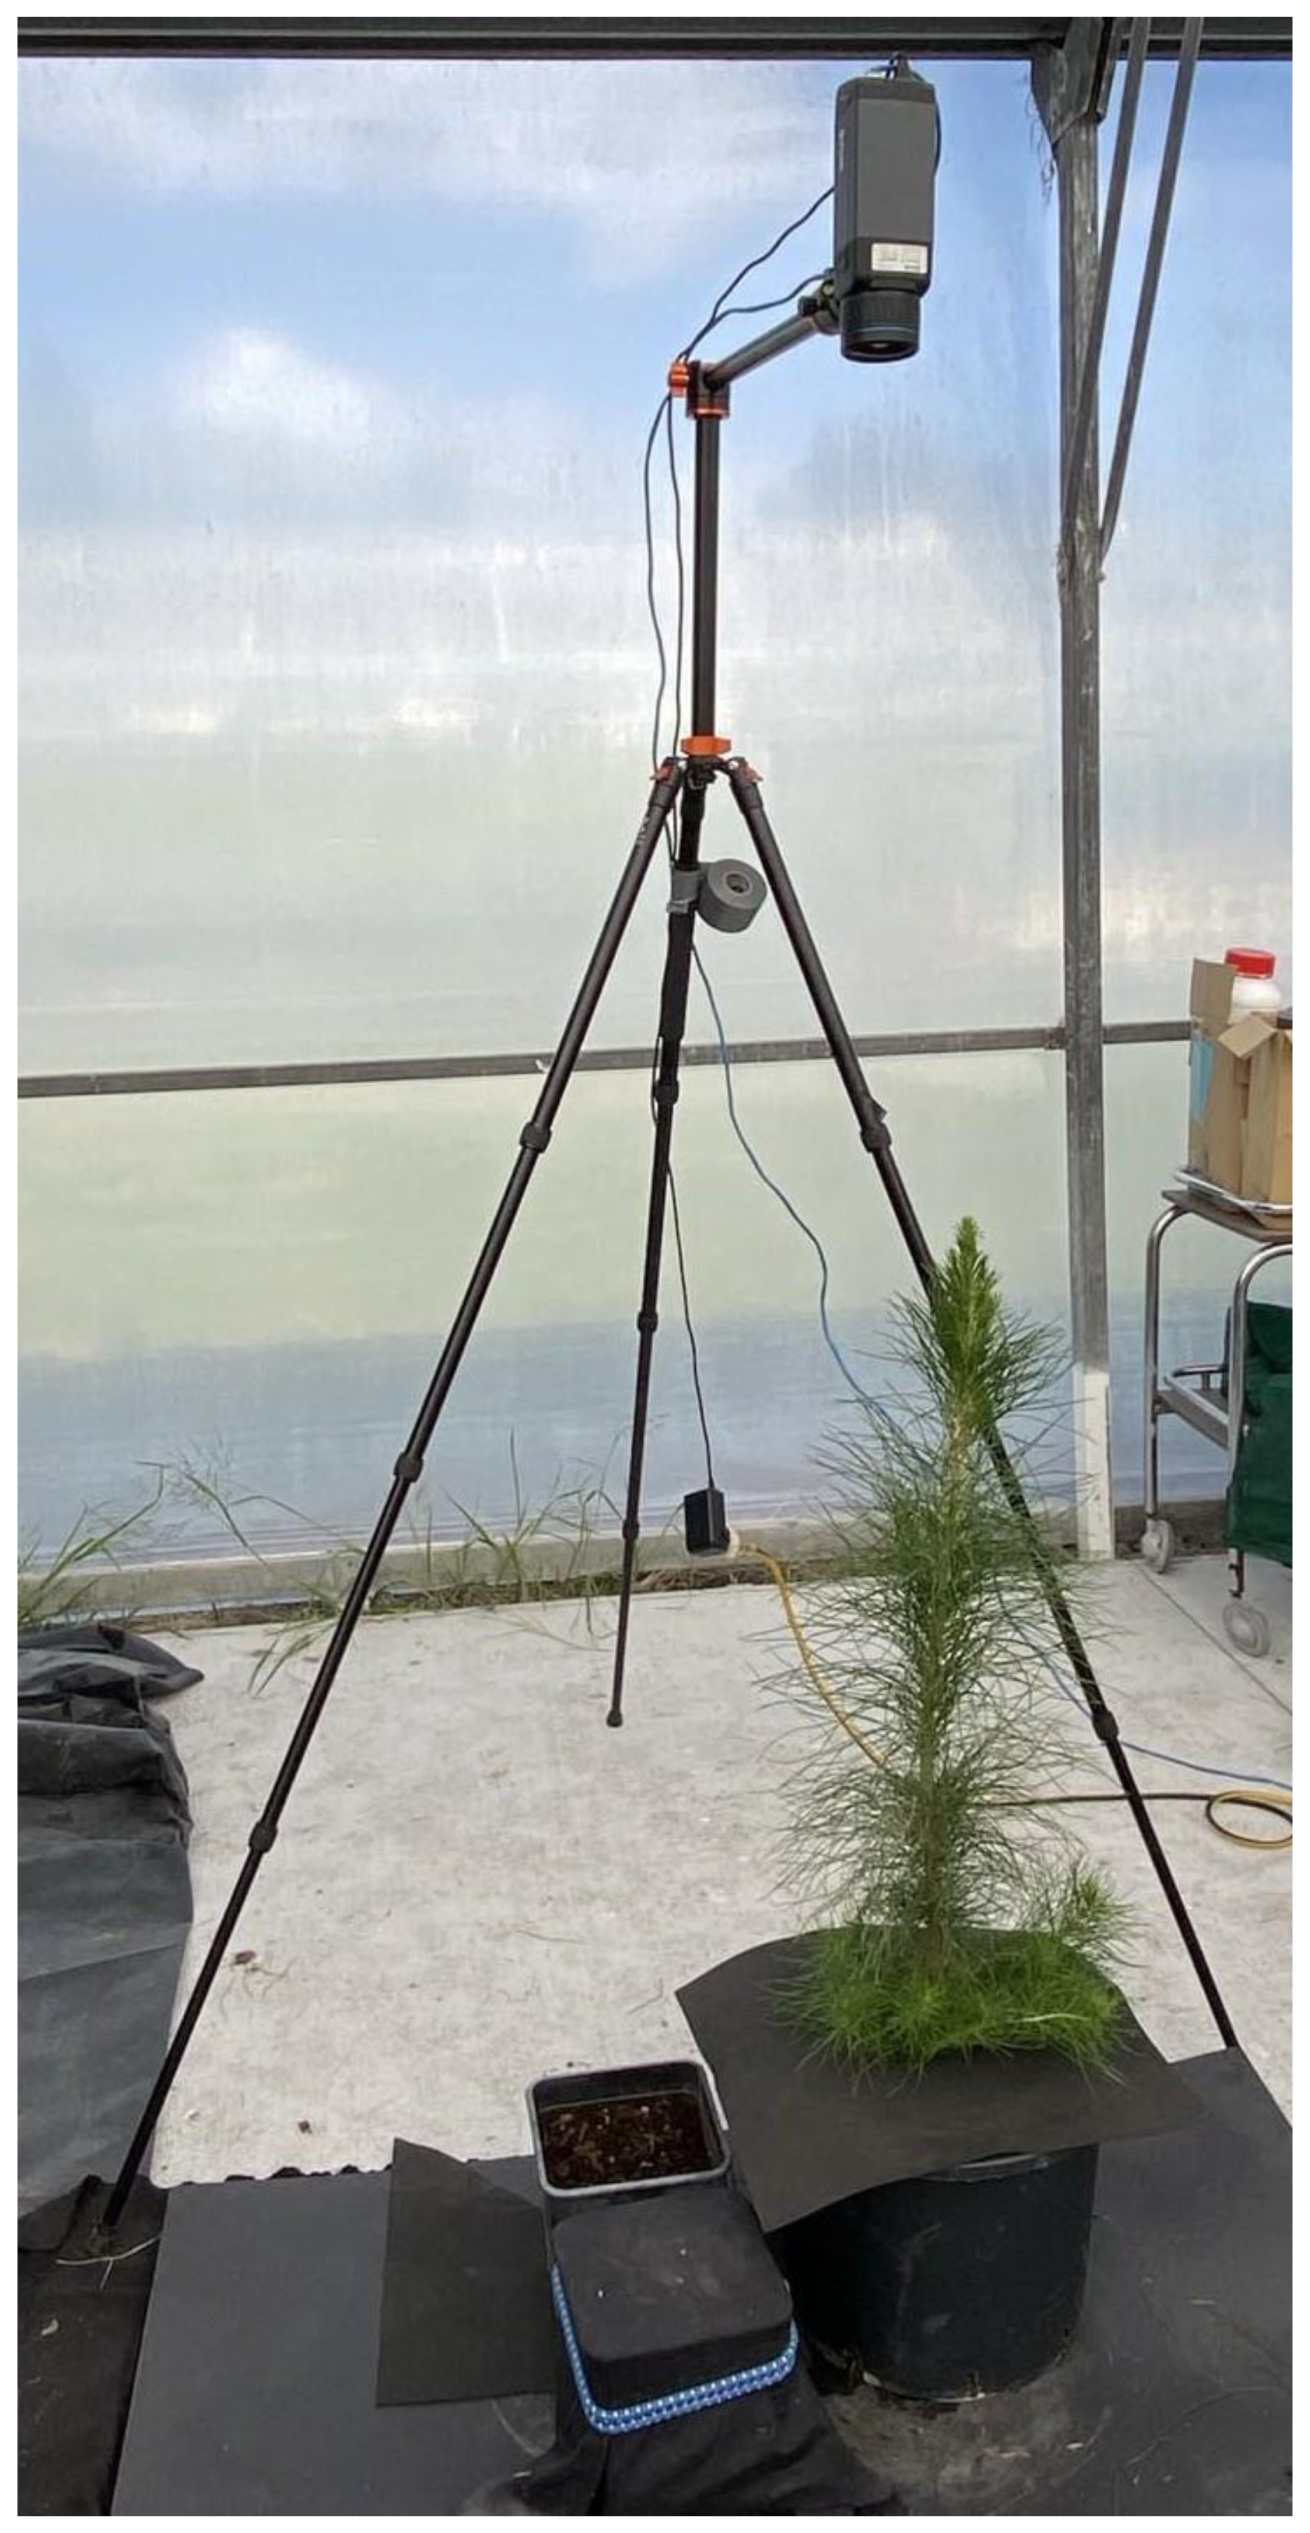
2.1. Experimental Set-Up and Measurement Dates

A total of 60 radiata pine seedlings were transplanted into 20 L pots (32 cm diameter, 26 cm height) with potting mix during spring 2021. The potting mix combined pH-adjusted composted bark fines (55%), bark fibre (30%) and 7 mm pumice (15%). It was enriched with a complete set of fertilisers, including Osmocote controlled-release fertiliser at recommended levels.
These seedlings were placed in a glasshouse and watered regularly until the start of the experiment. In late February 2022, trees were randomly allocated to control and water stress treatments. The experiment started on 22 February, and from this date onwards, the control was regularly watered, with the first application on 23 February, until the conclusion of the experiment on 4 March. The water-stressed plants did not receive any water over this nine-day period, and pre-treatment measurements made the day before water was withheld were designated as the treatment starting point, i.e., days after treatment (DAT) = 0.
Ten of the sixty trees were set aside (five/treatment) to continuously monitor root-zone volumetric water content (θ). Within each pot, calibrated CS655 multiparameter smart sensors (Campbell Scientific Inc., Logan, UT, USA) were installed to a depth of 12 cm and measured θ across a soil volume of 3.6 L. All sensors were connected to a CR1000X data logger (Campbell Scientific Inc., Logan, UT, USA), and observations were recorded on an hourly basis.
The full set of measurements, which are described below, were taken from the remaining 50 trees (25 trees/treatment). A set of pre-treatment measurements were taken from these trees on 22nd February. Five post-treatment measurements were made at two daily intervals on 24, 26 and 28 February and on 2 and 4 March 2022, which were, respectively, 1, 3, 5, 7 and 9 DAT and covered the range in θ experienced by the water-stressed trees.
The measurements for the six captures were typically completed over a four-hour period during the morning, and measurements were alternated between treatments. Room air temperature and relative humidity were continuously measured during each capture using an air temperature and relative humidity probe (HMP155A, Vaisala Oyi, Vantaa, Finland), and vapour pressure deficit (VPD) was derived from these data using standard formulae. With the exception of the baseline capture (mean VPD = 2.44 kPa), mean VPD was very similar between the five post-treatment captures, ranging from 1.74 to 1.77 kPa from 1 DAT to 7 DAT, while a slightly lower mean VPD of 1.60 kPa was recorded for the capture on 9 DAT. Mean air temperature was 30.1 °C for the baseline measurements (0 DAT) and relatively similar for remaining captures ranging from 22.9 °C (4 DAT) to 25.6 °C (3 DAT). Mean tree dimensions taken at the end of the trial did not significantly differ between treatments and averaged, respectively, 90.5 cm, 33.6 cm and 14.6 mm for height, crown diameter and root collar diameter.

2.2. Thermal Measurements

Canopy level thermal measurements were acquired using a thermal camera (FLIR A655SC, Teledyne FLIR LLC, Wilsonville, OR, USA). This camera has a spectral response in the range of 7.5µm-14µm and can detect temperature differences as small as 50 mK. The image resolution of the camera is 640 × 480 pixels. The thermal camera was mounted with a nadir orientation directly above the plant on a 2 m tripod and was controlled using FLIR systems (2020) Research IR Max (Version 4.40.11.35) software. The base of the plant was covered with a black mat to shield the soil and facilitate accurate tree crown delineation (see Appendix A, Figure A1).
The image capture process follows the method described in detail in Watt et al. [37]. Images were captured in 16-bit tiff format. Values for air temperature, relative humidity, emissivity and distance to the target were entered into the Research IR software to improve accuracy after each acquisition. Target distance was set at 2 m, emissivity was set to 0.98 [38], and average air temperature and humidity were determined for each captured image using the previously described probe (HMP155A, Vaisala Oyi, Finland).
Two separate containers, one with a black cotton cloth and another filled with damp soil, were placed on either side of the plant within the field of view and used as calibration targets (see Appendix A, Figure A1). The thermal camera and a handheld thermometer (FLIR TG65, Teledyne FLIR LLC, Wilsonville, OR, USA) were used to record temperatures of these containers during capture. Using data pooled by capture day, a linear regression was constructed between the temperature taken from the camera (x variable) and the thermometer (y variable) on these calibration targets.
The canopy of individual plants was accurately delineated using object-based image segmentation algorithms in the Fiji package of ImageJ software version 1.53p [39]. For each captured image, canopy temperature was determined from the mean temperature of the delineated crown. The recorded canopy temperature for each plant was inputted into the appropriate calibration equation (described above) as the independent variable (x variable), and the resulting prediction provided the calibrated value of canopy temperature, Tc. These values of Tc were coupled with ambient temperature acquired at the time of measurement, Ta, and used to determine Tc–Ta for each tree.

2.3. Measurements of Photosynthesis and Stomatal Conductance

Physiological measurements for the trees were taken at a similar time to the thermal data capture. These measurements were taken by a GFS-3000 coupled with an Imaging-PAM chlorophyll fluorometer (M-series, Walz, Effeltrich, Germany) that was equipped with a CO2 cartridge to maintain CO2 at a constant level. The GFS-3000 is a portable gas exchange and fluorescence system suitable for controlled settings. The instrument includes a control unit that has a CO2 and H2O analyser, which is connected to a measuring head that contains the ventilation system, temperature and light control. All environmental parameters that are relevant to plant photosynthesis can be controlled over the full physiological range using this instrument. In this experiment, stomatal conductance (gs), transpiration (E) and net photosynthetic rates (A) were measured after a two-minute pre-illumination period at 400 ppm CO2 concentration.

2.4. Data Analysis

All analyses were undertaken using R [40]. Volumetric water content, the three physiological variables and Tc–Ta were plotted against DAT by treatment to examine how these variables changed over time. For each DAT, correlations were examined between Tc–Ta and the physiological variables using a second-order polynomial where significant and a linear form where the squared term was not significant. The correlation significance was determined from the P value, and the accuracy was assessed using the coefficient of determination (R2).

3. Results

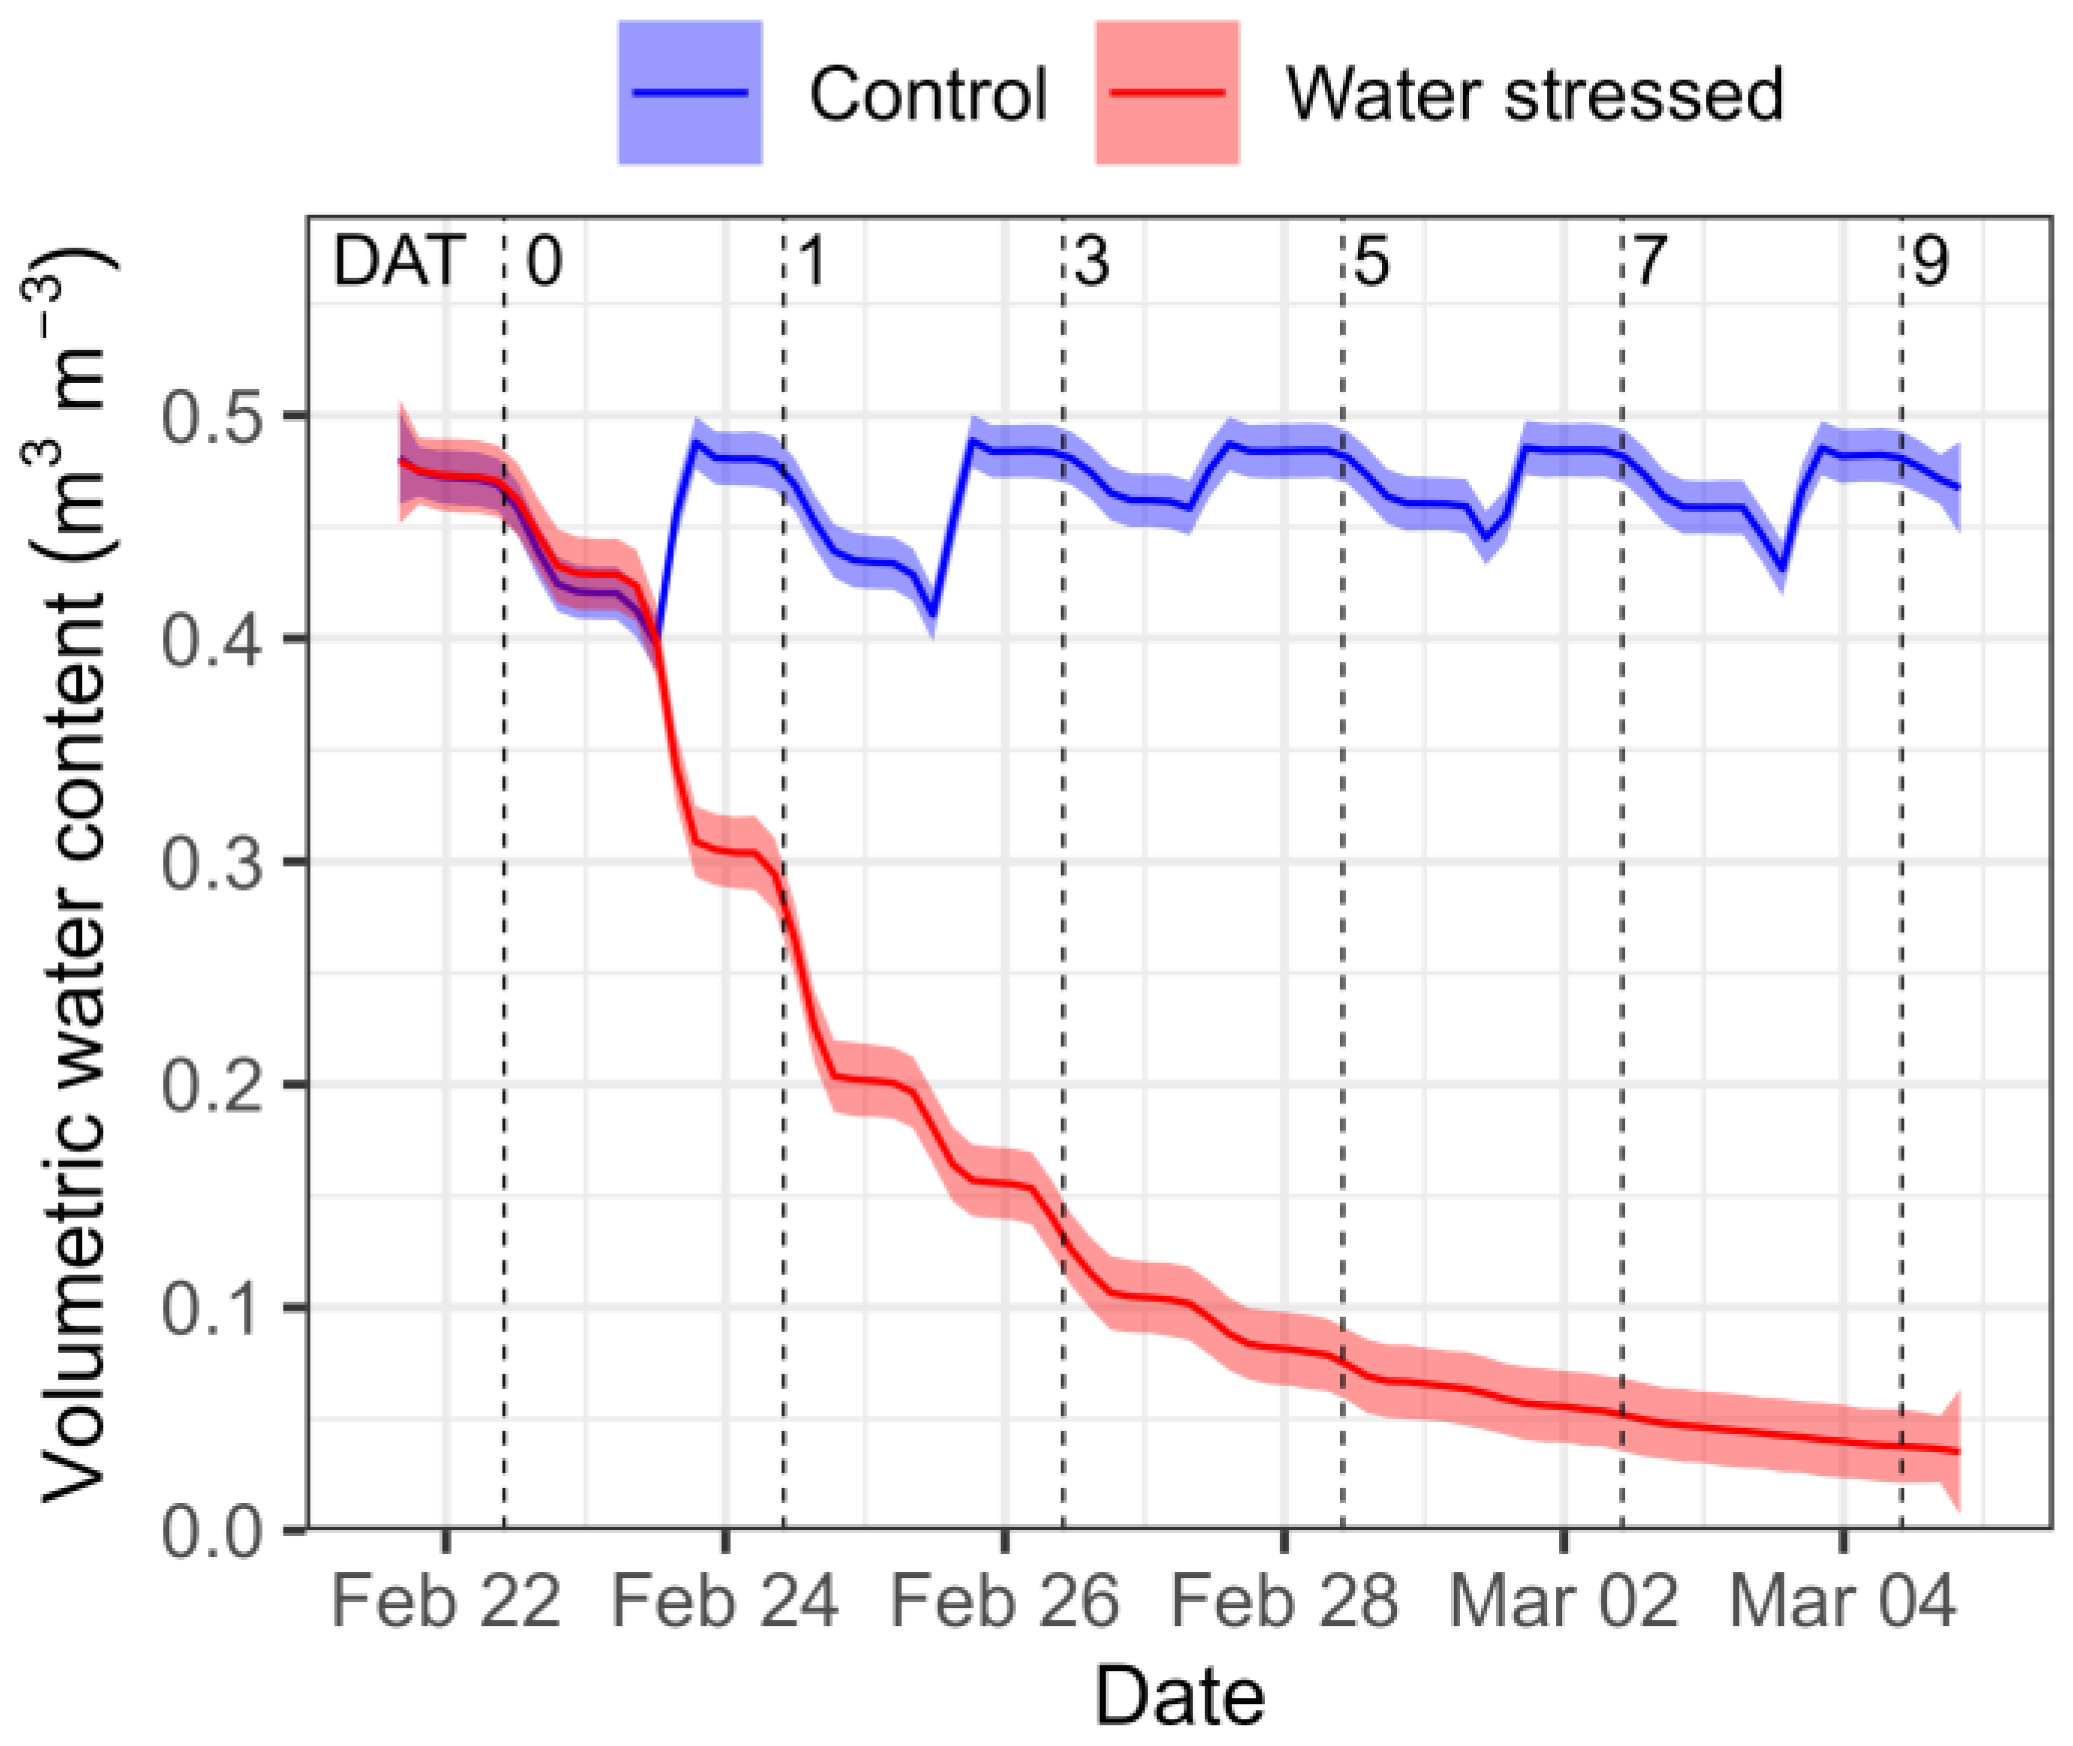
3.1. Variation in Root-Zone Volumetric Water Content

Mean values of θ in the control ranged from 0.38 to 0.49 m3 m−3 over the course of the experiment (Figure 1) and fluctuated narrowly between the six measurement campaigns (0.47–0.48 m3 m−3). In the water stress treatment, mean θ exponentially declined from 0.47 m3 m−3 to 0.04 m3 m−3. Treatment differences in θ were insignificant for the pre-treatment measurement (p = 0.89), but values of θ in the water stress treatment were significantly lower than the control by 1 DAT (p < 0.01) and for all subsequent (p < 0.001) measurements from 3–9 DAT (Figure 1). Values of θ for the water-stressed trees declined from 0.47 m3 m−3 for the pre-treatment measure (0 DAT) to 0.28 (1 DAT), 0.13 (3 DAT), 0.08 (5 DAT), 0.05 (7 DAT) and 0.04 m3 m−3 (9 DAT) for the five post-treatment measures (Figure 1).

3.2. Variation in Physiological Measurements and Tc–Ta

Despite some temporal fluctuations, gs, E and A in the control treatment remained high over the course of the experiment (Figure 2). During the pre-treatment measurement, mean values of gs, E and A were very similar between control and water stress treatments and did not significantly differ at this time. However, the imposition of water stress had an immediate effect on all three variables. Treatment differences for all three physiological variables were significant (p = 0.05) by 1 DAT and highly significant by 3, 5, 7 and 9 DAT (Figure 2). Values of gs within the water stress treatment were reduced, respectively, to 81, 73, 54, 55 and 42% of the control values by 1, 3, 5, 7 and 9 DAT, reaching a minimum of 106 mmol m−2 s−1 by 9 DAT. Changes in E closely followed the pattern of gs and within the water stress treatment were reduced, respectively, to 80, 74, 56, 57 and 43% of control values, reaching a minimum of 1.07 mmol m−2 s−1 by 9 DAT. Similarly, values of A were, respectively, reduced to 88, 81, 77, 71 and 61% of control values by 1, 3, 5, 7 and 9 DAT with mean minimum values of 10.8 µmol m−2 s−1 (Figure 2).
Changes in Tc–Ta closely followed the pattern of changes in the three physiological variables (Figure 2d). There was no significant difference in Tc–Ta at 0 DAT, and differences were marginally insignificant at 1 DAT (p = 0.11). However, by 3 DAT treatment, differences were significant (p = 0.016) and were highly significant (p <0.001) for the remaining three captures. Values of Tc–Ta in the control declined over the course of the experiment from 2.84 °C at 0 DAT to 2.37 °C at 9 DAT. As Tc–Ta increased markedly in the water stress treatment over the same period, there was a strong divergence in Tc–Ta between treatments over time. Values of Tc–Ta in the water stress treatment exceeded those of the control by 5, 8, 11, 13, 32, 42 and 47%, respectively, by 0, 1, 3, 5, 7 and 9 DAT (Figure 2d).

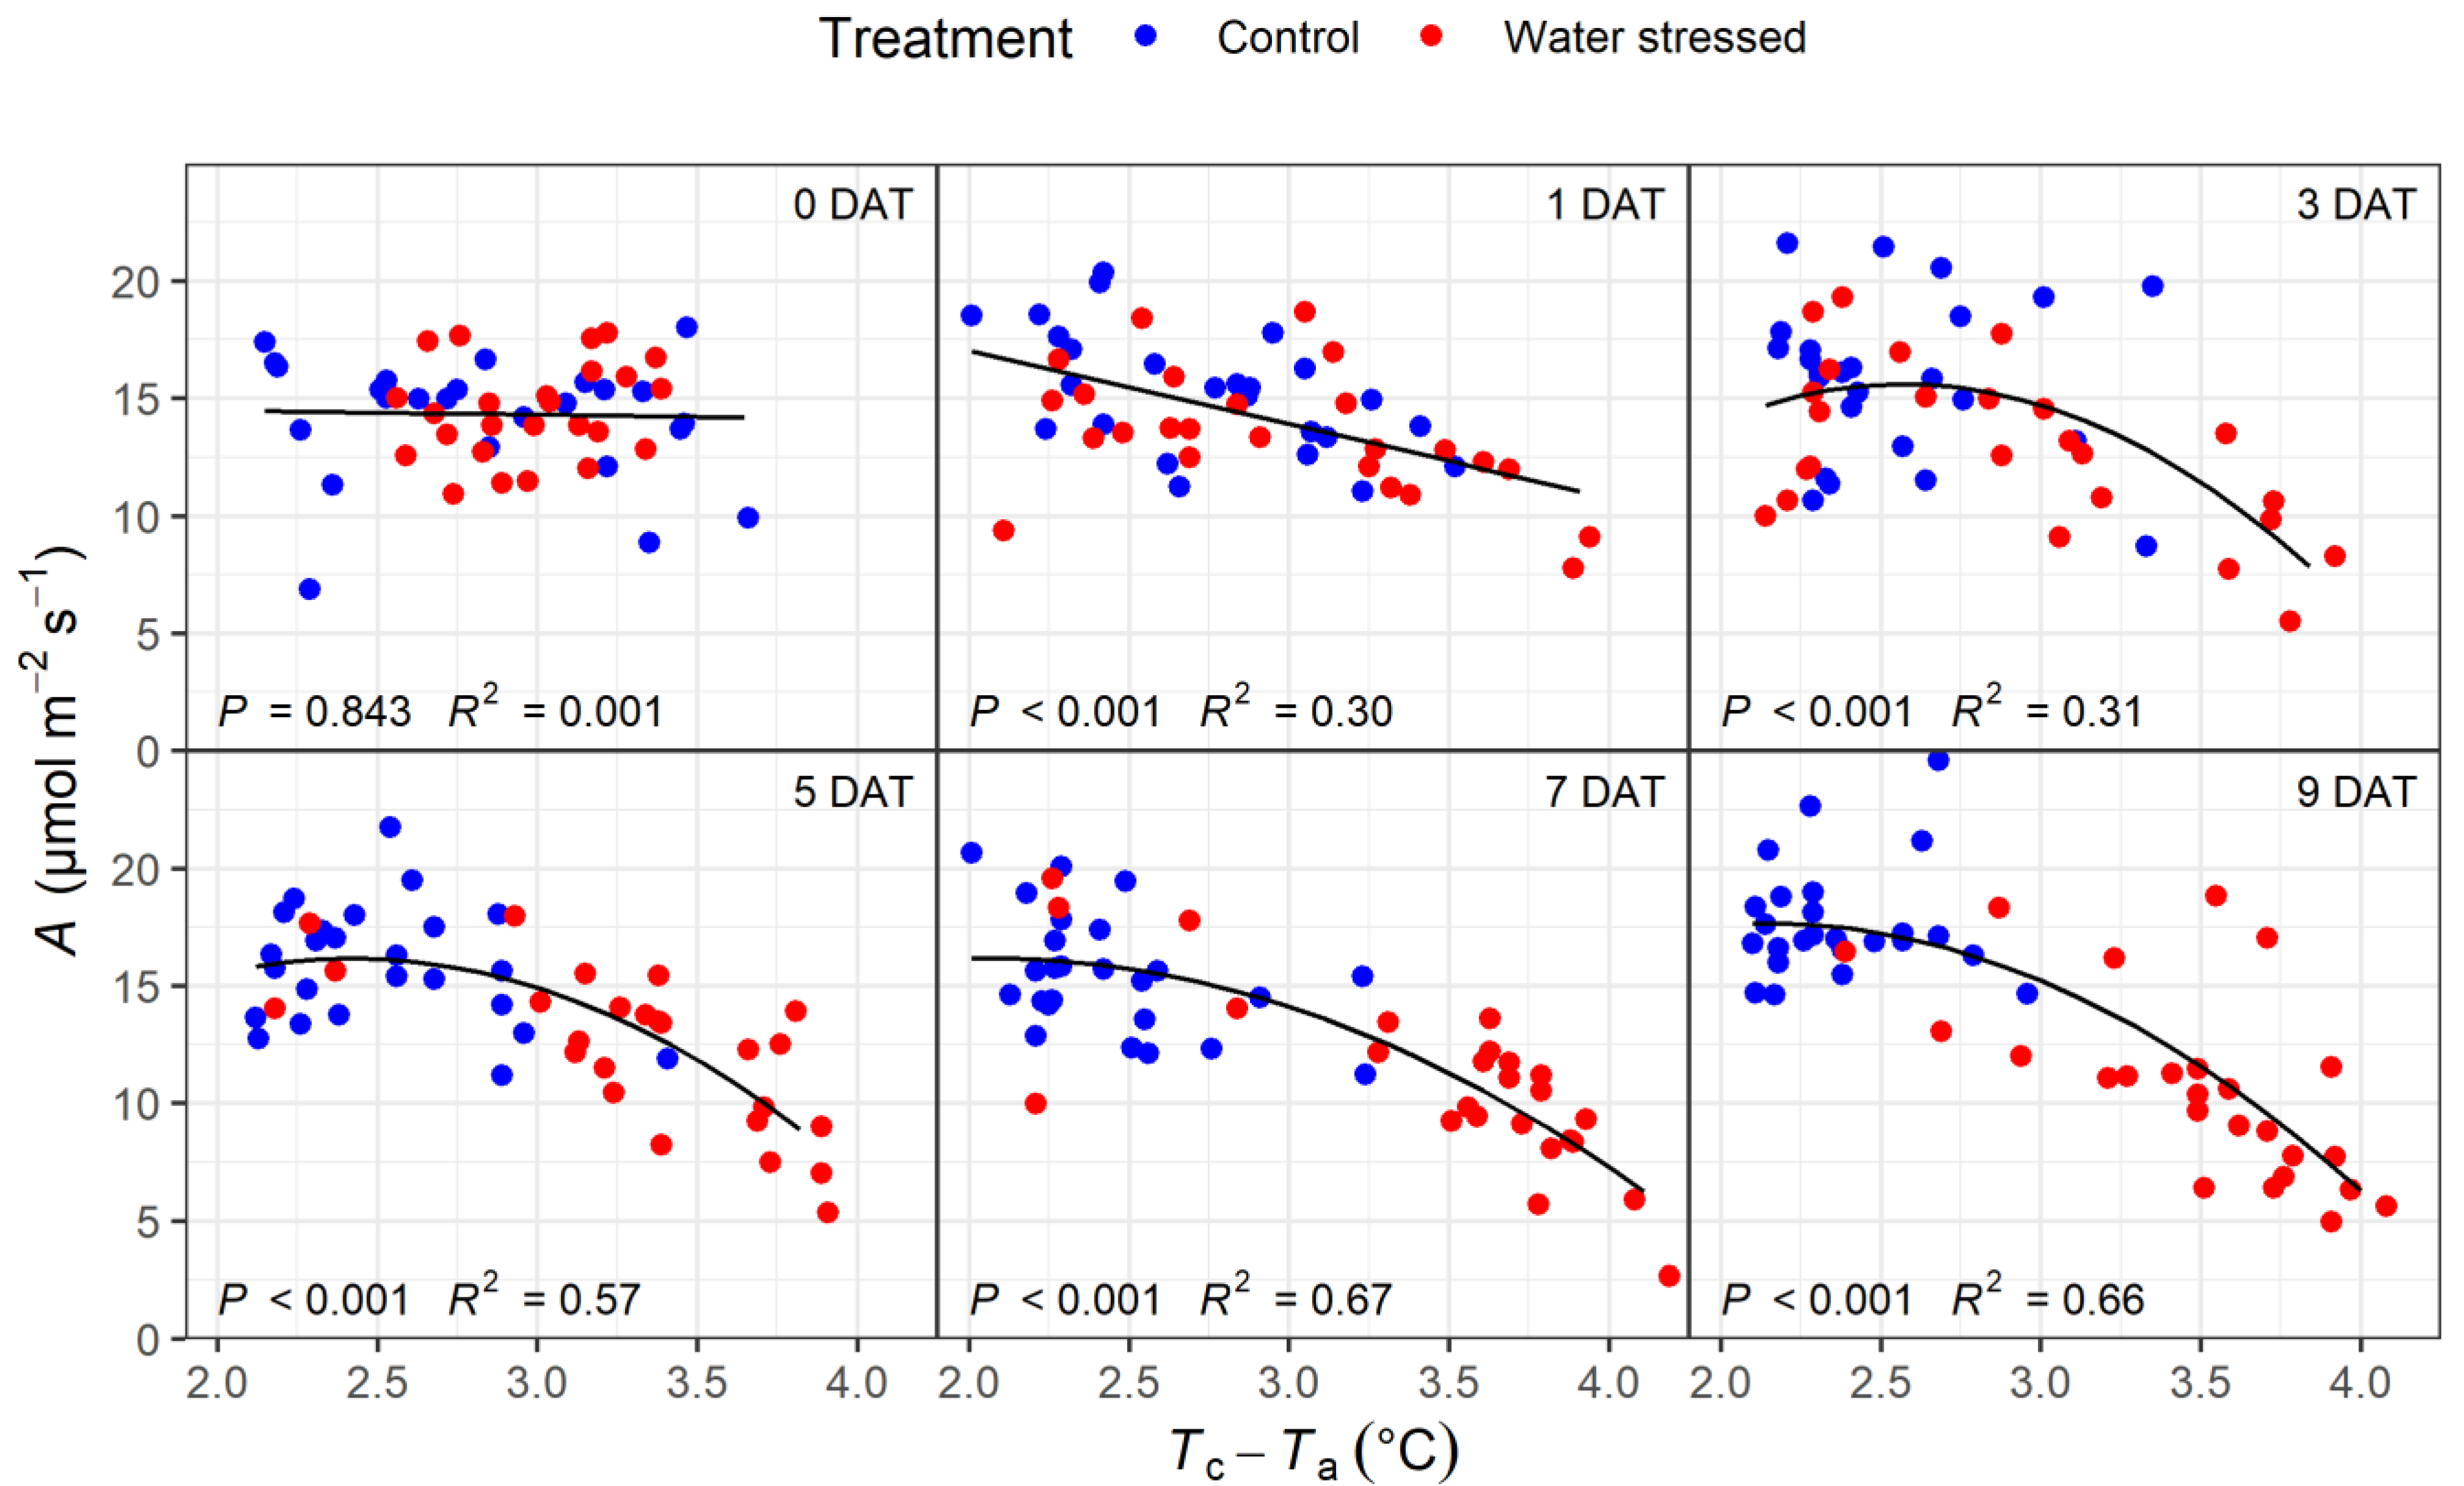
3.3. Correlations of Physiological Variables with Tc–Ta

The relationship between Tc–Ta and gs was insignificant, with little correlation (R2 = 0.01; p = 0.453) during pre-treatment measurements at 0 DAT (Figure 3). However, by 1 DAT, a highly significant polynomial relationship was observed between these variables that had moderate strength (R2 = 0.42; p < 0.001), with the accuracy slightly reducing by 3 DAT (R2 = 0.31; p < 0.001). However, there was a significant increase in the strength of this relationship by 5 DAT, and the relationship reached a maximum correlation at 7 DAT (R2 = 0.87; p < 0.001) when θ in the water stress treatment reached 0.05 m3 m−3 (Figure 3).
A very similar pattern was observed between Tc–Ta and E. The relationship was not significant during the baseline capture at 0 DAT, but correlations between Tc–Ta and E for all the post-treatment captures were highly significant (p < 0.001). The strength of the relationship increased markedly from 0 DAT (R2 = 0.002) to 1 DAT (R2 = 0.43) before declining slightly at 3 DAT (R2 = 0.31). During captures after this point, strong relationships were observed between Tc–Ta and E, with the coefficient of determination ranging from 0.71 to 0.86, with the peak strength occurring at 7 DAT.
Relationships between Tc–Ta and A generally increased in strength with DAT (Figure 4) but were not as strong as those observed for E and gs (Figure 3). The relationship between Tc–Ta and A was not significant at 0 DAT but was highly significant (p < 0.001) for all five post-treatment captures. Marked increases in the coefficient of determination for the relationship occurred between the pre-treatment capture (R2 = 0.001) and 1 DAT (R2 = 0.30), and the relationship reached a maximum strength at 7 DAT (R2 = 0.67) (Figure 4).
The baseline captures at 0 DAT showed there was little change in any of the three variables across the captured range in Tc–Ta, as evidenced by the low slope of all three fitted lines. For both gs and E, the fitted lines at 1 and 3 DAT were relatively similar polynomials, with values of both variables remaining relatively stable until Tc–Ta of ca. 2.75 °C before declining, slowly at first and then more rapidly. However, the fitted lines for DAT 5, 7 and 9 were all linear, with a similar slope between DAT 5 and 7 but a greater slope for data fitted to DAT 9. In contrast, relationships between Tc–Ta and A were linear for 1 DAT but were polynomial functions from DAT 3 to 9. As with the other two physiological variables, changes in A for DAT 3–9 were relatively small for each capture up to Tc–Ta of 2.75 °C, but above this point, A declined at first slowly and then more rapidly. The fitted polynomials for the last four captures generally predicted similar values of A above Tc–Ta = 3.0 °C.

4. Discussion

The findings presented here significantly advance our knowledge of how thermal imagery can be used to characterise water stress in radiata pine. Little research has investigated the utility of thermal imagery for characterising physiology in conifers. Conifers have challenging structural features, such as needles, and with a few exceptions [26,27,28], these species are very much underrepresented in this literature. Within the conifer group, the research presented here shows, for the first time, that thermal imagery can be used to accurately characterise key physiological traits that describe water stress within radiata pine. This is important as radiata pine is the most widely planted exotic species in the world [5] and has been established in many drought-prone areas that are likely to become more arid under climate change [33]. Consequently, the development of a rapid method to spatially characterise water stress in radiata pine is likely to have many useful applications under both current and future climates. Our research clearly shows the utility of high-frequency measurements taken in a controlled setting for identifying water stress thresholds at which Tc–Ta is most closely associated with key physiological indicators of water stress. We are unaware of any previous research that has used such an approach, and this process provides a sound basis for determining the optimal soil water content at which more costly field captures could be acquired.
Stomatal conductance of radiata pine rapidly declined in response to the onset of water stress, which is consistent with the previously noted strongly isohydric nature of the species [34]. Many pines are isohydric [2,41,42,43], and these species maintain a relatively constant leaf water potential over the short term through rapid stomatal closure to minimise the risk of hydraulic dysfunction and leaf dehydration under drought conditions [44]. This strategy has been previously demonstrated in radiata pine, which, in response to drought, rapidly closes stomata [36,45] and maintains relatively high leaf water potential over the short term [2], but over the long term, leaf water potential drops [2] and leaves dehydrate [36]. In contrast, anisohydric plants, such as some Eucalyptus species, close stomata more slowly, which maintains higher assimilation rates but results in lower leaf water potential, which increases the risk of hydraulic failure [1,2].
The imposition of water stress in radiata pine resulted in higher canopy temperature as gs, E and evaporative cooling declined in this treatment relative to the irrigated control. Values of Tc–Ta diverged strongly between treatments over the course of the experiment, with treatment differences slightly lagging significant physiological changes in gs, E and A. Nonetheless, treatment differences in Tc–Ta increased markedly as water stress progressed and were still increasing between the last two measurements (1.12 °C vs. 1.02 °C). These differences in Tc–Ta were relatively substantial, and, as previously noted, this responsiveness in Tc–Ta reflects isohydric behaviour, typical of pine species [41].
The strength of relationships between Tc–Ta and all three physiological measurements increased as water stress became more marked up to 7 DAT before stabilising. It was remarkable that highly significant relationships between Tc–Ta and the physiological variables were detected as early as 1 day after the imposition of water stress, and this finding is quite unique within the literature. Although this early detection was useful, it was not until 5 DAT that changes in physiology were clearly characterised by Tc–Ta. At this time, strong, highly significant relationships were found between Tc–Ta and both gs and E, which accounted for not only treatment differences but also much of the intra-treatment variation in these physiological variables. The strength of these correlations, noted between 5 and 9 DAT (R2 = 0.70–0.87), were at the upper end of previously reported values for a range of droughted orchard and tree species, where the coefficient of determination mostly ranged from 0.49 to 0.76 [14,16,19,25] but did reach as high as 0.72–0.79 for pot grown papaya [46] and 0.92–0.96 for peach trees in a commercial orchard [47]. As previously reported, Tc–Ta was more strongly related to gs than A [46], as the photosynthesis rate is not as directly related to Tc–Ta as gs.
The relatively strong correlations reported here were likely attributable to the stability of measurement conditions. In this trial, plants were grown within a homogeneous substrate, with measurements made over a narrow time period under relatively similar environmental conditions without wind. In contrast, within field settings and with larger plants, there will be higher variation in windspeed, meteorological conditions, canopy structure, self-shading, cloudiness and soil content. Water stress within the field is likely to develop more slowly than occurred in the reported study. As a result, correlations between Tc–Ta and tree physiology are likely to be weaker in field settings than under the controlled conditions described here.
Little research has investigated how the strength of correlations between Tc–Ta and physiological variables change over time during a short period of water stress. Increases in the strength of correlations with declining θ appear to reflect an increasing range in both physiological variables and Tc–Ta and tighter coupling in these relationships. These increases in correlation strength also resulted from a general increase in slope with the development of water stress for gs and E but not for A, as the relationship form was relatively similar between captures. The stabilisation of correlation strength after 7 DAT is consistent with results reported by [46], who also show little change in the strength of correlations between canopy temperature and gs for papaya plants between 9 and 14 days after drought imposition. Our research highlights the utility of running small-scale experiments to understand how θ impacts the strength of relationships between Tc–Ta and physiological variables prior to more costly field captures.
The use of thermal imagery for detecting water stress in the field has many advantages. Measurements of gs or leaf water potential are time-consuming and typically sample only a few trees from discrete locations. Due to logistical constraints, measurements often cannot be taken from upper parts of tree canopies where the crown is most physiologically active [48]. In contrast, high-resolution thermal imagery can be rapidly collected using a UAV or a fixed-wing aircraft across the whole stand. As no physical contact is made with the leaves, thermal methods do not disturb stomatal function. The processed imagery can provide tree-level measures of water stress, averaged over the most illuminated and physiologically active parts of the upper tree crown. However, it is also important to characterise the often considerable vertical gradients in foliage temperature in larger trees [49]. Within these canopies, foliage in the lower and middle parts of the canopy can strongly affect total tree transpiration during periods of high temperatures and low relative humidity [50].
The early identification of water stress shown in this study is very promising and may open up a number of applications. Thermal imagery is likely to be very useful for large-scale phenotyping of radiata pine. Previous research has shown that it is possible to select radiata pine families and genotypes with high drought tolerance and superior growth without making trade-offs [51,52]. During periods of water stress, drought-tolerant radiata pine genotypes could be identified as those able to keep stomata open for longer periods and maintain higher rates of assimilation than less drought-tolerant genotypes [49]. The use of thermal imagery provides an efficient means of phenotyping this variation in gs, and, for instance, canopy temperature was used to provisionally identify drought-tolerant black poplar genotypes within a genetics trial comprising 503 genotypes [25]. Further research should utilise thermal imagery to identify drought-tolerant radiata pine genotypes within genetic trials and from well-characterised plantations using landscape-level phenotyping methods [53,54]. The identification of these genotypes will allow growers to match genotypes to drought-prone sites to optimise growth and mitigate the impacts of climate change in more arid growing regions.
Results suggest that thermal imagery could also be used for general plantation monitoring during periods of drought to identify regions where trees are stressed. These acquisitions could also be used to monitor changes in physiology over time [55] and identify areas with high water usage [56] and the impact of different management strategies, such as stand thinning, on water status [57]. As stomatal conductance is also a key indicator of biotic stress, the early identification of stomatal closure suggests thermal imagery could be useful for disease detection and characterisation of disease severity in radiata pine. For instance, Smigaj et al. [58] found that canopy temperature depression for Scots pine was significantly correlated with Dothistroma needle blight severity, which is also a major disease of radiata pine. The integration of thermal imagery with other data sources, such as hyperspectral imagery, has been found to provide significant synergies for disease prediction. Models have been developed from these two data sources that can accurately detect early expression of disease in a number of tree species, e.g., [59,60].
Predictions of abiotic and biotic stresses from thermal imagery can be spatially scaled as sensors can be mounted on a wide range of aerial platforms. Although few studies have used data from UAV-mounted thermal sensors in forestry, these have considerable potential as they are flexible to deploy, and data can be collected at spatial resolutions of ca. 20 cm [61]. Many sensors operated from fixed-wing aircraft are also available and typically capture data at spatial resolutions ranging from 0.2 to 20 m at a 1 km altitude [62], while thermal imagery acquired from satellites has a spatial resolution ranging from 60 to 2000 m [62]. Scaling up from the leaf level to the canopy level is complicated by variables that influence the thermal response, which include sun–sensor geometry, canopy structure and atmospheric and environmental conditions. Indices such as CWSI provide a robust basis for normalising leaf temperatures to current environmental conditions, and methods for determining CWSI are well documented [63]. Radiative transfer models, which can simulate radiation propagation and scattering and incorporate canopy complexity, can be used to more accurately simulate the thermal properties of the canopy, and this is an active area of recent research and development [64].
Measurements of soil water content taken in this study could be improved in further research. Although this experiment was conducted in summer under hot conditions, rates of reported daily water loss were very high and markedly exceeded rates that occur in natural environments [45]. Volumetric moisture sensors do not always provide measurements that accurately reflect water content in a pot. These sensors generally only measure part of the pot volume, which, in this study, included only ca. 20% of the soil volume. Water is not distributed homogeneously throughout the profile of the pot as it dries but rather in layers, and at high water content, there is generally greater water within the lower part of the pot. Consequently, it is quite possible that the plants were able to access moisture at lower depths that were not measured by the sensors. These limitations around the water sensors may have resulted in reported estimates of θ that were lower than actual values. This is consistent with the fact that close to complete stomatal closure did not occur for most trees at the lowest value of θ in the water stress treatment, as has been found previously [45]. However, if the actual values of θ were slightly higher than those presented, the results are still very relevant as this indicates that Tc–Ta can be used to characterise physiological variables in trees with less water stress.
Further research should be undertaken to address these limitations and extend these findings. Pot weight should be recorded during each measurement to more accurately characterise θ, and measurements of soil water potential and plant leaf water potential should be regularly taken to provide a more comprehensive understanding of the soil and plant water status. Thermal images should also be taken from the side of the plant as these data will enable Tc–Ta to be determined over a greater leaf area that includes intermediate and lower-level leaves, which also play an important role in plant water relations.

5. Conclusions

The withholding of water was found to induce immediate and significant reductions in gs, E and A, with values declining to 42, 43 and 61% of the well-watered control treatment by 9 DAT. These changes were associated with a concurrent increase in Tc–Ta, with values in the water stress treatment exceeding those in the control treatment by 47% by 9 DAT. Relationships between Tc–Ta and the three physiological variables were highly significant from as early as 1 DAT onwards and reached a maximum strength at 7 DAT. The coefficient of determination (R2) for these three relationships at 7 DAT were, respectively, 0.87, 0.86 and 0.67 for gs, E and A. This research highlights the potential of thermal imagery for detecting water stress and identifying drought-tolerant radiata pine genotypes. Deployment of these genotypes to dry areas will ensure optimal growth of this widely planted species under climate change.

Author Contributions

Conceptualization, M.S.W.; methodology, M.S.W., D.d.S., H.J.C.E., W.Y. and P.M.; software, D.d.S.; formal analysis, M.S.W. and D.d.S.; resources, D.d.S. and P.M.; data curation, D.d.S., H.J.C.E., W.Y. and P.M.; writing—original draft preparation, M.S.W.; writing—review and editing, M.S.W., D.d.S., H.J.C.E., W.Y. and P.M.; visualization, M.S.W. and D.d.S.; supervision, M.S.W., D.d.S. and P.M.; project administration, M.S.W., D.d.S. and P.M.; funding acquisition, M.S.W. All authors have read and agreed to the published version of the manuscript.

Funding

This research was supported by the Ministry of Business, Innovation and Employment (MBIE) programme entitled “Seeing the forest for the trees: transforming tree phenotyping for future forests” (programme grant number C04X2101).

Data Availability Statement

The data presented in this study are available on reasonable request from the corresponding author.

Acknowledgments

We greatly appreciate assistance from Pablo Zarco-Tejada and Tomás Poblete regarding the development of the methodology for thermal data capture. We are grateful to the anonymous reviewers whose comments have greatly improved the manuscript.

Conflicts of Interest

The authors declare no conflict of interest.

Appendix A

Figure A1. Experimental set up showing the thermal camera, tree and the two targets (left) used for calibrating the temperatures from the thermal camera.
Forests 15 00028 g0a1

References

  1. Mitchell, P.J.; O’Grady, A.P.; Tissue, D.T.; White, D.A.; Ottenschlaeger, M.L.; Pinkard, E.A. Drought response strategies define the relative contributions of hydraulic dysfunction and carbohydrate depletion during tree mortality. New Phytol. 2013, 197, 862–872. [Google Scholar] [CrossRef] [PubMed]
  2. Mitchell, P.J.; O’Grady, A.P.; Tissue, D.T.; Worledge, D.; Pinkard, E.A. Co-ordination of growth, gas exchange and hydraulics define the carbon safety margin in tree species with contrasting drought strategies. Tree Physiol. 2014, 34, 443–458. [Google Scholar] [CrossRef] [PubMed]
  3. Bréda, N.; Huc, R.; Granier, A.; Dreyer, E. Temperate forest trees and stands under severe drought: A review of ecophysiological responses, adaptation processes and long-term consequences. Ann. For. Sci. 2006, 63, 625–644. [Google Scholar] [CrossRef]
  4. Kramer, P.J.; Boyer, J.S. Water Relations of Plants and Soils; Academic Press: Cambridge, MA, USA, 1995. [Google Scholar]
  5. Stone, C.; Penman, T.; Turner, R. Managing drought-induced mortality in Pinus radiata plantations under climate change conditions: A local approach using digital camera data. For. Ecol. Manag. 2012, 265, 94–101. [Google Scholar] [CrossRef]
  6. Still, C.; Powell, R.; Aubrecht, D.; Kim, Y.; Helliker, B.; Roberts, D.; Richardson, A.D.; Goulden, M. Thermal imaging in plant and ecosystem ecology: Applications and challenges. Ecosphere 2019, 10, e02768. [Google Scholar] [CrossRef]
  7. Jones, H.G. Application of thermal imaging and infrared sensing in plant physiology and ecophysiology. Adv. Bot. Res. 2004, 41, 107–163. [Google Scholar]
  8. Maes, W.H.; Steppe, K. Estimating evapotranspiration and drought stress with ground-based thermal remote sensing in agriculture: A review. J. Exp. Bot. 2012, 63, 4671–4712. [Google Scholar] [CrossRef]
  9. Idso, S.B.; Jackson, R.D.; Pinter, P.J., Jr.; Reginato, R.J.; Hatfield, J.L. Normalizing the stress-degree-day parameter for environmental variability. Agric. Meteorol. 1981, 24, 45–55. [Google Scholar] [CrossRef]
  10. Alderfasi, A.A.; Nielsen, D.C. Use of crop water stress index for monitoring water status and scheduling irrigation in wheat. Agric. Water Manag. 2001, 47, 69–75. [Google Scholar] [CrossRef]
  11. Erdem, Y.; Arin, L.; Erdem, T.; Polat, S.; Deveci, M.; Okursoy, H.; Gültaş, H.T. Crop water stress index for assessing irrigation scheduling of drip irrigated broccoli (Brassica oleracea L. var. italica). Agric. Water Manag. 2010, 98, 148–156. [Google Scholar] [CrossRef]
  12. Taghvaeian, S.; Comas, L.; DeJonge, K.C.; Trout, T.J. Conventional and simplified canopy temperature indices predict water stress in sunflower. Agric. Water Manag. 2014, 144, 69–80. [Google Scholar] [CrossRef]
  13. Raeva, P.L.; Šedina, J.; Dlesk, A. Monitoring of crop fields using multispectral and thermal imagery from UAV. Eur. J. Remote Sens. 2019, 52, 192–201. [Google Scholar] [CrossRef]
  14. Virlet, N.; Lebourgeois, V.; Martinez, S.; Costes, E.; Labbé, S.; Regnard, J.-L. Stress indicators based on airborne thermal imagery for field phenotyping a heterogeneous tree population for response to water constraints. J. Exp. Bot. 2014, 65, 5429–5442. [Google Scholar] [CrossRef] [PubMed]
  15. Berni, J.A.J.; Zarco-Tejada, P.J.; Sepulcre-Cantó, G.; Fereres, E.; Villalobos, F. Mapping canopy conductance and CWSI in olive orchards using high resolution thermal remote sensing imagery. Remote Sens. Environ. 2009, 113, 2380–2388. [Google Scholar] [CrossRef]
  16. Sepulcre-Cantó, G.; Zarco-Tejada, P.J.; Jiménez-Muñoz, J.C.; Sobrino, J.A.; De Miguel, E.; Villalobos, F.J. Detection of water stress in an olive orchard with thermal remote sensing imagery. Agric. For. Meteorol. 2006, 136, 31–44. [Google Scholar] [CrossRef]
  17. Ben-Gal, A.; Agam, N.; Alchanatis, V.; Cohen, Y.; Yermiyahu, U.; Zipori, I.; Presnov, E.; Sprintsin, M.; Dag, A. Evaluating water stress in irrigated olives: Correlation of soil water status, tree water status, and thermal imagery. Irrig. Sci. 2009, 27, 367–376. [Google Scholar] [CrossRef]
  18. Gonzalez-Dugo, V.; Zarco-Tejada, P.; Berni, J.A.J.; Suarez, L.; Goldhamer, D.; Fereres, E. Almond tree canopy temperature reveals intra-crown variability that is water stress-dependent. Agric. For. Meteorol. 2012, 154, 156–165. [Google Scholar] [CrossRef]
  19. Wang, D.; Gartung, J. Infrared canopy temperature of early-ripening peach trees under postharvest deficit irrigation. Agric. Water Manag. 2010, 97, 1787–1794. [Google Scholar] [CrossRef]
  20. Ballester, C.; Jiménez-Bello, M.A.; Castel, J.R.; Intrigliolo, D.S. Usefulness of thermography for plant water stress detection in citrus and persimmon trees. Agric. For. Meteorol. 2013, 168, 120–129. [Google Scholar] [CrossRef]
  21. García-Tejero, I.F.; Durán-Zuazo, V.H.; Muriel-Fernández, J.L.; Jiménez-Bocanegra, J.A. Linking canopy temperature and trunk diameter fluctuations with other physiological water status tools for water stress management in citrus orchards. Funct. Plant Biol. 2011, 38, 106–117. [Google Scholar] [CrossRef]
  22. Zarco-Tejada, P.J.; González-Dugo, V.; Berni, J.A.J. Fluorescence, temperature and narrow-band indices acquired from a UAV platform for water stress detection using a micro-hyperspectral imager and a thermal camera. Remote Sens. Environ. 2012, 117, 322–337. [Google Scholar] [CrossRef]
  23. Buddenbaum, H.; Stern, O.; Paschmionka, B.; Hass, E.; Gattung, T.; Stoffels, J.; Hill, J.; Werner, W. Using VNIR and SWIR field imaging spectroscopy for drought stress monitoring of beech seedlings. Int. J. Remote Sens. 2015, 36, 4590–4605. [Google Scholar] [CrossRef]
  24. Scherrer, D.; Bader, M.K.-F.; Körner, C. Drought-sensitivity ranking of deciduous tree species based on thermal imaging of forest canopies. Agric. For. Meteorol. 2011, 151, 1632–1640. [Google Scholar] [CrossRef]
  25. Ludovisi, R.; Tauro, F.; Salvati, R.; Khoury, S.; Mugnozza Scarascia, G.; Harfouche, A. UAV-based thermal imaging for high-throughput field phenotyping of black poplar response to drought. Front. Plant Sci. 2017, 8, 1681. [Google Scholar] [CrossRef] [PubMed]
  26. Seidel, H.; Schunk, C.; Matiu, M.; Menzel, A. Diverging drought resistance of scots pine provenances revealed by infrared thermography. Front. Plant Sci. 2016, 7, 1247. [Google Scholar] [CrossRef] [PubMed]
  27. Kim, Y.; Still, C.J.; Hanson, C.V.; Kwon, H.; Greer, B.T.; Law, B.E. Canopy skin temperature variations in relation to climate, soil temperature, and carbon flux at a ponderosa pine forest in central Oregon. Agric. For. Meteorol. 2016, 226, 161–173. [Google Scholar] [CrossRef]
  28. Smigaj, M.; Gaulton, R.; Suarez, J.C.; Barr, S.L. Use of miniature thermal cameras for detection of physiological stress in conifers. Remote Sens. 2017, 9, 957. [Google Scholar] [CrossRef]
  29. Lewis, N.B.; Ferguson, I.S. Management of Radiata Pine; Inkata Press: Melbourne, Australia, 1993; p. 404. [Google Scholar]
  30. Lavery, P.B.; Mead, D.J. Pinus radiata takes on the world. In Ecology and biogeography of Pinus; Richardson, D.M., Ed.; Cambridge University Press: Cambridge, UK, 1998; pp. 432–449. [Google Scholar]
  31. Watt, M.S.; Palmer, D.J.; Leonardo, E.M.C.; Bombrun, M. Use of advanced modelling methods to estimate radiata pine productivity indices. For. Ecol. Manag. 2021, 479, 118557. [Google Scholar] [CrossRef]
  32. Gavilán-Acuña, G.; Olmedo, G.F.; Mena-Quijada, P.; Guevara, M.; Barría-Knopf, B.; Watt, M.S. Reducing the Uncertainty of Radiata Pine Site Index Maps Using an Spatial Ensemble of Machine Learning Models. Forests 2021, 12, 77. [Google Scholar] [CrossRef]
  33. IPCC. Climate Change 2022—Impacts, Adaptation and Vulnerability: Working Group II Contribution to the Sixth Assessment Report of the Intergovernmental Panel on Climate Change; Cambridge University Press: Cambridge, UK, 2023. [Google Scholar] [CrossRef]
  34. Brodribb, T.J.; McAdam, S.A.M. Abscisic acid mediates a divergence in the drought response of two conifers. Plant Physiol. 2013, 162, 1370–1377. [Google Scholar] [CrossRef]
  35. Rodríguez-Gamir, J.; Xue, J.; Clearwater, M.J.; Meason, D.F.; Clinton, P.W.; Domec, J.C. Aquaporin regulation in roots controls plant hydraulic conductance, stomatal conductance, and leaf water potential in Pinus radiata under water stress. Plant Cell Environ. 2019, 42, 717–729. [Google Scholar] [CrossRef] [PubMed]
  36. Watt, M.S.; Leonardo, E.M.C.; Estarija, H.J.C.; Massam, P.; de Silva, D.; O’Neill, R.; Lane, D.; McDougal, R.; Buddenbaum, H.; Zarco-Tejada, P.J. Long-term effects of water stress on hyperspectral remote sensing indicators in young radiata pine. For. Ecol. Manag. 2021, 502, 119707. [Google Scholar] [CrossRef]
  37. Watt, M.; Bartlett, M.; Soewarto, J.; de Silva, D.; Estarija, H.-J.; Massam, P.; Cajes, D.; Yorston, W.; Graevskaya, E.; Dobbie, K. Pre-visual and early detection of myrtle rust on rose apple using indices derived from thermal imagery and visible-to-short-infrared spectroscopy. Phytopathology 2023, 113, 1405–1416. [Google Scholar] [CrossRef] [PubMed]
  38. Calderón, R.; Navas-Cortés, J.A.; Zarco-Tejada, P.J. Early detection and quantification of Verticillium wilt in olive using hyperspectral and thermal imagery over large areas. Remote Sens. 2015, 7, 5584–5610. [Google Scholar] [CrossRef]
  39. Rasband, W.S. ImageJ, U.S. 1997–2012; National Institutes of Health: Bethesda, MD, USA, 2012; Available online: https://imagej.net/ij/ (accessed on 5 November 2023).
  40. R Core Team. R: A Language and Environment for Statistical Computing; R Foundation for Statistical Computing: Vienna, Austria, 2023; Available online: https://www.R-project.org/ (accessed on 20 November 2023).
  41. Yi, K.; Smith, J.W.; Jablonski, A.D.; Tatham, E.A.; Scanlon, T.M.; Lerdau, M.T.; Novick, K.A.; Yang, X. High heterogeneity in canopy temperature among co-occurring tree species in a temperate forest. J. Geophys. Res. Biogeosci. 2020, 125, e2020JG005892. [Google Scholar] [CrossRef]
  42. Burkhardt, J.; Pariyar, S. How does the VPD response of isohydric and anisohydric plants depend on leaf surface particles? Plant Biol. 2016, 18, 91–100. [Google Scholar] [CrossRef]
  43. Klein, T.; Cohen, S.; Yakir, D. Hydraulic adjustments underlying drought resistance of Pinus halepensis. Tree Physiol. 2011, 31, 637–648. [Google Scholar] [CrossRef]
  44. Martínez-Vilalta, J.; Garcia-Forner, N. Water potential regulation, stomatal behaviour and hydraulic transport under drought: Deconstructing the iso/anisohydric concept. Plant Cell Environ. 2017, 40, 962–976. [Google Scholar] [CrossRef]
  45. Watt, M.S.; Whitehead, D.; Richardson, B.; Mason, E.G.; Leckie, A.C. Modelling the influence of weed competition on the growth of young Pinus radiata at a dryland site. For. Ecol. Manag. 2003, 178, 271–286. [Google Scholar] [CrossRef]
  46. Lima, R.S.N.; García-Tejero, I.; Lopes, T.S.; Costa, J.M.; Vaz, M.; Durán-Zuazo, V.H.; Chaves, M.; Glenn, D.M.; Campostrini, E. Linking thermal imaging to physiological indicators in Carica papaya L. under different watering regimes. Agric. Water Manag. 2016, 164, 148–157. [Google Scholar] [CrossRef]
  47. Gonzalez-Dugo, V.; Zarco-Tejada, P.; Nicolás, E.; Nortes, P.A.; Alarcón, J.J.; Intrigliolo, D.S.; Fereres, E. Using high resolution UAV thermal imagery to assess the variability in the water status of five fruit tree species within a commercial orchard. Precis. Agric. 2013, 14, 660–678. [Google Scholar] [CrossRef]
  48. Livingston, N.J.; Whitehead, D.; Kelliher, F.M.; Wang, Y.P.; Grace, J.C.; Walcroft, A.S.; Byers, J.N.; McSeveny, T.M.; Millard, P. Nitrogen allocation and carbon isotope fractionation in relation to intercepted radiation and position in a young Pinus radiata D. Don tree. Plant Cell Environ. 1998, 21, 795–803. [Google Scholar] [CrossRef]
  49. Richter, R.; Hutengs, C.; Wirth, C.; Bannehr, L.; Vohland, M. Detecting tree species effects on forest canopy temperatures with thermal remote sensing: The role of spatial resolution. Remote Sens. 2021, 13, 135. [Google Scholar] [CrossRef]
  50. Banerjee, T.; Linn, R. Effect of vertical canopy architecture on transpiration, thermoregulation and carbon assimilation. Forests 2018, 9, 198. [Google Scholar] [CrossRef]
  51. Ismael, A.; Xue, J.; Meason, D.F.; Klápště, J.; Gallart, M.; Li, Y.; Bellè, P.; Gomez-Gallego, M.; Bradford, K.-T.; Telfer, E. Genetic variation in drought-tolerance traits and their relationships to growth in Pinus radiata D. Don under water stress. Front. Plant Sci. 2022, 12, 766803. [Google Scholar] [CrossRef]
  52. Espinoza, S.E.; Martínez, V.A.; Magni, C.R.; Ivković, M.; Santelices, R.E.; Guerra, F.P.; Cabrera, A.M. Genetic control of growth, biomass allocation, and survival under drought stress in Pinus radiata D. Don seedlings. Tree Genet. Genomes 2014, 10, 1045–1054. [Google Scholar] [CrossRef]
  53. Dungey, H.S.; Dash, J.P.; Pont, D.; Clinton, P.W.; Watt, M.S.; Telfer, E.J. Phenotyping whole forests will help to track genetic performance. Trends Plant Sci. 2018, 23, 854–864. [Google Scholar] [CrossRef]
  54. Bombrun, M.; Dash, J.P.; Pont, D.; Watt, M.S.; Pearse, G.D.; Dungey, H.S. Forest-Scale Phenotyping: Productivity Characterisation Through Machine Learning. Front. Plant Sci. 2020, 11, 99. [Google Scholar] [CrossRef]
  55. Sancho-Knapik, D.; Mendoza-Herrer, Ó.; Alonso-Forn, D.; Saz, M.Á.; Martín-Sánchez, R.; dos Santos Silva, J.V.; Ogee, J.; Peguero-Pina, J.J.; Gil-Pelegrín, E.; Ferrio, J.P. Vapor pressure deficit constrains transpiration and photosynthesis in holm oak: A comparison of three methods during summer drought. Agric. For. Meteorol. 2022, 327, 109218. [Google Scholar] [CrossRef]
  56. Reinert, S.; Bögelein, R.; Thomas, F.M. Use of thermal imaging to determine leaf conductance along a canopy gradient in European beech (Fagus sylvatica). Tree Physiol. 2012, 32, 294–302. [Google Scholar] [CrossRef]
  57. Sankey, T.; Tatum, J. Thinning increases forest resiliency during unprecedented drought. Sci. Rep. 2022, 12, 9041. [Google Scholar] [CrossRef] [PubMed]
  58. Smigaj, M.; Gaulton, R.; Suárez, J.C.; Barr, S.L. Canopy temperature from an Unmanned Aerial Vehicle as an indicator of tree stress associated with red band needle blight severity. For. Ecol. Manag. 2019, 433, 699–708. [Google Scholar] [CrossRef]
  59. Hornero, A.; Zarco-Tejada, P.J.; Quero, J.L.; North, P.R.J.; Ruiz-Gómez, F.J.; Sánchez-Cuesta, R.; Hernandez-Clemente, R. Modelling hyperspectral-and thermal-based plant traits for the early detection of Phytophthora-induced symptoms in oak decline. Remote Sens. Environ. 2021, 263, 112570. [Google Scholar] [CrossRef]
  60. Zarco-Tejada, P.J.; Camino, C.; Beck, P.S.A.; Calderon, R.; Hornero, A.; Hernández-Clemente, R.; Kattenborn, T.; Montes-Borrego, M.; Susca, L.; Morelli, M. Previsual symptoms of Xylella fastidiosa infection revealed in spectral plant-trait alterations. Nat. Plants 2018, 4, 432–439. [Google Scholar] [CrossRef] [PubMed]
  61. Duarte, A.; Borralho, N.; Cabral, P.; Caetano, M. Recent advances in forest insect pests and diseases monitoring using UAV-based data: A systematic review. Forests 2022, 13, 911. [Google Scholar] [CrossRef]
  62. Neinavaz, E.; Schlerf, M.; Darvishzadeh, R.; Gerhards, M.; Skidmore, A.K. Thermal infrared remote sensing of vegetation: Current status and perspectives. Int. J. Appl. Earth Obs. Geoinf. 2021, 102, 102415. [Google Scholar] [CrossRef]
  63. Hernández-Clemente, R.; Hornero, A.; Mottus, M.; Penuelas, J.; González-Dugo, V.; Jiménez, J.C.; Suárez, L.; Alonso, L.; Zarco-Tejada, P.J. Early Diagnosis of Vegetation Health From High-Resolution Hyperspectral and Thermal Imagery: Lessons Learned From Empirical Relationships and Radiative Transfer Modelling. Curr. For. Rep. 2019, 5, 169–183. [Google Scholar] [CrossRef]
  64. Cao, B.; Liu, Q.; Du, Y.; Roujean, J.-L.; Gastellu-Etchegorry, J.-P.; Trigo, I.F.; Zhan, W.; Yu, Y.; Cheng, J.; Jacob, F. A review of earth surface thermal radiation directionality observing and modeling: Historical development, current status and perspectives. Remote Sens. Environ. 2019, 232, 111304. [Google Scholar] [CrossRef]
Figure 1. Variation in volumetric water content over the course of the experiment for the control (blue lines, shading) and water-stressed trees (red lines, shading). The mean (lines) and 95% confidence intervals (shading) are shown. The vertical dashed lines represent the mid-point of each of the six measurement times. The days after treatment (DAT) on 23 February 2022 are shown at the top.
Forests 15 00028 g001
Figure 2. Variation in (a) stomatal conductance (gs), (b) transpiration rate (E), (c) assimilation rate (A) and (d) Tc–Ta over the duration of the experiment for the control (blue points and bars) and water-stressed (red points and bars) treatments. Means ± standard error are shown. Asterisks *, ** and *** at the top of each figure denote treatment significance at p = 0.05, 0.01 and 0.001; ns = not significant at p = 0.05.
Forests 15 00028 g002
Figure 3. Relationship between Tc–Ta and stomatal conductance for control (blue circles) and water-stressed (red circles) treatments by days after treatment (DAT). The fitted lines are linear and, where significant, second-order polynomial lines (black line). Statistics for each line (p value and R2) are displayed in each panel.
Forests 15 00028 g003
Figure 4. Relationship between Tc–Ta and assimilation rate for control (blue circles) and water stressed (red circles) treatments, by days after treatment (DAT). The fitted lines are linear and, where significant, second-order polynomial lines (black line). Statistics for each line (p value and R2) are displayed in each panel.
Forests 15 00028 g004
Disclaimer/Publisher’s Note: The statements, opinions and data contained in all publications are solely those of the individual author(s) and contributor(s) and not of MDPI and/or the editor(s). MDPI and/or the editor(s) disclaim responsibility for any injury to people or property resulting from any ideas, methods, instructions or products referred to in the content.

