Article

Aboveground Biomass Component Plasticity and Allocation Variations of Bamboo (Pleioblastus amarus) of Different Regions

1
Research Institute of Subtropical Forestry, Chinese Academy of Forestry, Hangzhou 311400, China
2
Forestry Bureau of Shaxian County, Shaxian, Sanming 365500, China
3
Longyou Forestry Extension Station, Quzhou 324400, China
*
Author to whom correspondence should be addressed.
Forests 2024, 15(1), 43; https://doi.org/10.3390/f15010043
Submission received: 19 October 2023 / Revised: 18 December 2023 / Accepted: 21 December 2023 / Published: 24 December 2023
(This article belongs to the Section Forest Ecology and Management)

Abstract

:
Bamboo is one of the most important forest resources, widely distributed throughout subtropical and tropical regions. Many studies have focused on bamboo functional trait variation under different environmental conditions. However, the functional feature response of bamboo components to regional and climatic factors and associated coupling effects are less known. This study analyzed phenotypic plasticity and biomass accumulation and allocation processes in aboveground Pleioblastus amarus components (i.e., the culm, branch, and leaf) with principal component analysis (PCA) and partial least squares structural equation modeling (PLS-SEM) in three regions of China. Consequently, obvious regional differences were observed in phenotypic plasticity, biomass accumulation, and allocation processes. With decreasing latitude and increasing longitude, the internode length was longer for larger and rounder bamboo and the culm wall was thinner at a lower relative total height. Moreover, the number and width of crowns became greater, thicker, and longer. With increasing latitude, branch and leaf biomass decreased significantly, while biomass allocation to bamboo branches and leaves first decreased before increasing. And with increasing longitude, culm and total biomass reduced significantly along with culm biomass allocation, while total branch and leaf biomass allocation gradually decreased. Clearly, climatic factors, such as maximum temperature and mean annual temperature, directly affected the phenotypic plasticity of P. amarus and its associative biomass accumulation. Meanwhile, soil factors (i.e., soil available phosphorus, capillary porosity, field water holding capacity, and total nitrogen content) caused significant variation in phenotypic plasticity, indirectly affecting plant biomass accumulation and allocation processes. Collectively, these initial findings indicate that low-latitude and high-longitude stands promoted greater morphogenesis and more efficient biomass accumulation and allocation in aboveground P. amarus components, exhibiting superior morpho-plasticity and higher stand productivity. This study clarified regional differences in P. amarus morphological phenotypic plasticity and biomass accumulation and allocation. It is expected that the results can aid in provenance selection and the directional cultivation of high-yield bamboo stands.

1. Introduction

Plants typically develop different biomass accumulation and allocation patterns and phenotypic plasticity characteristics, indicative of their significant adaptive regulation of phenotypic plasticity and biomass allocation strategies in different regions. Moreover, in different regions, plants have been shown to alter their investment in different components (organs) to adapt to environmental variation, which is reflected in their ability to acquire available environmental resources (e.g., sunlight, water, and nutrients) and their ecological adaptive strategies to environmental change [1]. Temperature has a fundamental effect on plant physiology and ecosystem metabolism at a local scale [2]. An increasing number of studies have suggested that climatic factors control forest biomass accumulation while regulating biomass allocation [3]. Under increasing mean annual temperatures, both the branch and leaf biomass of temperate and subtropical tree species have significantly increased (by ≤30, 31–60, and >60 years) throughout all plant age groups [4]. It has also been shown that the combined effects of multiple environmental factors are more significant than the individual effects of a single environmental factor. For example, higher temperatures in combination with escalating precipitation have increased leaf biomass production of Stylosanthes capitata (i.e., by up to 38%) [5] while improving aboveground biomass production of forage C4 grass types [6]. Globally, aboveground biomass is greater in tropical mangrove regions, while belowground biomass is greater in colder regions at higher latitudes [7]. Additionally, under global warming, vegetation biomass in the Arctic and alpine tundra regions has markedly increased as annual temperatures have increased, while biomass allocation has gradually shifted from belowground to aboveground plant components [8]. The optimal theory of allocation suggests that plants tend to allocate more biomass to organs under the most limiting resource conditions [9]. Plants typically allocate more biomass to belowground components under dry conditions; however, more biomass can be allocated to aboveground components under wetter conditions [10]. The response of plants to water deficits or drought may vary, depending on water stress severity [11]. Moderate water stress has been shown to slightly increase root biomass [12], while severe drought conditions have been shown to significantly increase root biomass under an obvious decrease in stem biomass [13]. One study found that compared with root biomass, only negligible leaf biomass changes were observed under increased drought conditions [14]. Other studies have shown that leaf biomass has either increased or decreased under various drought stress conditions [11,15]. Complex environmental factors (i.e., temperature and water and nutrient availability) within different regions have resulted in adaptive adjustments in plant phenotypic plasticity and associative biomass allocation patterns to conform to environmental variation [16]. Therefore, the significance of clarifying phenotypic plasticity and biomass allocation patterns of plant components is paramount to our understanding of the adaptive strategies that plants employ under ecological drivers within different regions. This will also help reveal biomass variation under ecological driving mechanisms within different regions.
Plant components (i.e., culm, branch, leaf, etc.) typically embody unique functional traits specific to different regions. These functional traits reflect plant growth, development, and reproduction features, which in turn respond to climactic, geographical, interference, and biotic factors during biological evolution processes [17] while reflecting adaptive and nutrient utilization strategies under specific environmental conditions [18]. Plants respond to environmental stimuli by altering their component characteristics [19]. Moreover, these environmentally mediated response strategies are particularly prevalent in plants, a strategy commonly known as phenotypic plasticity [20], allowing plants to adapt to environmental conditions by regulating their morphological or physiological component traits [21], especially for aboveground components. For example, the culm length of Dendrocalamus asper has been shown to negatively correlate with altitude and relative humidity at low elevations (<892 m), while the culm diameter of its middle and top segments has been shown to negatively correlate with temperature [22]. Under high humidity, silver birch (Betula pendula) has been shown to exhibit increased branching and slenderness [23]. For this same plant species, functional traits (e.g., culms and branches) can markedly differ under different environmental conditions, whereas the functional traits of different plant components (e.g., leaves) may converge within the same habitat [24]. For example, although drought has been shown to reduce Lanzhou lily (Lilium davidii) leaf length, leaf width, and the length-to-width ratio [25], ferns have been shown to decrease under increasing drought intensity [26]. Many studies have previously shown that morphological plant traits significantly correlate with regional and climatic factors [27,28,29,30,31,32]. Moreover, variation in spatial and temporal climatic factors (e.g., temperature, humidity, sunlight, etc.) and resource effectiveness [33,34,35] within different regions have clearly been shown to impact phenotypic plant component characteristics [36,37]. In recent years, climate change has caused more frequent and extreme weather events, warming, floods, etc., effectively influencing species composition while concurrently altering functional component properties. Therefore, exploring plant phenotypic plasticity and its associative response to spatial heterogeneity, while simultaneously analyzing regional differences in phenotypic plasticity variation, can help us better understand the ecological and biological mechanisms of plant zonation pattern [38].
Bamboo (subfamily Bambusoideae) is the most important non-timber forest resource while being the fastest growing and most versatile plant species on Earth. Bamboo includes approximately 1600 species under 120 genera, accounting for 1% of the world’s total forest area [39]. It is distributed throughout all tropical, subtropical, and temperate regions (excluding the continents of Europe and Antarctica) [40]. Bamboo has notable economic and cultural significance worldwide, being broadly used as a food source, as a wood or plastic substitute, as bioenergy, and as a building material [41]. These economic attributes closely correlate with phenotypic plasticity and biomass accumulation and allocation, especially for aboveground components (i.e., culm, branch, and leaf). Additionally, the most renowned bamboo genera (e.g., Phyllostachys, Pleioblastus, Sinobambusa, and Arundinaria) are widely distributed across China’s different climatic zones. Although many bamboo studies have focused on regional impacts of temperature [42], moisture [43], and soil nutrients [44] on growth and development, most have exclusively focused on a single influencing factor associated with bamboo distribution and leaf traits. However, little information is available on the compound regional and climate factors associated with phenotypic plasticity and accumulation and allocation processes of this critical economic plant group. Pleioblastus amarus is a species in the Pleioblastus spp. genus. It is an economically important bamboo species used for both timber and edible young shoots [45]. Furthermore, P. amarus is widely distributed across southern China’s climatic zones [46], where most of its stands constitute near-natural forests under arbitrary management practices. Previous studies on P. amarus phenotypic traits have focused on elevation leaf trait effects [45] and the response of root morphology to nitrogen (N) additives [47]. In contrast, studies on the relationship between P. amarus functional traits and environmental factors are limited. Accordingly, the objective of this study was to determine morphological and biomass indicators of P. amarus culm, crown, and branch components while also analyzing correlations with environmental factors (i.e., regional, climate, and soil factors) in three regions of China where this bamboo species is widely distributed. Specifically, this study attempts to answer two important scientific questions. (1) Do phenotypic plasticity and biomass accumulation and allocation of this widely distributed bamboo species exhibit obvious regional variation? (2) How do regional and climatic factors affect functional attributes and cause regional differentiation? This study also aimed to ascertain a suitable cultivation area based on optimal phenotypic plasticity and efficient biomass accumulation and allocation, while providing theoretical guidance for P. amarus provenance selection and its directional management.

2. Materials and Methods
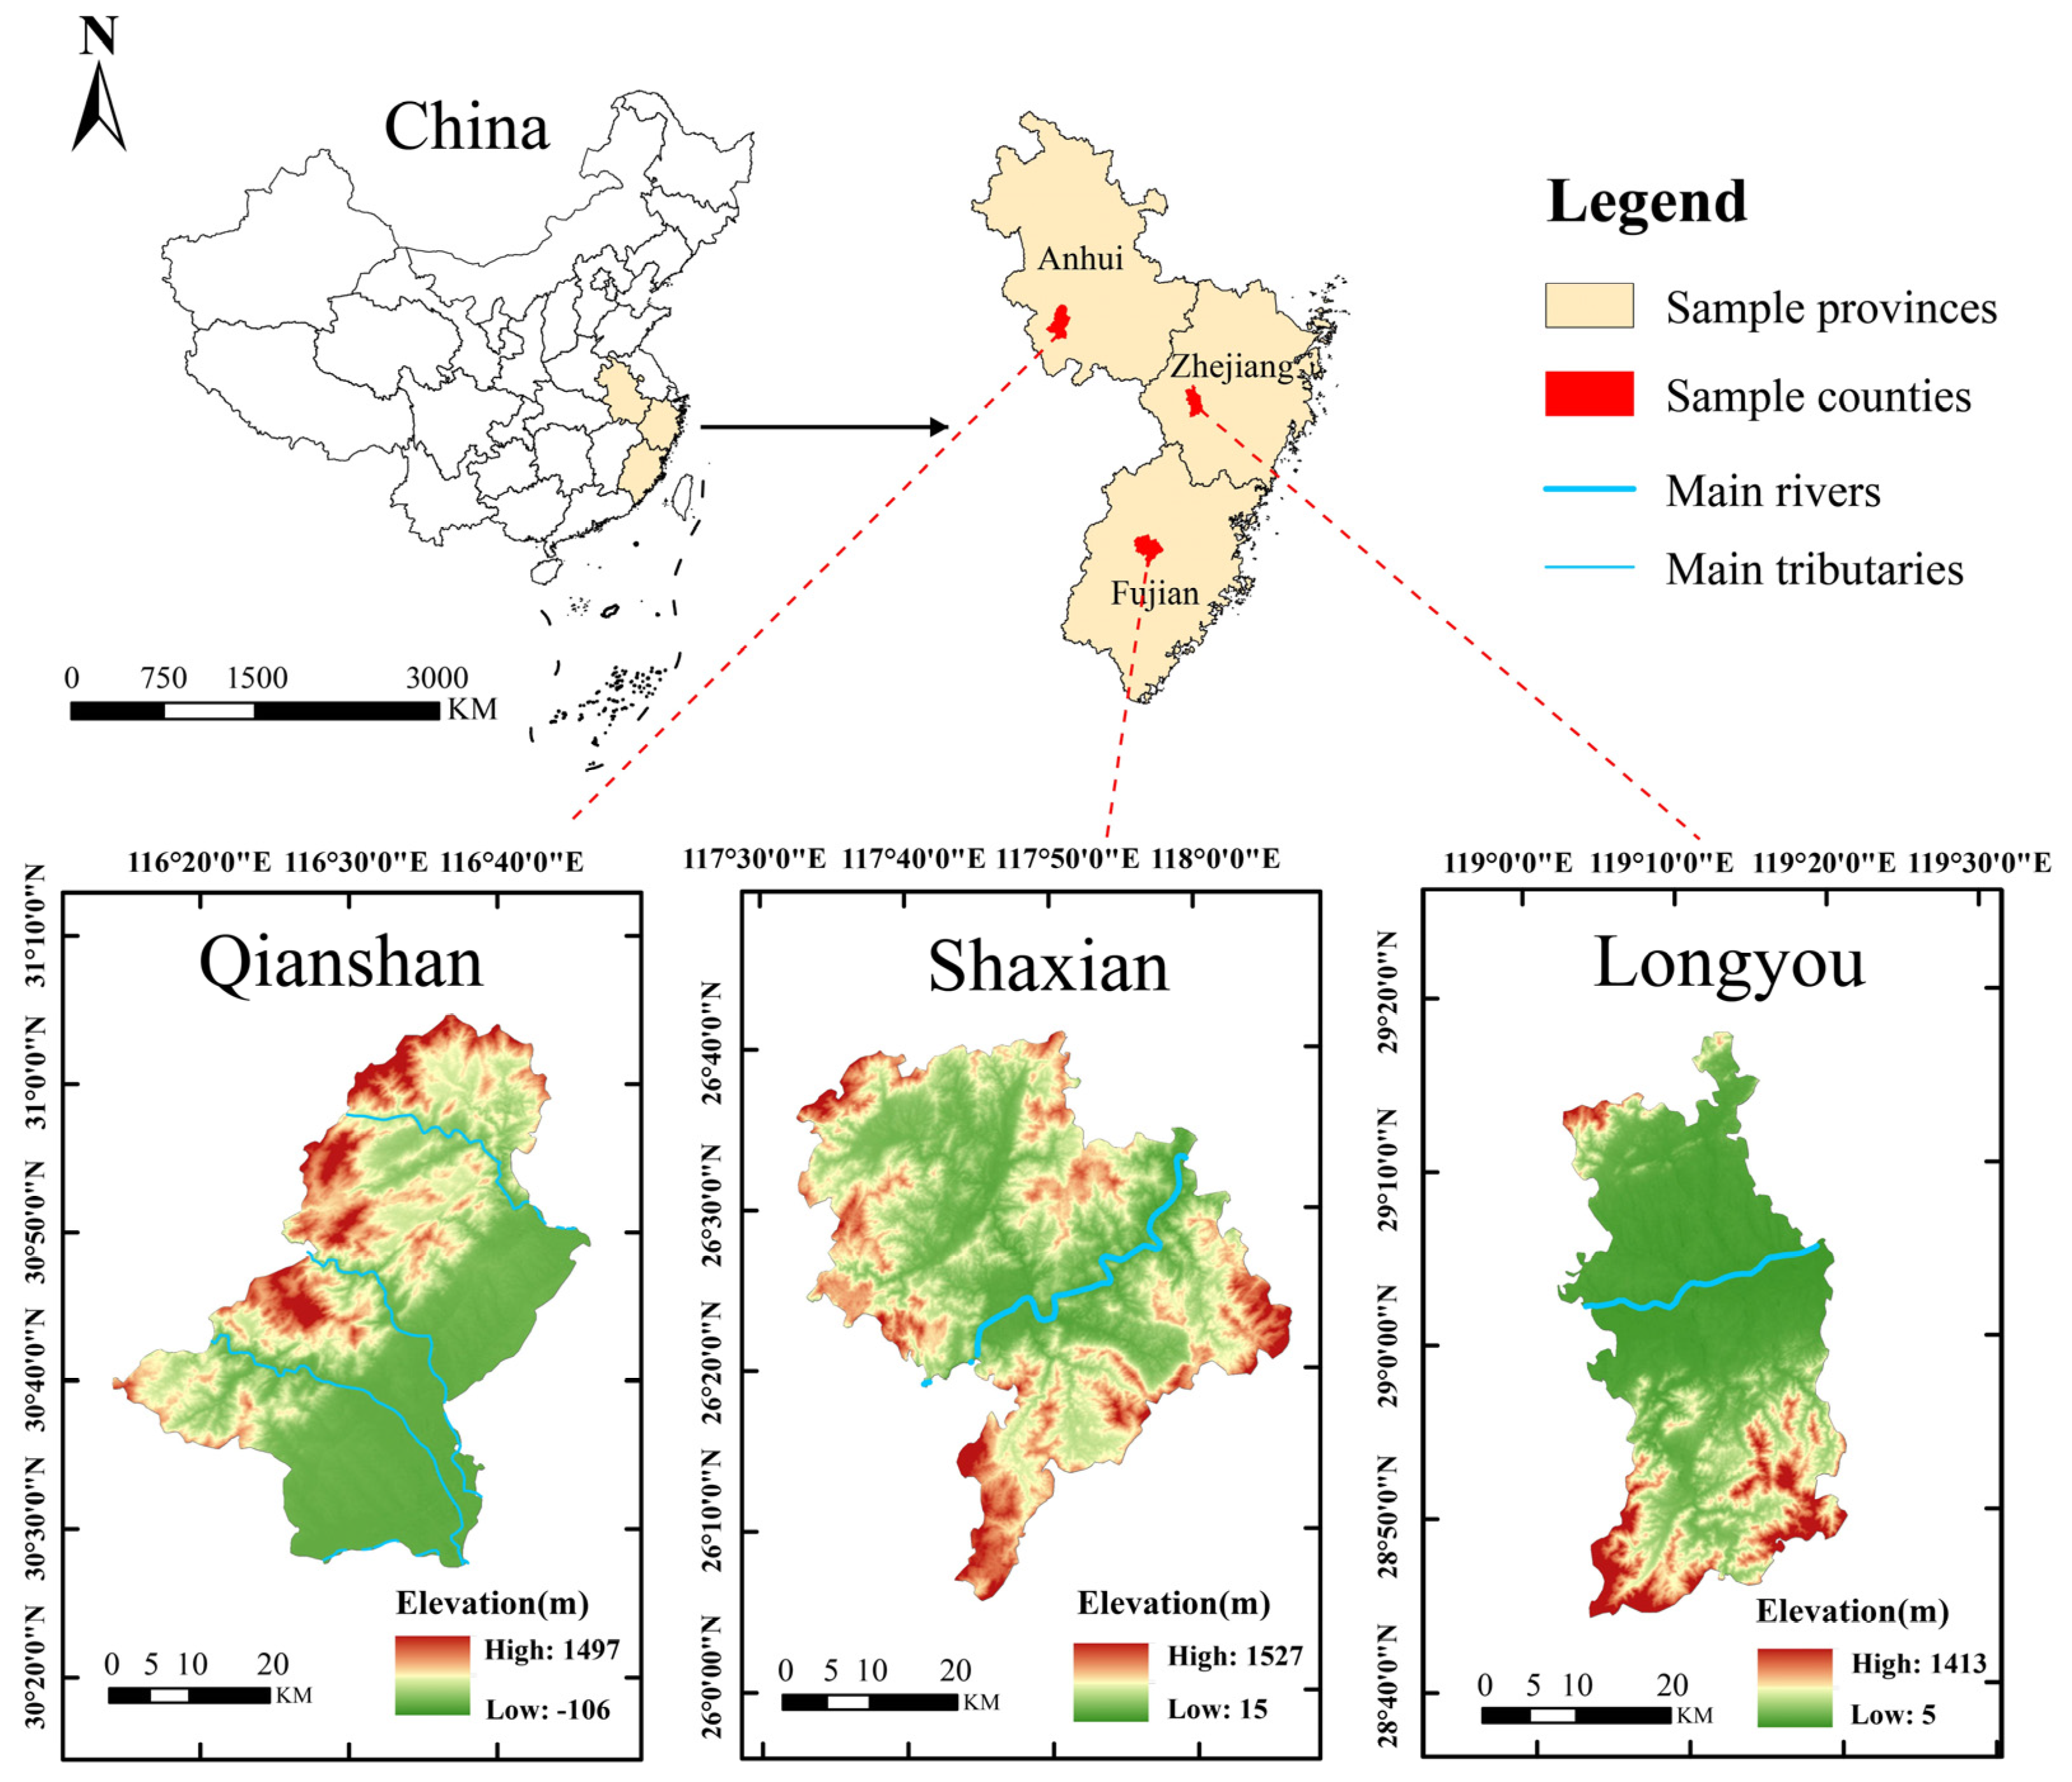
2.1. Study Area

P. amarus is ecologically adaptable and widely distributed throughout subtropical regions. Within its distribution area, most P. amarus stands are natural bamboo forests that have not been affected by artificial management, harvesting, or other anthropogenic activities. For this study, three study sites were selected within China’s P. amarus forest distribution areas, namely Qianshan County (QS), Anhui Province, Longyou County (LY), Zhejiang Province, Sha County (SX), and Fujian Province (Figure 1). Latitude and longitude differences between each of the two study sites were >2° and >1°, respectively. Three sampling sites under identical stand conditions within each study area were selected in October 2022 (i.e., QS, LY, and SX). The distance between any two sampling sites within each study area was >10 km, where the P. amarus stand area of each sampling site was >2 ha. At each sampling site, three 10 m × 10 m plots were established for sampling and basic survey information (Table 1). Additionally, 30 standard bamboo specimens of various ages (i.e., 10 each of 1, 2, and 3 years) were selected from each sampling site to determine morphological and biomass indicators. In total, 810 standard bamboo specimens were selected for this study. Climate information in all three regions over the past 10 years was provided by the local weather station department.

2.2. Determining Component Biomass and Morphological Indicators

The culm, branch, and leaf of all standard bamboo specimens were harvested using the destructive bamboo forest sampling method within all three regions in October 2022. After harvesting, bamboo specimens were divided into leaf, branch, and culm components, where fresh weights were, respectively, measured in the field using an electronic weighing balance (0.01 kg). Subsamples of each bamboo component were then collected and their fresh weights were measured before being transported to the laboratory and oven-dried at 105 °C for 30 min and oven-dried at 80 °C until achieving a constant weight, from which the oven-dried weight was obtained.
Both the inner (IDB) (two perpendicular measurements) and the outer (ODB) diameters at a 1.3 m height (mm) were determined using vernier calipers (0.01 mm), after which the wall thickness ratio ((ODB − IDB) ÷ ODB) (%) and the rounding ratio (Min (ODB) ÷ Max (ODB)) (%) were calculated, respectively. We then measured the height (m), height under branch (m), crown length (m), and crown width (vertical two-directional measurement) (m) using a tape ruler (0.01 m), where the number of branch nodes was counted and the mean internode length (total height ÷ the number of nodes) (mm) was calculated. Furthermore, the relative total height (total height ÷ diameter at breast height (DBH)) and the relative height under the branch (height under branch ÷ DBH) were used to compare and analyze culm morphology variation within the three regions [48]. Branch length (cm) and diameter (mm) of the upper, middle, and bottom crown were measured using a tape ruler (0.01 m) and a vernier caliper (0.01 mm), respectively. Additionally, the angle between branches (°) and the angle between the culm and branch (°) were gauged using a protractor (0.01°).

2.3. Determining Soil Property Indicators

Three undisturbed soil samples were obtained from each sampling plot using a stainless steel circular knife (100 cm3 cubage); these samples were subsequently used for soil physical analysis (i.e., soil bulk density, soil water content, maximum water holding capacity, capillary water holding capacity, field water holding capacity, soil density, capillary porosity, non-capillary porosity, soil total porosity, and soil aeration) [49]. Additionally, five soil samples (1000 g) were taken from the 0–20 cm soil layer at the same site and mixed into one, where one-quarter of the mixed sample was selected as a representative sample from each sampling site and used for soil chemical analysis. The soil samples were placed into sealed bags and transported to the laboratory. All soil samples were air-dried before being sieved through a 0.25 mm mesh. They were then measured for soil pH, total nitrogen (TN), total phosphorus (TP), total potassium (TK), available hydrolyzed nitrogen (AN), available phosphorus (AP), available potassium (AK), and organic matter (OM) [50,51]. In total, 81 soil samples were collected for the measurement of soil physical and chemical properties in this study.

2.4. Data Analysis

Excel 2010 was used for experimental data processing [52]. The experimental data were presented as the mean ± standard error. One-way ANOVA and Duncan’s new multiple range test (MRT) were performed in SPSS 22.0 (Chicago, IL, USA) [53] to determine differences in P. amarus culm morphology, crown morphology, branch morphology, and biomass indicators among the three representative regions (α = 0.05). Two-way ANOVA was used to explore regional and age effects and their interactions on P. amarus culm morphology, crown morphology, branch morphology, and biomass accumulation and allocation. Three-way ANOVA was used to examine bamboo region, age, and crown effects and their interactions on P. amarus branch morphology. Analysis of variance (ANOVA) histograms of culm morphology, crown morphology, branch morphology, and biomass accumulation and allocation were plotted using Origin 2023b [54]. Using the statistical software packages “FactoMine R (v2.4)” [55] and “factoextra (v1.0.6)” [56] in R 4.2.2, principal component analysis (PCA) was performed to determine the principal factors of climatic factors, soil factors, component (including culm, crown, branch) morphology, and biomass accumulation and allocation in the experimental P. amarus forest stands for use in the latter PLS-SEM (partial least squares structural equation modeling) modeling construction. The number of principal components was based on an eigenvalue greater than one. This was visualized using the “fviz_pca_ind” and “fviz_contrib” functions in “factoextra” (an R package makes it easy to extract and visualize the output of exploratory multivariate data analyses). The PLS-SEM was used to explore composite factors affecting biomass variation and associative interactions and to understand regional biomass variation in driving factors using Smart PLS 4.0.9.4 [57]. Topographical sampling maps were generated using ArcGIS 10.7 (ESRI® ArcMap™ 10.7) [58].

3. Result

3.1. Culm Morphology within the Three Regions

Although all three regions had a significant effect on culm morphological indicators, bamboo age only significantly affected DBH and mean internode length. Additionally, regional and bamboo age interactions significantly affected DBH, relative total height, relative branch height, and mean internode length (Figure 2). The relative height under branch increased significantly as latitude increased, while DBH and the rounding ratio tended to first increase before decreasing (Figure 2a,c,f). As longitude increased, DBH and mean internode length tended to decrease significantly, while the opposite trend was observed for relative total height and the wall thickness ratio, where the rounding ratio first decreased before increasing (Figure 2a,b,d,e).

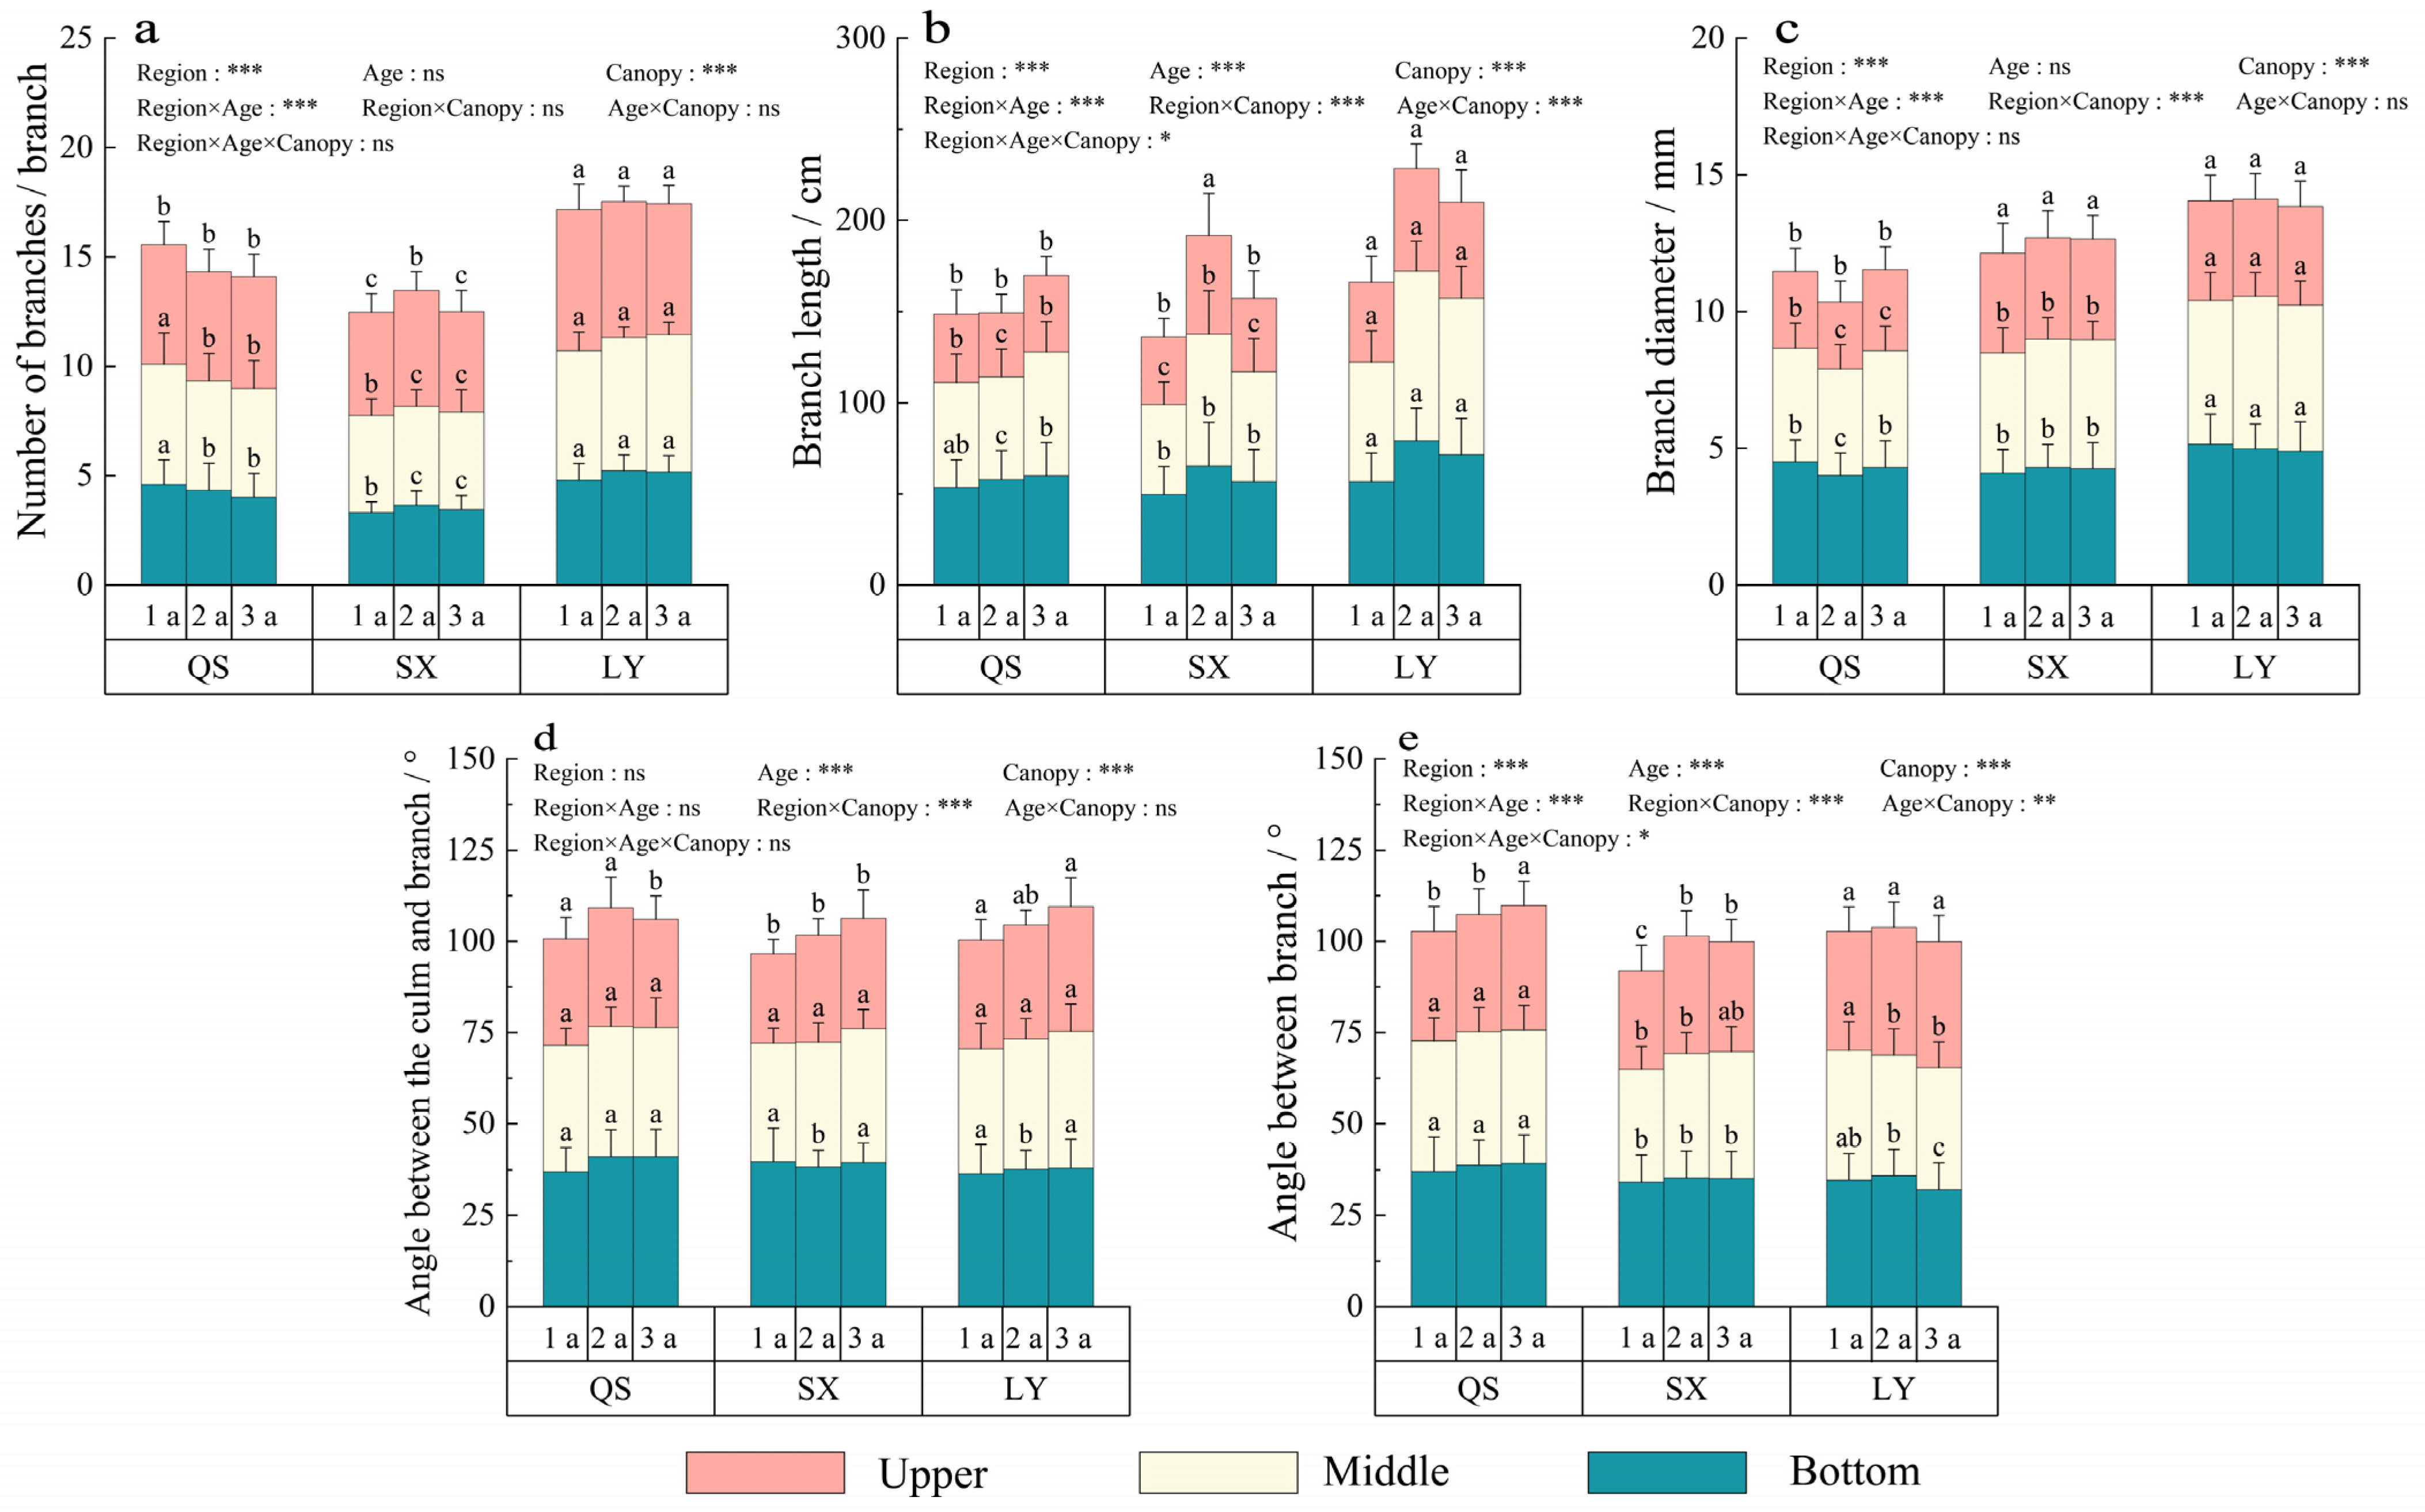
3.2. Crown Morphology within the Three Regions

Results showed obvious regional effects on crown width, relative crown length, number of branch nodes, and the branching rate of P. amarus, while bamboo age had a significant effect on crown width and number of branch nodes. Furthermore, regional and bamboo age interactions significantly affected crown width, number of branch nodes, and the branching rate of P. amarus (Figure 3). Crown width and number of branch nodes decreased significantly as latitude increased, while relative crown length and the branching rate first decreased before increasing. Relative crown length and the branching rate obviously decreased as longitude increased, while crown width and number of branch nodes first increased before decreasing.

3.3. Branch Morphology within the Three Regions

Crown position affected the number of branches, branch length, branch diameter, angle between the culm and branch, and angle between branches of P. amarus. Moreover, results showed a significant regional effect on the angle between the culm and branch, while bamboo age did not significantly affect the number of branches and branch diameter. Regional and bamboo age interactions significantly affected number of branches, branch length, branch diameter, and angle between branches. Regional and crown interactions significantly affected branch length, branch diameter, angle between the culm and branch, and angle between branches. Additionally, interactions between bamboo age and the crown significantly affected branch length and angle between branches. Regional, bamboo age, and crown interactions affected branch length and the angle between branches (Figure 4). As latitude increased, the number of branches in each crown layer, the branch diameter in the bottom crown layer, the angle between the culm and branch, and the angle between branches in the upper crown layer first increased before decreasing. The branch diameter in the upper crown layer tended to significantly increase while the angle between branches in the middle crown layer significantly decreased. As longitude increased, the number of branches in each crown layer, the branch diameter in the bottom crown layer, the angle between the culm and branch, and the angle between branches in the upper crown layer first decreased before increasing. Branch length in each crown layer and branch diameter in the middle crown layer tended to increase significantly. Conversely, the angle between the culm and branch and the angle between branches significantly decreased. Latitude and longitude did not significantly affect the angle between the culm and branch, which only exhibited a slight change.

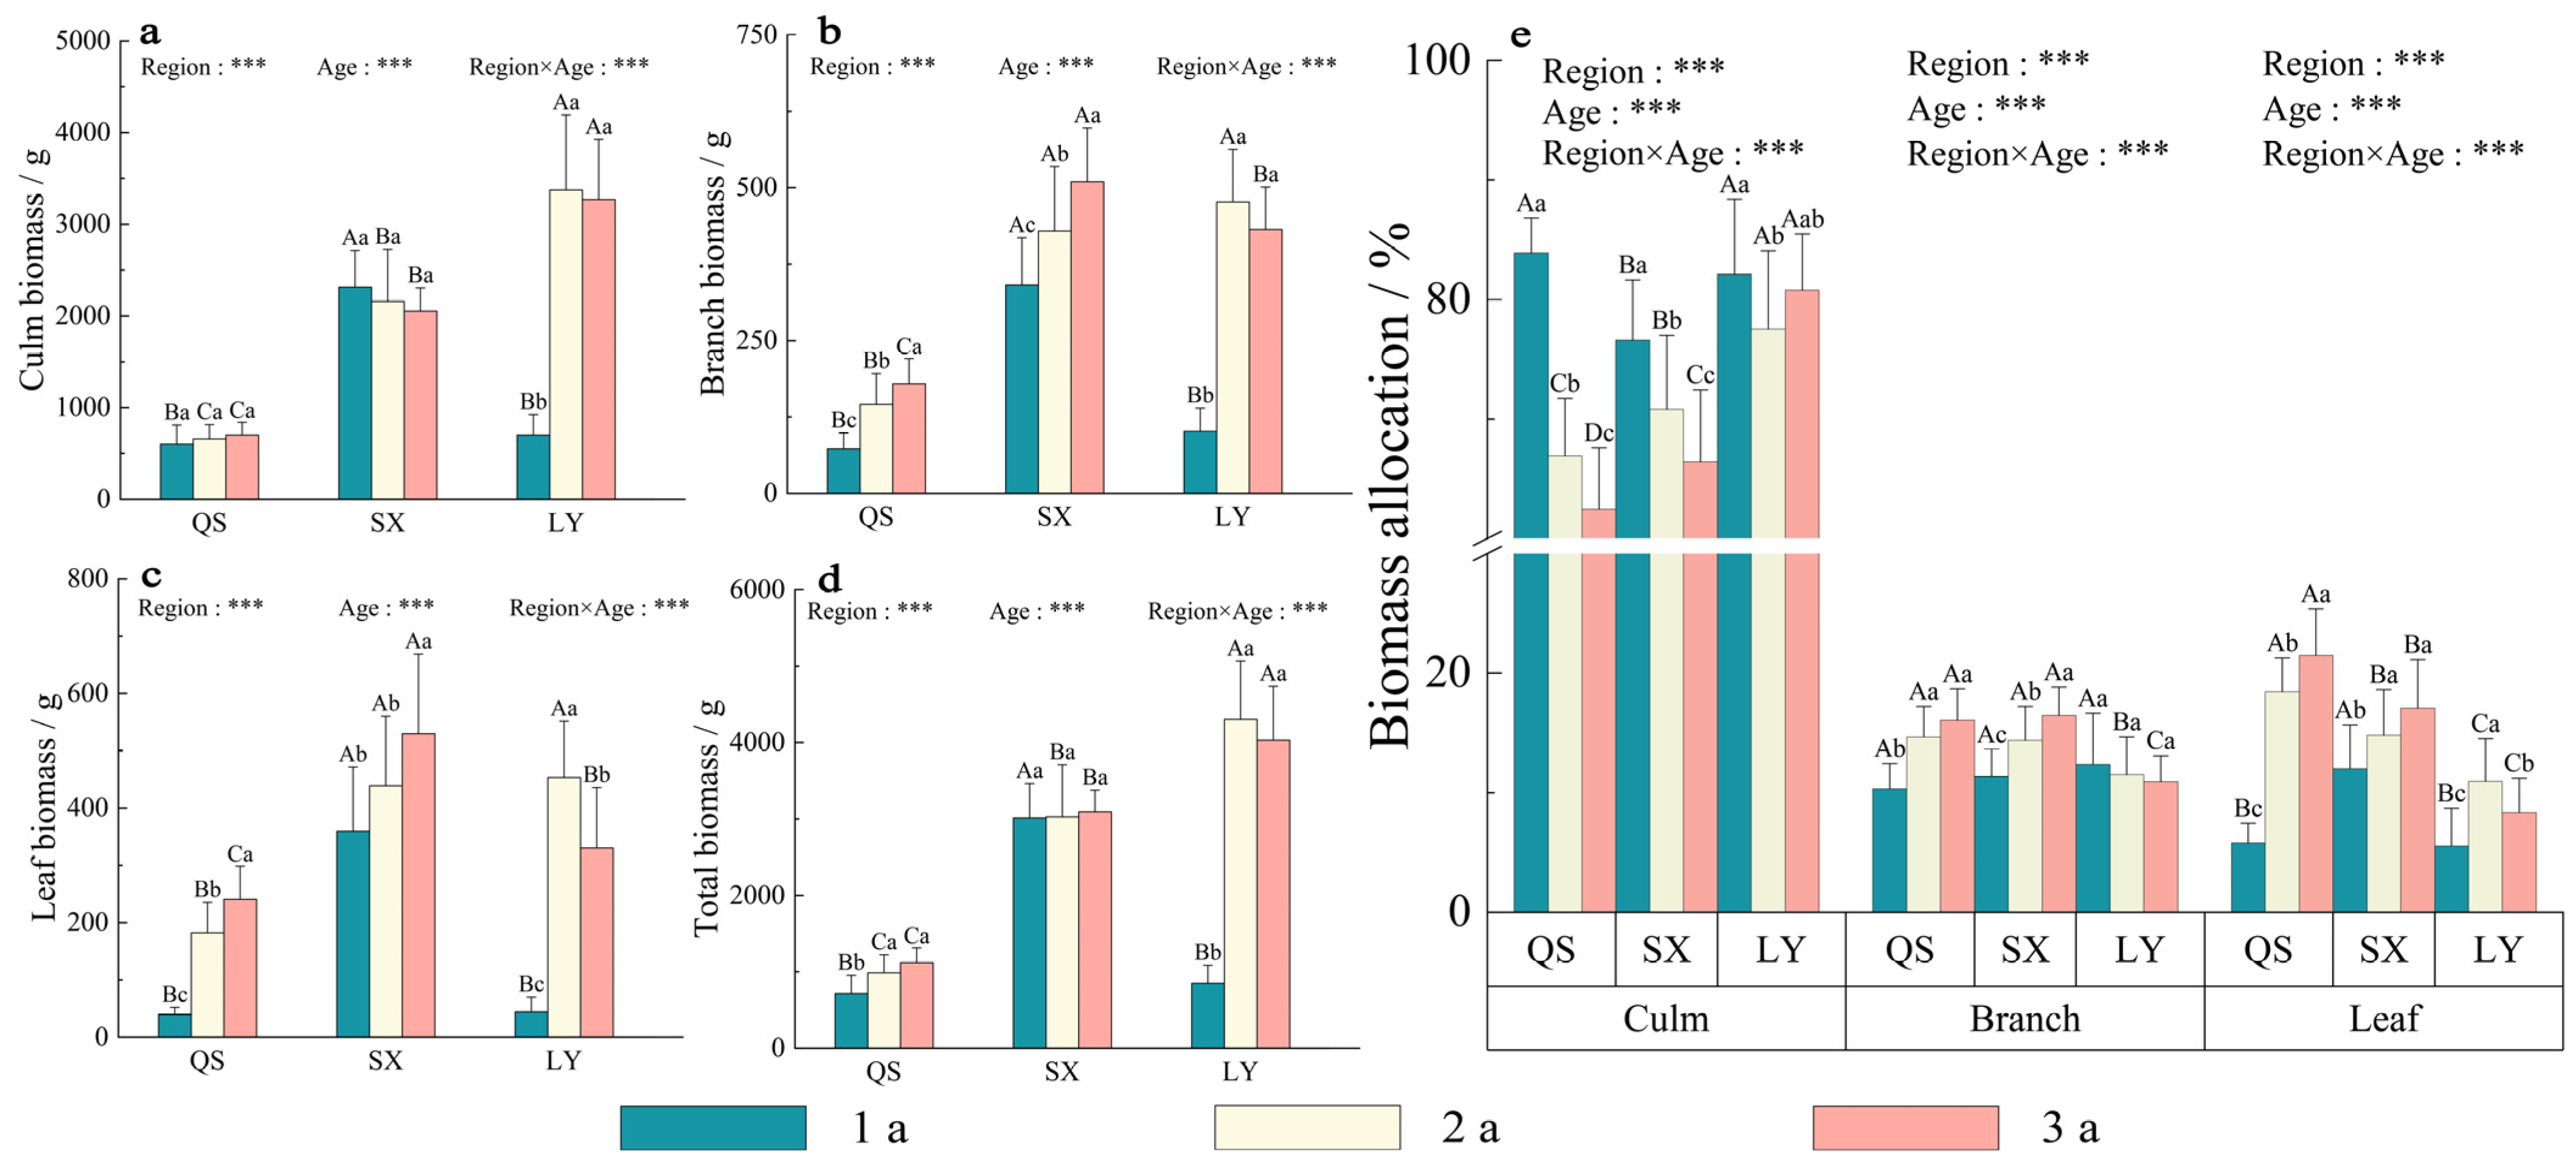
3.4. Biomass Accumulation and Allocation within the Three Regions

Regional and bamboo age interactions significantly affected the culm, branch, leaf, and total biomass of P. amarus (Figure 5a–d). Regionally, branch and leaf biomass decreased significantly with increasing latitude. As longitude increased, a significant increasing trend was observed in the culm and the total biomass of P. amarus, where differences in culm biomass ranged from 69.45% to 73.48% and differences in total biomass ranged from 68.47% to 69.13%. At the QS site, culm, branch, leaf, and total biomass all increased as bamboo age increased. At the SX site, culm biomass decreased as bamboo age increased, while the opposite trend was observed for branch, leaf, and total biomass. At the LY site, culm, branch, leaf, and total biomass increased sharply before slowly decreasing as bamboo age increased.
Regional and bamboo interactions significantly affected the culm, branch, and leaf biomass proportion of P. amarus (Figure 5e). Regionally, as latitude increased, culm biomass proportionally increased before decreasing, while branch and leaf biomass proportionally decreased before increasing. As longitude increased, there was a significant proportional increase in culm biomass, while there was a gradual proportional decrease in branch and leaf biomass. The culm biomass proportion at the QS and SX sites gradually decreased as bamboo age increased, while an opposite proportional trend was observed in branch and leaf biomass. The culm biomass proportion at the LY site initially decreased before increasing as bamboo age increased. The opposite trend was observed for the leaf biomass proportion, while the branch biomass proportion gradually decreased.

3.5. Explanatory Variable Contributions to Phenotypic Plasticity, Biomass Accumulation, and Allocation Using PCA

In this study, although PCA results showed significant component differences in climatic factors, soil factors, and biomass accumulation and allocation among the three regions (Figure 6b-1,c-1,d-1), phenotypic plasticity only changed slightly among the regions (Figure 6a-1). Furthermore, most soil, climate, and biomass factor indicators at the QS and SX sites varied significantly; however, the indicators only varied slightly at the LY site. The PCA numbers for phenotypic plasticity, biomass accumulation and allocation, climate factors, and soil factors in all three regions were 4, 2, 3, and 4, with a cumulative contribution of 83.533%, 94.871%, 77.452%, and 86.77%, respectively. Specifically, the most significant contributors to variance in phenotypic plasticity were DBH, wall thickness ratio (WTR), relative crown length (RCL), branching rate (BR), branch length (BL), and angle between the culm and branch (ABCB) (Figure 6a-2). The most significant contributors to variance in biomass accumulation and allocation were total biomass (TB), culm biomass (CB), culm biomass proportion (CBP), and leaf biomass proportion (LBP) (Figure 6b-2). Additionally, the four original variables (i.e., frost-free period (AFP), maximum temperature (MAXT), mean annual precipitation (MAP), and mean annual temperature (MAT)) contributed the most to climatic factor variance (Figure 6c-2), while the other four original variables (i.e., field water holding capacity (FWC), capillary porosity (CP), available phosphorus (AP), and total nitrogen (TN)) contributed the most to soil factor variance (Figure 6d-2).

3.6. Environmental Factor Effects on Phenotypic Plasticity and Biomass Accumulation and Allocation

To further investigate environmental factors and contribution effects (i.e., regional factors, climatic factors, soil factors, etc.) to variation in phenotypic plasticity and biomass accumulation and allocation, a PLS-SEM was constructed based on PCA (Figure 7). Climatic factors (i.e., maximum temperature (MAXT) and mean annual temperature (MAT)) were both high and significant, while soil factors (i.e., available phosphorus (AP) and capillary porosity (CP)) were high and highly significant, respectively (Figure 7a). Climate and soil factors had direct negative and positive effects on phenotypic plasticity, respectively. Furthermore, climate factors, soil factors, and phenotypic plasticity all had a direct and a significant negative effect on biomass accumulation and allocation (p < 0.01). Furthermore, climate factors had both a direct and indirect effect on phenotypic plasticity and biomass accumulation and allocation (Figure 7b), while direct climate factor effects were greater than corresponding indirect effects. Additionally, the total effect of soil factors was greater than that of climatic factors, where the former indirectly affected phenotypic plasticity. Generally, among climate factors, maximum temperature (MAXT) and mean annual temperature (MAT) were the highest and most significant (p < 0.05). They directly affected phenotypic plasticity while indirectly affecting biomass accumulation and allocation, mainly through soil factors and phenotypic plasticity.

4. Discussion

4.1. Relationship between Aboveground Components and Environmental Factors

Plant phenotypes derive from various morphological component features, influenced by both genetic and environmental factors [59] under either stable or variable conditions. When adapting to different environmental conditions, plants are able to produce a variety of plastic responses with respect to morphological structure and physiological characteristic variation. Among these adaptive strategies, phenotypic plasticity is key for plants that are adapting to environmental change [60]. In this study, as latitude increased, the DBH and the rounding ratio generally tended to first increase before decreasing. As longitude increased, DBH and mean internode length decreased significantly. At the same time, the relative total height and the wall thickness ratio increased, while the rounding ratio first decreased before increasing. This suggests a considerable regional influence on bamboo culm morphology. Moreover, culm morphology exhibited differing variation patterns between latitude and longitude. This pattern of change may closely correlate to both climate and soil factors [61,62]. China is influenced by a typical monsoon climate under a distinctive spatial and temporal temperature and precipitation distribution pattern. Hence, precipitation increases in a northwest-to-southeast direction while temperature increases from a northern-to-southern direction [63,64,65]. Thermal and hydrological conditions are key factors associated with bamboo population stability and expansion, especially during the shoot stage (i.e., April and May). These conditions are also important for morphogenetic culm processes over the following two months. The suitable temperatures and the sufficient rainfall of the SX and LY sites promoted cell division and differences in interstitial meristematic tissues. This resulted in exceptional morphological characteristics (i.e., long internodes and higher culms) [66]. However, lower temperatures and deficient rainfall typically reduce cell division and culm growth, which can even lead to cell death or a pause in growth (height). This caused a decrease in internodes and a reduction in culm height at the QS site. Because bamboo is devoid of a cambium component, culm and branch growth mature once height, diameter, and volume are attained [67]. Thus, DBH represents the size and the level of productivity of a bamboo forest. In this study, P. amarus grew larger and rounder the further east and south it extended, where internode length also increased. This indicated that P. amarus stand productivity increased to some extent, confirming the existence of regional differences in biomass variation. Generally, the larger the DBH of the culm is, the lower the wall thickness rate will be [68]. In this study, we observed a decrease in relative total height and culm wall thinning the further east and south that P. amarus extended. This indicated that the lateral extension of P. amarus (i.e., DBH enhancement) was faster than its longitudinal increase (i.e., height increment). This also suggested that the carbon (C) accumulation and assimilation capacity per unit DBH decreased. This could be associated with climate or soil differences among the three regions. Bamboo is inherently tolerant of barren conditions and is thus able to grow in unfertilized natural bamboo forests [69]. Suitable temperatures and precipitation conditions improve hydrothermal performance while greatly favoring bamboo growth. However, soil nutrient deficiency and growth limitations of natural bamboo forests (i.e., without fertilization), especially under phosphorus (P) limitations in China’s tropical and subtropical regions, constrict C accumulation during the rapid culm growth stage.
Crown structure, namely three-dimensional component morphological crown characteristics (i.e., spatial culm, branch, and leaf configurations), is an important factor that directly influences bamboo forest stand functions and productivity [70]. Generally, crown morphology in different bamboo species can significantly differ. Even for the same bamboo species, crown morphology typically exhibits obvious spatiotemporal differences, influencing sunlight interception and utilization resources [71]. In this study, with increasing latitude, crown, number of branch nodes, and angle between branches of the middle crown decreased significantly, while branch diameter of the upper crown exhibited a significant increasing trend, indicating that bamboo crowns tended to be more compact and narrower, especially at the QS site, which exhibited thin and smaller branches and branch angles. Generally, bamboo with narrower crowns and shorter branches have lower geometric coverage and spatial distribution [72]. The narrower crowns of bamboo at the QS site improved its stress tolerance to low temperatures and precipitation deficits, while also reducing transpiration, which promoted bamboo growth. At the QS site, the angle between branches of the middle crown and the diameter of the upper branches increased, providing more access to sunlight. This is particularly important for bamboo at the QS site, owing to its long light path, low light intensity, and slanted solar irradiation conditions [73]. Furthermore, plants tend to grow taller and require more sunlight at higher longitudes [74], especially for plants in wetter climate regions and those near the ocean. For successful growth and greater biomass accumulation, plants typically enhance their ability to capture and utilize sunlight through crown structure regulation, such as the growth and distribution of branches, crown width, and angles between branches, and the upward and outward growth of branches [75]. In this study, the relative crown length, crown width, number of branch nodes, branching ratio, and angle between branches at the bottom crown obviously decreased. However, the branch length of each crown and the branch diameter of the middle crown tended to significantly increase as longitude increased. This corresponds to our previous hypothesis that bamboo culm height and internode length will increase as longitude increases. PLS-SEM results showed that climate factors, especially under maximum temperature and mean annual temperature, can strongly and directly affect P. amarus phenotypic plasticity processes. Temperature is a key factor for bamboo growth, where maximum temperature and mean annual temperature were the most important abiotic factors. Suitable temperatures can promote photosynthetic rates and increase carbohydrate synthesis [76]. In grassland, it has been shown that the C storage capacity significantly decreased under increasing mean annual temperatures [77]. Moreover, extreme temperatures have caused significant radial growth reductions in coniferous forests (i.e., between 10 and 43%) [78]. Thus, energy and nutrients provide support to aboveground component growth while also accelerating cell division and cell elongation, promoting lateral bud germination and contributing to increased bamboo culm growth and branch length. However, when temperatures exceed the suitable growth range, bamboo may suffer heat stress, plant cell damage, excessive transpiration, and water and nutrient loss [79], which will slow down or even end component growth processes. Precipitation was a key environmental factor affecting bamboo component growth and development, while annual precipitation and its associated seasonal distribution were both limiting factors in all three regions [43] and in the quality of new bamboo growth. Drought, especially during critical shoot and sapling growth stages, typically results in decreased bamboo culm wall thickness and DBH under water stress [80], significantly decreasing culms and total biomass.

4.2. Relationship between Biomass Accumulation and Allocation and Environmental Factors

Biomass is an important indicator reflecting the growth status and productivity of plant populations within ecosystems [81], while also acting as a material cycle and energy flow substrate [82]. During growth and development, bamboo can balance available resources, allocating them to the culm, branch, leaf, etc., while simultaneously adapting to environmental change by continuously optimizing its biomass accumulation processes [83]. In this study, both branch and leaf biomass decreased significantly with increasing latitude. Furthermore, the culm and total biomass of P. amarus increased significantly with increasing longitude, where culm biomass ranged from 69.45% to 73.48% and total biomass ranged from 68.47% to 69.13%. As bamboo aged, its total biomass increased, while the total biomass of 2- and 3-year-old bamboo specimens was generally higher than 1-year-old specimens. This suggested that organic matter accumulation begins to gradually stall after 2 years of growth [84]. Thus, regional and age factors both had an obvious impact on P. amarus biomass accumulation. The suitable temperature and adequate precipitation conditions of the SX site, under a decrease in latitude and an increase in longitude, promoted P. amarus growth and an increase in leaf biomass accumulation. The resulting increase in leaf biomass significantly increased the photosynthetic quality of its organs and area, strengthening the overall photosynthetic C capacity of P. amarus. Ultimately, there was an improvement in both culm biomass and total biomass. This corroborates with findings from previous results, showing that bamboo DBH is greater and its internode length is longer as it extends in an eastward and southward direction, causing bamboo forest productivity to increase to some extent. This is basically consistent with results from Qing et al. (2004) [85], who showed that the total biomass of Pleioblastus maculatus increased under higher humidity and temperature conditions.
The plant biomass allocation pattern is a key reason behind differences in component plant plasticity [86]. In this study, as latitude increased, the culm biomass proportion first increased before decreasing, while the branch and leaf biomass proportion first decreased before increasing. As longitude increased, the culm biomass proportion increased significantly, while the branch and leaf biomass proportion gradually decreased. As bamboo aged, the culm biomass proportion of P. amarus exhibited a decreasing trend, while the corresponding branch and leaf biomass proportion gradually increased. This indicated that the photosynthetic C assimilation potential and the nutrient uptake capacity increases significantly as bamboo ages, promoting P. amarus growth. Thus, regional and bamboo age factors significantly affected P. amarus biomass allocation, reflected in its aboveground biomass allocation adaptation strategy. In mid-latitude and high-longitude regions, P. amarus will allocate more nutrient resources to its culm, promoting its growth and development, as shown at the LY site, thus increasing culm biomass and timber yields. However, the branch and leaf biomass proportion decreased accordingly, thus affecting its photosynthetic C assimilation capacity. This also confirms P. amarus component morphological variation in the different regions selected for this study. At the LY site, DBH was greater, internode length was longer, and bamboo stand productivity was higher. However, at this site, crown width and relative crown length were smaller, while the branching rate was lower. In this study, PLS-SEM results showed that P. amarus biomass accumulation and allocation processes were both indirectly influenced by climate factors through soil factors and phenotypic plasticity, while soil was able to maintain effective water content under suitable hydrothermal conditions and nutrient availability. Adequate soil water supplies help plant roots to absorb and transport water and nutrients [87]. If capillary pores are too large, soil aeration may increase, leading to increased water evaporation and root hypoxia [88]. Thus, phenotypic plasticity and biomass accumulation effectiveness will be impacted. During plant growth and metabolic processes, P plays an important role, especially in energy conversion, enzyme activity, and DNA synthesis [89]. Additionally, N is involved in building biomolecules such as proteins, chlorophyll, and nucleic acids in plants and is a key factor in biomass accumulation [90]. Adequate available soil P and TN content can promote culm growth and branching, increase leaf number and area, and strengthen photosynthetic processes while promoting efficient bamboo biomass accumulation and allocation. The SX site is situated at a lower latitude. This means that branching and leaf spreading processes occur comparatively earlier at this site under suitable hydrothermal conditions, which makes organ biomass accumulation more stable as bamboo ages. This makes the SX site suitable for P. amarus biomass accumulation.

5. Conclusions

Bamboo is an important non-timber forest resource and can thrive in barren land and is ecologically adaptable. Many economic bamboo species have a wide distribution region, such as P. amarus, being broadly distributed throughout China’s tropical and subtropical regions. This study showed that P. amarus component plasticity and biomass accumulation and allocation processes exhibited obvious regional differences. Low-latitude and high-longitude stands promoted biomass accumulation and efficient allocation, which subsequently provided good component plasticity and high productivity. Further, climate factors, such as maximum temperature and mean annual temperature, directly affected P. amarus component plasticity and biomass accumulation. Soil factors, soil available P, capillary porosity, the field water holding capacity, and TN resulted in high component plasticity variation while indirectly affecting P. amarus biomass accumulation and allocation processes. This novel study has uncovered new information about the adaptation strategies of P. amarus under environmental variation in three regions of China, which may provide excellent guidance for provenance selection and the directional cultivation of high-yield bamboo stands. In addition, there is a need for future research on the phenotypic plasticity variation of P. amarus in more regions in combination with physiological characteristics, which help to clarify the variation mechanism of phenotypic plasticity and the driving factors, and also provide theoretical guidance for bamboo provenance selection and directional cultivation.

Author Contributions

K.Z., L.F. and H.L. were involved in data analysis and in writing the original draft of the manuscript. J.Z., Y.D., L.Z. and R.H. were involved in fieldwork, sampling, and sample pretreatment stages. Z.G. and S.C. were involved in data analysis, while also reviewing, writing, and editing the manuscript, as well as in project supervision. All authors have read and agreed to the published version of the manuscript.

Funding

This study was funded in part by the National Key R&D Program of China (2021YFD2200501) and the Key Research and Development Program of Zhejiang (2020C02008).

Data Availability Statement

The data presented in this study are available in the article.

Acknowledgments

We would also like to thank the editor and anonymous reviewers for their contribution to the peer review process of this study.

Conflicts of Interest

The authors of this study declare no competing financial interests or personal relationships that could have influenced the results of this study.

References

  1. Yu, M.; Ding, G.; Gao, G.; Liu, Z.; Wang, C. Double effects of age and environment on resource allocation trade-offs of Salix psammophila in different microtopographic habitats of a sand dune. J. Plant Growth Regul. 2019, 39, 544–552. [Google Scholar] [CrossRef]
  2. Michaletz, S.T.; Cheng, D.; Kerkhoff, A.J.; Enquist, B.J. Convergence of terrestrial plant production across global climate gradients. Nature 2014, 512, 39–43. [Google Scholar] [CrossRef] [PubMed]
  3. Raich, J.W.; Russell, A.E.; Kitayama, K.; Parton, W.J.; Vitousek, P.M. Temperature influences carbon accumulation in moist tropical forests. Ecology 2006, 87, 76–87. [Google Scholar] [CrossRef] [PubMed]
  4. Lie, G.; Xue, L. Biomass allocation patterns in forests growing different climatic zones of China. Trees 2015, 30, 639–646. [Google Scholar] [CrossRef]
  5. Olivera Viciedo, D.; de Mello Prado, R.; Martinez, C.A.; Habermann, E.; de Cassia Piccolo, M.; Calero Hurtado, A.; Barreto, R.F.; Pena Calzada, K. Changes in soil water availability and air-temperature impact biomass allocation and C:N:P stoichiometry in different organs of Stylosanthes capitata Vogel. J. Environ. Manag. 2021, 278, 111540. [Google Scholar] [CrossRef] [PubMed]
  6. Olivera Viciedo, D.; de Mello Prado, R.; Martinez, C.A.; Habermann, E.; de Cassia Piccolo, M. Short-term warming and water stress affect Panicum maximum Jacq. stoichiometric homeostasis and biomass production. Sci. Total Environ. 2019, 681, 267–274. [Google Scholar] [CrossRef] [PubMed]
  7. Pan, Y.; Zhang, Z.; Zhang, M.; Huang, P.; Dai, L.; Ma, Z.; Liu, J. Climate vs. nutrient control: A global analysis of driving environmental factors of wetland plant biomass allocation strategy. J. Clean. Prod. 2023, 406, 136983. [Google Scholar] [CrossRef]
  8. Wang, P.; Heijmans, M.M.P.D.; Mommer, L.; van Ruijven, J.; Maximov, T.C.; Berendse, F. Belowground plant biomass allocation in tundra ecosystems and its relationship with temperature. Environ. Res. Lett. 2016, 11, 055003. [Google Scholar] [CrossRef]
  9. Mao, W.; Allington, G.; Li, Y.L.; Zhang, T.H.; Wang, S.K. Life history strategy influences biomass allocation in response to limiting nutrients and water in an arid system. Pol. J. Ecol. 2012, 60, 545–557. [Google Scholar]
  10. Villar, R.; Veneklaas, E.J.; Jordano, P.; Lambers, H. Relative growth rate and biomass allocation in 20 Aegilops (Poaceae) species. New Phytol. 1998, 140, 425–437. [Google Scholar] [CrossRef]
  11. Poorter, H.; Sack, L. Pitfalls and possibilities in the analysis of biomass allocation patterns in plants. Front. Plant Sci. 2012, 3, 259. [Google Scholar] [CrossRef] [PubMed]
  12. Padilla, F.M.; Miranda, J.D.; Jorquera, M.J.; Pugnaire, F.I. Variability in amount and frequency of water supply affects roots but not growth of arid shrubs. Plant Ecolog. 2009, 204, 261–270. [Google Scholar] [CrossRef]
  13. Liu, Y.; Xu, M.; Li, G.; Wang, M.; Li, Z.; De Boeck, H.J. Changes of aboveground and belowground biomass allocation in four dominant grassland species across a precipitation gradient. Front. Plant Sci. 2021, 12, 650802. [Google Scholar] [CrossRef] [PubMed]
  14. Santiago, L.S.; Goldstein, G.; Meinzer, F.C.; Fisher, J.B.; Machado, K.; Woodruff, D.; Jones, T. Leaf photosynthetic traits scale with hydraulic conductivity and wood density in Panamanian forest canopy trees. Oecologia 2004, 140, 543–550. [Google Scholar] [CrossRef] [PubMed]
  15. Deng, J.-M.; Wang, G.-X.; Morris, E.C.; Wei, X.-P.; Li, D.-X.; Chen, B.-M.; Zhao, C.-M.; Liu, J.; Wang, Y.U.N. Plant mass-density relationship along a moisture gradient in north-west China. J. Ecol. 2006, 94, 953–958. [Google Scholar] [CrossRef]
  16. Wang, J.; Gao, J.; Wu, Y.; Xu, B.; Shi, F.; Zhou, H.; Bisht, N.; Wu, N. Effects of heterogeneous environment after deforestation on plant phenotypic plasticity of three shrubs based on leaf traits and biomass allocation. Front. Ecol. Evol. 2021, 9, 608663. [Google Scholar] [CrossRef]
  17. Schellenberger Costa, D.; Classen, A.; Ferger, S.; Helbig-Bonitz, M.; Peters, M.; Bohning-Gaese, K.; Steffan-Dewenter, I.; Kleyer, M. Relationships between abiotic environment, plant functional traits, and animal body size at Mount Kilimanjaro, Tanzania. PLoS ONE 2017, 12, e0174157. [Google Scholar] [CrossRef]
  18. Wang, Y.; Zhang, L.; Chen, J.; Feng, L.; Li, F.; Yu, L. Study on the relationship between functional characteristics and environmental factors in karst plant communities. Ecol. Evol. 2022, 12, e9335. [Google Scholar] [CrossRef]
  19. Mizutani, M.; Kanaoka, M.M. Environmental sensing and morphological plasticity in plants. Semin. Cell Dev. Biol. 2018, 83, 69–77. [Google Scholar] [CrossRef]
  20. Pigliucci, M. Evolution of phenotypic plasticity: Where are we going now? Trends Ecol. Evol. 2005, 20, 481–486. [Google Scholar] [CrossRef]
  21. Gratani, L. Plant phenotypic plasticity in response to environmental factors. Adv. Bot. 2014, 2014, 1–17. [Google Scholar] [CrossRef]
  22. Aribal, L.G.; Parlucha, J.A.; Gelaga, J.N.; Aguinsatan, R.G. Influence of abiotic factors on growth and development of giant Bamboo (Dendrocalamus Asper) in bukidnon, philippines. J. Trop. For. Sci. 2022, 34, 63–73. [Google Scholar] [CrossRef]
  23. Lihavainen, J.; Ahonen, V.; Keski-Saari, S.; Kontunen-Soppela, S.; Oksanen, E.; Keinanen, M. Low vapour pressure deficit affects nitrogen nutrition and foliar metabolites in silver birch. J. Exp. Bot. 2016, 67, 4353–4365. [Google Scholar] [CrossRef] [PubMed]
  24. Bjorkman, A.D.; Myers-Smith, I.H.; Elmendorf, S.C.; Normand, S.; Ruger, N.; Beck, P.S.A.; Blach-Overgaard, A.; Blok, D.; Cornelissen, J.H.C.; Forbes, B.C.; et al. Plant functional trait change across a warming tundra biome. Nature 2018, 562, 57–62. [Google Scholar] [CrossRef] [PubMed]
  25. Li, W.; Wang, Y.; Zhang, Y.; Wang, R.; Guo, Z.; Xie, Z. Impacts of drought stress on the morphology, physiology, and sugar content of Lanzhou lily (Lilium davidii var. unicolor). Acta Physiol. Plant. 2020, 42, 127. [Google Scholar] [CrossRef]
  26. Kessler, M.; Siorak, Y.; Wunderlich, M.; Wegner, C. Patterns of morphological leaf traits among pteridophytes along humidity and temperature gradients in the Bolivian Andes. Funct. Plant Biol. 2007, 34, 963–971. [Google Scholar] [CrossRef]
  27. Sugiyama, S. Geographical distribution and phenotypic differentiation in populations of Dactylis glomerata L. in Japan. Plant Ecolog. 2002, 169, 295–305. [Google Scholar] [CrossRef]
  28. Ellison, A.M.; Buckley, H.L.; Miller, T.E.; Gotelli, N.J. Morphological variation in Sarracenia purpurea (Sarraceniaceae): Geographic, environmental, and taxonomic correlates. Am. J. Bot. 2004, 91, 1930–1935. [Google Scholar] [CrossRef]
  29. Ruedas, M.; Valverde, T.; Zavala-Hurtado, J.A. Analysis of the factors that affect the distribution and abundance of three Neobuxbaumia species (Cactaceae) that differ in their degree of rarity. Acta Oecologica 2006, 29, 155–164. [Google Scholar] [CrossRef]
  30. Uribe-Salas, D.; Sáenz-Romero, C.; González-Rodríguez, A.; Téllez-Valdéz, O.; Oyama, K. Foliar morphological variation in the white oak Quercus rugosa Née (Fagaceae) along a latitudinal gradient in Mexico: Potential implications for management and conservation. For. Ecol. Manage 2008, 256, 2121–2126. [Google Scholar] [CrossRef]
  31. Pyakurel, A.; Wang, J.R. Leaf morphological variation among paper birch (Betula papyrifera Marsh.) genotypes across Canada. Open J. Ecol. 2013, 3, 284–295. [Google Scholar] [CrossRef]
  32. Arroyo-Cosultchi, G.; Arias, S.; López-Mata, L.; Terrazas, T. Morphological plasticity of an endemic widespread columnar cactus and its congener. Braz. J. Bot. 2017, 40, 1029–1040. [Google Scholar] [CrossRef]
  33. Dorken, M.E.; Barrett, S.C. Phenotypic plasticity of vegetative and reproductive traits in monoecious and dioecious populations of Sagittaria latifolia (Alismataceae): A clonal aquatic plant. J. Ecol. 2004, 92, 32–44. [Google Scholar] [CrossRef]
  34. Milla, R.; Reich, P.B. Multi-trait interactions, not phylogeny, fine-tune leaf size reduction with increasing altitude. Ann. Bot. 2011, 107, 455–465. [Google Scholar] [CrossRef] [PubMed]
  35. Mou, P.; Jones, R.H.; Tan, Z.; Bao, Z.; Chen, H. Morphological and physiological plasticity of plant roots when nutrients are both spatially and temporally heterogeneous. Plant Soil 2013, 364, 373–384. [Google Scholar] [CrossRef]
  36. Wang, R.; Yu, G.; He, N.; Wang, Q.; Zhao, N.; Xu, Z. Latitudinal variation of leaf morphological traits from species to communities along a forest transect in eastern China. J. Geogr. Sci 2016, 26, 15–26. [Google Scholar] [CrossRef]
  37. Liu, G.; Freschet, G.T.; Pan, X.; Cornelissen, J.H.; Li, Y.; Dong, M. Coordinated variation in leaf and root traits across multiple spatial scales in Chinese semi-arid and arid ecosystems. New Phytol. 2010, 188, 543–553. [Google Scholar] [CrossRef]
  38. Moller, A.P.; Merilä, J. Analysis and interpretation of long-term studies investigating responses to climate change. In Birds and Climate Change; Advances in Ecological Research; Elsevier: Amsterdam, The Netherlands, 2004; Volume 35, pp. 111–130. [Google Scholar]
  39. Du, H.; Mao, F.; Li, X.; Zhou, G.; Xu, X.; Han, N.; Sun, S.; Gao, G.; Cui, L.; Li, Y.; et al. Mapping global bamboo forest distribution using multisource remote sensing data. IEEE J. Sel. Top. Appl. Earth Obs. Remote Sens. 2018, 11, 1458–1471. [Google Scholar] [CrossRef]
  40. Li, W.; Shi, C.; Li, K.; Zhang, Q.J.; Tong, Y.; Zhang, Y.; Wang, J.; Clark, L.; Gao, L.Z. Draft genome of the herbaceous bamboo Raddia distichophylla. G3 Genes Genome Genetics 2021, 11, jkaa049. [Google Scholar] [CrossRef]
  41. Chaturvedi, K.; Singhwane, A.; Dhangar, M.; Mili, M.; Gorhae, N.; Naik, A.; Prashant, N.; Srivastava, A.K.; Verma, S. Bamboo for producing charcoal and biochar for versatile applications. Biomass Convers. Biorefin. 2023, 1–27. [Google Scholar] [CrossRef]
  42. Takano, K.T.; Hibino, K.; Numata, A.; Oguro, M.; Aiba, M.; Shiogama, H.; Takayabu, I.; Nakashizuka, T. Detecting latitudinal and altitudinal expansion of invasive bamboo Phyllostachys edulis and Phyllostachys bambusoides (Poaceae) in Japan to project potential habitats under 1.5 °C -4.0 °C global warming. Ecol. Evol. 2017, 7, 9848–9859. [Google Scholar] [CrossRef] [PubMed]
  43. Shi, P.; Preisler, H.K.; Quinn, B.K.; Zhao, J.; Huang, W.; Röll, A.; Cheng, X.; Li, H.; Hölscher, D. Precipitation is the most crucial factor determining the distribution of moso bamboo in Mainland China. Global Ecol. Conserv. 2020, 22, e00924. [Google Scholar] [CrossRef]
  44. Guo, W.; Cherubini, P.; Zhang, J.; Hu, X.; Li, M.-H.; Qi, L. Soil physicochemical properties determine leaf traits but not size traits of moso bamboo (Phyllostachys edulis). Environ. Res. Lett. 2022, 17, 114061. [Google Scholar] [CrossRef]
  45. Guo, Z.; Lin, H.; Chen, S.; Yang, Q. Altitudinal patterns of leaf traits and leaf allometry in bamboo Pleioblastus amarus. Front. Plant Sci. 2018, 9, 1110. [Google Scholar] [CrossRef] [PubMed]
  46. Ao, X.; Yan, J.; Liu, S.; Chen, S.; Zou, L.; Yang, Y.; He, L.; Li, S.; Liu, A.; Zhao, K. Extraction, isolation and identification of four phenolic compounds from Pleioblastus amarus shoots and their antioxidant and anti-inflammatory properties in vitro. Food Chem. 2022, 374, 131743. [Google Scholar] [CrossRef] [PubMed]
  47. Chen, G.-T.; Tu, L.-H.; Peng, Y.; Hu, H.-L.; Hu, T.-X.; Xu, Z.-F.; Liu, L.; Tang, Y. Effect of nitrogen additions on root morphology and chemistry in a subtropical bamboo forest. Plant Soil 2016, 412, 441–451. [Google Scholar] [CrossRef]
  48. Shi, J.; Chen, S.; Guo, Z.; Zhang, C. Influence of altitude on culm form, crown, phylliform of Phyllostachys prominens. J. Northeast. For. Univ. 2018, 46, 13–17. [Google Scholar] [CrossRef]
  49. Lan, M.; Xue, C.; Yang, J.; Wang, N.; Sun, C.; Wu, G.; Chen, H.; Su, Z. Changes in plant diversity and soil factors under different rocky desertification degrees in Northern Guangdong, China. Forests 2023, 14, 694. [Google Scholar] [CrossRef]
  50. Liu, Y.; Wang, H.; Zhang, H.; Liber, K. A comprehensive support vector machine-based classification model for soil quality assessment. Soil Tillage Res. 2016, 155, 19–26. [Google Scholar] [CrossRef]
  51. Huang, D.; Luo, T.; Li, Y.; Qiu, X. Tebeigai soil conditioner can increase eggplant yield, reduce heavy metal content and improve soil acidification. J. Phys. Conf. Ser. 2020, 1622, 012077. [Google Scholar] [CrossRef]
  52. Neyeloff, J.L.; Fuchs, S.C.; Moreira, L.B. Meta-analyses and forest plots using a microsoft excel spreadsheet: Step-by-step guide focusing on descriptive data analysis. BMC Res. Notes 2012, 5, 52. [Google Scholar] [CrossRef] [PubMed]
  53. Shafiee, Z.; Sharifi, G. Comparing the effect of resistance, aerobic, and concurrent exercise program on the level of resistin and high reactive protein C of overweight and obese women. Int. Arch. Health Sci. 2017, 4, 1–6. [Google Scholar] [CrossRef]
  54. Lee, B.-H.; De Jesús Pérez, J.J.; Moiseenkova-Bell, V.; Rohacs, T. Structural basis of the activation of TRPV5 channels by long-chain acyl-Coenzyme-A. Nat. Commun. 2023, 14, 5883. [Google Scholar] [CrossRef] [PubMed]
  55. Lê, S.; Josse, J.; Husson, F. FactoMineR: An R package for multivariate analysis. J. Stat. Softw. 2008, 25, 1–18. [Google Scholar] [CrossRef]
  56. Kassambara, A.; Mundt, F. Extract and Visualize the Results of Multivariate Data Analyses [R Package Factoextra Version 1.0.7]. 2020. Available online: https://scirp.org/reference/referencespapers?referenceid=3067217 (accessed on 14 June 2023).
  57. Wong, K.K.-K. Partial least squares structural equation modeling (PLS-SEM) techniques using SmartPLS. Mark. Bull. 2013, 24, 1–32. [Google Scholar]
  58. Hu, B.; Ni, H.; Xie, M.; Li, H.; Wen, Y.; Chen, S.; Zhou, Y.; Teng, H.; Bourennane, H.; Shi, Z. Mapping soil organic matter and identifying potential controls in the farmland of Southern China: Integration of multi-source data, machine learning and geostatistics. Land Degrad. Dev. 2023, 34, 5468–5485. [Google Scholar] [CrossRef]
  59. Li, Y.; Li, S.; Lu, X.; Wang, Q.; Han, H.; Zhang, X.; Ma, Y.; Gan, X. Leaf phenotypic variation of endangered plant Tetracentron sinense Oliv. and influence of geographical and climatic factors. J. For. Res. 2021, 32, 623–636. [Google Scholar] [CrossRef]
  60. Henn, J.J.; Buzzard, V.; Enquist, B.J.; Halbritter, A.H.; Klanderud, K.; Maitner, B.S.; Michaletz, S.T.; Potsch, C.; Seltzer, L.; Telford, R.J.; et al. Intraspecific trait variation and phenotypic plasticity mediate alpine plant species response to climate change. Front. Plant Sci. 2018, 9, 1548. [Google Scholar] [CrossRef]
  61. Mulatu, Y. Growth, Morphology and Biomass of Arundinaria alpina (Highland Bamboo) (Poaceae) as Affected by Landrace, Environment and Silvicultural Management in the Choke Mountain, Northwestern Ethiopia. 2012. Available online: https://www.efd.gov.et/wp-content/uploads/2016/01/PhD-Thesis-on-bamboo-management.-Yirgadu-Mulatu.pdf (accessed on 14 June 2023).
  62. Banik, R.L. Morphology and growth. In Bamboo: The Plant and Its Uses; Springer: Berlin/Heidelberg, Germany, 2015; pp. 43–89. [Google Scholar]
  63. Dai, E.; Wu, Z.; Ge, Q.; Xi, W.; Wang, X. Predicting the responses of forest distribution and aboveground biomass to climate change under RCP scenarios in southern China. Global Change Biol. 2016, 22, 3642–3661. [Google Scholar] [CrossRef]
  64. Cheng, Y.; Liu, H.; Dong, Z.; Duan, K.; Wang, H.; Han, Y. East Asian summer monsoon and topography co-determine the Holocene migration of forest-steppe ecotone in northern China. Global Planet. Change 2020, 187, 103135. [Google Scholar] [CrossRef]
  65. Yu, L.; Liu, Y.; Liu, T.; Yan, F. Impact of recent vegetation greening on temperature and precipitation over China. Agric. For. Meteorol. 2020, 295, 108197. [Google Scholar] [CrossRef]
  66. Tao, G.-Y.; Ramakrishnan, M.; Vinod, K.K.; Yrjälä, K.; Satheesh, V.; Cho, J.; Fu, Y.; Zhou, M. Multi-omics analysis of cellular pathways involved in different rapid growth stages of moso bamboo. Tree Physiol. 2020, 40, 1487–1508. [Google Scholar] [CrossRef] [PubMed]
  67. Nurmadina; Nugroho, N.; Bahtiar, E.T. Structural grading of Gigantochloa apus bamboo based on its flexural properties. Constr. Build. Mater. 2017, 157, 1173–1189. [Google Scholar] [CrossRef]
  68. Zhang, Z.; Rao, F.; Wang, Y. Morphological, Chemical, and Physical–mechanical properties of a clumping bamboo (Thyrsostachys oliveri) for construction applications. Polymers 2022, 14, 3681. [Google Scholar] [CrossRef] [PubMed]
  69. Hunter, I.R. Bamboo resources, uses and trade: The future? J. Bamboo Ratt. 2003, 2, 319–326. [Google Scholar] [CrossRef]
  70. Zhao, X.; Feng, Y.; Xu, K.; Cao, M.; Hu, S.; Yang, Q.; Liu, X.; Ma, Q.; Hu, T.; Kelly, M.; et al. Canopy structure: An intermediate factor regulating grassland diversity-function relationships under human disturbances. Fundam. Res. 2023, 3, 179–187. [Google Scholar] [CrossRef]
  71. Holder, C.D.; Gibbes, C. Influence of leaf and canopy characteristics on rainfall interception and urban hydrology. Hydrol. Sci. J. 2016, 62, 182–190. [Google Scholar] [CrossRef]
  72. Zhang, J.; Gou, Z.; Zhang, F.; Shutter, L. A study of tree crown characteristics and their cooling effects in a subtropical city of Australia. Ecol. Eng. 2020, 158, 106027. [Google Scholar] [CrossRef]
  73. Ferrante, A.; Mariani, L. Agronomic management for enhancing plant tolerance to abiotic stresses: High and low values of temperature, light intensity, and relative humidity. Horticulturae 2018, 4, 21. [Google Scholar] [CrossRef]
  74. Su, Y.; Hu, T.; Wang, Y.; Li, Y.; Dai, J.; Liu, H.; Jin, S.; Ma, Q.; Wu, J.; Liu, L.; et al. Large-scale geographical variations and climatic controls on crown architecture traits. J. Geophys. Res. Biogeosci. 2020, 125, e2019JG005306. [Google Scholar] [CrossRef]
  75. Craine, J.M.; Dybzinski, R.; Robinson, D. Mechanisms of plant competition for nutrients, water and light. Funct. Ecol. 2013, 27, 833–840. [Google Scholar] [CrossRef]
  76. Iqbal, N.; Fatma, M.; Gautam, H.; Umar, S.; Sofo, A.; D’Ippolito, I.; Khan, N.A. The crosstalk of melatonin and hydrogen sulfide determines photosynthetic performance by regulation of carbohydrate metabolism in wheat under heat stress. Plants 2021, 10, 1778. [Google Scholar] [CrossRef] [PubMed]
  77. Luo, W.; Jiang, Y.; Lü, X.; Wang, X.; Li, M.-H.; Bai, E.; Han, X.; Xu, Z. Patterns of plant biomass allocation in temperate grasslands across a 2500-km transect in northern China. PLoS ONE 2013, 8, e71749. [Google Scholar] [CrossRef] [PubMed]
  78. Pichler, P.; Oberhuber, W. Radial growth response of coniferous forest trees in an inner Alpine environment to heat-wave in 2003. For. Ecol. Manag. 2007, 242, 688–699. [Google Scholar] [CrossRef]
  79. Blessing, C.H.; Werner, R.A.; Siegwolf, R.; Buchmann, N. Allocation dynamics of recently fixed carbon in beech saplings in response to increased temperatures and drought. Tree Physiol. 2015, 35, 585–598. [Google Scholar] [CrossRef] [PubMed]
  80. Gu, D.; He, W.; Huang, K.; Otieno, D.; Zhou, C.; He, C.; Huang, Y. Transpiration of Moso bamboo in southern China is influenced by ramet age, phenology, and drought. For. Ecol. Manag. 2019, 450, 117526. [Google Scholar] [CrossRef]
  81. Zaeem, M.; Nadeem, M.; Pham, T.H.; Ashiq, W.; Ali, W.; Gilani, S.S.M.; Elavarthi, S.; Kavanagh, V.; Cheema, M.; Galagedara, L.; et al. The potential of corn-soybean intercropping to improve the soil health status and biomass production in cool climate boreal ecosystems. Sci. Rep. 2019, 9, 13148. [Google Scholar] [CrossRef]
  82. Shen, X.; Jiang, M.; Lu, X.; Liu, X.; Liu, B.; Zhang, J.; Wang, X.; Tong, S.; Lei, G.; Wang, S.; et al. Aboveground biomass and its spatial distribution pattern of herbaceous marsh vegetation in China. Sci. China Earth Sci. 2021, 64, 1115–1125. [Google Scholar] [CrossRef]
  83. Liang, Z.; Liu, T.; Chen, X.; Xu, W.; Dong, T.; Liu, Q.; Xu, X. Twigs of dove tree in high-latitude region tend to increase biomass accumulation in vegetative organs but decrease it in reproductive organs. Front. Plant Sci. 2022, 13, 1088955. [Google Scholar] [CrossRef]
  84. Zheng, Y.; Feng, Y.; Fan, S.; Zhang, M.; Zhang, X.; Zhou, X.; Guan, F. Effects of different harvesting methods on aboveground nutrient pools of Moso Bamboo (Phyllostachys edulis) forest in China. Forests 2022, 13, 2138. [Google Scholar] [CrossRef]
  85. Qing, L.; Yunxiang, L.; Zhangcheng, Z. Effects of moisture availability on clonal growth in bamboo Pleioblastus maculata. Plant Ecolog. 2004, 173, 107–113. [Google Scholar] [CrossRef]
  86. Umaña, M.N.; Arellano, G.; Swenson, N.G.; Zambrano, J. Tree seedling trait optimization and growth in response to local-scale soil and light variability. Ecology 2021, 102, e03252. [Google Scholar] [CrossRef] [PubMed]
  87. Enebe, M.C.; Babalola, O.O. The influence of plant growth-promoting rhizobacteria in plant tolerance to abiotic stress: A survival strategy. Appl. Microbiol. Biotechnol. 2018, 102, 7821–7835. [Google Scholar] [CrossRef] [PubMed]
  88. Li, Y.; Niu, W.; Cao, X.; Zhang, M.; Wang, J.; Zhang, Z. Growth response of greenhouse-produced muskmelon and tomato to sub-surface drip irrigation and soil aeration management factors. BMC Plant Biol. 2020, 20, 141. [Google Scholar] [CrossRef]
  89. Lin, C.; Hang, T.; Jiang, C.; Yang, P.; Zhou, M. Effects of different phosphorus levels on tiller bud development in hydroponic Phyllostachys edulis seedlings. Tree Physiol. 2023, 43, 1416–1431. [Google Scholar] [CrossRef]
  90. Tewari, R.K.; Yadav, N.; Gupta, R.; Kumar, P. Oxidative stress under macronutrient deficiency in plants. J. Soil Sci. Plant Nutr. 2021, 21, 832–859. [Google Scholar] [CrossRef]
Figure 1. Sampling location and topographic map of experimental P. amarus stands in three provinces.
Forests 15 00043 g001
Figure 2. P. amarus culm morphology in the three regions. (a): Diameter at breast height (DBH); (b): relative total height (RTH); (c): relative height under branch (RHB); (d): mean internode length (MIL); (e): wall thickness ratio (WTR); (f): rounding ratio (RR). QS: Qianshan County; SX: Shaxian County; LY: Longyou County. The three locations are in order from south to north, SX to LY to QS, i.e., the latitude gradually increases. The three locations are QS to SX to LY from west to east, i.e., the longitude gradually increases. Different uppercase letters denote significant differences among regions under the same age; different lowercase letters denote significant differences among ages under the same region. “*” p < 0.05; “**” p < 0.01; “***” p < 0.001; “ns” not significant (p > 0.05).
Forests 15 00043 g002
Figure 3. P. amarus crown morphology in the three regions. (a): Crown width (CW); (b): relative crown length (RCL); (c): number of branch nodes (NOBN); (d) branching rate (BR). QS: Qianshan County; SX: Shaxian County; LY: Longyou County. The three locations are in order from south to north, SX to LY to QS, i.e., the latitude gradually increases. The three locations are QS to SX to LY from west to east, i.e., the longitude gradually increases. Different uppercase letters denote significant differences among regions under the same age; different lowercase letters denote significant differences among ages under the same region. “*” p < 0.05; “***” p < 0.001; “ns” not significant (p > 0.05).
Forests 15 00043 g003
Figure 4. P. amarus branch morphology in the three regions. (a): Number of branches (NOB); (b): branch length (BL); (c): branch diameter (BD); (d): angle between the culm and branch (ABCB); (e): angle between branches (ABB). QS: Qianshan County; SX: Shaxian County; LY: Longyou County. The three locations are in order from south to north, SX to LY to QS, i.e., the latitude gradually increases. The three locations are QS to SX to LY from west to east, i.e., the longitude gradually increases. Different lowercase letters denote significant differences between crowns of the same age in the same region. “*” p < 0.05; “**” p < 0.01; “***” p < 0.001; “ns” not significant (p > 0.05).
Forests 15 00043 g004
Figure 5. P. amarus biomass (organ) accumulation and allocation in the three regions. For biomass accumulation, (a): culm biomass (CB); (b): branch biomass (BB); (c): leaf biomass (LB); (d): total biomass (TB). For biomass allocation, (e): culm biomass proportion (CBP); branch biomass proportion (BBP); leaf biomass proportion (LBP). QS: Qianshan County; SX: Shaxian County; LY: Longyou County. The three locations are in order from south to north, SX to LY to QS, i.e., the latitude gradually increases. The three locations are QS to SX to LY from west to east, i.e., the longitude gradually increases. Different uppercase letters denote significant differences among regions under the same age; different lowercase letters denote significant differences among ages under the same region. “***” p < 0.001 (p > 0.05).
Forests 15 00043 g005
Figure 6. Principal component analysis (PCA) of P. amarus stand phenotypic plasticity, biomass accumulation and allocation, climatic factors, and soil factors in the three regions. Figure (a-1,b-1,c-1,d-1) show each indicator’s contribution for the first two principal components of variance at the P. amarus study sites, respectively, while ovals within the figures represent 95% confidence intervals. Figure (a-2,b-2,c-2,d-2) show the total contribution of different indicators for the different principal components, respectively. The red dashed line is the expected mean contribution, where variables significantly contributed to primary components when their contribution exceeded this line. QS: Qianshan County; SX: Shaxian County; LY: Longyou County. The three locations are in order from south to north, SX to LY to QS, i.e., the latitude gradually increases. The three locations are QS to SX to LY from west to east, i.e., the longitude gradually increases.
Forests 15 00043 g006
Figure 7. Partial least square structural equation modeling (PLS-SEM) describes the relationships between geography, climate, soil factors and components, and morphology. P. amarus biomass accumulation and allocation are shown in (a). Values above arrows (i.e., from circles to rectangles and those close to environmental factors) indicate loadings. Solid red- and blue-colored arrows represent positive and negative relationships, respectively, while dashed arrows represent non-significant relationships. The width of the arrow is proportional to its significance level. Numbers near arrows represent the standardized path coefficient, while R2 represents the proportion of variance explained for each variable. Note: significant codes: *** means the p-value is between 0 and 0.001; ** means the p-value is between 0.001 and 0.01; * means the p-value is between 0.01 and 0.05. Direct, indirect, and total effects of different environmental factors on aboveground P. amarus components and biomass accumulation and allocation are shown in (b).
Forests 15 00043 g007
Table 1. Summary of P. amarus stands and climate information in all three regions over the past 10 years.
RegionLNGLATElevation (m)Slope (°)Density (Plant · ha−1)Age Ratio
(1 a:2 a:3 a)
MAP (mm)MAT (°C)MAXT
(°C)
MINT
(°C)
ASH (h)AFP (d)MAH (%)
QS116°10′ E30°44′ N323.372279,16613:146:1261596.0617.1337.45−5.781740.70343.374.9
LY119°11′ E28°51′ N215.533529,12518:206:3091823.8218.2839.05−4.921719.00261.577.6
SX117°43′ E26°20′ N192.422125,6663:57:941778.6520.5939.19−2.011652.46358.179.7
Note: LNG: longitude; LAT: latitude; MAP: mean annual precipitation (10-year); MAT: mean annual temperature (10-year); MAXT: maximum temperature (10-year); MINT: minimum temperature (10-year); ASH: annual sunshine hour (10-year); AFP: annual frost-free period (10-year); MAH: mean annual humidity (10-year).
Disclaimer/Publisher’s Note: The statements, opinions and data contained in all publications are solely those of the individual author(s) and contributor(s) and not of MDPI and/or the editor(s). MDPI and/or the editor(s) disclaim responsibility for any injury to people or property resulting from any ideas, methods, instructions or products referred to in the content.

