Article

Considering the Joint Impact of Carbon Density Change and Land Use Change Is Crucial to Improving Ecosystem Carbon Stock Assessment in North China

1
Precision Forestry Key Laboratory of Beijing, College of Forestry, Beijing Forestry University, Beijing 100083, China
2
State Key Laboratory of Resources and Environment Information System, Institute of Geographical Science and Natural Resources Research, Chinese Academy of Sciences, Beijing 100101, China
3
Geography, Faculty of Environment Science and Economy, University of Exeter, Exeter EX4 4RJ, UK
*
Author to whom correspondence should be addressed.
Forests 2024, 15(1), 55; https://doi.org/10.3390/f15010055
Submission received: 25 November 2023 / Revised: 16 December 2023 / Accepted: 25 December 2023 / Published: 28 December 2023
(This article belongs to the Topic Forest Carbon Sequestration and Climate Change Mitigation)

Abstract

:
Carbon density change and land use change are important factors in the spatiotemporal evolution of ecosystem carbon stock. Accurately assessing regional carbon stock and analyzing its relationship with land use patterns and carbon density change are of great value to regional ecosystem protection and sustainable social and economic development. In order to effectively evaluate the carbon stock in North China, this study divided the target area into 5 sub-regions, and a variety of methods were used to calculate the carbon density in each sub-region over different time periods. The classic InVEST model was selected to evaluate carbon stock evolution under changes in land use and carbon density from 2000 to 2015. The results show that the carbon stock in North China in 2000, 2005, 2010 and 2015 were 1.301 × 10¹⁰ t, 1.325 × 10¹⁰ t, 1.332 × 10¹⁰ t and 1.366 × 10¹⁰ t, respectively, with a cumulative increase of 6.506 × 10⁸ t. As two main factors, the land use type change and carbon density change showed different influences on the carbon stock of different regions and different ecosystems, but the former had a greater impact in North China during 2000–2015. Converting farmland to forest and grassland and converting bare land to grassland increased carbon stock, while converting farmland to building land reduced carbon stock. In addition, the carbon density of most land use types in each sub-region increased from 2000 to 2015, which further caused the increase in carbon stock. The carbon stock in North China had a significant spatial pattern of high in the east and low in the west, and this distribution pattern is closely related to land use. This research can provide scientific reference for land use management decision-making and sustainable carbon stock function in North China.

1. Introduction

The sustainability of ecosystems and their services are crucial factors in achieving sustainable human development [1]. Because of the influence of human activities and the effects of climate change, global ecosystem services are declining [2]. For example, air pollution (in the case of tropospheric ozone) is an important parameter that triggers the decline of carbon stock in forests and crops [3,4]. Carbon stock plays an important role in regulating global climate change, atmospheric CO2 concentration, and maintaining global carbon balance [5,6,7]. Terrestrial ecosystem carbon sinks are valuable indicators of ecosystem change because they reflect the complex interrelationship between terrestrial ecosystems and climate change [8]. As carbon density varies greatly over time among different land use types and even within the same type, land use change typically cause significant carbon exchange [9]. Moreover, emissions resulting from such land use change constitute a significant portion of global carbon emissions [10]. Therefore, it is crucial to accurately assess the impact of land use change on terrestrial ecosystem carbon stock [11,12], especially under China’s dual carbon goals of achieving “carbon peak” by 2030 and “carbon neutrality” by 2060. An in-depth analysis of the response relationship between carbon stock and land use change can more accurately reflect the production capacity of regional ecosystems and characterize the ecosystem’s carrying capacity for carbon emissions [13], thereby providing a useful reference for achieving the dual-carbon goals. The North China Region is one of the six geographic divisions of China and one of the main locations for the implementation of the environmental mitigation strategies: “Three-North Shelter Forest Program” and the “Beijing-Tianjin Wind Sand Source Control Project”. At present, few studies have been conducted on the assessment of spatio-temporal evolution characteristics of ecosystem carbon stock in this region.
At present, many methods have been proposed to evaluate ecosystems’ carbon stock. Traditional methods include the biomass method, stockpile method and biological inventory method, which are widely used tools for carbon stock estimation [14]. However, these methods have certain shortcomings in scale, spatio-temporal variability and visual representation of carbon stock. With the development of GIS technology and the generation of various models, carbon stock estimation based on model simulation has gradually become a popular research method. Among many ecosystem service models, the carbon sequestration module in the InVEST model developed by Stanford University, the Nature Conservancy and the World-Wide Fund for Natural Capital Project [15], realized the rapid calculation of regional carbon stock using land use type and carbon density datasets. In addition, this module can visualize the spatial distribution and dynamic change of carbon stock and quantify the value of ecological service function. Many scholars have applied the module to study regional carbon stock. For example, Zhu, et al. [16] implemented the module to analyze the spatial and temporal change of carbon stock in coastal areas of China, and concluded that the carbon stock gradually transitioned from a stepped-up phase (1980–2010) to a stable phase (2010–2020). This module has also been used by other scholars to explore the impact of urban expansion on carbon stock [17,18]. In addition, researchers have also applied the InVEST model to study carbon stock in mountain ranges [19] and watersheds areas [20].
One of the basic inputs for running the carbon stock module is carbon density data. At present, research assumptions usually keep carbon density stable over time, and changes in carbon density are considered to have little influence on the predicted carbon stock values [21,22], so the same carbon density data has been used to calculate carbon stock in different years [8,16]. In fact, ecosystem carbon density changes with time [23], and some researchers have shown that vegetation carbon density in ecosystems such as forests, grasslands, and croplands have changed over time [24,25,26]. The carbon density and carbon stock of different forest stands change with their stand structure (e.g., stand age) [27,28]. Zhu, et al. [29] showed that the net primary productivity (NPP) in areas with unchanged land use in Inner Mongolia had an increasing trend during 2000–2020, which indirectly indicates that grassland vegetation carbon density has changed during this period. In addition, for the same land use type, the carbon density also varied in different regions [16]. Therefore, one of the research focuses of this paper is to obtain vegetation carbon density data in different ecosystems for each region at each time period.
In this paper, multi-year dynamic carbon density datasets and land use/land cover (LULC) datasets are collected and applied in the InVEST model for carbon stock assessment in North China. The main objectives of our study are (1) to assess the spatial and temporal distribution of carbon stock over 15 years in North China; (2) to analyze change in carbon density and carbon stock in different land use types; and (3) to analyze the change in carbon stock under the dual influence of land use types and carbon density.

2. Dataset Source and Methodology
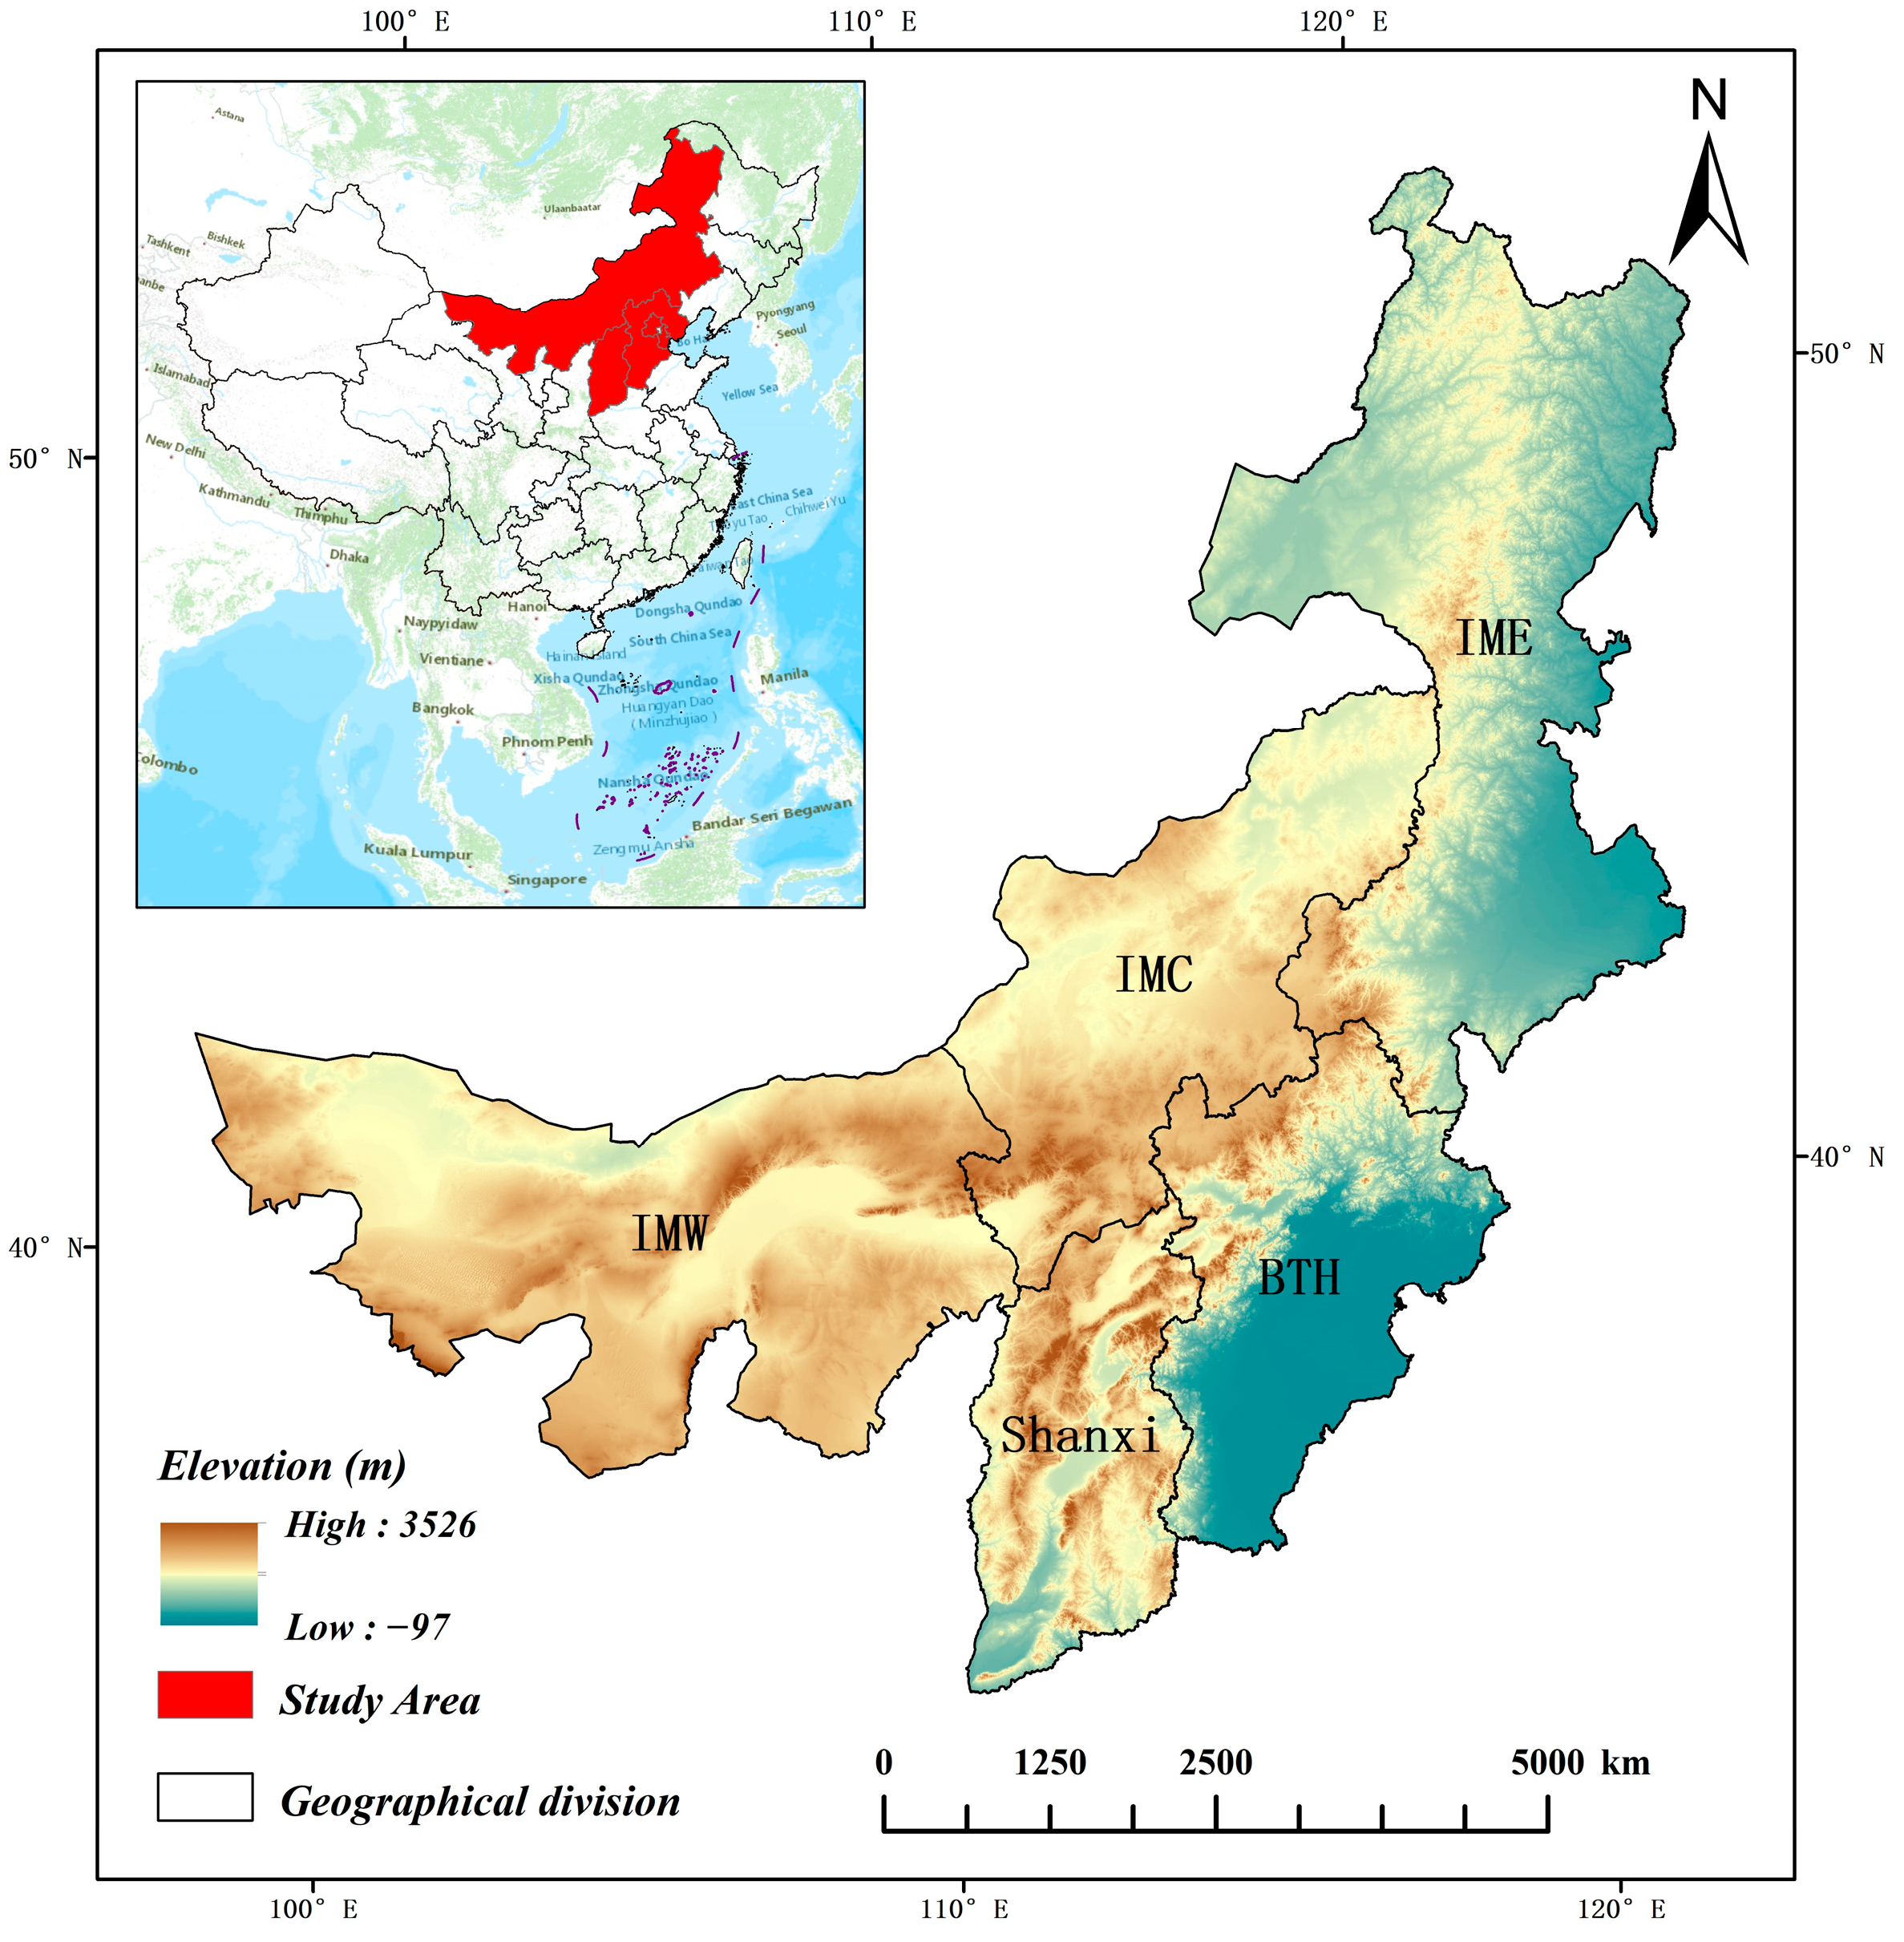
2.1. Study Area

The North China Region area covers approximately 1.56 × 10⁶ km2, ranging from 97°10′ E to 126°04′ E longitude and from 34°35′ N to 53°20′ N latitude (Figure 1), and it includes five administrative regions, namely Shanxi Province, Hebei Province, Beijing, Tianjin and Inner Mongolia Autonomous Region.
The terrain of North China is higher in the west and lower in the east, with an altitude ranging from −97 to 3526 m (Figure 1). The landform is mainly comprised of plateaus, mountains, hills and plains. The Mongolian Plateau is located in the northwestern part of the region with an average altitude of 1580 m; the North China Plain is located in the southeast with an average altitude less than 100 m; the southwestern part is the mountainous Shanxi Province; and the northeastern part is the Greater Khingan Mountains.
There are significant climatic differences within the study area. The annual average temperature in Inner Mongolia ranges from −4.5 °C to 9.8 °C, and the annual average rainfall is from 50 to 450 mm [30]. The average annual temperature of Shanxi Province ranges from 4.2 to 14.2 °C with an increasing trend from north to south, and the annual precipitation ranges from 358 to 621 mm with uneven seasonal distribution. The climate in the Beijing-Tianjin-Hebei (BTH) region is characterized by an annual average temperature of 11.5–12.5 °C and annual precipitation of 531–644 mm [31].
Since the significant differences in geographical conditions such as climate and topography in North China, it can cause errors in the calculation of carbon density. In order to facilitate subsequent carbon stock calculations, this paper divides the entire North China region into five study sub-regions, namely the BTH region, Shanxi, eastern Inner Mongolia (IME), central Inner Mongolia (IMC), and western Inner Mongolia (IMW).

2.2. Dataset and Processing

As carbon density is an important indicator of carbon stock capacity in different ecosystems, we present a list to clarify the relevant carbon density datasets used in this paper (Table 1). In addition, we also present relevant flow charts to show the whole carbon density calculation process including all direct and indirect methods (Figure 2). The detailed description about these methods is given as follows.

2.2.1. Administrative Division Boundary, DEM and LULC Dataset

The LULC dataset was obtained from the Google Earth Engine platform with a spatial resolution of 30 m [35]. In order to clearly capture the changing trends of carbon stock, we selected a 5-year time interval to extract the LULC dataset from 2000 to 2015.

2.2.2. The Input Data of the InVEST Model

In this paper, carbon stock was calculated via the InVEST model, and running this model required two types of input: LULC data for a given year in a region with a raster data type and carbon density data for the corresponding region year with a spreadsheet data type.

2.2.3. Carbon Density Datasets That Can Be Directly Derived from the National Ecosystem Science Data Center Carbon Density Maps

A dataset of carbon density in Chinese terrestrial ecosystem (2010s) (CTECD) of National Ecosystem Science Data Center (http://www.nesdc.org.cn/ (accessed on 12 October 2022) was used to provide important sampling datasets for the different ecosystems. This dataset was constructed via collecting and collating published historical literature data related to carbon density between 2000 and 2014 as well as from an experimental monitoring dataset [32]. This dataset included above-ground biomass carbon density (ACD), below-ground biomass carbon density (BCD), and soil organic carbon density (SCD) in wetland, cropland, grassland, shrub and forest ecosystems (Figure 3a). Based on this dataset, we can statistically derive ACD (Figure 3b) and BCD datasets (Figure 3c) for forest and shrub in 2005 and 2010; and ACD and BCD datasets for grassland in 2005 and 2010 for BTH and Shanxi. The principles of data statistics are as follows. The samples in each sub-region were selected to calculate the average annual carbon density values and then the values in adjacent years were averaged to obtain the final carbon density value for that year. Taking the forest ACD dataset in the BTH region as an example. Carbon density datasets for 2005 were calculated by averaging carbon density values from 2003 to 2008, and for 2010, they were obtained by averaging the values from 2009 to 2012. In some areas, the number of data points in some time periods is too small to provide reasonable carbon density data, in this case we use the indirect acquisition method described in the next section.
At present, few studies focus on change in SCD over time at the ecosystem scale, and some studies have concluded that soil organic carbon remains relatively stable over a long period of time [36]. Therefore, in this paper, soil carbon density is considered as a stable value [16,32]. Based on a large number of sample points of SCD in CTECD (Figure 3d), the soil carbon density values in different ecosystems were obtained by using regional statistical calculations, and a large amount of literature was searched to validate the values.
In this paper, the forest litter data from 2000–2015 were extracted from the forest litter carbon density dataset over China during 1982–2020, from the National Ecosystem Science Data Center (http://www.nesdc.org.cn/ (accessed on 12 October 2022)). This dataset integrated forest litter carbon density data observed at a large number of sites and long-term normalized difference vegetation index (NDVI) data to produce the spatio-temporal pattern of forest litter carbon density in China. We used ArcGIS 10.2 zoning to statistically measure the forest litter data for the corresponding years. To avoid anomalous values for a given year, we averaged the data from the study year and the two years before and after it, for a total of five years, as the values for that study year. For example, the data for 2000 is the average of the data for the five years from 1998 to 2002. Subsequently, for land use types other than forest, ACD was converted to dead organic carbon density (DCD) using a ratio of 0.1 [37].

2.2.4. Estimation Processes for Additional Carbon Density Data

The carbon density data obtained through the above existing carbon density dataset are not sufficient to cover the time range of the study, so we additionally obtained carbon density data through several indirect methods as described below.
(1)
Calculated by the Biomass Conversion Factor Method
ACD of grasslands in the three study sub-regions IME, IMC and IMW in 2000, 2005, 2010 and 2015 was obtained by the biomass conversion factor method using “a dataset of grassland aboveground biomass in the northern temperate region and the Tibetan Plateau of China based on field investigation and remote sensing inversion (1982–2015)” [33]. The dataset was collected from National Ecosystem Science Data Center (http://www.nesdc.org.cn/ (accessed on 12 October 2022)). The spatial resolution is 8 km. The specific formula for the biomass conversion factor method is as follows [38]:
C g , a b o v e = a g × W g ,
where C g , a b o v e refers to the ACD of grassland (kg/m2); a g is the carbon concentration of the grassland, and here we set it to 0.45 [24]; W g refers to the above-ground biomass of the grassland (kg/m2). The ratio of below-ground biomass to above-ground biomass can be used to calculate below-ground biomass, thereby calculating the BCD of grassland. The calculation formula is as follows:
C g , b e l o w = a g × b g × W g
where C g , b e l o w refers to the BCD of grassland (kg/m2). b g refers to the ratio of below-ground biomass to above-ground biomass. Considering the difference in b g ratios and spatial pattern of different grassland types in Inner Mongolia, this paper defines the ratio of grassland in IME as 5.08, in IMC as 5.40, in IMW as 7.40, in BTH region as 6.31, and in Shanxi as 6.23 [39].
(2)
Calculated from Published Biomass Models
To calculate above-ground carbon density data of forest ecosystems in 2000 and 2015, we referred to previous research based on continuous inventory datasets of national forest resources [25]. For the ACD of grassland in 2000 and 2015 in the BTH and Shanxi regions, we used the previously developed grassland above-ground biomass estimation model combined with NDVI data. The NDVI data was derived from Resource and Environment Science and Data Center of the Chinese Academy of Sciences (https://www.resdc.cn (accessed on 12 October 2022). This dataset was generated by the maximum values synthesis method based on SPOT/VEGETATION PROBA-V generating 1km products (http://www.vito-eodata.be (accessed on 12 October 2022). Fang et al. [24] concluded that the logarithm of above-ground biomass (per unit area) in each grassland type had a significant linear positive correlation with the logarithm of N D V I m a x ( R 2 = 0.71 , p < 0.001). The specific formula is as follows:
Y = 179.71 × N D V I m a x 1.6228 ,
where Y (g C/m2) is above-ground biomass (per unit area); N D V I m a x indicates the maximum NDVI value in one year. Then, the b g ratio was used to calculate the BCD values.
For the cropland above-ground biomass density from 2000–2015 in the five study sub-regions, Li [40] revealed that the annual average NDVI value is higher in areas with high biomass density, and the relationship between the two can be expressed as
y = 2251.7 N D V I a v e 2.4201 · ( R 2 = 0.6207 )
where y   (t/km2) denotes biomass density; N D V I a v e indicates the annual average NDVI. Based on the previous studies, the b g ratio of agricultural land was set at 0.19 [39].

2.3. Calculation of Carbon Stock

The InVEST model can realize quantitative spatial evaluation of ecosystem service value by simulating the changes of material quality and value of ecosystem service function under different land cover scenarios. The advantage of the InVEST model is the visual representation of the assessment results, rather than relying solely on textual representation [41]. The carbon sequestration module can well evaluate the carbon stock and its value in a defined area [8]. This module divides the carbon stock of an ecosystem into four basic carbon pools: above-ground biomass carbon ( C a b o v e ), below-ground biomass carbon ( C b e l o w ), soil organic carbon ( C s o i l ), and dead organic carbon ( C d e a d ) (Natural Capital Project, 2023).
LULC and carbon density datasets are the most important input data for the carbon stock calculation of this model. By integrating the LULC dataset with their corresponding carbon density data, the model estimates the spatial pattern of carbon stock in ecosystems [42]. The formula can be expressed as:
C i = C i , a b o v e + C i , b e l o w + C i , s o i l + C i , d e a d ,
C t o t a l = i = 1 n C i × S i
where i represents land use type and C i (t C/ha) represents the carbon density in land use type i ; C i , a b o v e is ACD of land use type i ; C i , b e l o w is BCD of land use type i ; C i , s o i l is the SCD of land use type i ; C i , d e a d is DCD of land use type i ; S i (m2) represents the area of land use type i ; C t o t a l represents the total carbon stock in terrestrial ecosystems.

2.4. Attribution Analysis of Ecosystem Carbon Stock Change

Carbon stock was determined by two factors, carbon density and land use type, which are intertwined and change over time, leading to complex changes in carbon stock. But they affect carbon stock to different degrees. Therefore, it is necessary to analyze the influence of the above two factors on carbon stock under different land use types in different regions. The process is described as follows [43]:
(1) Integration of carbon stock change under change in carbon density and in area:
C = i = 1 n ( S i 2 D i 2 S i 1 D i 1 )
where S i 1 and S i 2 are the area of ecosystem i in 2000 and 2015, respectively; D i 1 and D i 2 are the carbon density of ecosystem i in 2000 and 2015, respectively.
(2) Carbon stock change considering only changing area:
C 1 = i = 1 n ( S i 2 S i 1 ) D i 1
(3) Carbon stock change considering only changing carbon density:
C d = i = 1 n S i 1 ( D i 2 D i 1 )
(4) The contribution rate of LULC type change to carbon stock ( R l ) and the contribution rate of carbon density change to carbon stock ( R d ) can be measured by the following formulas:
R l = C 1 C 1 + C d × 100 %
R d = C d C 1 + C d × 100 %

3. Results

3.1. LULC Dynamics during 2000 to 2015

The North China Region has a vast territory with diverse land use types. Among them, the area of grassland, cropland, forest, barren and impervious land account for a relatively large proportion. Grasslands were mainly distributed in the Inner Mongolia Autonomous Region, northern BTH and Shanxi. Cropland was largely distributed in the south of BTH and IME, and was also the dominant land use in Shanxi. Forest land was mostly located in Greater Khingan Mountains, Taihang Mountains, Lvliang Mountains and Yanshan Mountains. Bare land was concentrated in the northwest (the Alxa League) and east of Inner Mongolia (the Horqin Sandy Land). Impervious land was primarily located in provincial capitals and various small and medium-sized cities (Figure 4).
Grassland was the dominant land use type in the North China region, accounting for 42%–43% of the total area, followed by cropland land (19%–20%), forest (17%–18%) and barren (18%). Impervious land forms 2%–3%, water 1%, and the other types account for less than 1% (Figure 5).
The grassland area increased from 637,543 km2 in 2000 to 647,873 km2 in 2010 and then decreased to 636,590 km2 in 2015. The cropland area mainly showed a decreasing trend, from 306,028 km2 in 2000 to 288,282 km2 in 2015. From 2000 to 2015, the forest area steadily increased from 255,176 km2 to 269,763 km2. From 2000 to 2015, bare land decreased from 275,012 km2 to 265,826 km2. From 2000 to 2015, impervious land, i.e., building land, has continued to expand and had the greatest increase from 31,919 km2 to 46,700 km2 (Figure 5).
We divided the period from 2000 to 2015 into three time periods to observe change in each land type, and found that the turnover of each land type within each time period was generally consistent except for some fluctuations in area (Figure 6). Since the area of wetland and snow/ice is extremely small, wetland is incorporated into water and snow/ice is incorporated into bare ground in the subsequent carbon stock calculations. Although the percentage of area in each type remains roughly the same, the impact of a small percentage area change is still large due to the large size of the entire North China region.
Cropland land use outflows and inflows were relatively large, with outflows greater than inflows during all time periods except for 2010–2015, which leads to a predominantly decreasing trend (Figure 6). The largest outflow from cropland was between 2000 and 2005, accounting for 41.8% of the total outflow, with a total reduction in cropland of 33,761 km2. Approximately 80% of lost cropland was converted to grassland, with the remainder converted to building land/impervious and forest. The majority of land converted to cropland were from grassland and secondly forest land use types.
During 2000–2015, the inflow of land to forest land use type was greater than the outflow (Figure 6). The majority of land converted into forest were from grassland and cropland, with grassland accounting for the largest proportion. The outflow from forest land was mainly to cropland. Inflows and outflows from bare ground were also relatively high, but were mainly flowing back and forth with grassland. Grassland outflows and inflows were significant, with outflows from 2010–2015 reaching 37,934 km2 accounting for 50.34% of total flow change. Excepting the conversion to forest land use, the amount of change in grassland was mainly the interconversion between cropland and bare land. Inflows of impervious/building land far exceeded outflows between 2000 and 2015, resulting in a continuous increase of building land, mainly due to the inflow of cropland to this land use type.

3.2. Carbon Density in the North China Area (2000–2015)

3.2.1. Carbon Density Values

We calculated the carbon density values of each sub-region in 5-year time intervals from 2000 to 2015 to analyze the trends in carbon density change. For example, in BTH region, the carbon density of each pool generally increased with time (Table 2). The ACD of cropland increased from 0.362 kg C/m2 in 2000 to 0.437 t C/ha in 2015, an increase of 21%. The carbon density pools in forest, grassland, and shrub also increased over the study period. The trend of carbon density changes in Shanxi, IME, IMC and IMW are similar to those in BTH, and the specific datasets are shown in Tables S1–S4 in Supplementary Materials.
For each land use type, the soil organic carbon pool contributed the most to total carbon density. Taking the forest ecosystem in 2005 as an example, the ACD was 3.299 kg C/m2, the BCD was 1.188 kg C/m2, the SCD was 9.590 kg C/m2, and the DCD was 0.222 kg C/m2, of which the SCD accounted for 67% of the total carbon density, more than three times the ACD.

3.2.2. Verification of Carbon Density

Since few measurements of actual carbon density were carried out within the various study subregions in North China, we utilized literature datasets for validation, using relative difference (RD) to verify the accuracy of the carbon density data [44]. This indicator can be expressed as:
R D = R s R a R a × 100 %
where R s is the carbon density data derived in this paper, R a is the measured carbon density data from previous literature. Since not all of the carbon density data were calculated based on the sample point dataset such as CTECD, and some of the carbon density data were calculated by published biomass models and methods such as the biomass conversion factor method, we collected the corresponding literature to verify the accuracy of the calculations (Table 3). The absolute value of RD of carbon density calculated by the biomass factor transformation method compared to literature values was 1.41% minimum and 10.12% maximum, and the absolute value of RD of carbon density calculated by the biomass model compared to literature values was 2.37% minimum and 10.00% maximum. Therefore, it can be concluded that the vegetation carbon density values derived from this paper can represent the actual carbon density in North China. The SCD values in the five sub-regions calculated based on the sample data set of CTECD were also verified. The validation exhibited relatively accurate results, as shown in Table S6 in Supplementary Materials.
In addition, as an important indicator of vegetation growth, the NDVI is closely related to vegetation coverage and biomass. Therefore, change in the NDVI of grassland and cropland in this region from 2000 to 2015 were also statistically analyzed to indirectly verify the vegetation carbon density changes in this region. The calculated results showed that both grassland NDVI and cropland NDVI had an increasing trend from 2000 to 2015 (Figure 7), and it can be inferred that the carbon density of grassland and cropland also had an increasing trend during this period.

3.3. Spatial-Temporal Change Analysis of Carbon Stock in North China from 2000 to 2015

The overall quantity of carbon stock in North China in 2000, 2005, 2010 and 2015 were 1.301 × 10¹⁰ t, 1.325 × 10¹⁰ t, 1.332 × 10¹⁰ t and 1.366 × 10¹⁰ t, respectively, showing a steady increasing trend with an overall increase of 6.506 × 10⁸ t (Figure 8a). The contribution values of different land use types to the total carbon stock in North China were, in descending order: grassland, forest, cropland, bare land, building land, water and shrub. Grassland had the largest carbon stock by 2015, accounting for 38% of the study area (5.123 × 10⁹ t), followed by forest (37%, 5.029 × 10⁹ t) and cropland (17%, 2.318 × 10⁹ t). The carbon stock of forest and building land also showed a steady increase, while the carbon stocks of cropland, shrubland, water and bare land generally decreased from 2000 to 2015. The change in carbon stock for each of the above land use types were caused by changes in both area and carbon density.
The carbon stock of each sub-region in North China also differed. IME had the largest stock and Shanxi the least (average of the four time points): IME (3.181 × 10⁹ t), IMC (2.420 × 10⁹ t), BTH (2.098 × 10⁹ t), IMW (1.642 × 10⁹ t), and Shanxi (1.321 × 10⁹ t). The proportion of carbon stock varied among these sub-regions (Figure 8b). The majority of the carbon stock in the IME, BTH and Shanxi were from cropland, forest and grassland. Whereas grassland was the major contributor to carbon stock in IMC, accounting for about 90% of the total IMC carbon stock. Impervious construction land in BTH was the largest among the sub-regions for both area and carbon stock. Grassland and bare land were the largest contributors to overall carbon stock in the IMW region, where there are more deserts and the bare land area is the largest among these sub-regions.
From 2000 to 2015, there was no significant change in the distribution pattern of carbon stock in North China, which was generally high in the east and low in the west (Figure 9). Carbon stock was greatest in the forests of IME, Shanxi, and the BTH region. The Greater Khingan Mountains of eastern IME had the highest carbon stock, grassland in central Inner Mongolia was at an intermediate level and the desert areas of IMW had low carbon stock.
The change in carbon stock under the dual influence of land use and carbon density between 2000 and 2015 are shown in Table S5 in Supplementary Materials. During the period from 2000 to 2015, 90% of the cropland was retained, but due to change in the density of cropland carbon over this period, the carbon stock also changed significantly: the carbon stock increased by 3.617 × 10⁷ t, the transfer of the cropland to woodland and grassland also increased the carbon stock by 3.812 × 10⁷ and 2.678 × 10⁷, respectively, and the transfer of cropland to scrubland, bare land and building land decreased the carbon stock by 2.034 × 10⁴ t, 2.051 × 10⁵ t and 3.272 × 10⁷ t, respectively. Due to the high density of carbon in forests, the conversion of forests to other types generally caused a reduction in carbon stock, and forest conversion resulted in a total reduction of 1.430 × 10⁷ t of carbon stock between 2000 and 2005, 1.512 × 10⁷ t between 2005 and 2010, and 4.125 × 10⁷ t between 2010 and 2015.
The conversion of grassland to other land uses increased carbon stock by 2.511 × 10⁷ t, 8.106 × 10⁶ t, and 2.821 × 10⁶ t during 2000–2005, 2005–2010 and 2010–2015, respectively, of these, the increase in carbon stock was predominantly due to the conversion of grassland to forest. The conversion of shrubland to cropland, forest and grassland resulted in an overall positive carbon stock change, with a total increase of 1.499 × 10⁷ t from 2000 to 2015, averaging an increase of 4.997 × 10⁶ t per five-year period. The conversion of shrubland to forest contributed significantly to this increase in carbon stock, accounting for 77% of the total change. Although some of the shrubland was converted to lower carbon density bare and construction land, it did not impact on the overall trend, due to the relatively small percentage of the transferred area.
The temporal carbon density data of water, bare land and building land were difficult to obtain. However, as the area occupied by these three land types was small (in total approximately 2% of the total area), we made the assumption the values were constant. Therefore, change in carbon stock in these three land use types was attributable only to the one factor of land use type change. As the carbon stock in bare land and building land were generally smaller than those in other land use types, the conversion of this land increased carbon stock.

3.4. Comparative Analysis of Carbon Density and Land Use Change on Carbon Stock

Both carbon density and land use type have important effects on carbon stock in this paper. The magnitude of the impact of both varied in different regions and in different ecosystems (Figure 10). The carbon density influenced 55% of the forest carbon stock change in BTH, 60% of the grassland carbon stock change in Shanxi, and 77% of the forest carbon stock change in IME. These phenomena may be due to the small change in the area of the land use type and the large change in carbon density from 2000 to 2015, resulting in a final presentation that the carbon stock was more affected by carbon density. However, the change in land use type also strongly affected carbon stock, for example, the influence of land use change in cropland, grassland and shrub in BTH is 90%, 76% and 71%, respectively; the influence in the change of cropland, forest and shrub in Shanxi is 70%, 56% and 89%, respectively; the influence in the change of cropland and grassland in IME is 53% and 90%, respectively. The carbon stock change in IMC and IMW were also more affected by the influence of land use type. In general, these phenomena indicate that the influence of land use type on carbon stock is greater than that of carbon density in North China during 2000–2015.

4. Discussion

4.1. Temporal and Spatial Evolution Characteristics of Carbon Density

The carbon density in most land use types in each sub-region showed a general increasing trend, reflecting an improvement in the ecosystem service function of carbon stock to a certain extent. From 2000 to 2015, forest carbon density in North China mainly showed an increasing trend, which is consistent with Liang et al. [25]’ findings. Similarly, carbon density of grassland mainly showed an increasing trend, in agreement with the findings of Zhang, et al. [50]. According to the grain production data of each province and city in North China in the statistical data module of China-national-knowledge-internet (https://data.cnki.net/ (accessed on 12 October 2022)), the grain production of the whole North China region had increased from 4.91 × 10⁷ t in 2000 to 8.46 × 10⁷ t in 2015, showing an increasing trend rate of 71.6% despite the cultivated area in North China having shown a decreasing trend (Figure 5). Based on these phenomena, it can be inferred that the grain yield per unit area had been increasing during this period, which indirectly indicated that the carbon density of cropland vegetation also had an increasing trend in North China. From the perspective of remote sensing data, the vegetation index in this region also showed an increasing trend (Figure 7), reflecting that the vegetation growth in this region was gradually increasing, which is consistent with the change in carbon density in this region. These phenomena may be due to the impact of global climate change and the ecological forest restoration projects implemented in the region, increasing the number of young forests planted, resulting in a subsequent increase in biomass carbon stock [51].

4.2. Assessment of Ecosystem Carbon Stock Based on Implementation Projects

From 2000 to 2015, China has implemented a series of national key ecological restoration projects, such as reforestation project, grass restoration project, etc. in this area. Many researchers have shown that implementation of these projects has significantly increased China’s ecosystem carbon sink, contributing to China’s CO2 emission reduction, and that ecosystem carbon density has also increased during this period [21,52,53]. The overall trend of carbon stock in BTH shows a gradual increase, with building land and forest carbon stock playing an important role, of which the increase in forest carbon stock may be related to the implementation of “Three-North Shelter Forest Program” and “The Beijing-Tianjin Wind Sand Source Control Project”. The overall carbon stock in Shanxi showed an increasing trend under the combined influence of the two factors of carbon density and land use type, which is consistent with the results of Hu, et al. [54] and Xie, et al. [55]. Forest expansion under the policy to return farmland to forest increased the carbon stock in Shanxi Province [56]. The carbon stock in IME and IMW also showed an increasing trend, both in terms of carbon density and in land use types with greater carbon stock e.g., forest land, which may be related to the implementation of “Three-North Shelter Forest Program” and “Natural Forest Protection Project” in these areas. The carbon stock in IMC showed an increasing but fluctuating trend. The increase in carbon stock in IMC is strongly associated with the implementation of ecological projects such as “The Beijing-Tianjin Wind and Sand Source Control Project”.

4.3. Accurate Assessment of Ecosystem Carbon Stock Needs to Consider Change in Both Carbon Density and Land Use Type

In our study, the LULC and carbon density together influenced the change in carbon stock, with different proportions for different regions and ecosystems, but in general land use type had a greater influence. However, it is worth noting that the impact of carbon density cannot be ignored. It had an important impact on various ecosystems in various sub-regions, especially the forest ecosystems in IME and BTH sub-regions and the grassland ecosystems in Shaanxi sub-region. In these areas, carbon density had a dominant impact on ecosystem carbon stock, and these areas have been the focus for the implementation of ecological projects. If the studies only considered change in land use type and assumed that carbon density did not change over time, large errors may occur in carbon stock calculations [57]. For example, in the BTH sub-region, when only the influence of land use type was considered for assessing carbon stock, the results tended to be a slow downward trend [18], instead of the increasing trend observed in this study. This phenomenon was mainly caused by the reduction of cultivated land area, which is consistent with our results in Figure 8. However, if the combined effect of carbon density and land use type change are considered, the ecosystem carbon stock in this region had the opposite trend. Therefore, to achieve more accurate results in research estimating ecosystem carbon stock, consideration of the joint impacts of both carbon density and land use change are required, especially when assessing long-term ecosystem carbon stock in large-scale regions. The results detailed here can also provide a reference for ecosystem carbon assessment in areas similar to this study.

4.4. Limitations and Future Perspectives

The difficulties in data acquisition can result in some uncertainty when using the InVEST model to calculate carbon stock. We utilized relevant carbon density data and multiple ways to calculate carbon density, including statistical calculation of the data of 2010s, regression model with higher accuracy studied by previous scholars, etc., to establish a carbon pool with four time intervals (2000, 2005, 2010, 2015) in the study sub-regions (BTH, Shanxi, IME, IMC, IMW), land use types (cropland, forest land, shrub, grassland, water bodies, bare land, and building land), and carbon density types (aboveground biomass carbon, belowground biomass carbon, soil organic carbon, and dead organic carbon), which contributes greatly to the improvement of carbon stock estimation accuracy. However, the carbon density in some land use types had limited data availability, such as water bodies, bare land and building land. Also, soil organic carbon density is not constant, especially when crop yields and their biomass increase, soil organic carbon may decrease. Until further data collection, these carbon density values were assumed to be stable. Therefore, the calculated carbon stock values will inevitably contain some errors. In this paper, we pay more attention to the magnitude and direction trend of carbon stock change.
In future research, the following three aspects need to be strengthened: firstly, in terms of carbon density research, it is necessary to strengthen the monitoring of carbon density for each land use type, to provide a data basis for accurate estimation of carbon stock; Secondly, to improve the spatial resolution of land use classification, classifying into more detailed sub-categories, enabling more detailed calculations of carbon stock; Thirdly, combining multi-disciplinary research to explore the environmental, biochemical and human activities that affect carbon stock change, and establish carbon cycle models under different land use types, enabling a scientific basis for improving ecosystem services evaluation.

5. Conclusions

Accurate and robust assessments of ecosystem carbon stock are central to developing and monitoring climate change mitigation strategies. In this study, the dynamic carbon density datasets of each sub-region were collected in North China from 2000 to 2015, combined with land use type data, and applied the InVEST model to improve ecosystem carbon stock assessment. The main conclusions obtained are as follows:
From 2000 to 2015, the vegetation carbon density of most land use types for each sub-region had an increasing trend.
From 2000 to 2015, the area of cultivated land, shrub and bare land decreased, the area of forest and construction land increased, and the area of grassland and water bodies fluctuated. The transfers were mainly in the form of converting part of cultivated land to grassland, building land and forest land, and converting bare land to grassland.
The joint impact of carbon density change and land use change were important for the carbon stock assessment, although carbon stock change caused by changing land use was greater than that from carbon density change in North China during 2000–2015.
The carbon stock in North China continued to increase from 2000 to 2015, and the values in 2000, 2005, 2010 and 2015 were 1.301 × 10¹⁰ t, 1.325 × 10¹⁰ t, 1.332 × 10¹⁰ t and 1.366 × 10¹⁰ t, respectively.

Supplementary Materials

The following supporting information can be downloaded at: https://www.mdpi.com/article/10.3390/f15010055/s1, Table S1. Carbon density in Shanxi province from 2000 to 2015. Table S2. Carbon density in IME region from 2000 to 2015. Table S3. Carbon density in IMC region from 2000 to 2015. Table S4. Carbon density in IME region from 2000 to 2015. Table S5. Change in carbon stock from 2000 to 2015. Table S6. The comparison between the SCD data in this paper and the SCD data in the previous literature.

Author Contributions

Methodology, J.Q. and Z.W.; Validation, J.Q.; Investigation, Z.W. and B.L.; Writing—original draft, J.Q.; Writing—review & editing, Z.W. and E.L.C.; Visualization, J.Q.; Supervision, J.W.; Project administration, Z.W.; Funding acquisition, Z.W. All authors have read and agreed to the published version of the manuscript.

Funding

Grants the paper has been funded by the National Natural Science Foundation of China (Grant No. 42201518), Young Elite Scientists Sponsorship Program by BAST (No. BYESS2023005), the Fundamental Research Funds for the Central Universities (BLX202107 and BLX202105) and supported by a grant from State Key Laboratory of Resources and Environmental Information System.

Data Availability Statement

The data used is primarily reflected in the article. Other relevant data is available from the corresponding author upon request.

Conflicts of Interest

The authors declare that they have no known competing financial interest or personal relationship that could have appeared to influence the work reported in this paper.

Abbreviations

LULC: land use/land cover; BTH, Beijing-Tianjin-Hebei; IME, eastern Inner Mongolia; IMC, central Inner Mongolia; IMW, western Inner Mongolia; CTECD, A dataset of carbon density in Chinese terrestrial ecosystem (2010s); ACD, above-ground biomass carbon density; BCD, below-ground biomass carbon density; SCD, soil organic carbon density; DCD, dead organic carbon density; NDVI, normalized difference vegetation index; RD, relative difference.

References

  1. Wackernagel, M.; Onisto, L.; Bello, P.; Linares, A.C.; Falfán, I.S.L.; Garca, J.M.; Guerrero, A.I.S.; Guerrero, M.G.S. National natural capital accounting with the ecological footprint concept. Ecol. Econ. 1999, 29, 375–390. [Google Scholar] [CrossRef]
  2. Costanza, R.; de Groot, R.; Sutton, P.; van der Ploeg, S.; Anderson, S.J.; Kubiszewski, I.; Farber, S.; Turner, R.K. Changes in the global value of ecosystem services. Glob. Environ. Chang. Hum. Policy Dimens. 2014, 26, 152–158. [Google Scholar] [CrossRef]
  3. Agyei, T.; Juráň, S.; Edwards-Jonášová, M.; Fischer, M.; Švik, M.; Komínková, K.; Ofori-Amanfo, K.K.; Marek, M.V.; Grace, J.; Urban, O. The Influence of Ozone on Net Ecosystem Production of a Ryegrass—Clover Mixture under Field Conditions. Atmosphere 2021, 12, 1629. [Google Scholar] [CrossRef]
  4. Juráň, S.; Grace, J.; Urban, O. Temporal Changes in Ozone Concentrations and Their Impact on Vegetation. Atmosphere 2021, 12, 82. [Google Scholar] [CrossRef]
  5. Piao, S.; Fang, J.; Ciais, P.; Peylin, P.; Huang, Y.; Sitch, S.; Wang, T. The carbon balance of terrestrial ecosystems in China. Nature 2009, 458, 1009–1013. [Google Scholar] [CrossRef]
  6. Schimel, D.S.; House, J.I.; Hibbard, K.A.; Bousquet, P.; Ciais, P.; Peylin, P.; Braswell, B.H.; Apps, M.J.; Baker, D.; Bondeau, A.; et al. Recent patterns and mechanisms of carbon exchange by terrestrial ecosystems. Nature 2001, 414, 169–172. [Google Scholar] [CrossRef]
  7. Coffield, S.R.; Hemes, K.S.; Koven, C.D.; Goulden, M.L.; Randerson, J.T. Climate-Driven Limits to Future Carbon Storage in California’s Wildland Ecosystems. AGU Adv. 2021, 2, e2021AV000384. [Google Scholar] [CrossRef]
  8. He, C.; Zhang, D.; Huang, Q.; Zhao, Y. Assessing the potential impacts of urban expansion on regional carbon storage by linking the LUSD-urban and InVEST models. Environ. Model. Softw. 2016, 75, 44–58. [Google Scholar] [CrossRef]
  9. Vizcaino-Bravo, Q.; Williams-Linera, G.; Asbjornsen, H. Biodiversity and carbon storage are correlated along a land use intensity gradient in a tropical montane forest watershed, Mexico. Basic Appl. Ecol. 2020, 44, 24–34. [Google Scholar] [CrossRef]
  10. DeFries, R.S.; Field, C.B.; Fung, I.; Collatz, G.J.; Bounoua, L. Combining satellite data and biogeochemical models to estimate global effects of human-induced land cover change on carbon emissions and primary productivity. Glob. Biogeochem. Cycles 1999, 13, 803–815. [Google Scholar] [CrossRef]
  11. Li, J.; Guo, X.; Chuai, X.; Xie, F.; Yang, F.; Gao, R.; Ji, X. Reexamine China’s terrestrial ecosystem carbon balance under land use-type and climate change. Land Use Policy 2021, 102, 105275. [Google Scholar] [CrossRef]
  12. Zhu, G.; Qiu, D.; Zhang, Z.; Sang, L.; Liu, Y.; Wang, L.; Zhao, K.; Ma, H.; Xu, Y.; Wan, Q. Land-use changes lead to a decrease in carbon storage in arid region, China. Ecol. Indic. 2021, 127, 107770. [Google Scholar] [CrossRef]
  13. Shuqi, L.; Xiaomeng, H.; Yuan, S.; Cai, Y.; Xin, Z. Multi-scenario land use change and its impact on carbon storage based on coupled Plus-Invest model. Chin. J. Eco-Agric. 2023, 31, 300. [Google Scholar] [CrossRef]
  14. Houghton, R.A. Counting Terrestrial Sources and Sinks of Carbon. Clim. Chang. 2001, 48, 525–534. [Google Scholar] [CrossRef]
  15. Natural Capital Project, 2023. InVEST 3.14.1. Publisher: Stanford University, University of Minnesota, Chinese Academy of Sciences, The Nature Conservancy, World Wildlife Fund, and Stockholm Resilience Centre and the Royal Swedish Academy of Sciences. Available online: https://naturalcapitalproject.stanford.edu/software/invest (accessed on 24 November 2023).
  16. Zhu, L.Y.; Song, R.X.; Sun, S.; Li, Y.; Hu, K. Land use/land cover change and its impact on ecosystem carbon storage in coastal areas of China from 1980 to 2050. Ecol. Indic. 2022, 142, 14. [Google Scholar] [CrossRef]
  17. Li, C.; Zhao, J.; Thinh, N.X.; Xi, Y.T. Assessment of the Effects of Urban Expansion on Terrestrial Carbon Storage: A Case Study in Xuzhou City, China. Sustainability 2018, 10, 647. [Google Scholar] [CrossRef]
  18. Wang, C.; Zhan, J.; Chu, X.; Liu, W.; Zhang, F. Variation in ecosystem services with rapid urbanization: A study of carbon sequestration in the Beijing-Tianjin-Hebei region, China. Phys. Chem. Earth 2019, 110, 195–202. [Google Scholar] [CrossRef]
  19. Wang, C.W.; Luo, J.J.; Qing, F.; Tang, Y.; Wang, Y.F. Analysis of the Driving Force of Spatial and Temporal Differentiation of Carbon Storage in Taihang Mountains Based on InVEST Model. Appl. Sci. 2022, 12, 662. [Google Scholar] [CrossRef]
  20. Alaoui, H.I.; Chemchaoui, A.; El Asri, B.; Ghazi, S.; Brhadda, N.; Ziri, R. Modeling predictive changes of carbon storage using invest model in the Beht watershed (Morocco). Model. Earth Syst. Environ. 2023, 9, 4313–4322. [Google Scholar] [CrossRef]
  21. Li, K.M.; Cao, J.J.; Adamowski, J.F.; Biswas, A.; Zhou, J.J.; Liu, Y.J.; Zhang, Y.K.; Liu, C.F.; Dong, X.G.; Qin, Y.L. Assessing the effects of ecological engineering on spatiotemporal dynamics of carbon storage from 2000 to 2016 in the Loess Plateau area using the InVEST model: A case study in Huining County, China. Environ. Dev. 2021, 39, 15. [Google Scholar] [CrossRef]
  22. Zhu, E.Y.; Deng, J.S.; Zhou, M.M.; Gan, M.Y.; Jiang, R.W.; Wang, K.; Shahtahmassebi, A. Carbon emissions induced by land-use and land-cover change from 1970 to 2010 in Zhejiang, China. Sci. Total Environ. 2019, 646, 930–939. [Google Scholar] [CrossRef] [PubMed]
  23. Zhou, J.; Zhao, Y.; Huang, P.; Zhao, X.; Feng, W.; Li, Q.; Xue, D.; Dou, J.; Shi, W.; Wei, W.; et al. Impacts of ecological restoration projects on the ecosystem carbon storage of inland river basin in arid area, China. Ecol. Indic. 2020, 118, 106803. [Google Scholar] [CrossRef]
  24. Fang, J.Y.; Guo, Z.D.; Piao, S.L.; Chen, A.P. Terrestrial vegetation carbon sinks in China, 1981–2000. Sci. China Ser. D Earth Sci. 2007, 50, 1341–1350. [Google Scholar] [CrossRef]
  25. Liang, B.; Wang, J.; Zhang, Z.; Zhang, J.; Zhang, J.; Cressey, E.L.; Wang, Z. Planted forest is catching up with natural forest in China in terms of carbon density and carbon storage. Fundam. Res. 2022, 2, 688–696. [Google Scholar] [CrossRef]
  26. Qiu, Z.X.; Feng, Z.K.; Song, Y.N.; Li, M.L.; Zhang, P.P. Carbon sequestration potential of forest vegetation in China from 2003 to 2050: Predicting forest vegetation growth based on climate and the environment. J. Clean. Prod. 2020, 252, 14. [Google Scholar] [CrossRef]
  27. Ahmad, B.; Wang, Y.H.; Hao, J.; Liu, Y.H.; Bohnett, E.; Zhang, K.B. Variation of carbon density components with overstory structure of larch plantations in northwest China and its implication for optimal forest management. For. Ecol. Manag. 2021, 496, 11. [Google Scholar] [CrossRef]
  28. Cheng, X.Q.; Han, H.R.; Kang, F.F.; Song, Y.L.; Liu, K. Variation in biomass and carbon storage by stand age in pine (Pinus tabulaeformis) planted ecosystem in Mt. Taiyue, Shanxi, China. J. Plant Interact. 2014, 9, 521–528. [Google Scholar] [CrossRef]
  29. Zhu, L.Y.; Shi, M.M.; Fan, D.Q.; Tu, K.; Sun, W.B. Analysis of Changes in Vegetation Carbon Storage and Net Primary Productivity as Influenced by Land-Cover Change in Inner Mongolia, China. Sustainability 2023, 15, 4735. [Google Scholar] [CrossRef]
  30. Quan, Q.; Liang, W.J.; Yan, D.H.; Lei, J.C. Influences of joint action of natural and social factors on atmospheric process of hydrological cycle in Inner Mongolia, China. Urban Clim. 2022, 41, 16. [Google Scholar] [CrossRef]
  31. Yang, Y.Y.; Bao, W.K.; Li, Y.H.; Wang, Y.S.; Chen, Z.F. Land Use Transition and Its Eco-Environmental Effects in the Beijing-Tianjin-Hebei Urban Agglomeration: A Production-Living-Ecological Perspective. Land 2020, 9, 285. [Google Scholar] [CrossRef]
  32. Xu, L.; He, N.; Yu, G. A dataset of carbon density in Chinese terrestrial ecosystems (2010s) [DS/OL]. V1. China Sci. Data 2018, 4, 90–96. [Google Scholar] [CrossRef]
  33. Jiao, C.C.; Yu, G.R.; Chen, Z.; He, Y.P. A dataset of grassland aboveground biomass in the northern temperate region and the Tibetan Plateau of China based on field investigation and remote sensing inversion (1982–2015). China Sci. Data 2019, 4, 35–49. [Google Scholar] [CrossRef]
  34. Wang, Z. NDVI-driven model of random forest to simulate forest litter carbon density over China during 1982–2020. Remote Sens. Technol. Appl. 2022, 37, 513–520. [Google Scholar]
  35. Yang, J.; Huang, X. The 30 m annual land cover dataset and its dynamics in China from 1990 to 2019. Earth Syst. Sci. Data 2021, 13, 3907–3925. [Google Scholar] [CrossRef]
  36. Dai, E.F.; Zhai, R.X.; Ge, Q.S.; Wu, X.Q. Detecting the storage and change on topsoil organic carbon in grasslands of Inner Mongolia from 1980s to 2010s. J. Geogr. Sci. 2014, 24, 1035–1046. [Google Scholar] [CrossRef]
  37. Delaney, M.; Brown, S.; Lugo, A.E.; Quintero, T.L.B. The Quantity and Turnover of Dead Wood in Permanent Forest Plots in Six Life Zones of Venezuela. Biotropica 1998, 30, 2–11. [Google Scholar] [CrossRef]
  38. Guo, Z.; Fang, J.; Pan, Y.; Birdsey, R. Inventory-based estimates of forest biomass carbon stocks in China: A comparison of three methods. For. Ecol. Manag. 2010, 259, 1225–1231. [Google Scholar] [CrossRef]
  39. Tang, X.L.; Zhao, X.; Bai, Y.F.; Tang, Z.Y.; Wang, W.T.; Zhao, Y.C.; Wan, H.W.; Xie, Z.Q.; Shi, X.Z.; Wu, B.F.; et al. Carbon pools in China’s terrestrial ecosystems: New estimates based on an intensive field survey. Proc. Natl. Acad. Sci. USA 2018, 115, 4021–4026. [Google Scholar] [CrossRef]
  40. Li, Y. Changes in Vegetation Cover and National Agricultural Biomass in the Yangtze River Basin in the Last 20 Years Based on NDVI; Peking University: Beijing, China, 2004. [Google Scholar]
  41. Wu, H.B.; Guo, Z.T.; Peng, C.H. Land use induced changes of organic carbon storage in soils of China. Glob. Chang. Biol. 2003, 9, 305–315. [Google Scholar] [CrossRef]
  42. Li, Y.H.; Yao, S.; Jiang, H.Z.; Wang, H.R.; Ran, Q.C.; Gao, X.Y.; Ding, X.Y.; Ge, D.D. Spatial-Temporal Evolution and Prediction of Carbon Storage: An Integrated Framework Based on the MOP-PLUS-InVEST Model and an Applied Case Study in Hangzhou, East China. Land 2022, 11, 2213. [Google Scholar] [CrossRef]
  43. Zhao, Z.H.; Liu, G.H.; Mou, N.X.; Xie, Y.C.; Xu, Z.R.; Li, Y. Assessment of Carbon Storage and Its Influencing Factors in Qinghai-Tibet Plateau. Sustainability 2018, 10, 1864. [Google Scholar] [CrossRef]
  44. Shen, Q.; Chen, Q.; Tang, B.-s.; Yeung, S.; Hu, Y.; Cheung, G. A system dynamics model for the sustainable land use planning and development. Habitat Int. 2009, 33, 15–25. [Google Scholar] [CrossRef]
  45. Cui, X.Y.; Wang, Y.F.; Niu, H.S.; Wu, J.; Wang, S.P.; Schnug, E.; Rogasik, J.; Fleckenstein, J.; Tang, Y.H. Effect of long-term grazing on soil organic carbon content in semiarid steppes in Inner Mongolia. Ecol. Res. 2005, 20, 519–527. [Google Scholar] [CrossRef]
  46. Yang, Y.; Niu, D.; Wen, H.; Zhang, B.; Dong, Q.; Chen, J.; Fu, H. Responses of soil particulate organic carbon and nitrogen along an altitudinal gradient on the Helan Mountain, Inner Mongolia. Acta Prataculturae Sin. 2012, 21, 54–60. [Google Scholar]
  47. Qu, H.; Zhao, X.; Wang, S.; Huang, W.; Mao, W. Effects of different vegetation communities on soil carbon and nitrogen contents in Urad desert steppe. Pratacultural Sci. 2014, 31, 355–360. [Google Scholar]
  48. Yang, Y.H.; Fang, J.Y.; Ma, W.H.; Smith, P.; Mohammat, A.; Wang, S.P.; Wang, W. Soil carbon stock and its changes in northern China’s grasslands from 1980s to 2000s. Glob. Chang. Biol. 2010, 16, 3036–3047. [Google Scholar] [CrossRef]
  49. Chen, J. The Biomass and Carbon Storage Distribution Pattern of Natural Grassland Ecosystem in Shanxi Province. Ph.D. Thesis, Shanxi Agricultural University, Taiyuan, China, 2016. [Google Scholar]
  50. Zhang, L.; Zhou, G.; Ji, Y.; Bai, Y. Spatiotemporal dynamic simulation of grassland carbon storage in China. Sci. China-Earth Sci. 2016, 59, 1946–1958. [Google Scholar] [CrossRef]
  51. Yang, H.; Ciais, P.; Frappart, F.; Li, X.; Brandt, M.; Fensholt, R.; Fan, L.; Saatchi, S.; Besnard, S.; Deng, Z.; et al. Global increase in biomass carbon stock dominated by growth of northern young forests over past decade. Nat. Geosci. 2023, 16, 886–892. [Google Scholar] [CrossRef]
  52. Lu, F.; Hu, H.F.; Sun, W.J.; Zhu, J.J.; Liu, G.B.; Zhou, W.M.; Zhang, Q.F.; Shi, P.L.; Liu, X.P.; Wu, X.; et al. Effects of national ecological restoration projects on carbon sequestration in China from 2001 to 2010. Proc. Natl. Acad. Sci. USA 2018, 115, 4039–4044. [Google Scholar] [CrossRef]
  53. Zhao, M.; He, Z.; Du, J.; Chen, L.; Lin, P.; Fang, S. Assessing the effects of ecological engineering on carbon storage by linking the CA-Markov and InVEST models. Ecol. Indic. 2019, 98, 29–38. [Google Scholar] [CrossRef]
  54. Hu, B.A.; Kang, F.F.; Han, H.R.; Cheng, X.Q.; Li, Z.Z. Exploring drivers of ecosystem services variation from a geospatial perspective: Insights from China’s Shanxi Province. Ecol. Indic. 2021, 131, 12. [Google Scholar] [CrossRef]
  55. Xie, L.J.; Bai, Z.K.; Yang, B.Y.; Fu, S. Simulation Analysis of Land-Use Pattern Evolution and Valuation of Terrestrial Ecosystem Carbon Storage of Changzhi City, China. Land 2022, 11, 1270. [Google Scholar] [CrossRef]
  56. Hu, B.A.; Zhang, Z.J.; Han, H.R.; Li, Z.Z.; Cheng, X.Q.; Kang, F.F.; Wu, H.F. The Grain for Green Program Intensifies Trade-Offs between Ecosystem Services in Midwestern Shanxi, China. Remote Sens. 2021, 13, 3966. [Google Scholar] [CrossRef]
  57. Li, Y.X.; Liu, Z.S.; Li, S.J.; Li, X. Multi-Scenario Simulation Analysis of Land Use and Carbon Storage Changes in Changchun City Based on FLUS and InVEST Model. Land 2022, 11, 647. [Google Scholar] [CrossRef]
Figure 1. The study area of the North China Region and five sub-regions, which are Beijing-Tianjin-Hebei (BTH) region, Shanxi, eastern Inner Mongolia (IME), central Inner Mongolia (IMC), and western Inner Mongolia (IMW).
Forests 15 00055 g001
Figure 2. Carbon density calculation flowchart (light green boxes indicate data sources; dark green boxes indicate methods; purple boxes indicate results).
Forests 15 00055 g002
Figure 3. Distribution of data points for CTECD. (a) Collected samples; (b) Above-ground biomass samples; (c) Below-ground biomass samples; (d) Soil organic carbon samples.
Forests 15 00055 g003
Figure 4. Spatial distribution of land use in different periods.
Forests 15 00055 g004
Figure 5. Changes of LULC structure during 2000–2015.
Forests 15 00055 g005
Figure 6. Chord diagrams of LULC change representing the land transfer (×104 km2) among the different land use types during 2000–2015.
Forests 15 00055 g006
Figure 7. Change in NDVI in grassland (a) and cropland (b) from 2000 to 2015.
Forests 15 00055 g007
Figure 8. Carbon stock in North China and in the five sub-regions from 2000–2015. (a) Changes in carbon stocks in North China; (b) Changes in carbon stocks in each sub-region.
Forests 15 00055 g008
Figure 9. Spatial distribution of carbon stock in different periods.
Forests 15 00055 g009
Figure 10. Percentage impact of change in carbon density and land use type on carbon stock.
Forests 15 00055 g010
Table 1. Carbon density dataset source.
DatasetYearFormat and ResolutionData Source
Carbon density2000–2014Spreadsheet[32]
NDVI2000–2015Raster, 1 kmResource and Environment Science and Data Center of the Chinese Academy of Sciences (https://www.resdc.cn (accessed on 12 October 2022))
Above-ground biomass data1982–2015Raster, 8 km[33]
Forest litter carbon density data2000–2020Raster, 0.05°[34]
Forest aboveground carbon density2000, 2015Raster, 1 km[25]
Table 2. Carbon density in the BTH region from 2000 to 2015.
Carbon DensityLand Use Type2000200520102015
(kg C/m2)
Above-ground biomassCropland0.3620.4260.440 0.437
Forest3.0243.2993.3154.209
Shrub0.2030.2030.3430.462
Grassland0.0840.0880.09010.101
Water0.5060.5060.5060.506
Barren0.910.910.910.91
Impervious0.7610.7610.7610.761
Below-ground biomassCropland0.0690.0810.0840.083
Forest1.0891.1881.1931.515
Shrub0.0870.0870.250 0.370
Grassland0.5330.5960.6260.638
Water1.2761.2761.2761.276
Barren1.420 1.420 1.420 1.420
Impervious0.4510.4510.4510.451
Soil organic carbonCropland7.9577.9577.9577.957
Forest9.590 9.590 9.590 9.590
Shrub5.980 5.980 5.980 5.980
Grassland7.2977.2977.2977.297
Water8.7348.7348.7348.734
Barren2.2632.2632.2632.263
Impervious4.2174.2174.2174.217
Dead organic carbonCropland0.0360.0420.0440.044
Forest0.1730.2220.1890.220
Shrub0.020 0.020 0.0340.046
Grassland0.0080.0090.0090.010
Water0.0510.0510.0510.051
Barren0.0910.0910.0910.091
Impervious0.0760.0760.0760.076
Table 3. The comparison between the vegetation carbon density data in this paper and in the previous literature.
Carbon Density TypesCarbon Density kg C/m2Method for Obtaining Carbon DensityRelative Difference (RD)References
In This PaperMean Carbon Density in Other Research
ACD of grassland in IMC (2000)0.0420.041Calculated by the biomass conversion factor method (Section 2.2.4. (1))2.44%[45]
ACD of grassland in IMW (2005)0.0230.021Section 2.2.4. (1)9.52%[46]
ACD of grassland in IMW (2010)0.0260.027Section 2.2.4. (1)−3.70%[47]
BCD of grassland in IME (2000–2005)0.350 0.342Section 2.2.4. (1)2.34%[48]
BCD of grassland in IMC (2000–2005)0.2310.257Section 2.2.4. (1)−10.12%
ACD of grassland in Shanxi (2015)0.090 0.100 Calculated from published biomass models (Section 2.2.4. (2))−10.00%[49]
BCD of grassland in Shanxi (2015)0.5620.549Section 2.2.4. (2)2.37%
ACD of cropland in BTH (2000)0.3620.338Section 2.2.4. (2)7.10%[18]
BCD of cropland in BTH (2000)0.0680.07Section 2.2.4. (2)−2.86%
ACD of cropland in Shanxi (2000)0.2250.219Section 2.2.4. (2)2.74%[19]
BCD of cropland in Shanxi (2000)0.0430.042Section 2.2.4. (2)2.38%
Disclaimer/Publisher’s Note: The statements, opinions and data contained in all publications are solely those of the individual author(s) and contributor(s) and not of MDPI and/or the editor(s). MDPI and/or the editor(s) disclaim responsibility for any injury to people or property resulting from any ideas, methods, instructions or products referred to in the content.

