Article

Leaf Area Estimation of Yellow Oleander Thevetia peruviana (Pers.) K. Schum Using a Non-Destructive Allometric Model

by
Luis Alfonso Rodriguez-Paez
*,
Alfredo Jarma-Orozco
,
Juan de Dios Jaraba-Navas
,
Yirlis Yadeth Pineda-Rodriguez
and
Marcelo F. Pompelli
*
Facultad de Ciencias Agrícolas, Universidad de Córdoba, Montería 230002, Colombia
*
Authors to whom correspondence should be addressed.
Forests 2024, 15(1), 57; https://doi.org/10.3390/f15010057
Submission received: 23 November 2023 / Revised: 22 December 2023 / Accepted: 24 December 2023 / Published: 28 December 2023
(This article belongs to the Section Forest Inventory, Modeling and Remote Sensing)

Abstract

:
The resurgence of interest in medicinal plants and their potential in pharmaceuticals has driven research into harnessing bioactive compounds for innovative treatments. This study proposes an accurate and non-destructive method to estimate leaf area (LA) for Thevetia peruviana through linear measurements of the leaf length (L), the leaf width (W), or the product of the leaf length and width (LW). The study encompasses comprehensive analyses of leaf dimensions collected during different seasons (rainy and dry season), employing linear and non-linear regression models to predict LA. Among the diverse models tested, non-linear equations emerged as superior predictors of LA, surpassing simpler linear models. However, in the rigorous selection process, the equations were linear with the intercept and power model, meeting the requirements for accurate and unbiased LA estimation. Despite the competence of these models, distinguishing between them based on evaluation criteria proved inconclusive. Following the principle of simplicity, equations linear with the intercept [LA = 0.284 + 0.766 × (LW)] are preferred as power models [LA = 0.914 × (LW)0.939] and are recommended as an optimal and practical choice for estimating T. peruviana LA in field experiments. The investigation emphasizes the importance of a robust approach to LA estimation, offering crucial insights into the allometric relationships and facilitating informed agricultural decisions. This comprehensive study advances our understanding of T. peruviana and contributes to the broader discourse on accurate and efficient leaf area estimation techniques in plant biology and agriculture.

Graphical Abstract

1. Introduction

The healthcare sector is currently witnessing a resurgence of interest in the therapeutic potential of medicinal plants and their role in natural pharmaceuticals. These plants, revered for their healing properties since ancient times, are now under investigation by the pharmaceutical industry for the development of innovative treatments. By harnessing the bioactive compounds present in these botanicals, researchers aim to create a new generation of pharmaceuticals that seamlessly merges traditional wisdom with modern scientific advancements. This synergy between medicinal plants and pharmaceuticals has the potential to offer safer and more holistic approaches to healthcare, providing patients with a range of treatment options rooted in nature’s medicines. However, it is crucial to exercise caution when dealing with poisonous plants due to their potential for harmful effects.
Thevetia peruviana (Pers.) K. Schum., commonly known as yellow oleander, is a compact shrub or small tree reaching a height of 1.5 to 2.3 m. It is a plant native to the Americas and is wildly dispersed from Mexico to Brazil. In the West Indies, T. peruviana has been naturalized, as well in tropical regions worldwide [1,2,3,4]. The tree is a bushy plant with a woody texture and decorative foliage and flowers. The stem is branched, has gray bark and milky sap, and is very toxic. The leaves have a linear to lanceolate shape, are leathery, shiny, glabrous, and alternate, with short petioles and a well-marked midrib which is lighter in color than the surrounding tissue. The flowers are very beautiful, tubular, fragrant, and orange or yellow in color. The fruits are of the drupe type, are very attractive, sub globose in shape, similar to a chestnut, and have two to four large and poisonous seeds. There are also varieties with white or pink flowers [5]. T. peruviana has been cultivated as an ornamental bush across tropical and subtropical regions globally [5,6,7]. The yellow-flowered variety of this large evergreen shrub is more commonly found than the orange and white-flowered variety [8,9].
Commonly, T. peruviana is indicated in treating various health conditions, including external wounds, ringworms, and tumors. Its ground leaves possess therapeutic properties, including cardiovascular benefits, anticancer properties [2], antimicrobial and antioxidant effects, and anti-inflammatory properties. Furthermore, different parts of the plant have been used to treat various human ailments, such as diabetes, liver toxicity, fungal infections, microbial infections, inflammation, pyrexia, and pain [6,10]. Notably, the leaves of T. peruviana have demonstrated antiviral activity against the human immunodeficiency virus HIV-1. High concentrations of thevetin, theviridoside, theveside, cerberin, peruvoside, perusitin, and digitoxigenin have been described in seeds of T. peruviana. Cardiac glycosides are used as pharmaceutical agents to treat heart failure. Given that the therapeutic index of these compounds closely approaches the lethal dose, clinical monitoring is imperative [10]. Seed ingestion is also discussed in suicide forums [4,5]. The fatal dose for an adult is estimated to range between 8 to 10 seeds [11]; however, research by Eddleston et al. [12] has shown that the degree of toxicity does not necessarily correlate with the number of T. peruviana seeds ingested, as even the consumption of a single seed can be fatal. Reports of T. peruviana poisonings have been widespread, occurring in Europe, the United States of America, Australia, Southern Africa, India, Sri Lanka, East Asia, and the Solomon Islands (reviewed in Bandara et al. [9]).
Leaf area (LA) stands one of the six most important feature in plant physiology, with a high level of agronomical interest [13]. Its significance extends to diverse factors such as growth patterns, overall productivity, the effectiveness of photosynthesis, soil attributes encompassing salinity and acidity, and the intricate interplay of heat, carbon, nutrients, and water, all of which are intricately linked in influencing the final yield of plants [14,15,16,17,18]. Thus, accurate LA assessment assumes great importance within crop species because leaves serve as the primary interface between plants and their environmental surroundings.
Efforts to directly measure LA face formidable obstacles characterized by labor-intensiveness, substantial costs, and time consumption, which are further compounded by logistical constraints. In response to these challenges, a modeling approach emerges as a pivotal solution, offering a means to comprehensively grasp continuous LA and growth dynamics. Allometry plays a crucial role in unraveling intricate relationships between characteristic dimensions such as leaf size and leaf area. Through the lens of allometric models, the estimation of leaf area takes on a non-destructive nature. These models not only provide an efficient means of measurement but also introduce the advantage of tracking the growth of a leaf over time, potentially leading to a reduction in data variability. The significance of an allometric approach is that it sheds light on the dimensions of plant growth and development [16,17,19,20,21,22].
The use of simple linear measurements to predict LA eliminates the need for costly LA meters [16,17,18,23,24]. Modeling the linear relationships between LA and other leaf dimensions rapidly, reliably, inexpensively, accurately, and nondestructively measures LA [16,17,18,24].
The use of linear measurements to estimate leaf area avoids the necessity of expensive leaf area machines. Creating models that establish linear correlations between LA and leaf dimensions offers a non-laborious, dependable, cost-effective, precise, and non-invasive means to measure leaf area.
The main objective of this study is to describe a reliable and accurate leaf area estimation of Thevetia peruviana. Our hypotheses are as follows: (i) it is possible to determine a single leaf area equation for both rainy and dry season leaves; (ii) the use of only one leaf dimension is able to provide a reliable and accurate leaf area equation.

2. Materials and Methods

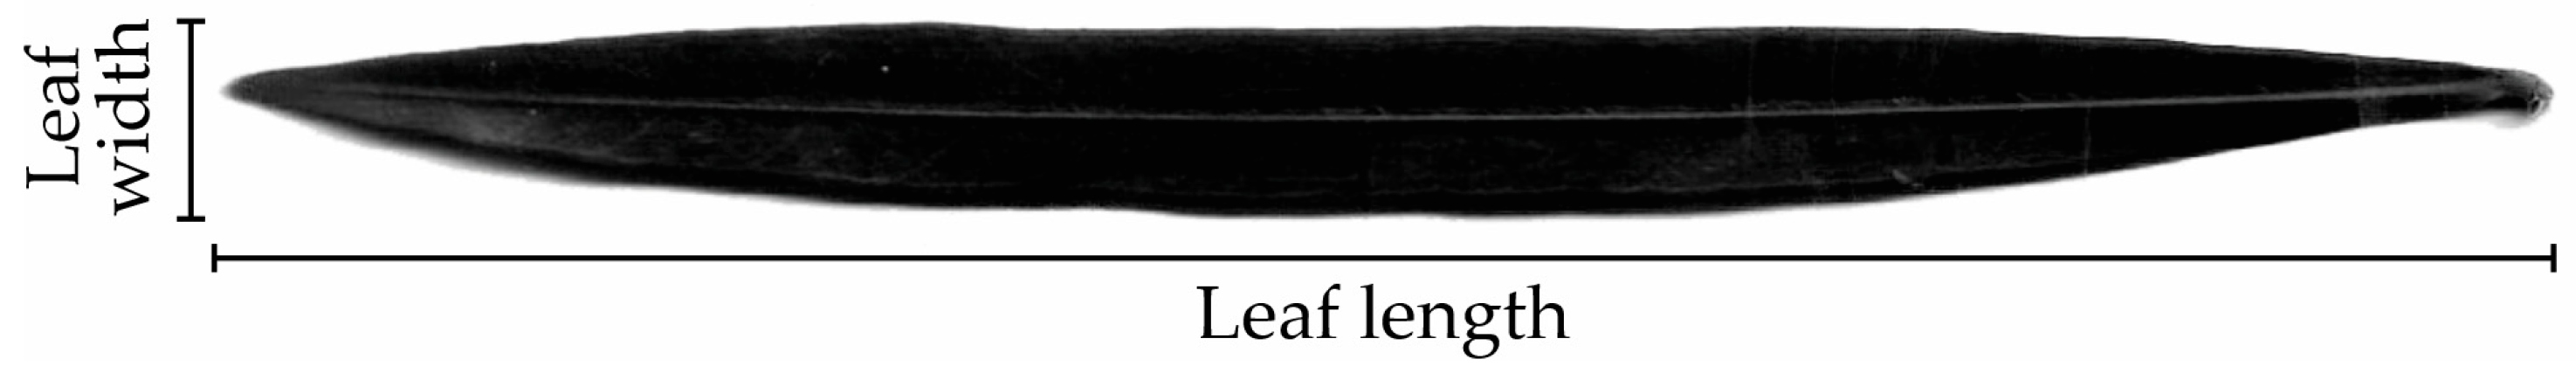
2.1. Allometry of Leaf Area

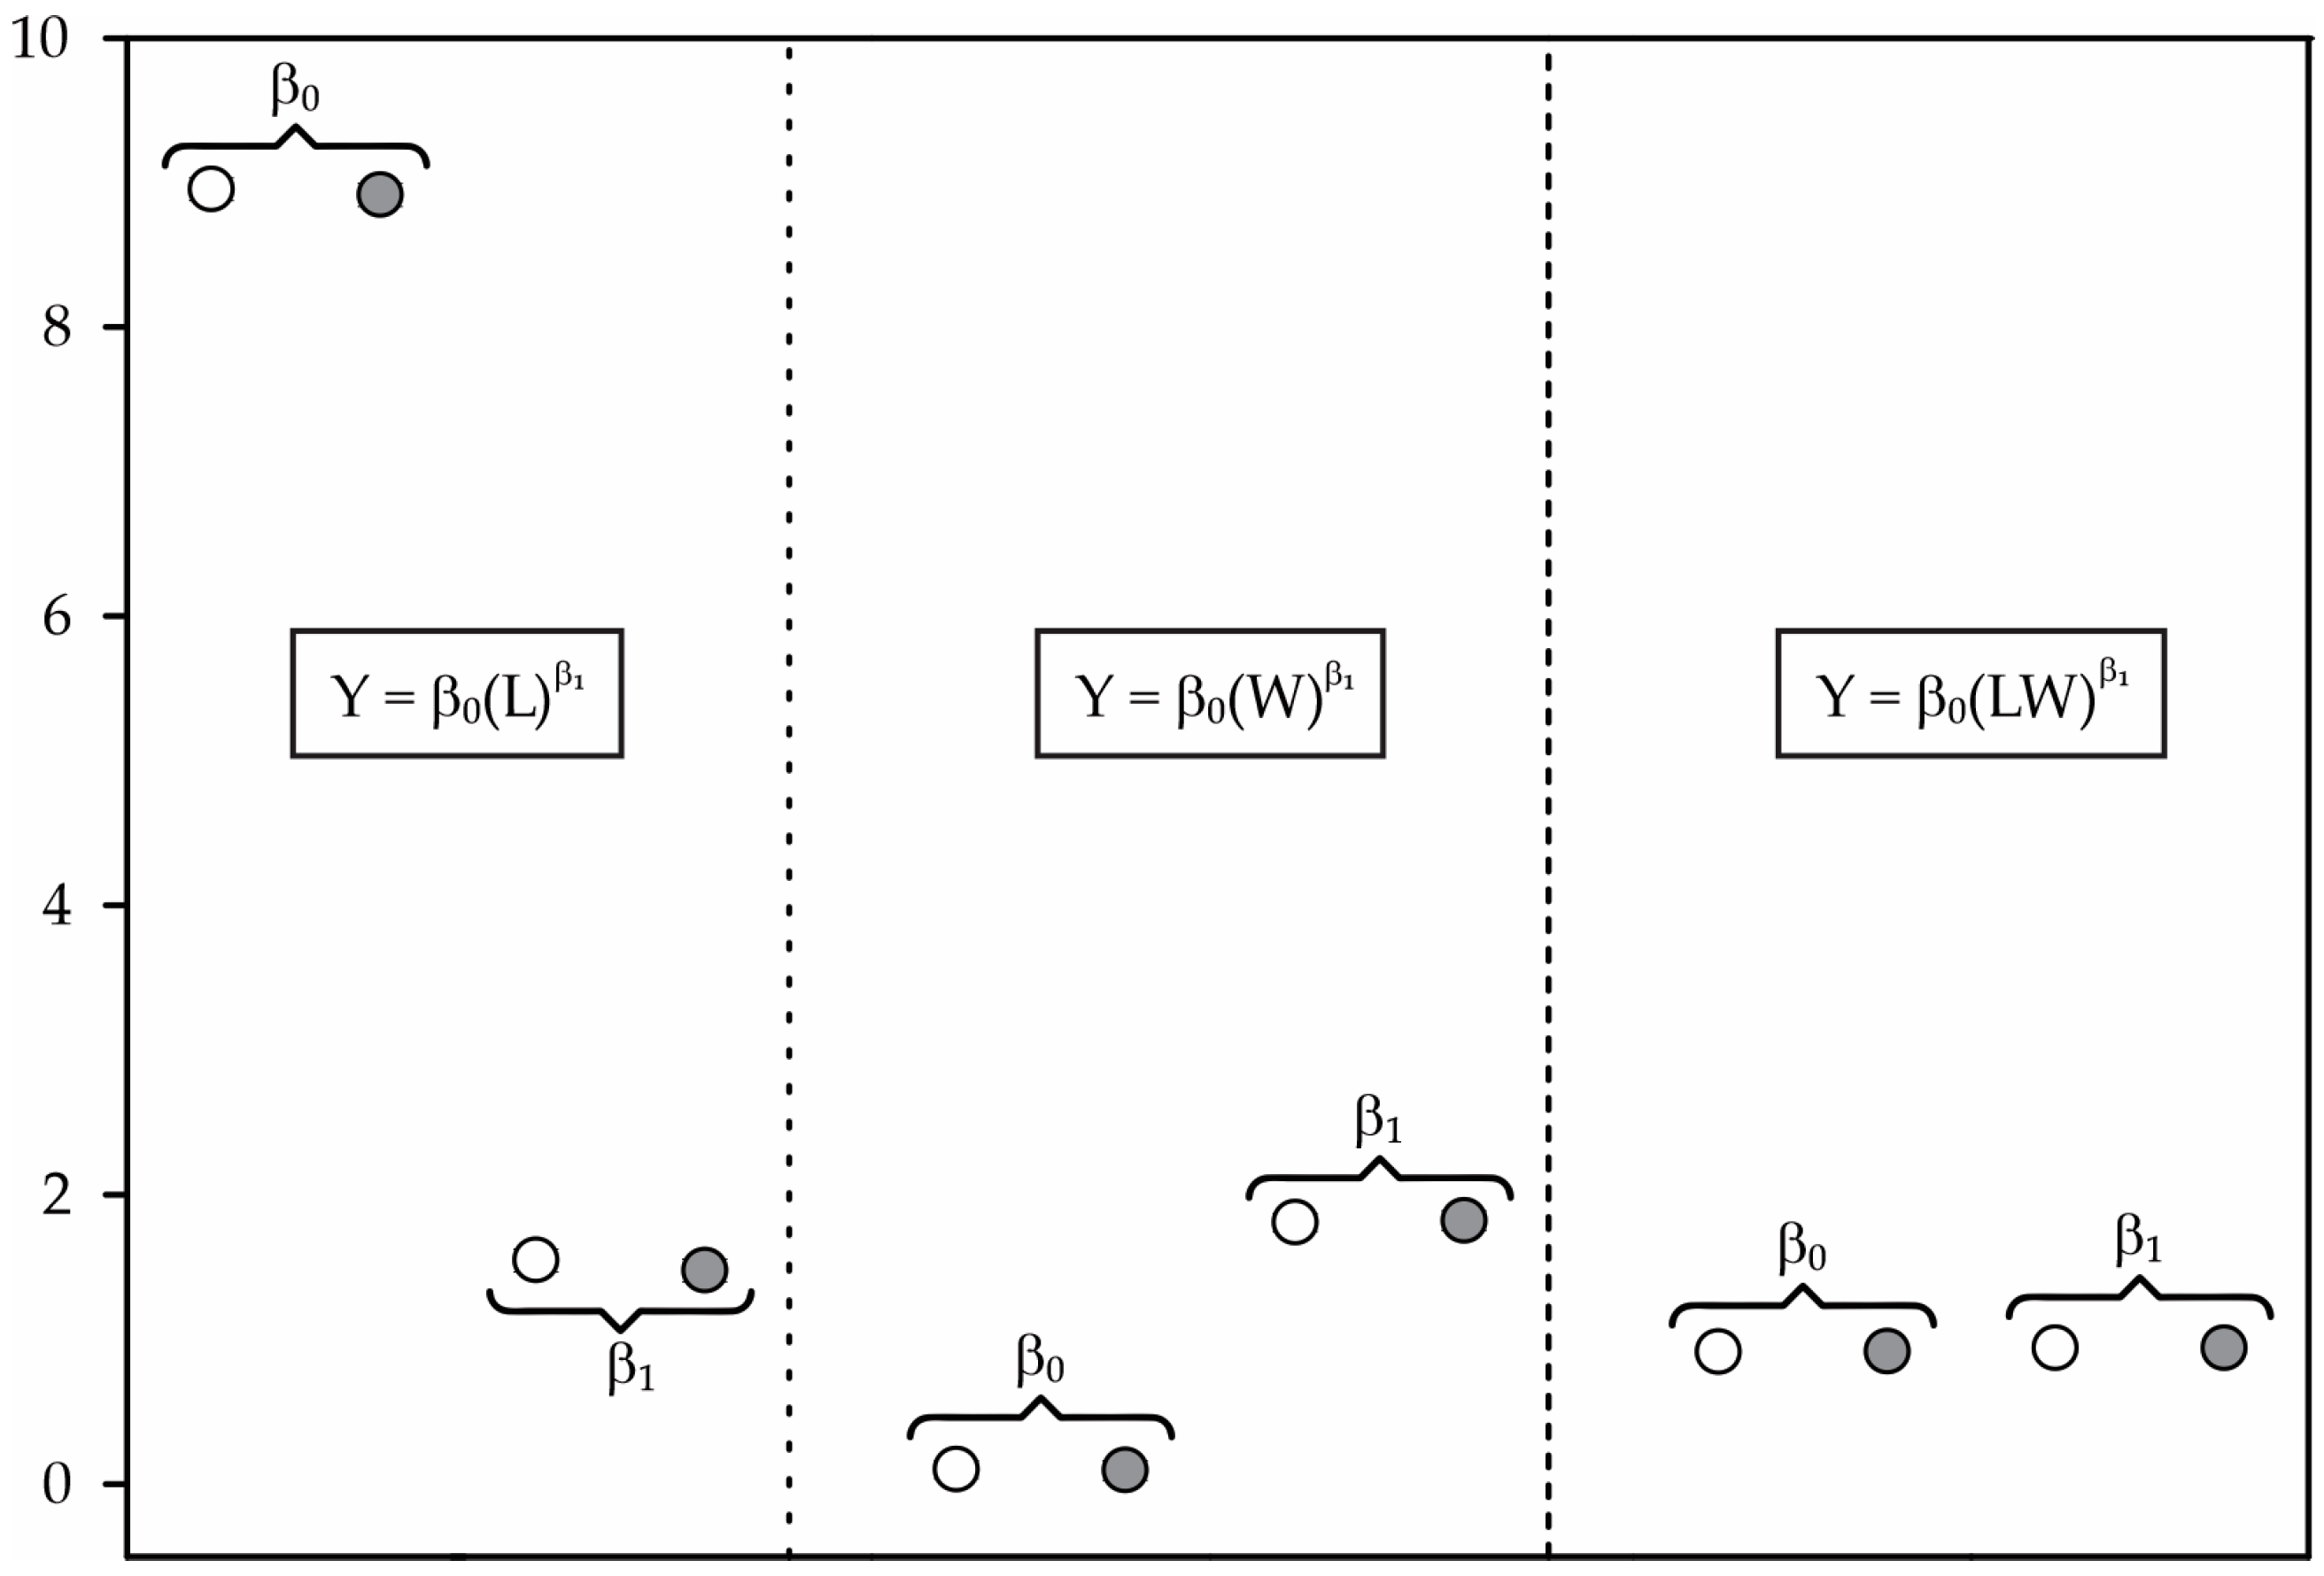
2.1.1. Model Construction

For equation construction, 800 leaves without symptoms of pests or diseases were collected from at least 25 healthy plants naturally grown at San Martin-Bongi square, Recife, Pernambuco, Brazil (8°03′42″–8°03′45″ S; 34°55′50″–34°55′48″ W; 7 m.a.s.l.) in both June and December 2022, referred to here as the rainy and dry season, respectively. Leaves from different parts of the tree canopy were sampled and taken to the laboratory. The leaves were digitalized using a scanner (HP Smart Suite, 1200 × 1200 dpi; Hewlett-Packard Company, Palo Alto, CA, USA) and the images were processed using Image-Pro® Plus software (version 4.5, Media Cybernetics, Silver Spring, MD, USA). The maximum leaf length (L) and leaf width (W) were measured to the nearest 0.001 cm, as pictured in Figure 1. The leaves encompassed the broadest range possible, as shown in Table 1.

2.1.2. Test for Model Identity

In order to evaluate the efficacy of a particular model in estimating leaf area across varying seasons—both rainy and dry—a statistical null hypothesis was set up: H0: β1 = β2 = βn, where β1, β2, and βn are regression coefficients [25]. There was an absence of differences among the coefficients between the sums of squares of the complete model. The rejection of H0 provides evidence of the acceptance of the alternative hypothesis, namely, that there are significant differences among the models for both rainy and dry leaves. For this, several linear regression models between L and W dimensions and LA were run for each season’s sample (rainy, n = 800 and dry, n = 800; Table 2). The equivalence of a range of linear regression models across different season leaves was investigated by employing Graybill’s test for model identity in accordance with Graybill [25].
In this study, we postulate an H0 and an H1 hypothesis. The null hypothesis (H1) assumes that there is no significant difference in the relationship between leaf dimensions and leaf area between seasons, while the alternative hypothesis (H0) suggests that such a difference does exist. The test for model identity assumes H1, as there is a significant difference in the relationship between the linear dimensions of the leaves and the estimation of the leaf area between the samples collected in the rainy and dry seasons from T. peruviana leaves. This could be expressed as βseason ≠ 0, indicating that there is an appreciable difference in the relationship between leaf dimensions and leaf area between the two seasons. On the other hand, H0 demonstrates that there is no significant difference in the relationship between the linear dimensions (length and width and the product of length and width) of the leaves and the estimate of leaf area between the leaf samples collected in the rainy season and dry season. Mathematically, this would be expressed as βseason = 0, where βseason represents the difference in the relationship between leaf dimensions and leaf area between the two seasons.

2.1.3. Model Validation

In order to validate the suggested model, a new dataset was created comprising 200 leaves collected from different levels of the tree canopy. All leaves were harvested and transported to the laboratory for further analysis using the Image-Pro® (version 4.5, Media Cybernetics, Silver Spring, MD, USA) following established procedures.

2.1.4. Equation Generation

Nine distinct theoretical models (as widely referenced in the literature [16,17,20,26,27,28,29,30,31,32,33]) were subjected to rigorous testing, where they were based on various permutations of the constituent elements within the leaf area (LA) (as a dependent variable) alongside corresponding values of both L and W (as independent variables). The equations were derived following the guiding principle of parsimony established by Steel and Penny [34]. The intent was to use the “simplest” or perhaps the “most optimal” depiction of the underlying data. Each of these equations underwent calibration under the paradigms of linear simplicity, modified linearity (achieved by excluding β0), and power models. Comprehensive details about these models can be found in Table 3. The estimation of every model’s parameters was performed by utilizing DataFit version 8.0.32 (Oakdale Engineering, Oakdale, PA, USA). Model selection hinged on a range of statistical criteria, primarily: (i) the analysis of variance (utilizing the F test with a significance level of p < 0.001); (ii) an adjusted coefficient of determination (R2a); (iii) the mean squared error (MSres); (iv) the Student’s t-test (significance at p < 0.001) for the absolute mean of errors coupled with confidence intervals [35]; (v) the examination of the dispersion pattern of residuals in terms of percentage (%), pinpointing the most robust relationship (highest R2a value) between the measured leaf area and the estimated leaf area as validated against an independent dataset; (vi) the reliability of the equation in estimating the leaf area of a distinct sample in an unbiased and stable manner with a high coefficient of determination. This scrutiny of residuals encompassed the entire dataset, encompassing both diminutive and expansive leaves. In the context of model validation, deviations from normality within the errors were evaluated, wherein heteroscedasticity was deemed grounds for disqualifying a model. These systematic procedures collectively enabled the thorough evaluation of the biases and accuracies inherent in all proposed models [33].

2.1.5. Root Mean Square Error (RMSE) and Akaike (AIC) Criteria

In the case of doubt regarding the criteria of choice, the best equation to estimate the leaf area of T. peruviana is the root mean square error (RMSE), and the Akaike (AIC) criteria could also be used. The RMSE is calculated as:
R M S E = i = 1 n E s t i m a t e d   l e a f   a r e a M e a s u r e d   l e a f   a r e a 2 n    
The AIC is calculated as:
A I C = n × ln × S Q R n + 2 × p    
AIC, Akaike criteria; n, samples; ln, neperian logarithm;
SQR, sum of squares of the regression; p, number of betas in the equation [36].

2.2. Statistical Data Analysis

Statistical analyses were performed in Statistica v. 8.0 (StatSoft, Tulsa, OK, USA), DataFit v. 8.0.32 (Oakdale Engineering, Oakdale, PA, USA), SigmaPlot for Windows v. 11.0 (Systat Software, Inc., San Jose, CA, USA), and R v. 3.3.3 (CoreTeam, 2020). All other calculations, statistical analyses, and graph generation were performed in GerminaR [37]. To identify significant differences among factors, ANOVA was performed. With a Student–Newman–Keuls test, the means were compared, and p < 0.01 was considered statistically significant.

3. Results

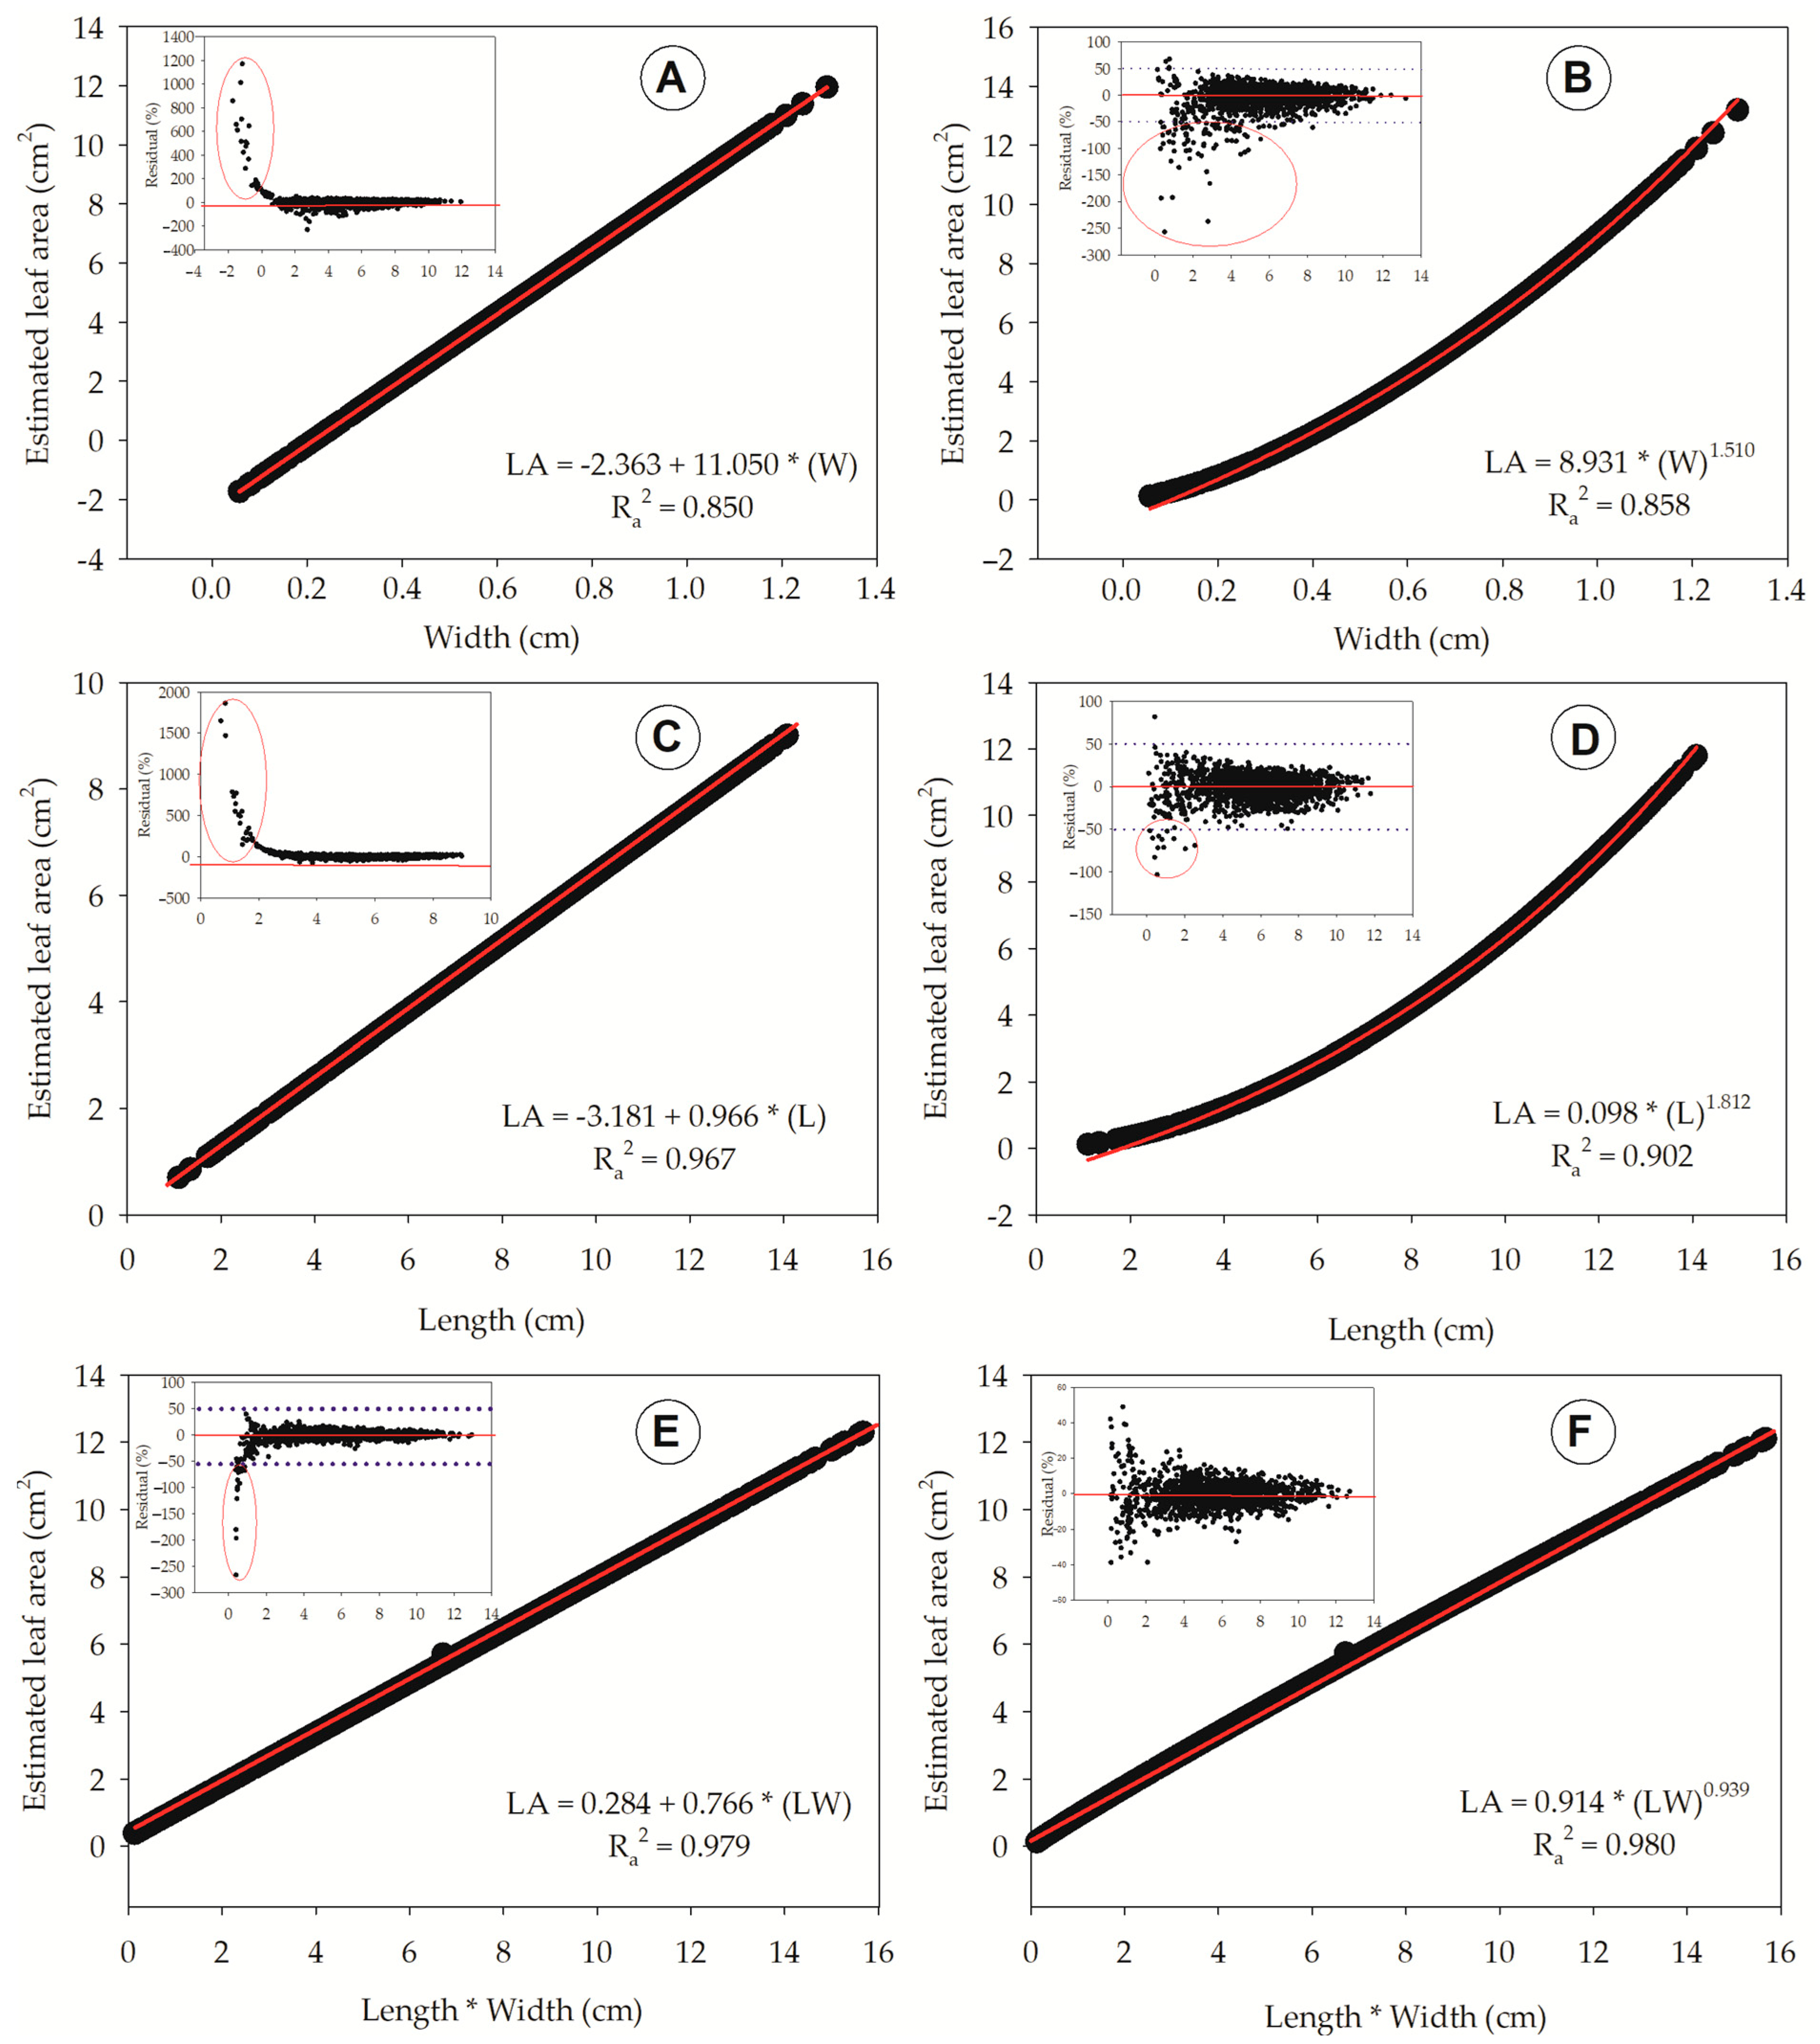
3.1. Equation Generation

The measurement of leaf parameters showed a wide range of leaf sizes (Table 1). The leaves measured in the rainy season showed lengths, widths, and leaf areas ranging from 1.10 cm to 13.77 cm, 0.06 cm to 1.18 cm, and 0.14 cm2 to 12.36 cm2, respectively; while leaves collected in the dry season ranged from 1.33 cm to 14.08 cm, 0.08 cm to 1.29 cm, and 0.11 cm2 to 12.89 cm2, respectively (Table 1). The leaf shape is lanceolate, with a leaf length × width ratio ranging from 5.02 to 38.99 (rainy season leaves) and 7.13 to 33.87 (dry season leaves).
Linear and non-linear (Supplementary Figure S1) regressions were obtained with the linear dimensions as the independent variable and the estimated leaf area of rainy and dry season leaves as the dependent variable.
Figure 2 illustrates a comparison between the betas (β0 and β1) derived from the tested equations. The confidence interval analysis reveals that both rainy and dry season populations exhibit no statistical differences in either β0 or β1. This suggests that, despite experiencing water stress, the populations do not undergo alterations in their leaf morphophysiology (Figure 3). Consequently, the samples from both seasons can be merged into a single dataset with a sample n of 1600 leaves. The comparison of betas is further detailed in the ANOVA table (Table 2), where the calculated F is significantly smaller than the tabulated F. Consequently, we reject the null hypothesis (H0). Thus, the initial hypothesis proposing distinct equations for expanded leaves during the dry and rainy seasons is refuted, as the populations yielded equations with β0 and β1 values that are statistically indistinguishable (Figure 2). These hypotheses align with the regression analysis and seasonal comparisons performed in the study, providing a clear framework to evaluate the relationships between leaf dimensions and leaf area under different climatic conditions.
Both rainy and dry season leaves showed a high correlation between leaf dimensions and leaf area, with determination coefficients (R2) of 0.996 and 0.995, respectively (Figure 3). Moreover, an insignificant β1 (6.22−15) with a good distribution of residuals (Figure 3 insert) makes these equations very reliable to predict the leaf area of T. peruviana.
Using a single sample population, nine distinct allometric equations were formulated to predict the leaf area of T. peruviana, irrespective of the specific season during which the leaves were gathered. Table 3 shows that linear (#1, #2, #4, #5, #7, and #8) and non-linear (#3, #6, and #9) models predict leaf area with excellent accuracy (R2 ≥ 0.850), low mean square error, and high F.

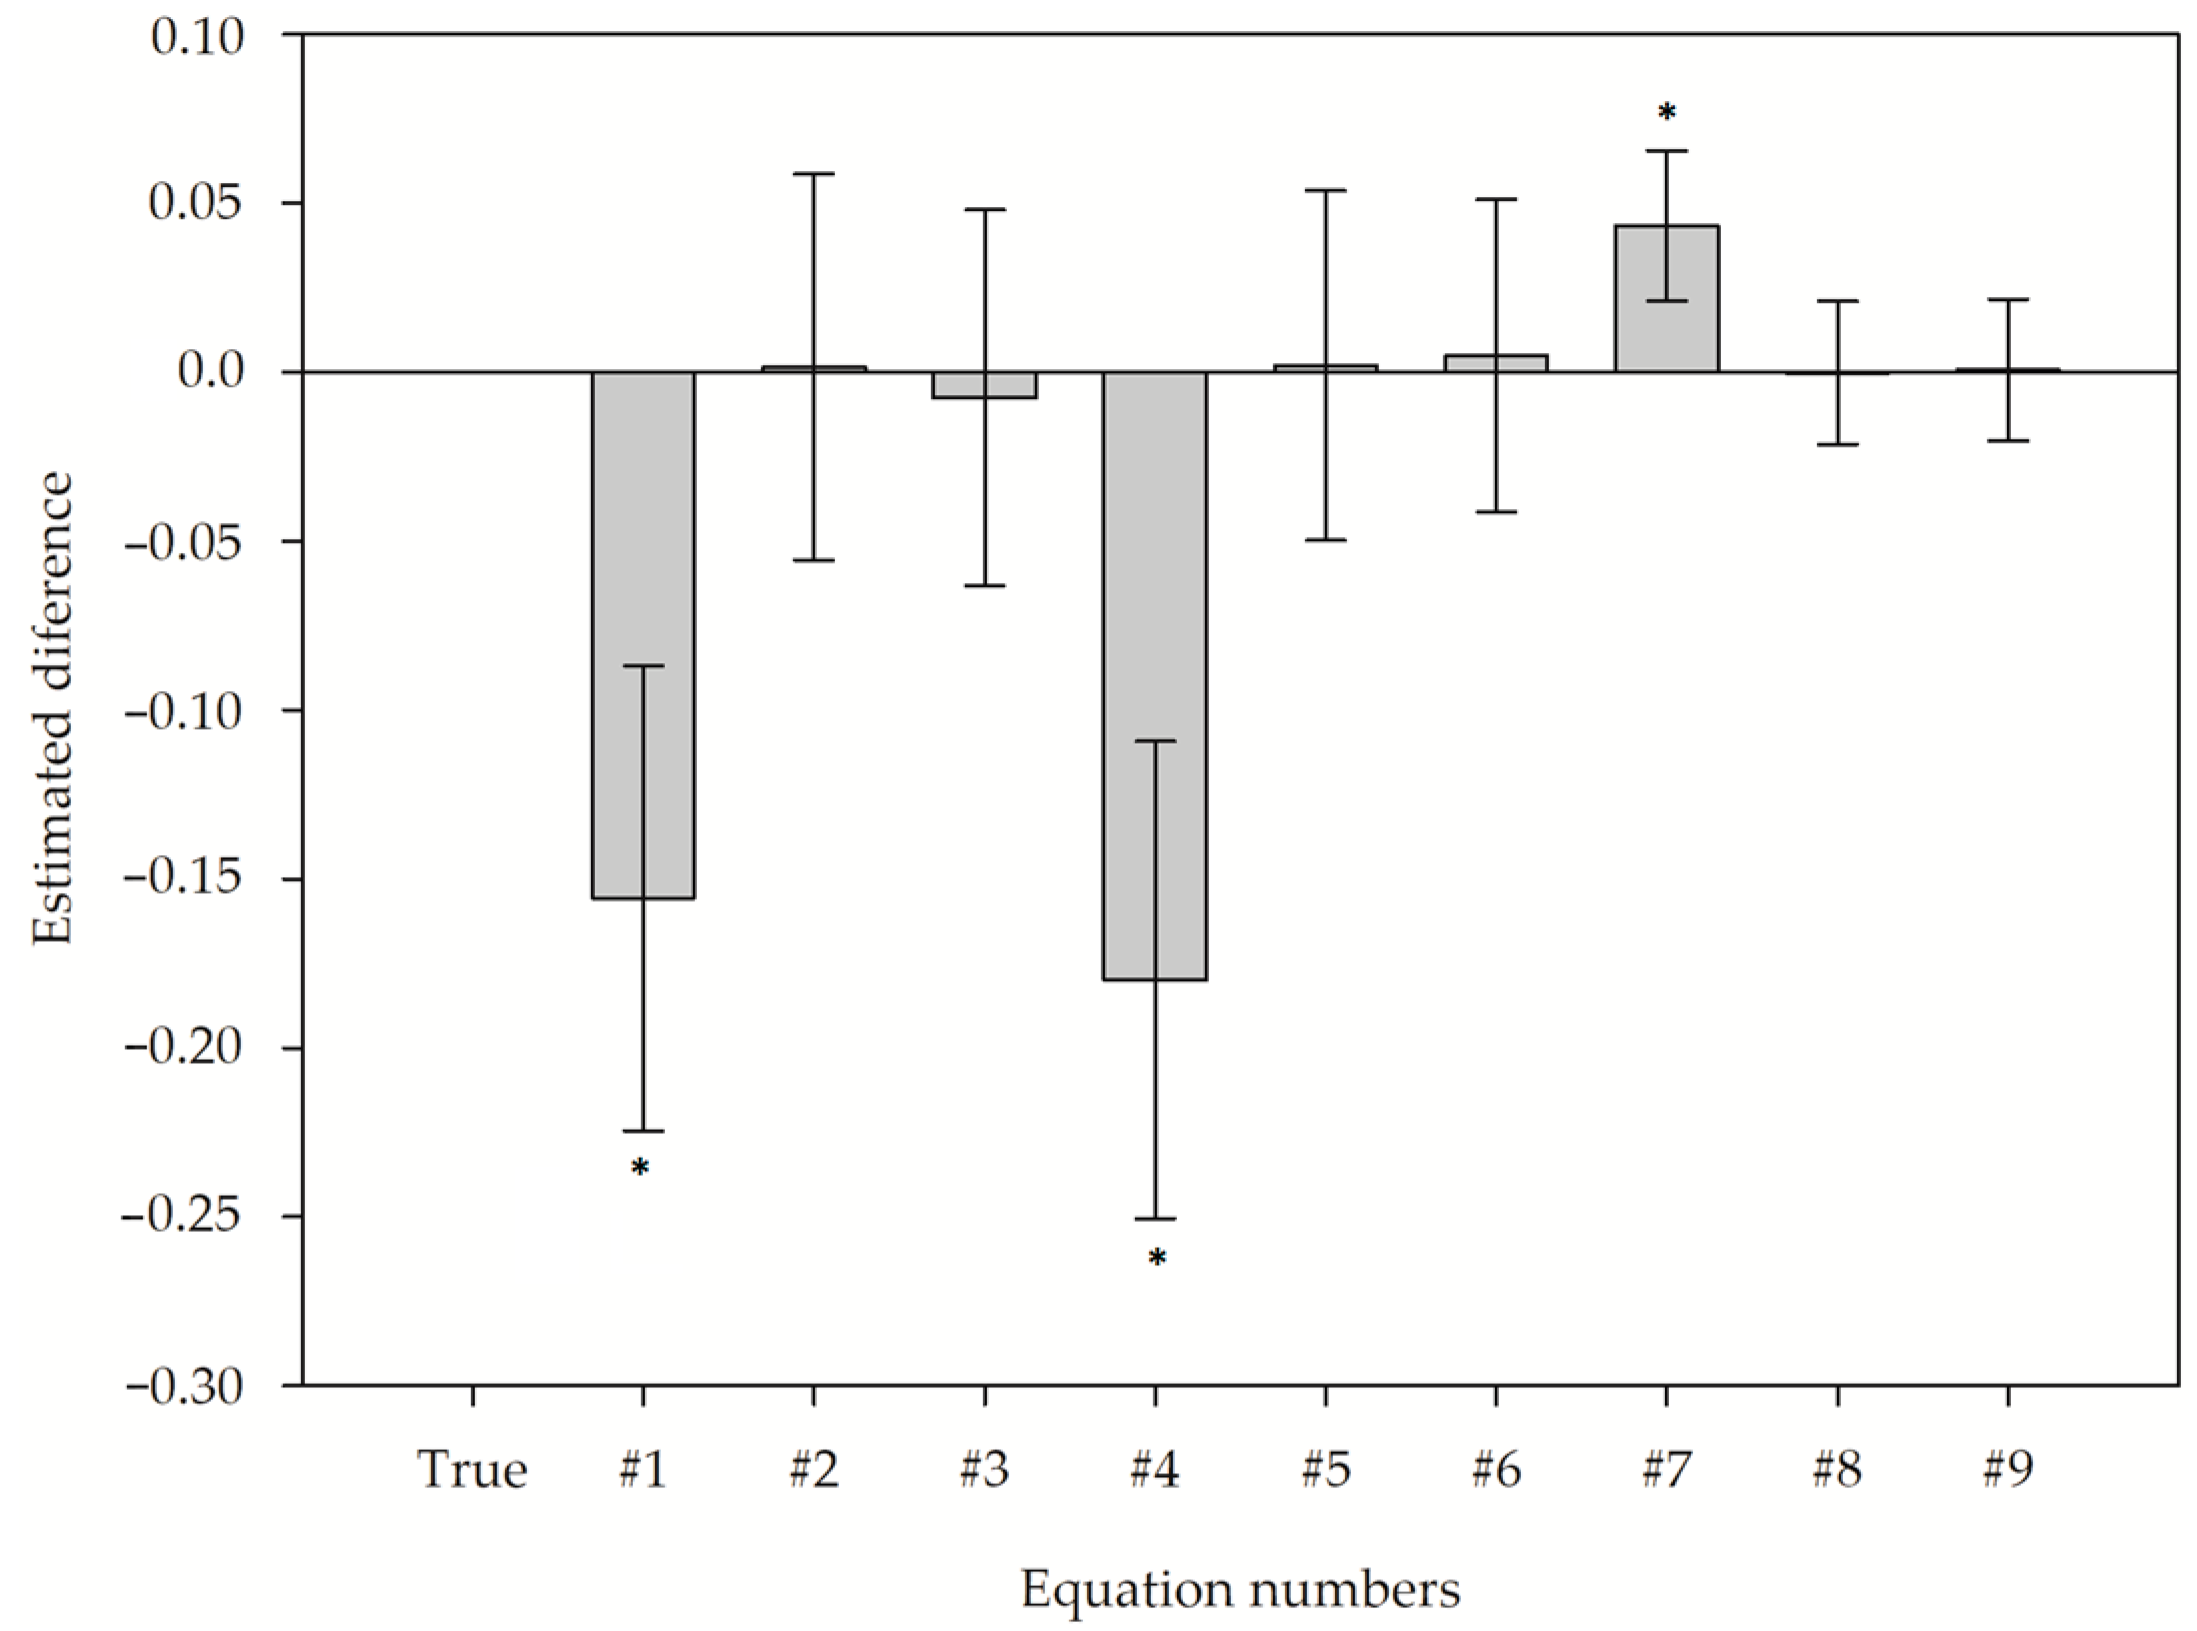
3.2. Analysis of Deviation from the Estimated to Observed Leaf Area

We proposed nine distinct equations to accurately predict the leaf area of T. peruviana (Table 3). With the analysis of the deviation between estimated leaf area and observed leaf area (Figure 4), we demonstrated that the equations #1, #4, and #7 are biased because they underestimated (#1, #4) or overestimated (#7) the leaf area in values statistically different from zero.

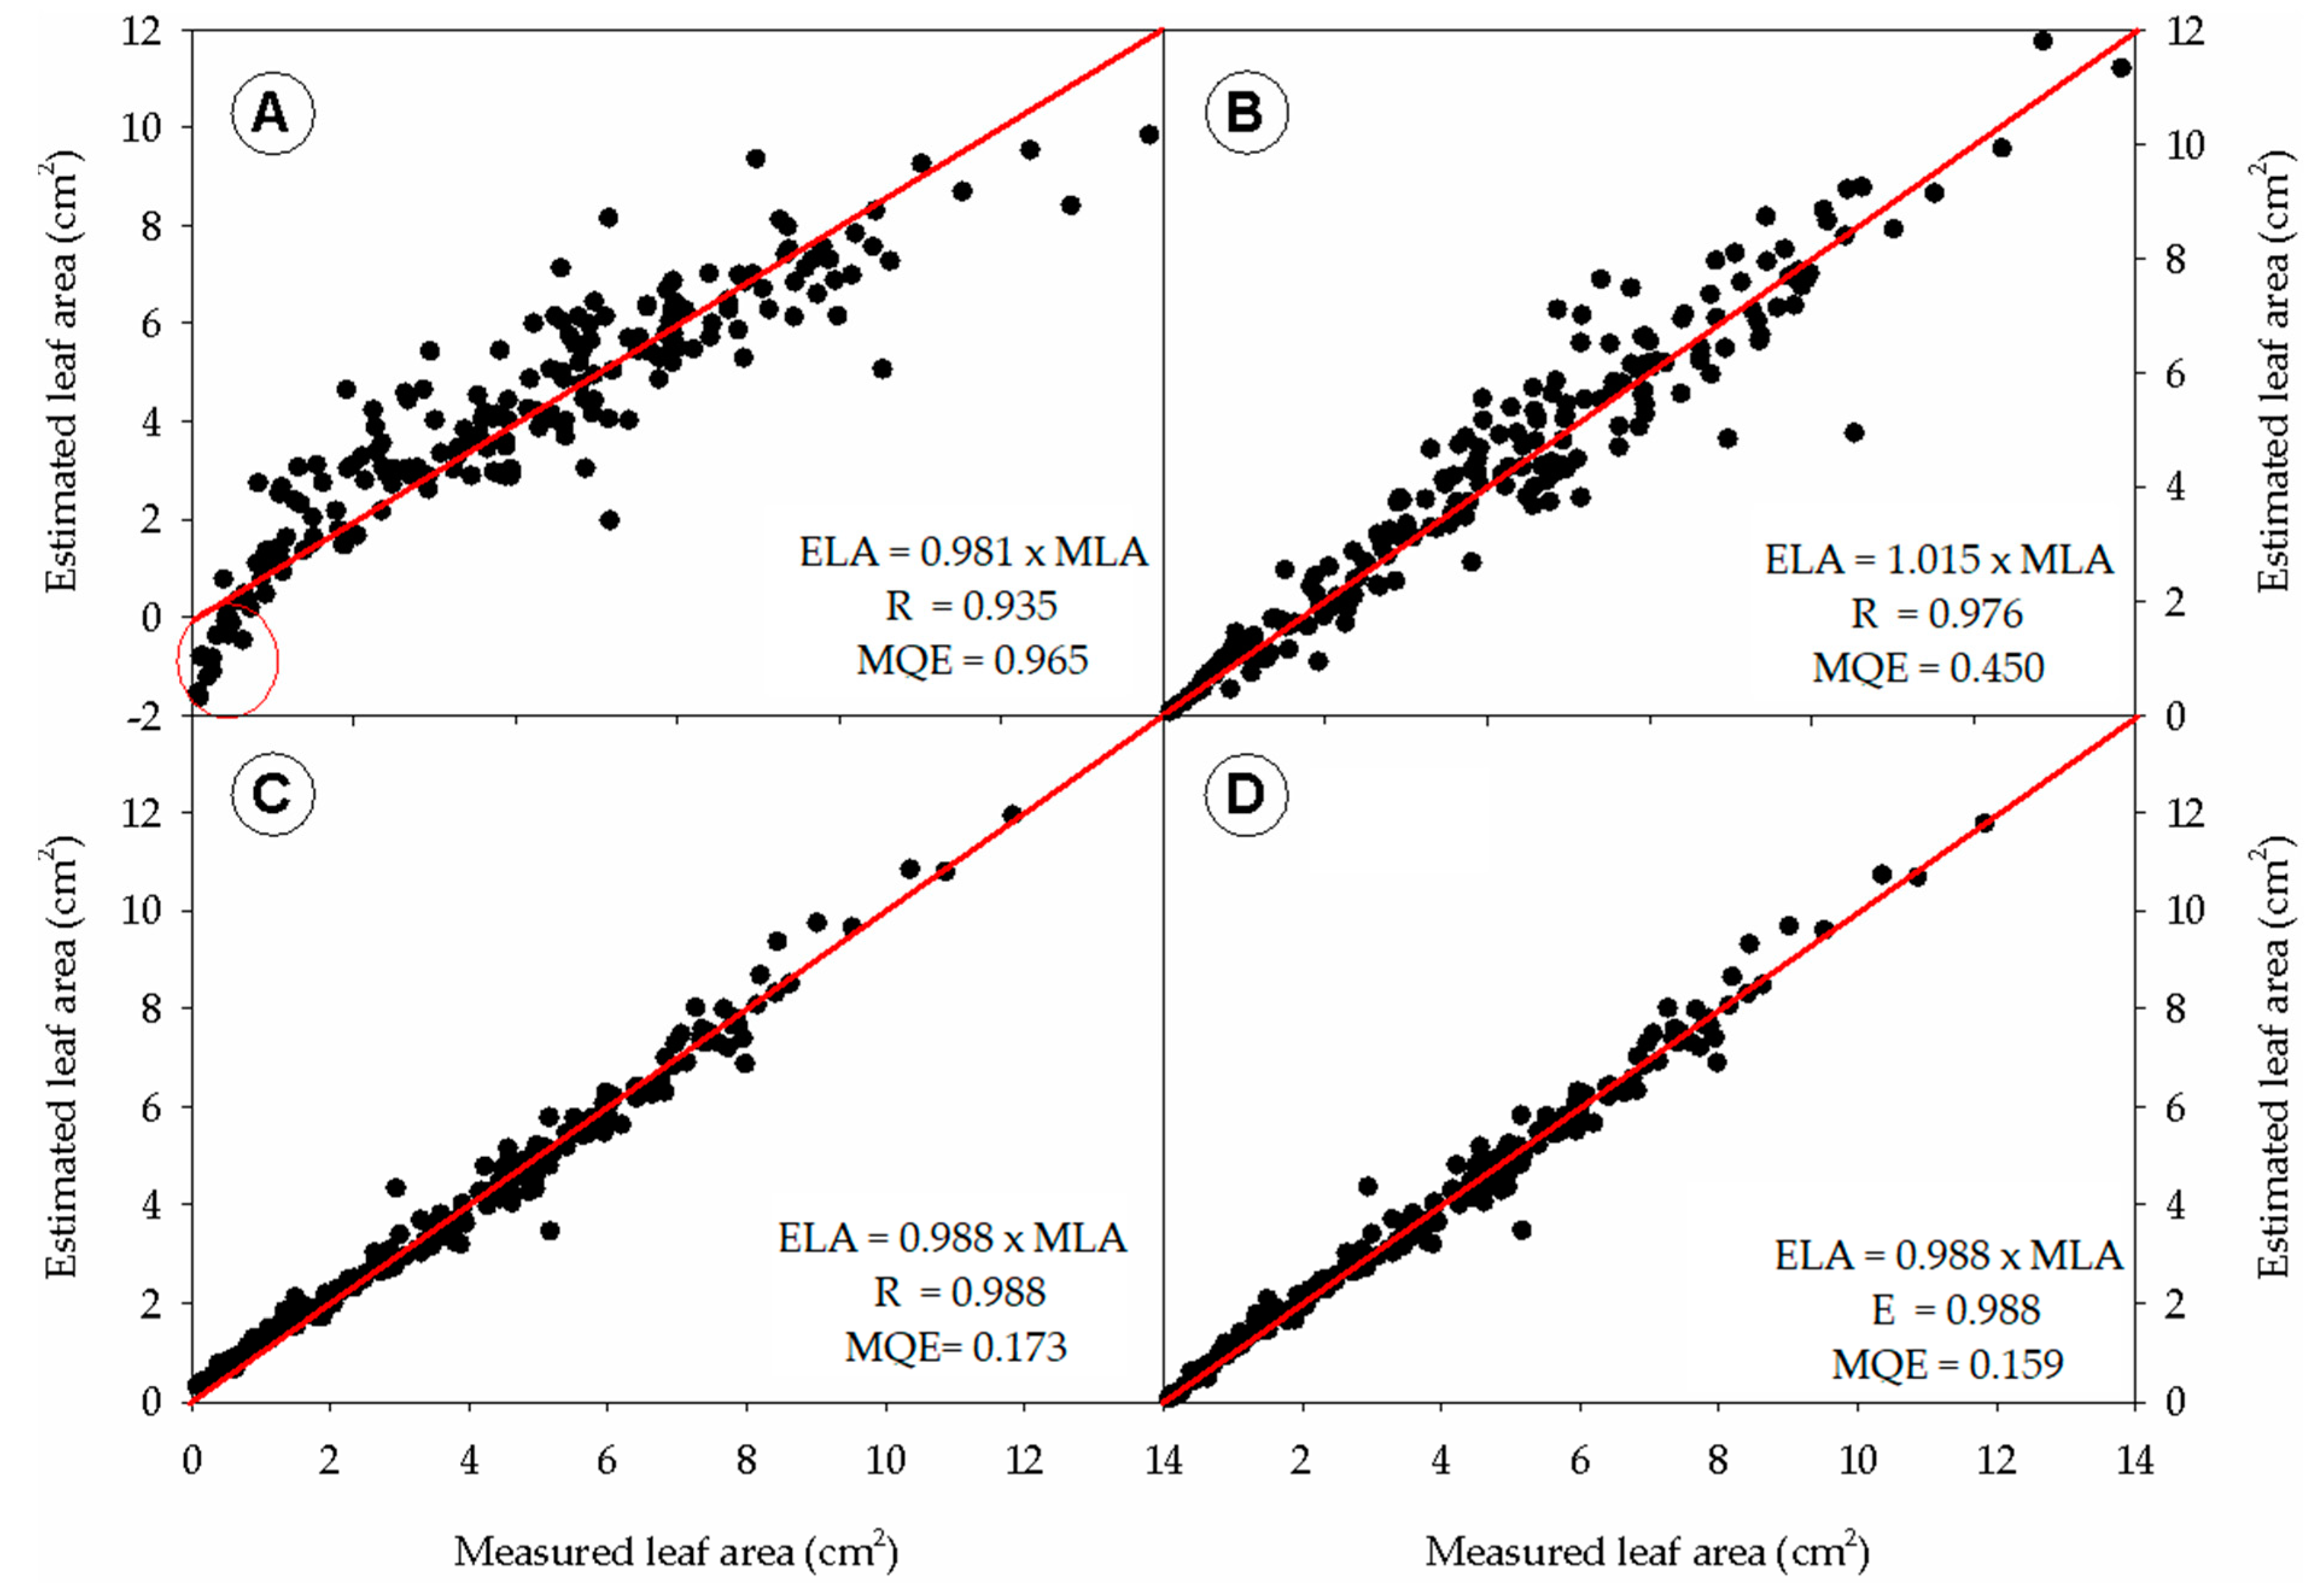
3.3. Analyzis of the Deviation from the Estimated to Observed Leaf Area

Equations #3, #5, #6, #8, and #9 seem to estimate T. peruviana leaf area with accuracy. However, equation #3 (Figure 5B) provokes an underestimation in 5.5% of the samples, while equation #5 (Figure 5D) provokes an underestimation in 1.9% of the samples. As this study considers the equation whose estimation is greater than or equal to 99% as valid, the equations proposed by models #4 and #5 must be rejected (Figure 5, red circles). Equation #2 (Figure 5A) provokes an overestimation in 0.84% of the samples but is still able to estimate the T. peruviana LA with accuracy (Figure 5).
Thus, only equations #2, #6, #8, and #9 may be considered in the choice of a better equation for the estimation of T. peruviana LA. From these equations, new sample data (n = 200) was tested to measure (i) the stability of the regression of coefficients, (ii) the low mean square error, and (iii) the high F value (Figure 5). However, after an analysis of these criteria, all equations (#2, #6, #8, and #9) progressed in the assessment of better equations for the estimation of T. peruviana LA. Indeed, equation #2 (Figure 5A), applied to a new sample, returns an R2 of 0.935, underestimating the leaf area of small leaves (Figure 5, red circles). Equation #6 (Figure 5B) returns an R2 of 0.976. As this study considers a maximum tolerable error of 0.01, R2 values of 0.935 and 0.976 invalidate equation #2 and #6 for estimating T. peruviana leaves with precision and accuracy.

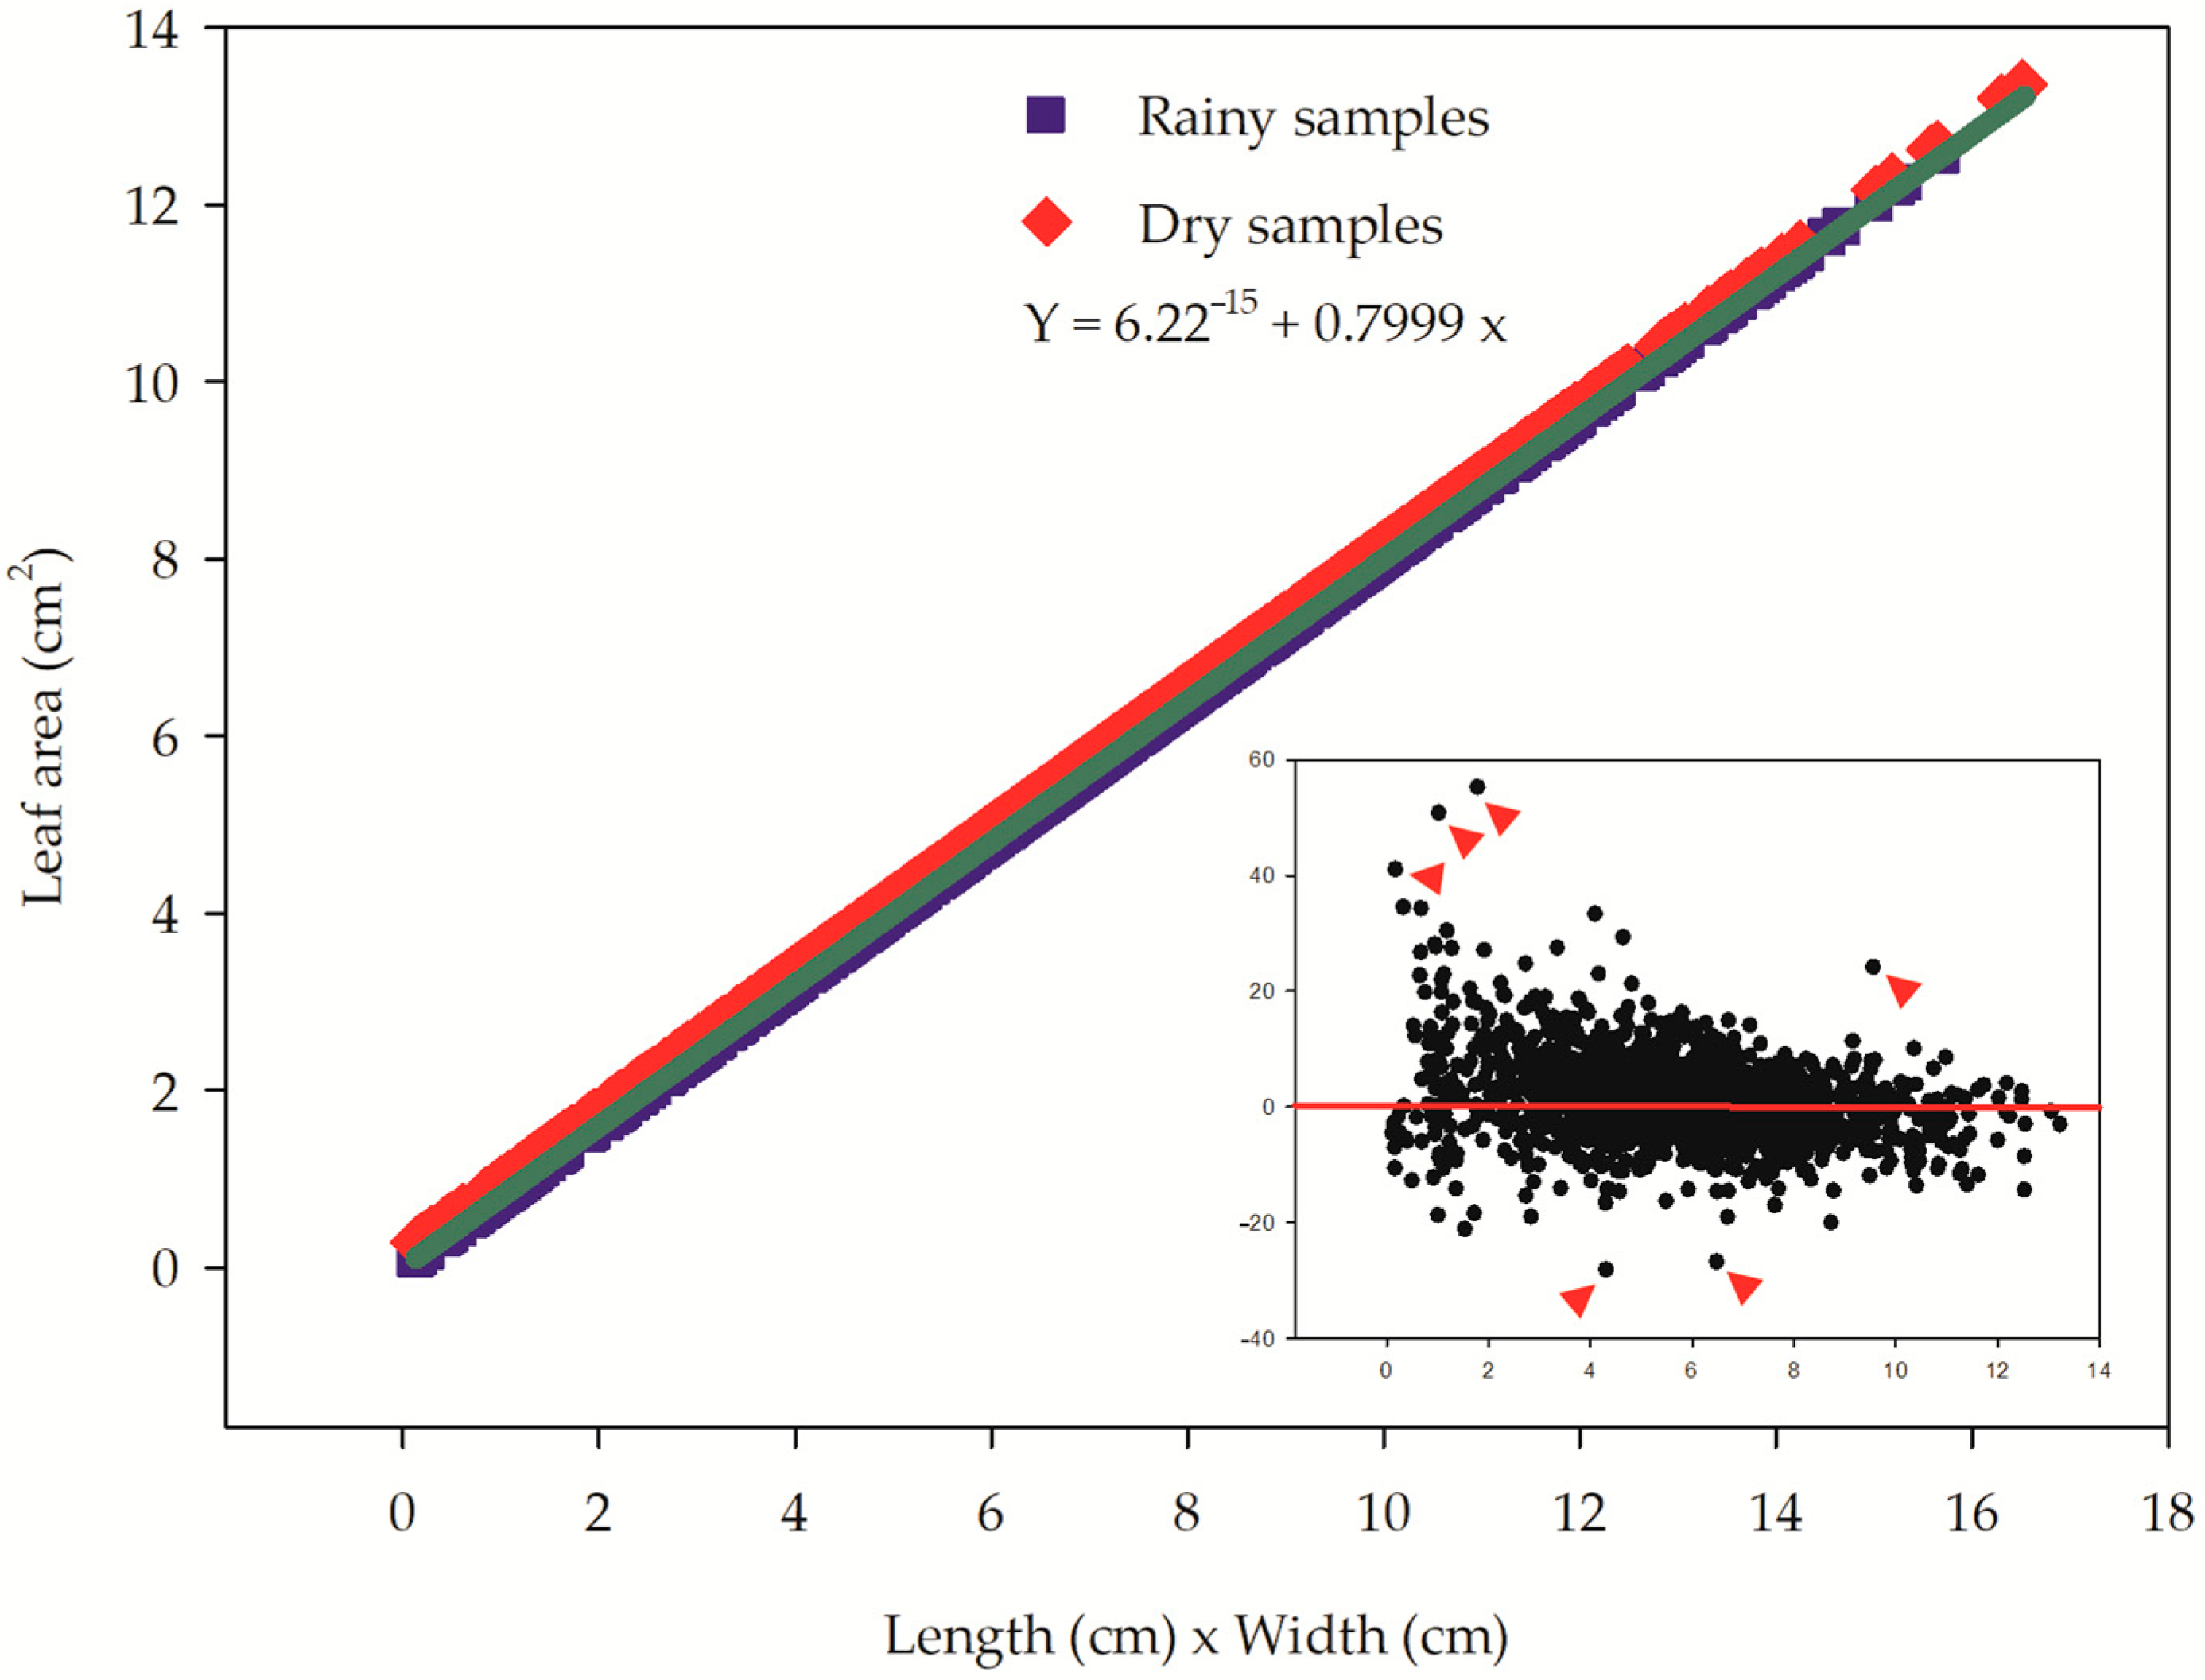
3.4. Confirming the Alometry Equation

After a rigorous process of selection of the allometric leaf area, equations #8 and #9 present all requisites to provide an accurate and unbiased estimate of the leaf area of T. peruviana. In general, one equation was proposed, then the requisites of the Akaike (AIC) criteria and root mean square error (RMSE) were used to define the best equation. However, neither AIC nor RMSE (Table 4) was able to distinguish between equation #8 and #9 as the best equation to estimate the leaf area of T. peruviana. Consequently, the authors, using the principle of parsimony established by Steel and Penny [34], which establishes the use of the “simplest” or perhaps the “most optimal” equation for solving the equation, recommend the use of equation #8 instead of equation #9 due to simplicity of the equation, where equation #8 is a linear equation while equation #9 is power equation. The simplest equations are better for estimating anything more quickly, a fact that is achieved with the use of equation #8. However, equations #2, #6, and #9 would be accepted at P values of 0.935, 0.976, and 0.988; i.e., with a small loss of accuracy. This assumption is good in land experiments with more sample data where the accuracy of P = 0.07, P = 0.02, and P = 0.01 is sufficient (Figure 6).

4. Discussion

This study describes an allometric approach as an accurate and unbiased tool to estimate the leaf area of T. peruviana. Notably, a single equation was derived for both rainy and dry season plants, enabling the merging of data collected from different seasons. The hypothesis that the samples would be identical was confirmed through H0 testing, where the calculated F value was consistent with the tabled F value (Table 2). This approach differs from previous studies that focused solely on expanded leaves [38,39,40]. We contend that relying solely on expanded leaves is not advisable when developing allometric models because agricultural interventions should encompass entire plants rather than focusing solely on the expanded leaves. High sample sizes are recommended for robustness, in line with the methodology employed in previous studies on other species [16,17,33].
Despite its perceived precision and accuracy, the linear model incorporating intercepts, as formulated, has demonstrated inadequacy, especially when dealing with small leaves [17]. However, in this study, the best model seems to be provided by equation #8, which is linear with the intercept. This could be due to the fact that the leaves of T. peruviana are very lanceolate and it is not possible to obtain a very small leaf with dimensions very different from those encountered in this study using 1800 leaves. Another fact that may have contributed to the choice of model #8 could be the low values of βs that do not allow large overestimation or underestimation of LA [15,41,42,43]. Equation #8 is better than #9 because it relies on easier calculations than equation #9. Al-Barzinji and Amin [43] showed that Nerium oleander equations similar to #8 had the strongest relationship (p < 0.0001) with LA, manifested in high R2 and low MSres values. Unlike in other studies [17], equation #8 showed an excellent dispersion of residues, being completely homoscedastic; perhaps this is one of the points that renders this equation as the most suitable for the allometry of T. peruviana, a fact that is similar to the effect promoted by the power equation highlighted by Antunes et al. [17] and Chatterjee and Hadi [44] as being the best allometric equation for leaf area estimation. Power equations were considered the most adequate for estimating the LA of black pepper [45], ginger [46], grape vines [27], dwarf coconut trees [47], squash [48], and triticale [20].
Allometric models using only one dimension as a variable are often considered as alternatives for estimating the LA of several species [15,16,17,19,31,33,41,43,46,49,50,51]; when the analyses pointed to the validation of this type of model, they were always overwhelmed. In this study, none of the models employing a single linear dimension could be validated. However, when the models were changed from simple to multiple linear regression models using length and width as independent variables, leaf area estimation became more accurate through the increase in the coefficient of determination and the decreasing MSres. Consequently, we recommend the equation LA = 0.284 + 0.766 × (LW) (R2 = 0.997) due to its simplicity and accuracy. While the equation LA = 0.914 × (LW)0.939 (R2 = 0.998) is also acceptable, it involves potential equations and requires more complex calculations compared to the linear model proposed in equation #8. It is worth highlighting that within the leaf area of plants exhibiting physiognomies that deviate from a rectangular shape, alternative dimensions can be assessed. These assessments often yield conclusions akin to those outlined in the aforementioned study Moreover, when considering a single dimension, length (L) or width (W), a relatively high Ra2, and a low residual sum of squares (R-SS), the residual scatter plot exhibited non-normal distribution (Figure 5). These characteristics can render invalidation of those models [44]. However, models incorporating both dimensions exhibited higher coefficients of determination compared to those involving only a single dimension.
Commonly, linear models are deemed sufficient for forecasting the leaf area across numerous agricultural and forestry species [21,41,46,49,50,52,53]. However, these models tend to function with a degree of reduced accuracy due to the breach of fundamental assumptions, leading to notable statistical issues. Such problems include limitations in the data’s variability range and sample size, impacting the model’s reliability and precision. Certain models solely capture a fraction of leaf variations, while the inflation of numerous statistical parameters is a frequent occurrence in exceptionally small sample sizes. Our study underscores the potential doubts surrounding the use of all simplistic linear models, particularly when applied to smaller leaf categories. Consequently, we propose that employing straightforward linear models, such as Yi = β0 + β1Xi + εi, warrants consideration only when categorizing leaf sizes and concurrently scrutinizing residual dispersion patterns across all leaf classes. However, implementing this approach can be labor-intensive and impractical despite the model’s straightforward adjustability and operational ease.
The formula outlined by Shabani and Sepaskhah [31] closely resembles our equation #7, wherein the k factor is substituted by the coefficient β1 in a deductive manner, aligning with the equation proposed by Dolph [52] utilizing the 2/3 rule. The key distinction between our study and prior research [31,52] lies in the considerably larger number of samples analyzed in our current work. Equation #7, which integrates Dolph’s principles as revised by Shabani and Sepaskhah [31], unfortunately demonstrated inefficiency in our study, fostering a misleading sense of precision owing to the elevated Fcalc and R2a values. Equation #7 follow the Dolph’s 2/3 rule [52], and equation #9, introduced in this research, does not violate any established ecological principles or statistical norms except during the validation process, meaning equation #9 demonstrates greater stability than model #7.
The superiority of the non-linear model #9 can be elucidated by the conceptual understanding of LWβ1, which conveniently adjusts interactively to offset the penalty incurred when the LW product deviates from a rectangular shape. Throughout this study, the term LWβ1 consistently hovered near a value of 1. Finally, while the overarching formula put forward by Shabani and Sepaskhah [31] presents a commendable attempt, akin to several previously discussed equations, it harbors significant constraints. This particular expression operates effectively solely within a specific leaf development stage because linear models fall short in capturing the comprehensive spectrum of inherent leaf development variations. Therefore, within plant groups exhibiting diverse leaf patterns across ontogenetic stages or in studies where encompassing the entire scope of leaf variation within a species is pivotal, non-linear equations emerge as the sole avenue enabling the deployment of precise, unbiased models.
Overall, non-linear equations (such as models #3, #6, and #9) emerged as superior predictors of leaf area (LA) compared to the simpler linear models (#1, #2, #4, #5, #7, #8). Despite painstaking effort, discernible differences in residual dispersion between models #2 and #5 were successfully identified. This discovery proved pivotal, highlighting a limitation predominantly associated with the oversimplified nature of linear models which was notably apparent in smaller leaves, as previously reported in Santos et al. [33].
Upon confirmation through data analysis, these equations yielded negative LA values, representing biologically invalid conditions. Evaluating residuals serves as a complementary approach for scrutinizing overall model fitness. Opting for equations with minimized biases and incorporating non-linear terms aids in rectifying potential distortions in future analyses. Linear models exhibited positive residual patterns in initial projections, indicating inherent challenges in accurately estimating leaf area, particularly during the early stages of ontogenetic development. This emphasizes the inadequacy of linear models across the entire leaf development spectrum, necessitating the adoption of non-linear models for future implementations [26]. While many studies fail to elucidate the rationale behind model fitness, previous research has acknowledged this model’s efficacy in predicting LA across various plant species [16,17,21].
When estimating leaf areas, the introduction of a constant (intercept) in linear models, particularly in small leaves, with diminishing significance as the leaf size increases [44] returns a positive or negative value of LA, even when the LW is equal to zero. This bias, addressed by Antunes et al. [17], in estimating LA for various coffee plant genotypes involves the elimination of the intercept. Consequently, polynomial models that incorporate the β0 parameter (constant) are deemed inadequate for LA estimation, as the model lacks biological validity when β0 deviates from zero. However, in this study, the best equation was #8, using a linear model with the intercept. It is worth noting that in this study, we can recommend the use of equation #9 too; however, equation #8 is easier to work with in land experiments compared to equation #9.

5. Conclusions

After a meticulous examination, we have established a model characterized by an absence of partiality, consistent residual dispersion, remarkable stability denoted by minimal deviation, and similar average values between calibration and validation sets. This absence of imposed constraints commonly observed in alternate models instills confidence in the estimation coefficient averages. Our analysis culminates in proposing a model represented as LA = 0.284 + 0.766 × (LW), serving as a reliable estimator for predicting the leaf area of specific plant species. In essence, such models significantly increase the likelihood of parameter estimations aligning closely with the true values. However, regardless of diverse environmental factors or growth stages, our research underscores the effectiveness and simplicity of LW power models (LA = LWβ1) as robust, non-destructive tools for accurately estimating leaf areas for the given plant species.

Supplementary Materials

The following supporting information can be downloaded at: https://www.mdpi.com/article/10.3390/f15010057/s1, Supplementary Figure S1: The linear (A,B) and power (C) equation to estimate leaf area and leaf dimensions (L, length and W, width) for two Thevetia peruviana samples (rainy, blue; dry, red) and a linear (green) model.

Author Contributions

Conceptualization, M.F.P., L.A.R.-P., A.J.-O. and J.d.D.J.-N.; methodology, M.F.P.; software, M.F.P. and Y.Y.P.-R.; validation, M.F.P., L.A.R.-P., A.J.-O. and J.d.D.J.-N.; formal analysis, M.F.P. and Y.Y.P.-R.; investigation, M.F.P.; resources, M.F.P., L.A.R.-P., A.J.-O. and J.d.D.J.-N.; writing—original draft preparation, M.F.P., L.A.R.-P., A.J.-O. and J.d.D.J.-N.; writing—review and editing, M.F.P., L.A.R.-P., A.J.-O. and J.d.D.J.-N.; project administration, M.F.P.; funding acquisition, M.F.P., L.A.R.-P., A.J.-O. and J.d.D.J.-N. All authors have read and agreed to the published version of the manuscript.

Funding

This research received no external funding.

Informed Consent Statement

Not applicable.

Data Availability Statement

The data statement if evaluable on Supplementary Figure S1.

Conflicts of Interest

The authors declare no conflict of interest.

References

  1. Adamu, F.A.; Jahun, B.G.; Daniel, C. Assessment and optimization of energy use of yellow oleander (Thevetia peruviana) for biodiesel blends in Nigeria. Int. J. Sci. Res. 2015, 4, 1277–1280. [Google Scholar]
  2. El Gizawy, H.A.; El Zanaty, S.A.; El Ghaly, E.M.; Seif-Eldein, N.A. Thevetia peruviana leaves, HPLC profile, isolation, and in vitro cytotoxicity. RSC Adv. 2023, 13, 12072. [Google Scholar] [CrossRef] [PubMed]
  3. Villa, F.A.; Hormaza, A.; Arias, Z.M. Thevetin B: Cardiotonic glycoside predominant in Thevetia peruviana. Sci. Tech. 2011, 9, 298–303. [Google Scholar]
  4. Zibbu, G.; Batra, A. Thevetia peruviana (Pers.) Schum: A plant with enormous therapeutic potential. J. Pharm. Res. 2011, 4, 4461–4464. [Google Scholar]
  5. Oluwaniyi, O.O.; Ibiyemi, S.A. Extractability of Thevetia peruviana glycosides with alcohol mixture. Afr. J. Biotechnol. 2007, 6, 2166–2170. [Google Scholar]
  6. Sharma, T.; Kaur, J.; Singh, G. Phytochemistry and pharmacological activities of Thevetia peruviana: A review. Int. J. Pharm. Sci. Res. 2022, 13, 2274–2282. [Google Scholar] [CrossRef]
  7. Kohls, S.; Scholz-Böttcher, B.M.; Teske, J.; Zark, P.; Rullkötter, J. Cardiac glycosides from yellow oleander (Thevetia peruviana) seeds sarah kohls. Phytochemistry 2012, 75, 114–127. [Google Scholar] [CrossRef]
  8. Said, I.M.; Rahman, Z.A. The cardenolides of Thevetia peruviana grown in Malasya. Asean J. Sci. Technol. Dev. 1986, 3, 83–86. [Google Scholar] [CrossRef]
  9. Bandara, V.; Weinstein, S.A.; White, J.; Eddleston, M. A review of the natural history, toxinology, diagnosis and clinical management of Nerium oleander (common oleander) and Thevetia peruviana (yellow oleander) poisoning. Toxicon 2010, 56, 273–281. [Google Scholar] [CrossRef]
  10. Terra, S.G.; Washam, J.B.; Dunham, G.D.; Gattis, W.A. Therapeutic range of digoxin’s efficacy in heart failure: What is the evidence? Pharmacotherapy 1999, 19, 1123–1126. [Google Scholar] [CrossRef]
  11. Prabhasankar, P.; Raguputhi, G.; Sundaravadivel, B.; Annapoorani, K.S.; Damodaran, C. Enzyme-linked immunosorbent assay for the phytotoxin thevetin. J. Immunoass. 1993, 14, 279–296. [Google Scholar] [CrossRef] [PubMed]
  12. Eddleston, M.; Ariaratnam, C.A.; Meyer, W.P.; Perera, G.; Kularatne, A.M.; Attapattu, S.; Sheriff, M.H.; Warrell, D.A. Epidemic of selfpoisoning with seeds of the yellow oleander tree (Thevetia peruviana) in northern Sri Lanka. Trop. Med. Int. Health 1999, 4, 266–273. [Google Scholar] [CrossRef] [PubMed]
  13. Díaz, S.; Kattge, J.; Cornelissen, J.H.; Wright, I.J.; Lavorel, S.; Dray, S.; Reu, B.; Kleyer, M.; Wirth, C.; Prentice, I.C.; et al. The global spectrum of plant form and function. Nature 2016, 529, 167–171. [Google Scholar] [CrossRef] [PubMed]
  14. Mendoza-de-Gyves, E.; Cristofori, V.; Fallovo, C.; Rouphael, Y.; Bignami, C. Accurate and rapid technique for leaf area measurement in medlar (Mespilus germanica L.). Adv. Hortic. Sci. 2008, 22, 223–226. [Google Scholar]
  15. Cristofori, V.; Rouphael, Y.; Mendoza-de Gyves, E.; Bignami, C. A simple model for estimating leaf area of hazelnut from linear measurements. Sci. Hortic. 2007, 113, 221–225. [Google Scholar] [CrossRef]
  16. Pompelli, M.F.; Antunes, W.C.; Ferreira, D.T.R.G.; Cavalcante, P.P.G.S.; Wanderley-Filho, H.C.L.; Endres, L. Allometric models for non-destructive leaf area estimation of the Jatropha curcas. Biomass Bioenerg. 2012, 36, 77–85. [Google Scholar] [CrossRef]
  17. Antunes, W.C.; Pompelli, M.F.; Carretero, D.M.; DaMatta, F.M. Allometric models for non-destructive leaf area estimation in coffee (Coffea arabica and Coffea canephora). Ann. Appl. Biol. 2008, 153, 33–40. [Google Scholar] [CrossRef]
  18. Schrader, J.; Pillar, G.; Kreft, H. Leaf-IT: An Android application for measuring leaf area. Ecol. Evol. 2017, 7, 9731–9738. [Google Scholar] [CrossRef]
  19. Yang, J.; Alley, M. A mechanistic model for describing corn plant leaf area distribution. Agron. J. 2005, 97, 41–48. [Google Scholar] [CrossRef]
  20. Toebe, M.; de Melo, P.J.; de Souza, R.R.; Mello, A.C.; Tartaglia, F.L. Leaf area estimation in triticale by leaf dimensions. Rev. Bras. Cienc. Agrar. 2019, 14, e5656. [Google Scholar] [CrossRef]
  21. Souza, M.C.; Amaral, C.L. Non-destructive linear model for leaf area estimation in Vernonia ferruginea Less. Braz. J. Biol. 2015, 75, 152–156. [Google Scholar] [CrossRef] [PubMed]
  22. Smith, R.J.; Kliewer, W.M. Estimation of Thompson seedless grapevine leaf area. Am. J. Enol. Vitic. 1984, 35, 16–22. [Google Scholar] [CrossRef]
  23. Pandey, S.K. A simple, cost-effective method for leaf area estimation. J. Bot. 2011, 2011, 658240. [Google Scholar] [CrossRef]
  24. Adhikari, R.; Li, C.; Kalbaugh, K.; Nemali, K. A low-cost smartphone controlled sensor based on image analysis for estimating whole-plant tissue nitrogen (N) content in floriculture crops. Comput. Electron. Agric. 2020, 169, 205173. [Google Scholar] [CrossRef]
  25. Graybill, F.A. Theory and Application of the Linear Model; Duxbury Press: Pacific Grove, CA, USA, 2000. [Google Scholar]
  26. Zuur, A.F.; Elena, N.I.; Elphick, C.S. A protocol for data exploration to avoid common statistical problems. Methods Ecol. Evol. 2009, 1, 3–14. [Google Scholar] [CrossRef]
  27. Williams, L., III; Martinson, T.E. Nondestructive leaf area estimation of ‘Niagara’ and ‘DeChaunac’ grapevines. Sci. Hortic. 2003, 98, 493–498. [Google Scholar] [CrossRef]
  28. Whitworth, J.L.; Mauromoustakos, A.; Smith, M.W. A nondestructive method for estimation of leaf area in pecan. HortScience 1992, 27, 851. [Google Scholar] [CrossRef]
  29. Tsialtas, J.T.; Maslaris, N. Leaf aea estimation in a sugar beet cultivar by linear models. Photosynthetica 2005, 43, 477–479. [Google Scholar] [CrossRef]
  30. Torri, S.I.; Descalzi, C.; Frusso, E. Estimation of leaf area in pecan cultivars (Carya illinoinensis). Cienc. Investig. Agrar. 2009, 36, 53–58. [Google Scholar] [CrossRef]
  31. Shabani, A.; Sepaskhah, A.R. Leaf area estimation by a simple and non-destructive method. Iran. Agric. Res. 2017, 36, 101–105. [Google Scholar]
  32. Salazar, J.C.S.; Melgarejo, L.M.; Bautista, E.H.D.; Rienzo, J.A.; Casanoves, F. Non-destructive estimation of the leaf weight and leaf area in cacao (Theobroma cacao L.). Sci. Hortic. 2018, 229, 19–24. [Google Scholar] [CrossRef]
  33. Santos, J.N.B.; Jarma-Orozco, A.; Antunes, W.C.; Mendes, K.R.; Figueiroa, J.M.; Pessoa, L.M.; Pompelli, M.F. New approaches to predict leaf area in woody tree species from the Atlantic Rainforest, Brazil. Austral Ecol. 2021, 46, 613–626. [Google Scholar] [CrossRef]
  34. Steel, M.; Penny, D. Parsimony, likelihood, and the role of models in molecular phylogenetics. Mol. Biol. Evol. 2000, 17, 839–850. [Google Scholar] [CrossRef] [PubMed]
  35. Cumming, G.; Fidler, F.; Vaux, D.L. Error bars in experimental biology. J. Cell Biol. 2007, 177, 7–11. [Google Scholar] [CrossRef] [PubMed]
  36. Akaike, H. A new look at the statistical model identification. Trans. Autom. Control 1974, 19, 716–723. [Google Scholar] [CrossRef]
  37. Lozano-Isla, F.; Alfaro, O.B.; Pompelli, M.F. GerminaR: An R package for germination analysis with the interactive web application ‘GerminaQuant for R’. Ecol. Res. 2019, 34, 339–346. [Google Scholar] [CrossRef]
  38. Lima Filho, O.P.; Malavolta, E. Estimativa de Área Foliar em Estevia (Stevia rebaudiana (Bert.) Bertoni). Available online: http://www.lni.unipi.it/stevia/stevia/estimativadearea.htm (accessed on 17 May 2020).
  39. Ramesh, K.; Ramawat, N.; Singh, V. Leaf area distribution pattern and non-destructive estimation methods of leaf area for Stevia rebaudiana (Bert.) Bertoni. Asian J. Plant Sci. 2007, 6, 1037–1043. [Google Scholar] [CrossRef]
  40. Achten, W.M.J.; Maes, W.H.; Reubens, B.; Mathijs, E.; Singh, V.P.; Verchot, L.; Muys, B. Biomass production and allocation in Jatropha curcas L. seedlings under different levels of drought stress. Biomass Bioenerg. 2010, 34, 667–676. [Google Scholar] [CrossRef]
  41. Blanco, F.F.; Folegatti, M.V. Estimation of leaf area for greenhouse cucumber by linear measurements under salinity and grafting. Sci. Agric. 2005, 62, 305–309. [Google Scholar] [CrossRef]
  42. Schmildt, E.R.; Amaral, J.T.; Santos, J.S.; Schmildt, O. Allometric model for estimating leaf area in clonal varieties of coffee (Coffea canephora). Rev. Cien Agronon. 2015, 46, 740–748. [Google Scholar] [CrossRef]
  43. Al-Barzinji, I.M.; Amin, B.M. Non-destructive method of leaf area estimation for oleander (Nerium oleander L.) cultivated in the Iraqi Kurdistan region. Sci. J. Koya Univ. 2016, IV, 22–26. [Google Scholar] [CrossRef]
  44. Chatterjee, S.; Hadi, A.S. Regression Analysis by Example; John Wiley & Sons: Hoboken, NJ, USA, 2006. [Google Scholar]
  45. Kandiannan, K.; Kailassam, C.; Chandaragiri, K.K.; Sankaran, N. Allometric model for leaf area estimation in black pepper (Piper nigrum L.). J. Agron. Crop Sci. 2002, 188, 138–140. [Google Scholar] [CrossRef]
  46. Kandiannan, K.; Parthasarathy, U.; Krishnamurthy, K.S.; Thankamani, C.K.; Srinivasan, V. Modeling individual leaf area of ginger (Zingiber officinale Roscoe) using leaf length and width. Sci. Hortic. 2009, 120, 532–537. [Google Scholar] [CrossRef]
  47. Sousa, E.F.; Araújo, M.C.; Posse, R.P.; Detmann, E.; Bernardo, S.; Berbert, P.A.; Santos, P.A. Estimating the total leaf area of the green dwarf coconut tree (Cocos nucifera L.). Sci. Agric. 2005, 62, 597–600. [Google Scholar] [CrossRef]
  48. Toebe, M.; Souza, R.R.; Mello, A.C.; Melo, P.J.; Segatto, A.; Castanha, A.C. Leaf area estimation of squash ‘Brasileirinha’ by leaf dimensions. Ciência Rural 2019, 49, e20180932. [Google Scholar] [CrossRef]
  49. Peksen, E. Non-destructive leaf area estimation model for faba bean (Vicia faba L.). Sci. Hortic. 2007, 113, 322–328. [Google Scholar] [CrossRef]
  50. Keramatlou, I.; Sharifani, M.; Sabouri, H.; Alizadeh, M.; Kamkar, B. A simple linear model for leaf area estimation in Persian walnut (Juglans regia L.). Sci. Hortic. 2015, 184, 36–39. [Google Scholar] [CrossRef]
  51. Liu, Z.; Zhu, Y.; Li, F.; Jin, G. Non-destructively predicting leaf area, leaf mass and specific leaf area based on a linear mixed-effect model for broadleaf species. Ecol. Indic. 2017, 78, 340–350. [Google Scholar] [CrossRef]
  52. Dolph, G.E. The effect of different calculational techniques on the estimation of leaf area and the construction of leaf size distributions. Torrey Bot. Soc. 1977, 104, 264–269. [Google Scholar] [CrossRef]
  53. Villar, R.; Ruiz-Robleto, J.; Ubera, J.L.; Poorter, H. Exploring variation in leaf mass per area (LMA) from leaf to cell: An anatomical analysis of 26 woody species. Am. J. Bot. 2013, 100, 1969–1980. [Google Scholar] [CrossRef]
Figure 1. Leaf morphology describing the leaf measurements.
Forests 15 00057 g001
Figure 2. Statistical comparisons of the β0 and β1 coefficients of the power models (Y = β0(x)β1 using the calibration for rainy (open symbols) and dry (closed symbols) season data sets. Vertical bars represent the 99% confidence intervals for βs coefficient means.
Forests 15 00057 g002
Figure 3. The relationship between the estimated leaf area and leaf dimensions (L, length and W, width) for two Thevetia peruviana samples (rainy, blue; dry, red) and a linear (green) model. The estimated differences are shown in the inset. An arrow indicates an underestimated or down-estimated leaf area, mainly in small leaves, using the linear model.
Forests 15 00057 g003
Figure 4. The deviation of the estimated leaf area from the measured leaf area (True) for individual leaves of Thevetia peruviana was estimated using the models in which β0 and β1 are coefficients. Vertical bars denote means with spreads denoting 99% confidence intervals (distribution of the t-test). For details of the equation numbers, see Table 3. The asterisks (*) denote biased equations.
Forests 15 00057 g004
Figure 5. Regression curves using the linear leaf dimensions: width ((A) equation #2; (B) equation #3), length ((C) equation #5; (D) equation #6), and the product of the leaf width and leaf length ((E) equation #8, (F) equation #9) for estimating the true leaf area in Thevetia peruviana. The dispersion of residuals for each respective model is shown in the insets. The red polygon area denotes the region with higher concentration of biased data causing an overestimation (A,C) or underestimation (B) of Thevetia peruviana leaves. In (DF), the overestimation or underestimation is less than 1%, which is within the parameters to approve the estimated leaf area equation. All graphs were generated with 1600 independent leaves from Thevetia peruviana.
Forests 15 00057 g005
Figure 6. The relationship between the measured leaf area and estimated leaf area for Thevetia peruviana leaves. The leaf area was estimated in accordance with equations #2 (A), #6 (B), #8 (C), and #9 (D). For more details on these equations, see Table 3. The red line represents the 1:1 relationship. n = 200.
Forests 15 00057 g006
Table 1. Mean ± standard deviation (SD), minimum (Min), and maximum (Max) values for the leaf length and width and leaf area of 800 or 1600 independent Thevetia peruviana leaves.
Samples Leaf Length (cm)Leaf Width (cm)Leaf Length × Width (cm2)Leaf Length × Width RatioLeaf Area (cm)
MinMaxMinMaxMinMaxMinMaxMinMax
Rainy9.16 ± 2.251.1013.770.74 ± 0.190.061.187.09 ± 2.970.1315.6712.65 ± 2.265.0238.995.72 ± 2.310.1412.36
Dry9.24 ± 2.261.3314.080.72 ± 0.200.081.297.05 ± 3.040.1316.5313.16 ± 2.707.1333.87 5.68 ± 2.340.1112.89
Both9.20 ± 2.261.1014.080.73 ± 0.190.061.297.07 ± 3.010.1316.5312.90 ± 2.505.0238.995.70 ± 2.330.1112.89
Table 2. Variance analysis for linear models (Y = β0 + β1X), where X is the LW product, using the set of leaves adjustment of the three distinct Thevetia peruviana samples (rainy, dry, both) (n = 1800). The dependent and independent variables underwent log-transformation as part of the analysis, aligning with suggestions from Zuur et al. [26] for statistically standardizing the data to mitigate variance. SV, source variation; DF, degrees of freedom; SS, sum of squares; MQ, mean squares.
SVDFSSMQFcalc
Parameters3.000913.811-
Reduction (βs)1.000913.802-
Reduction (H0)2.0000.0090.0050.074
Residual1797.000115.5690.064
Total1800.0001029.380
F0.01 = (2; 1797) = 4.618.
Table 3. Statistical models, regression coefficients (β0 and β1), standard errors of estimates (SE), mean square error (MSres), coefficients of determination adjusted for the degrees of freedom (Ra2), calculated F (Fcalc), and the proposed equations estimate the leaf area of Thevetia peruviana leaves as a function of the linear dimensions of leaves (length, L, and width, W).
EquationModelCoefficientsSEMSresRa2FcalcEstimator
Numberβ0β1
# 1 Y ^ = β 1 × W + ε i ---8.0251.0861.1790.96851,513.588LA = 8.025 × (W)
# 2 Y ^ = β 0 + β 1 × W + ε i 2.36311.0500.9000.8100.8509396.222LA = −2.363 + 11.050 × (W)
# 3 Y ^ = β 0 × W β 1 + ε i 8.9311.5100.8780.7710.8589960.266LA = 8.931 × (W)1.510
# 4 Y ^ = β 1 × L + ε i ---0.6391.1141.2410.96748,870.145LA = 0.639 × (L)
# 5 Y ^ = β 0 + β 1 × L + ε i −3.1810.9660.8170.6670.87711,775.236LA = −3.181 + 0.966 × (L)
# 6 Y ^ = β 0 × L β 1 + ε i   0.0981.8120.7300.5330.90215,145.687LA = 0.098 × (L)1.812
# 7 Y ^ = β 1 × L W + ε i ---0.8000.3520.1240.996505,248.150LA = 0.800 × (LW)
# 8 Y ^ = β 0 + β 1 × L W + e i 0.2840.7660.3340.1110.99778,688.275LA = 0.284 + 0.766 × (LW)
# 9 Y ^ = β 0 × L W β 1 + ε i 0.9140.9390.3310.1090.99880,236.492LA = 0.914 × (LW)0.939
Table 4. Model, equation, root mean square error (RMSE), and Akaike (AIC) criteria.
ModelEquationRMSEAIC
Y = β0 + β1 × LW + εiŶ = 0.284 + 0.766 × (LW)0.4292764.085
Y = β0 × LWβ1 + εiŶ = 0.914 × (LW)0.9390.4252764.742
Disclaimer/Publisher’s Note: The statements, opinions and data contained in all publications are solely those of the individual author(s) and contributor(s) and not of MDPI and/or the editor(s). MDPI and/or the editor(s) disclaim responsibility for any injury to people or property resulting from any ideas, methods, instructions or products referred to in the content.

