Article

Multifunctional Evaluation of Spruce–Fir Forest Based on Different Thinning Intensities

1
College of Forestry, Beijing Forestry University, Beijing 100083, China
2
School of Economics and Management, Beijing Forestry University, Beijing 100083, China
3
Wang Qing Forestry Bureau of Jilin Province, Yanbian133200, China
4
Forestry Affairs Center of Tianjin Planning and Natural Resources Bureau, Tianjin 300042, China
5
State Key Laboratory of Efficient Production of Forest Resources, Beijing Forestry University, Beijing 100083, China
*
Author to whom correspondence should be addressed.
Forests 2024, 15(10), 1703; https://doi.org/10.3390/f15101703
Submission received: 16 August 2024 / Revised: 13 September 2024 / Accepted: 24 September 2024 / Published: 26 September 2024
(This article belongs to the Section Forest Ecology and Management)

Abstract

:
Evaluating the performance of multifunctionality is a necessary foundation for forest multifunctionality management. This study aims to comprehensively adopt multiple methods to construct a multifunctional evaluation system for natural spruce–fir forests and explore the impact of thinning intensity on the multifunctional management effect of spruce–fir. This article combines subjective and objective evaluation methods and selects three methods to construct an evaluation system: the Analytic Hierarchy Process, the combined entropy weight method, and the CRITIC method. The results showed that the consistency of the three evaluation methods is good, and according to the score based on the evaluation results, the multifunctional performance of the sample plot with a thinning intensity of 20% (average score of AHP method is 75.5; EWM is 91; CRITIC is 96.5) is significantly better than that of the sample plot with a thinning intensity of 40% (AHP is 65.3; EWM is 51; CRITIC is 48), both of which were significantly better than those of the untreated sample plot (AHP is 12.7; EWM is 18.7; CRITIC is 17.3). A coupling relationship model between multifunctional values and different functions, as well as a coupling relationship model between different functions and various indicators, were constructed based on the evaluation system. Finally, the forest stand with the highest multifunctional comprehensive value was selected as the reference for the target structure to construct the target structure system, which is convenient for actual management. This study found that there is a nurturing intensity (20%) that can best utilize the multiple functions of forests, which has practical significance for promoting forest multifunctionality in forest management. In addition, this study scientifically constructed and compared several evaluation systems for the multifunctional performance of forests, laying a certain foundation for forest multifunctional evaluation and future forest multifunctional management.

1. Introduction

The role of thinning has long been a focal point in forest management [1,2,3], exerting a significant impact on forests, from the growth rate and quality of individual trees and stands [4,5,6,7], to the optimization of internal spatial structure [8,9], the restoration capacity of forest ecosystems [10], the maintenance of biodiversity [11], and the effective functioning of various forest roles [12]. Through regular thinning and management, it is possible to enhance the yield and quality of timber as well as carbon storage [13], meeting the demand for timber and improving economic benefits. It can also promote the carbon sequestration of litter and soil [14,15], affecting the carbon sink function of forests. Moderate thinning helps to maintain forest health, promote tree growth, prevent the spread of diseases and pests, and improve forest health [16,17], as well as contribute to water conservation [18,19], improve water resource management, and reduce soil erosion. Additionally, the intensity of thinning has a certain impact on the species richness of wild animals and plants [20,21], that is, on the function of biodiversity [22,23]. Overall, research on the impact of thinning intensity on stands has mostly focused on its effects on stand structure and some functions, with relatively scarce research on the overall impact of thinning on the multifunctionality of stands.
Multifunctional management is one of the main research hotspots in forest management. Many aspects of forest management, including the management of forest fires, are closely related to the multifunctionality of forests [24]. In the practice of multifunctional management, many scholars have divided the target functions and dominant functions of forest management differently according to the specific conditions of the forest. For example, Li Fang [25] and others conducted research on Pinus massoniana forests in southern Jiangxi, clearly dividing its functions into several aspects such as biodiversity conservation, carbon sequestration, water conservation, and timber production. Zhang [26] mainly considered the water and soil conservation function, water source conservation function, and the timber function of the forest, and conducted evaluations. Wei [27] divided the functions of the forests in the Jiangle State-owned Forest Farm into water and soil conservation, scenic recreation, windbreak and sand fixation, timber production, etc. More scholars focus on in-depth research on specific functions of forests, such as the evaluation of forest water conservation function [28,29], biodiversity evaluation [7,13], forest productivity evaluation, ecological tourism function evaluation, carbon sequestration and oxygen release function evaluation [30], etc. In recent years, more researchers have begun to consider the carbon sink function of forests [31,32] and have conducted research on the carbon sink function of different forests [33,34,35,36,37,38,39,40]. In addition, many other forest functions have also been extensively studied, such as water conservation function [41,42,43,44,45,46,47,48], biodiversity protection function [49,50,51,52], forest recreation function [53,54], landscape quality [55], and so on.
Comprehensive evaluation is the process of judging the value or superiority of things based on standards. This involves multiple complex and abstract standards; hence, it is also known as multi-indicator or multi-attribute comprehensive evaluation, which is more persuasive due to its comprehensiveness [56,57,58]. The classification of comprehensive evaluation is becoming increasingly diverse, with the advancement of technology and the development of disciplines, including both qualitative and quantitative evaluations [56,57]. Qualitative evaluation relies on expert experience and subjective judgment, such as the Delphi method, direct scoring method, expert meeting method, etc., which analyze and evaluate the characteristics of the object through description and assessment. Quantitative evaluation, on the other hand, uses mathematical tools and data analysis methods to process structured and unstructured data information, such as the entropy weight method, the CRITIC method, the fuzzy mathematics method, etc.
Evaluating forest multifunctionality is essential for multifunctional management, and indicators are the foundation of evaluation. For indicators, in the research of multifunctional evaluation, the number of considered indicators has shown a clear increasing trend, and the requirements for the accuracy and rationality of indicators are also increasing. Also, the determination of indicator weights increasingly demands precision and effectiveness. The previously rough selection of indicators and weight distribution often led to various problems in practice, resulting in unreasonable and difficult-to-apply evaluation results. In terms of evaluation methods, in recent years, more evaluations are using newer evaluation methods, such as using artificial neural networks for evaluation, etc. Even though these methods may have high accuracy, they often come with some more difficult-to-achieve conditions, such as the quantity and quality of raw data, etc. Some scholars [59] view forest management from the perspective of complex systems science. More people are using a combination of several methods [60,61] for indicator selection, weight determination, and the division of relationships between indicators, or directly using different comprehensive evaluation methods, summarizing and analyzing the results to obtain a better overall evaluation result. It is not difficult to obtain a scientifically reasonable result using the multi-method combination approach, but there are still many problems in the actual application process, especially in the selection and balance of methods. In general, we need to study the evaluation of forest multifunctionality as a complex system, considering its hierarchy and uncertainty, and choose suitable methods to fully evaluate the multifunctionality of forests [60].
In summary, the current research on thinning and multifunctional evaluation of forests has the following problems:
There is a lack of research on the impact of thinning on the multifunctionality of natural forests. Most of the current research is limited to the impact of thinning on stand structure, and there is little research on its management effects on the multifunctionality of forests. It is not comprehensive but focuses on the research of a certain forest function, neglecting the research on other functions, which lacks comprehensiveness and integrity.
Another question is that different evaluation methods have corresponding advantages and disadvantages, and the evaluation results may be influenced by the chosen method. The Analytic Hierarchy Process (AHP) is suitable for solving complex and multi-level problems, but the weight of indicators rely on expert scoring, which has a certain degree of subjectivity. The entropy weight method (EWM) relies on data to obtain weights, but the weights depend entirely on the variance of the data. Whether they are equivalent in importance still needs to be demonstrated. Therefore, when conducting evaluations, on the one hand, it is necessary to solve the complex problem of evaluation, and on the other hand, to reduce the problem of errors caused by evaluation methods.
This study focuses on the natural spruce–fir forests of the Jingouling Forest Farm, conducting a survey of nine representative plots within the research area. This study mainly relies on data from the autumn survey in 2023 and integrates data from the 1990s to the present to observe the impact of nurturing on the multifunctional performance of forests more than 30 years later. The main research contents are as follows:
(1)
Analysis of the basic characteristics of spruce–fir stands under different thinning intensities
Through the establishment of nine representative plots within the research area, a thorough and detailed field survey is conducted. This study focuses on dissecting the characteristics and differences in spruce–fir stands under three different thinning intensities: light (0% thinning intensity), moderate (20%), and heavy (40%). The aim is to reflect the basic situation of the forest stand and provide a scientific basis for the subsequent selection of evaluation indicators that can accurately reflect the multifunctional characteristics of spruce–fir forests.
(2)
Construction of a multifunctional evaluation system for spruce–fir forests in the Jingouling Forest Farm
Taking into full consideration the socioeconomic needs (needs of local community or stakeholder) and unique ecological environment of the Jingouling Experimental Forest Farm, and analyzing the survey data as well as referring to previous research [62,63,64], we first use AHP to determine the structure and confirm the dominant functions of spruce–fir forests, including biodiversity conservation, carbon sequestration, water conservation, and social services. Then we selected factors, which closely related to the multifunctional attributes of spruce–fir forests, as evaluation indicators to be included in the evaluation system. Finally, we used different methods (AHP, EWM, and CRITIC) to construct evaluation systems, and we compared the evaluation results and observed the impact of the evaluation methods on the evaluation results.
(3)
Multifunctionality evaluation of spruce–fir forests in the Jingouling Forest Farm
With the help of the aforementioned multifunctionality evaluation system for spruce–fir forests, we conducted a detailed evaluation of spruce–fir forests under different thinning intensities. We substituted the corresponding data from each evaluation indicator into the calculation to obtain the values of each function, and we calculated the multifunctional value. Then, we analyzed the multifunctional performance of spruce–fir forests under different thinning intensities.
This study determines whether thinning intensity has an impact on the multifunctional performance of spruce forests and, if there is an impact, the optimal thinning intensity and the result of the impact. In addition, we constructed a scientific multifunctional evaluation system to provide guidance for the management of natural spruce–fir forests and lay the foundation for the evaluation of the multifunction of forests. We expect that the results of this study can serve as an important reference for the multifunctional management practices of spruce–fir forests, as spruce–fir forests are mainly distributed in temperate regions and transition vertically to mountainous areas [65] with similar climatic conditions and growth patterns. Of course, the functions of spruce–fir forests in different regions may vary. For example, spruce forests in Maine, USA may focus more on economic functions [66], while those in Khabarovsk Krai may focus more on biodiversity conservation functions [67], which may differ according to the specific ecological, social, and economic conditions of the forest, but the basic principles are the same. In addition, the evaluation method and verification of the evaluation results in this article can serve as a good reference for the evaluation of forest multifunctionality.

2. Materials and Methods
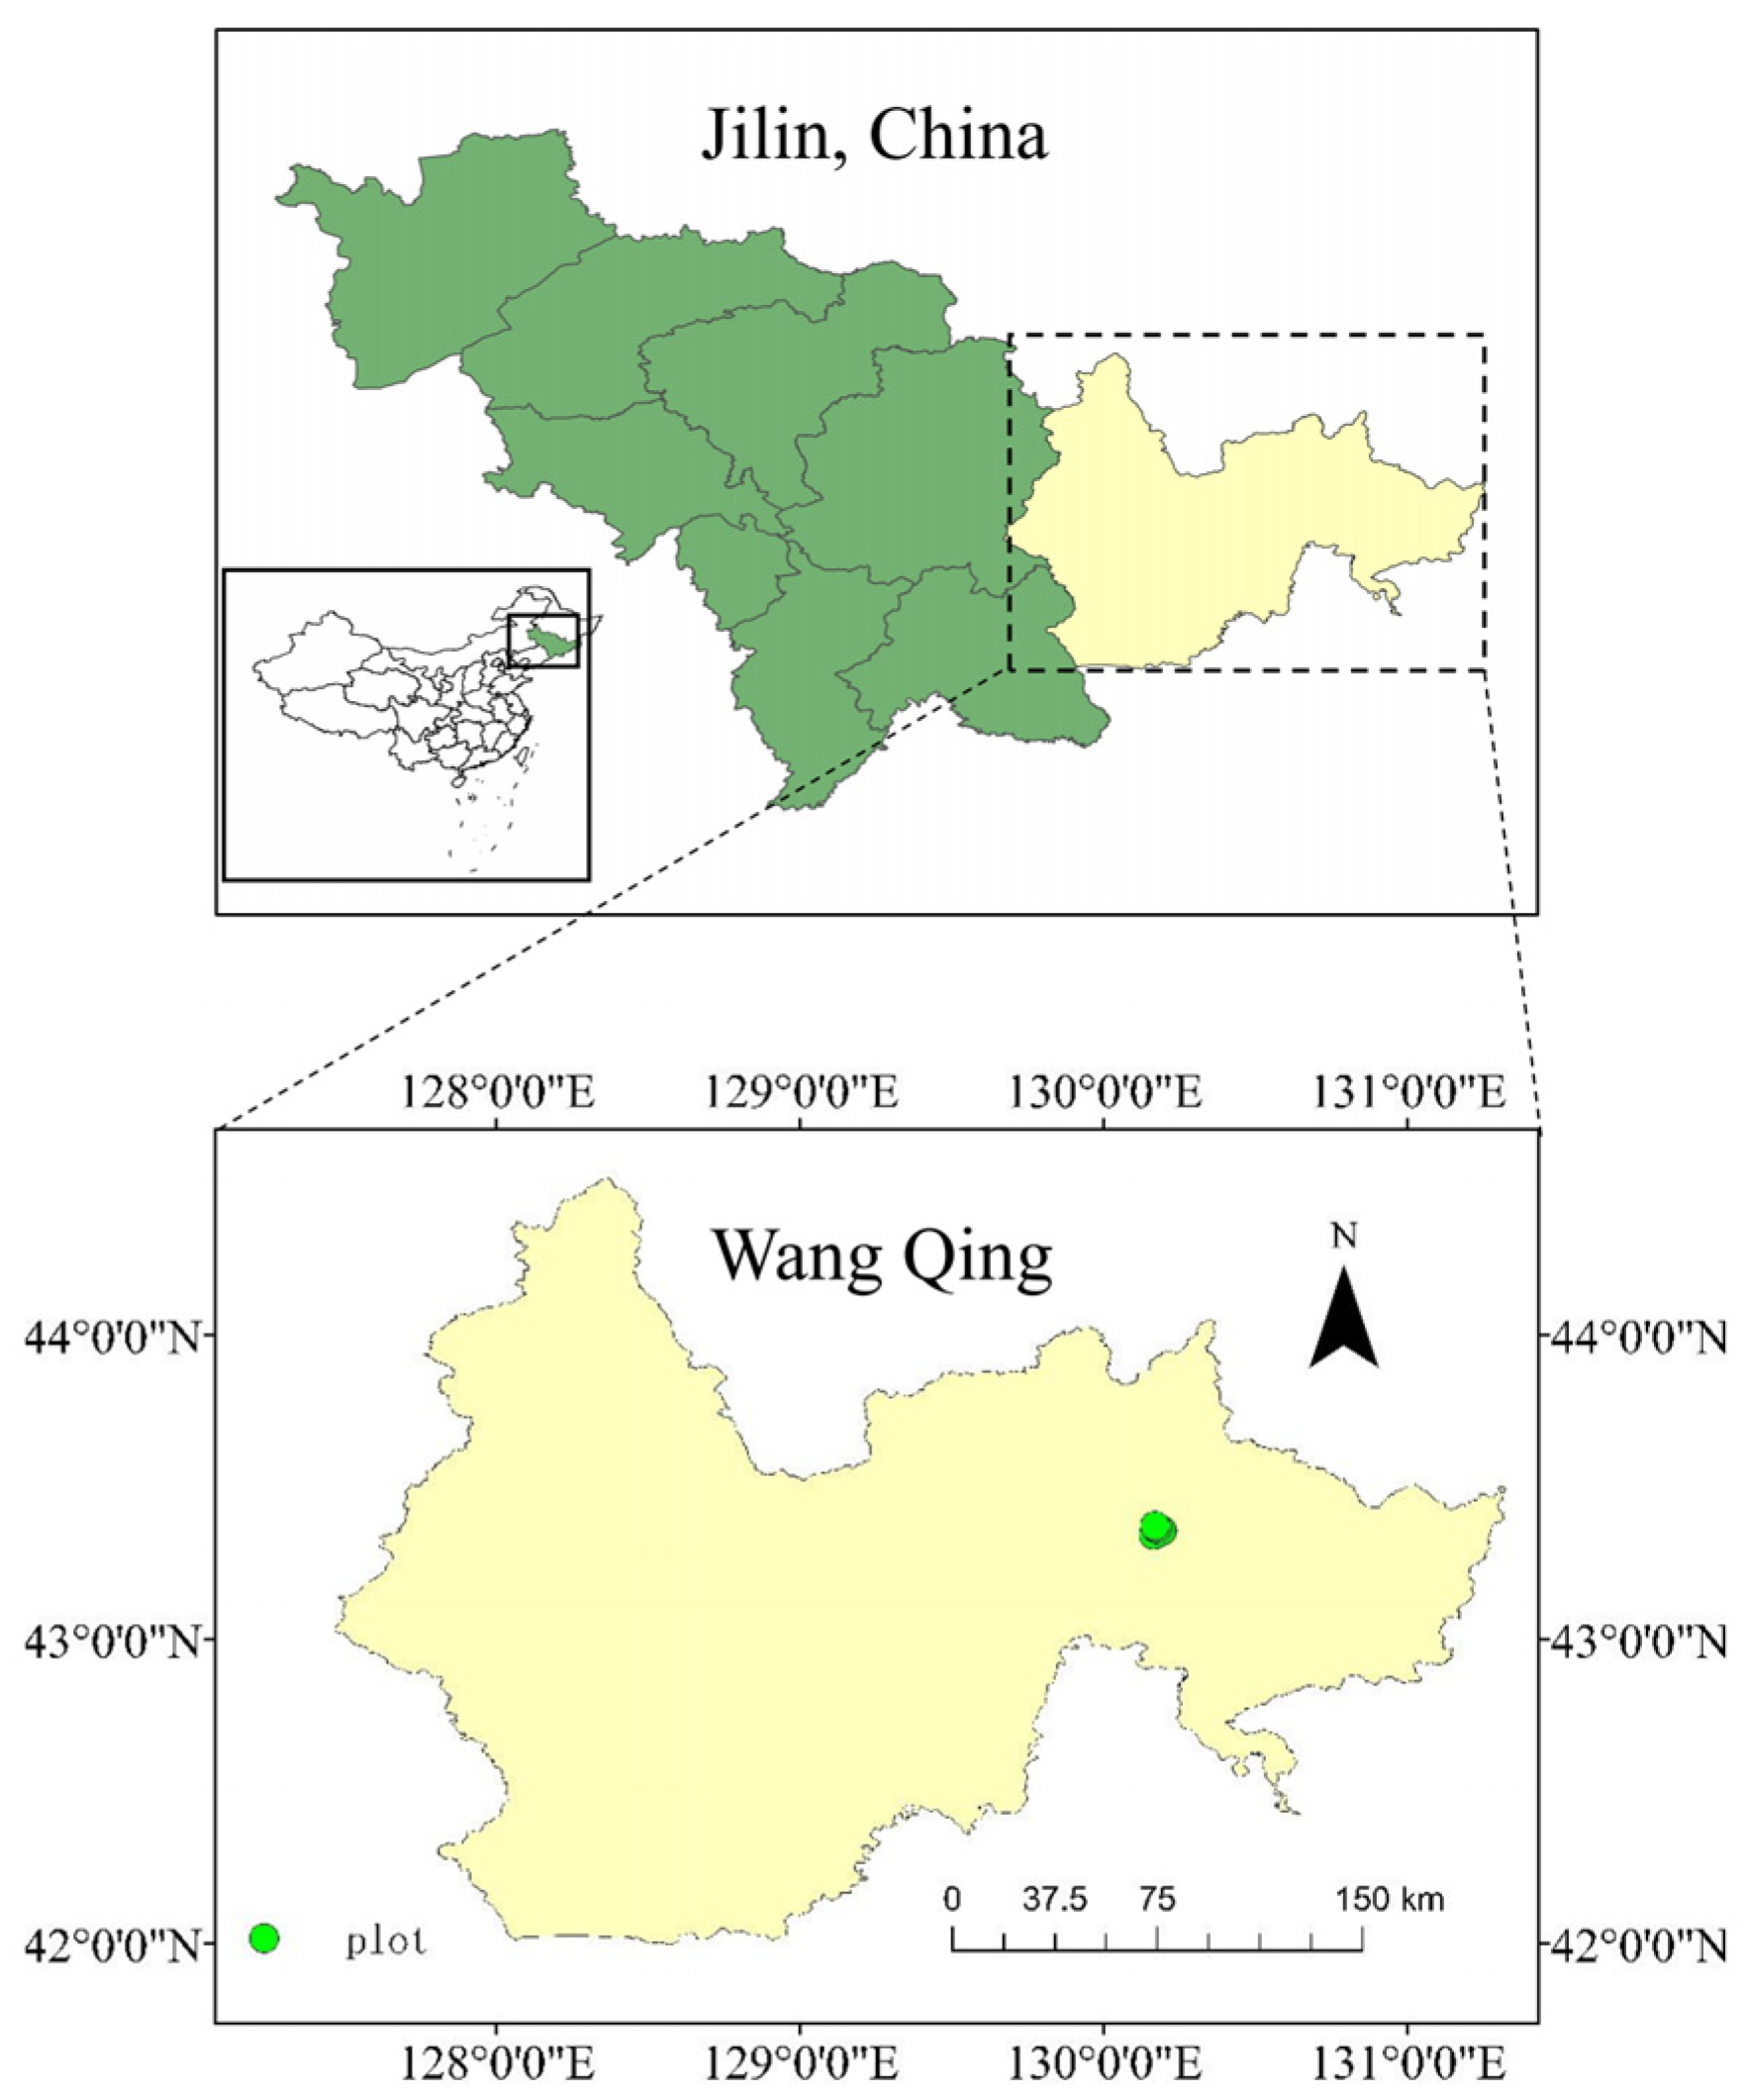
2.1. Study Area

The study area is located in the Jingoulin Experimental Forest Farm in Wangqing County, Jilin Province, with geographical coordinates ranging from 129°56′ E to 130°04′ E and 43°05′ N to 48°40′ N. The forest farm manages a total forest area of 16,286 hectares. Figure 1.
The region has a temperate continental monsoon climate, deeply influenced by the East Asian monsoon system, characterized by distinct four seasons with cold and dry winters. The topographical features are prominently low mountain and hilly terrain with an appropriate undulation in the landscape. The elevation ranges from 550 to 1100 m, surrounded by rolling hills and mountains, and the interior consists of open valley plains forming a low mountain and hilly basin. The terrain is relatively steep, while the shaded slopes, receiving less direct sunlight, experience relatively less surface erosion and weathering, and the slopes are generally gentler with a gradient ranging between 10 and 25 degrees. The soil in this area is typical of the middle and low mountain podzol and grey-brown forest soil zones. The forest coverage rate of the area is as high as 97.37%, demonstrating a good ecological environment foundation, with an average stand volume of 216 cubic meters per hectare. The total forest area exceeds 15,000 hectares, with a total stock volume of over two million cubic meters. The study area is also rich in wild economic plant resources, including 541 species from 92 families, especially in the category of mountain vegetables, which encompasses 44 different varieties from 25 families [68].

2.2. Research Methods

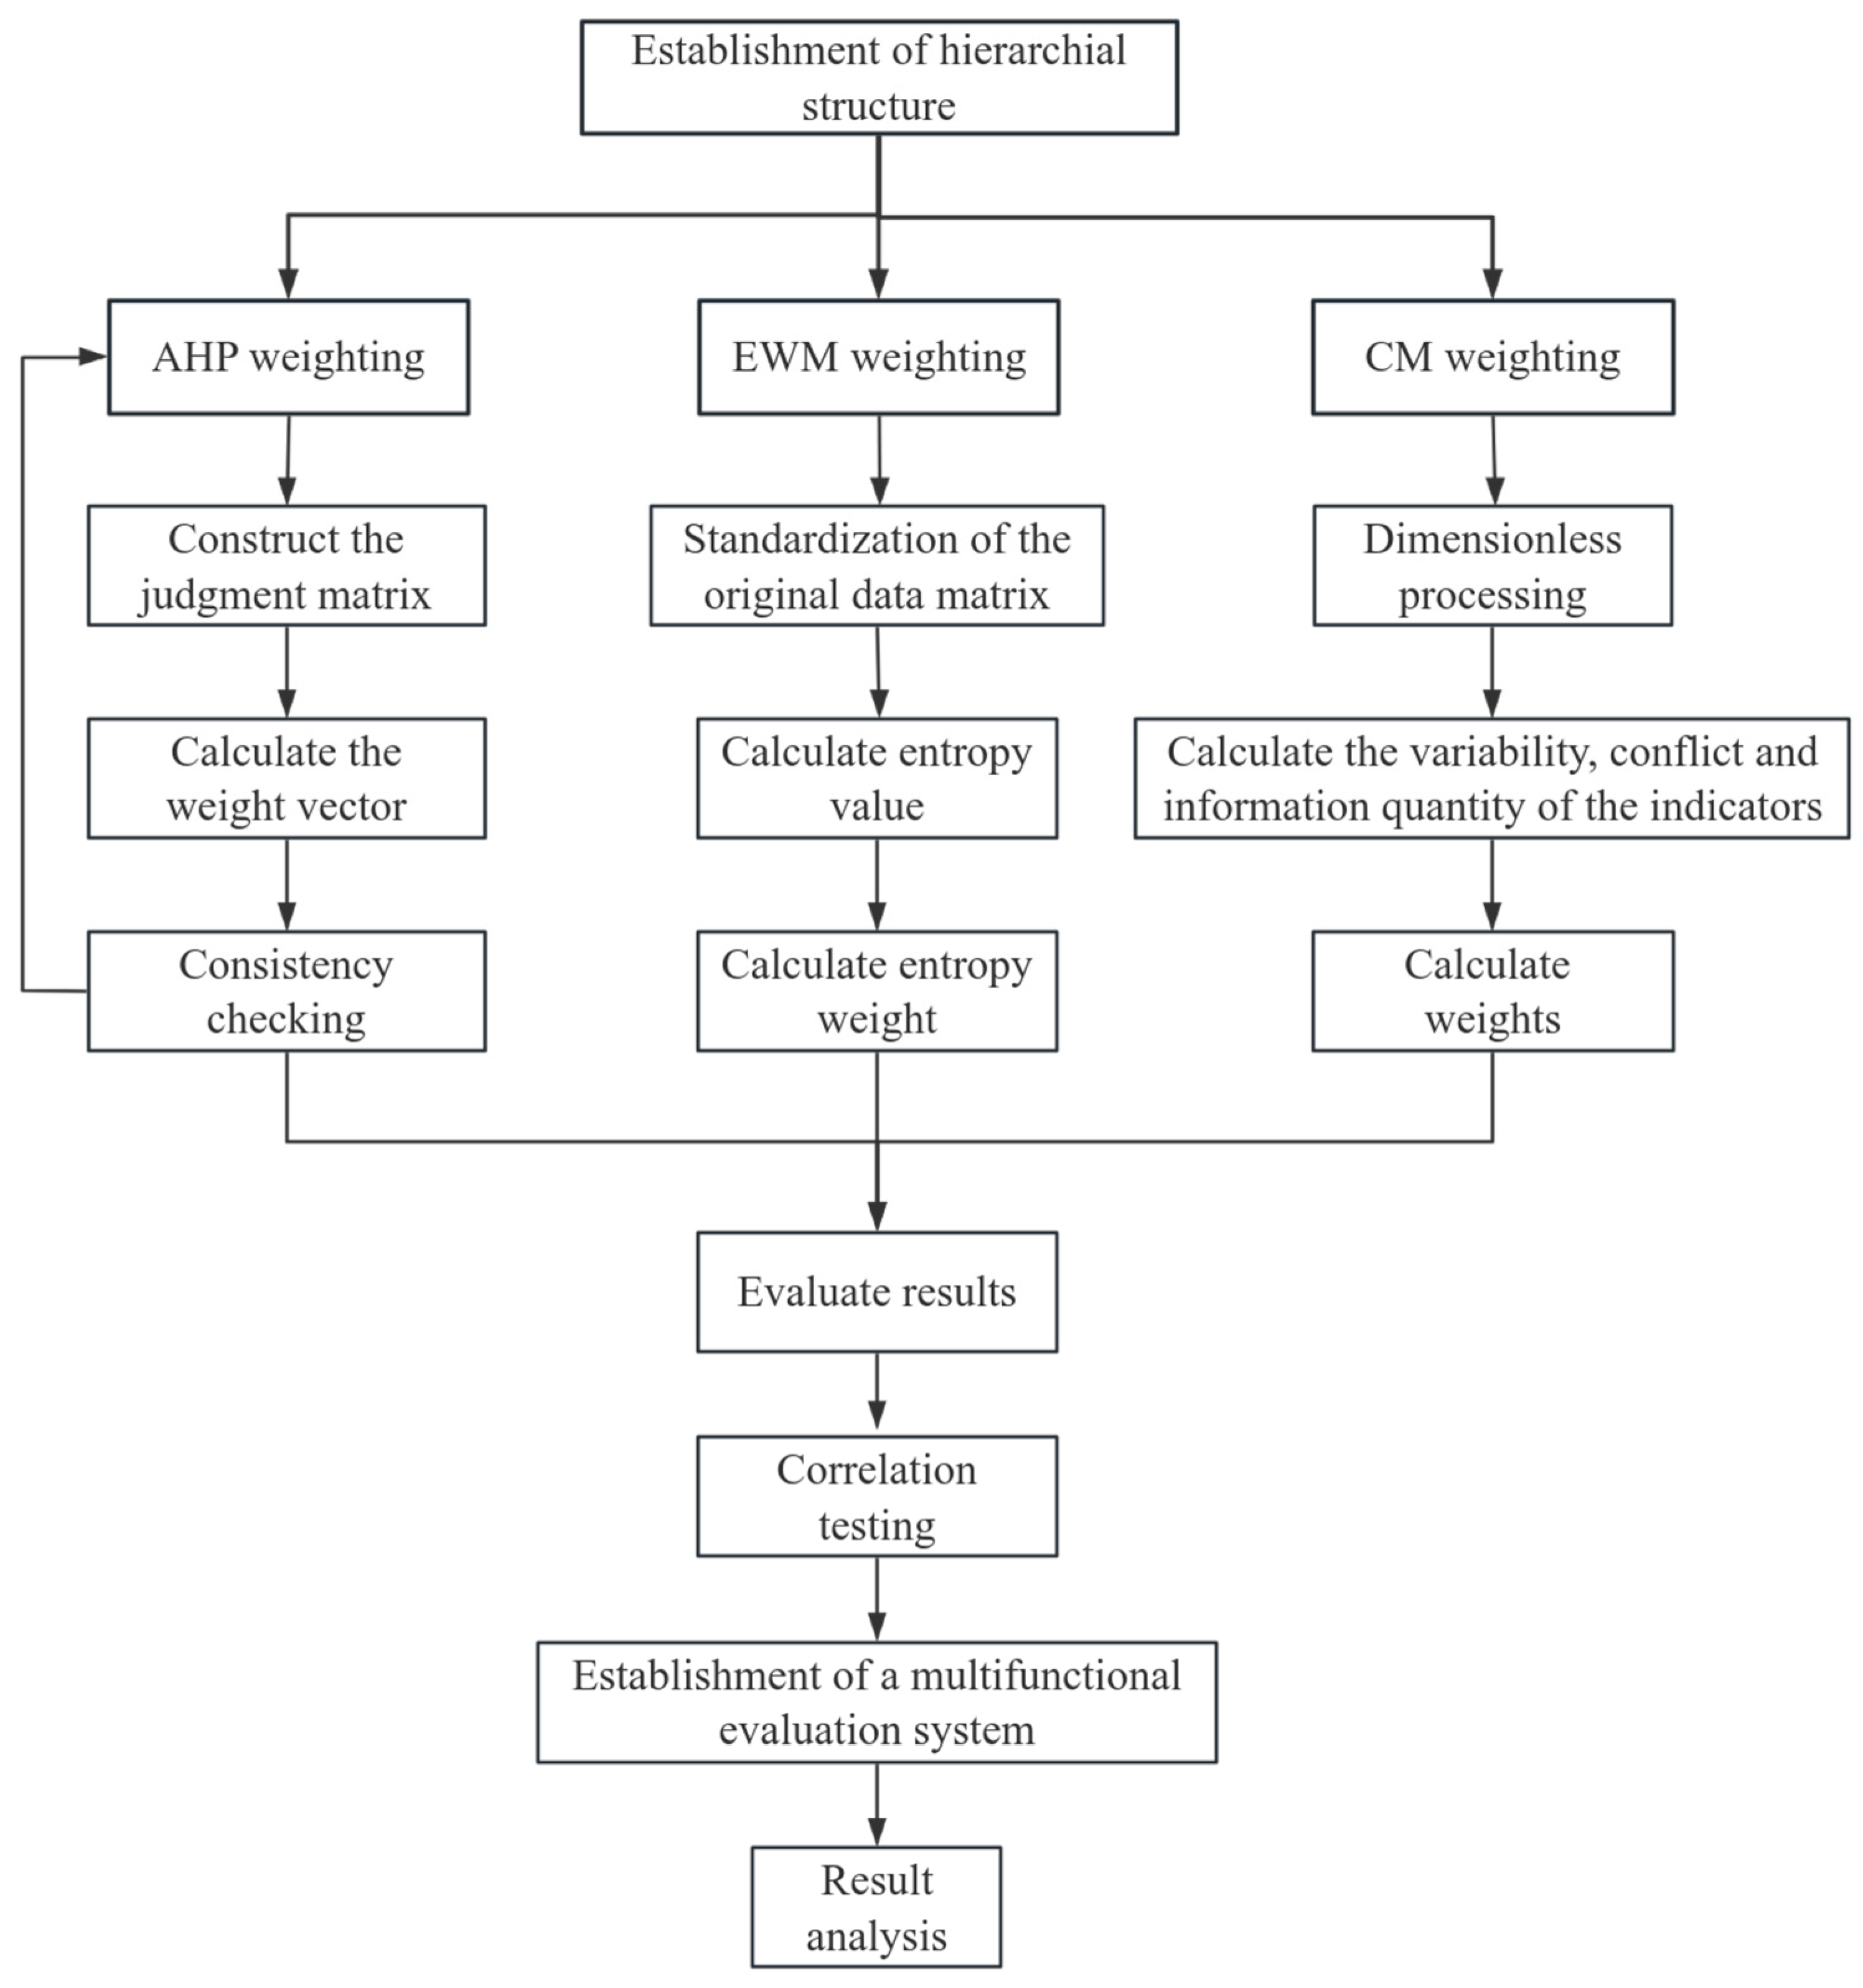
2.2.1. Evaluation Method

For the multifunctionality evaluation system of spruce–fir forests based on thinning, since the evaluation objectives need to comprehensively cover various functions and the relationships among these functions are complex, when evaluating the multifunctionality of forests, we have to divide them into several parts, that is, evaluate different functions. Therefore, we must use the Analytic Hierarchy Process (AHP) method. AHP is a method proposed by Saaty in the United States to overcome the shortcomings of sorting complex problems and traditional subjective weighting. This method decomposes the objective of the evaluation object into several consecutive parts, determines the weights of each sub-objective layer by pairwise comparison, and uses the combined weights of the lowest-level objectives to determine the weights [69,70,71]. The comprehensive index is calculated by weighting, and the achievement of the objective is evaluated based on the size of the comprehensive index. It is applicable when the overall goal is uncertain, and the decomposition levels of each goal are moderate. This method determines weights in layers and calculates the comprehensive index by combining weights, reducing the bias of traditional subjective weighting and objectively testing the consistency of thinking standards. It is often used in conjunction with other evaluation methods to improve the accuracy and credibility of evaluations. In this study, the hierarchical structure constructed using AHP is the foundation of the evaluation system [72].
The entropy weight method (EWM) [70] is an objective weighting method that calculates the entropy weight of each indicator based on the degree of dispersion of data and then modifies the entropy weight according to each indicator to obtain a more objective indicator weight. It helps decision-makers make more accurate and fair comprehensive evaluations and decisions by scientifically determining the weights of each evaluation indicator [73]. In the evaluation of forest multifunctionality, the entropy weight method can assist in analyzing the contribution of various functional indicators to the overall multi-function of the forest. EWM provides an objective weighting method based on the entropy of data, avoiding the uncertainty that comes from relying only on subjective judgment.
The CRITIC method (CM) is an objective weighting method proposed by Diakoulaki and used to determine the weights of evaluation indicators in a multi-indicator comprehensive assessment system [74]. This method calculates the importance of each indicator based on the indicator’s variability (contrast intensity) and the inter-indicator correlation (conflict) [75]. The CM also overcomes the limitations of weighting methods that only rely on expert experience or simple statistical indicators, providing a more scientific and objective approach to determining the weights of evaluation indicators.
In this study, due to the complexity of the evaluation object (forest multifunctionality), we first used the Analytic Hierarchy Process (AHP) to divide it into several levels and construct the basic structure. Then we used subjective AHP weighting, objective entropy weighting, and CRITIC weighting to obtain the three evaluation results. We observed the differences in the evaluation results of the three methods and tested their consistency. Based on the evaluation results, we analyzed the impact of thinning intensity on the multifunctionality of the forest.
Figure 2 shows the application process of three evaluation methods. Firstly, we follow the principles of scientific nature, systematicity, applicability, and feasibility. Based on the ecological, economic, and social needs of the forest farm, and combined with previous research [62,63,64,76], we divide the multifunctionality of forests into several functions and select appropriate, relevant indicators to construct a hierarchical structure. Then we calculate the weights using the AHP, EWM, and CRITIC methods.
  • AHP
    • Construct the judgment matrix;
We adopted an expert meeting method in the form of brainstorming. The attendees were 20 professors, scholars, some experts in the field from universities, and forest managers from the farm. They started from the second layer and compared the various indicators that affect the previous layer in pairs according to their importance (determined according to Santy’s 1–9 scale method), used aij to represent the importance level of the i-th indicator relative to the j-th indicator, and then formed a judgment matrix. Finally, they obtained the values in the judgment matrix and conducted consistency checks on the matrix. If there were inconsistencies, they discussed the weights again during this process.
    • Calculate the weight vector;
Let A = a i j n × n . If for any i, j, k = 1, 2…, n, the condition holds a i k = a i j × a i j , then A is called a consistent matrix, which can be expressed in the form of w i w j . If the judgment matrix satisfies all the above consistency conditions, the next step is to calculate the weight vector. For the judgment matrix, sum the elements of each row to obtain:
W i ~ = j = 1 n a i j           i = 1 , 2 , , n
Then normalize to obtain the weight vector:
W i ~ = i = 1 n a i j 1 n
    • Consistency checking
It is necessary to ensure that the degree of inconsistency is within an acceptable range. Therefore, a consistency check for the judgment matrix is required, with the following steps:
Consistency Index:
C . I . = λ m a x n 2 n 1
Confirm the corresponding average consistency index R.I. (Random Index) then calculate the Consistency Ratio C.R. and make a judgment:
C . R . = C . I . R . I .
If the C.R. is less than 0.1, the consistency of the judgment matrix is considered acceptable. Otherwise, it is necessary to make the necessary corrections to the judgment matrix.
2.
EWM
  • Standardizatin of the original data matrix
For the original data matrix containing ‘a’ evaluation indicators and ‘b’ evaluation objects:
X = x 11 x 1 b x a 1 x a b
Standardize it to obtain:
R = r i j a × b
rij” represents the standardized score of the evaluation object j on the indicator i, with its value range limited to between 0 and 1. For benefit indicators where a higher value indicates a better outcome, the standardization formula is as follows:
R i j = x i j x i j j m i n x i j j m a x x i j j m i n
Conversely, for cost indicators where a lower value is more favorable, the standardization formula is as follows:
R i j = x i j j m a x x i j x i j j m a x x i j j m i n
    • Calculate entropy value
In an evaluation system that includes ‘a’ evaluation indicators and ‘b’ evaluation subjects, the entropy for the i-th indicator is defined as follows:
H i = k j = 1 b f i j l n f i j ,       i = 1 , 2 , 3 , , a
In the formula, f i j = r i j j = 1 b r i j , k = 1 l n b , when fij = 0, set f i j l n f i j = 0
    • Calculate entropy weight
The entropy weight assigned to the i-th indicator is as follows:
W i = 1 H i a i = 1 a H i
In the formula, 0 ≤ W i ≤ 1.
3.
CM
  • Dimensionless processing
The linear proportional normalization method is used (see Section 3.2).
    • Calculate the variability, conflict, and information quantity of the indicators.
The variability of the indicators (Sj):
X j ¯ = 1 n i = 1 n x i j
S j = i = 1 n 1 x i j x j ¯ 2 n n 1
The conflicting indicators ( R j ):
R j = i = 1 p 1 r i j
rij represents the correlation coefficient between evaluation indicators i and j, which is used to quantify the degree of association between the two indicators.
Information quantity ( C j ):
C j = S j × R j
The larger the Cj, the greater the impact of the j-th evaluation indicator, and thus, a larger weight should be assigned.
    • Calculate weights ( W j ):
W j = C j j = 1 p C j
4.
Correlation Testing
The correlation comparison of several evaluation results can be calculated by converting them into a hierarchical order, and the consistency of the Fraser Kappa coefficient test can be tested:
k = P o P e 1 P e
Po is the proportion of consistent samples, and Pe is the proportion of accidental expected consistency calculated for inconsistent samples.
When the Kappa value falls within the range of 0.4 to 0.6, it indicates that the consistency is at a general level. If it is within the range of 0.6 to 0.8, it indicates strong consistency. If the value is between 0.8 and 1.0, it means that the consistency is extremely strong.

2.2.2. Data Collection Methods

  • Plot Layout
The locations of the plots are shown in Table 1. We have set almost identical standard plots in spruce–fir forests based on age, altitude, slope position, and aspect to ensure that only thinning intensity is used as a variable. We designed repeated and controlled experiments. There are nine plots in total, which were set up during the 1980s and 1990s with thinning intensities of 0%, 20%, and 40%, with three plots for each intensity level.
2.
Plot Survey
The plot survey includes the layout of the quadrats, all survey indicators, and calculated indicators as shown in Table 2. For trees, a complete forest inventory is conducted, recording species, tree height and diameter at breast height (DBH) of each tree, canopy density, dead trees, and trees with diseases and pests. Shrub surveys are conducted in 5 m × 5 m quadrats along the diagonal, investigating species and cover, height, fresh and dry weight, and water content of each plant. Herbaceous plant surveys are conducted by setting up five 1 m × 1 m quadrats within each shrub quadrat, totaling 25 small quadrats, with the same survey and measurement methods as for shrubs. Litter is sampled by dividing it into decomposed and semi-decomposed layers, and the fresh and dry weights are measured. Soil samples are taken from two soil profiles, each with a depth of 0.8 m, dug at the upper and lower parts of the plot, using a ring-knife and sealed plastic bags, with measurements taken for fresh and dry weight. For the obtained sample data, we extracted 20% for retesting, and the data consistency reached over 95%.

2.2.3. The Multiple Functions of Forests

The division of target and dominant functions of forest management is different based on the specific situation of the forest. For example, Li [25] classified the functions of Pinus massoniana forests into biodiversity conservation, carbon sequestration, water conservation, and wood production. In this study, we comprehensively considered the natural, economic, and social conditions of the forest in the region, and referred to previous research [76] in the area to divide the main functions of spruce–fir forests into biodiversity conservation functions, water conservation functions, carbon sink functions, and social service functions.
Biodiversity conservation [77] is an important task for maintaining various forms of life, ecosystems, and gene banks on Earth. Biodiversity encompasses species diversity, genetic diversity, and ecosystem diversity. The Changbai Mountain Forest Area has the most complete mountain vertical ecosystem in the temperate zone and is a world-renowned “natural museum” and “Species Gene Bank”. But long-term excessive logging has led to a sharp decline in species numbers, so the function of biodiversity conservation is very important for the forests in the region.
The water conservation function [78] refers to the preservation of water through relevant media within a certain time and space range and conditions, the process and ability to achieve water retention, long-term maintenance, supply and nourishment, and water regulation within the ecosystem. It is of great significance for maintaining the stability and sustainability of terrestrial ecosystems.
The forest carbon sink is the result of carbon cycling in forest ecosystems, which refers to the process in which forest plants absorb carbon dioxide from the atmosphere through photosynthesis and fix it in vegetation or soil, thereby reducing the concentration of this gas in the atmosphere [79], that is, engaging in carbon exchange with the outside world mainly based on CO2. Forest carbon sinks are the main body of terrestrial carbon sinks, playing a crucial role in reducing greenhouse gas concentrations in the atmosphere and mitigating global warming. They also play an important role in offsetting carbon emissions from fossil fuels [80].
Social service functions, in this study, mainly refer to forest recreation. Forest recreation [81] is the sum of all activities that people freely choose during their leisure time and engage in in forest environments with the main purpose of restoring physical strength and obtaining pleasure. As a national park, the forest landscape in this area is very beautiful, and its forest recreational value should be considered.

2.2.4. Obtaining and Calculating Indicators

1.
Functional indicators for biodiversity conservation
According to Lv’s [82] research, the biodiversity composite index refers to the comprehensive richness, evenness, and diversity used to describe species diversity. The value of the comprehensive index of species diversity is between 0 and 1, and the larger the value, the higher the level of species diversity in the community. In this study, the Shannon–Wiener index (H′), the Simpson index (Ds), and Pielou’s Evenness index (J) were selected accordingly, and the weights of the three indicators were assigned using the AHP method.
Shannon–Wiener Index:
H = p i ln p i
Simpson Index:
D s = 1 p i 2
Pielou’s Evenness Index:
J = p i ln p i ln S
In the formula, p i is the ratio of the number of individuals of the i-th species to the total number of individuals of all species. It represents the proportion of the i-th species in the sample. S is the total number of species found within the sample plot.
Biodiversity Composite Index:
B i o d i v e r s i t y   C o m p o s i t e   I n d e x = λ 1 H + λ 2 D s + λ 3 J λ 1 + λ 2 + λ 3
In this study, according to the results of the AHP method, λ1 = λ2 = λ3 = 0.333.
According to Chen’s [83] research, canopy closure has a significant impact on moss growth; therefore, we use canopy closure to reflect the diversity of plants such as moss. In this study, the canopy closure was determined using the grid method, which is determined based on the tree crown projection map drawn.
Based on previous research [76], northeast tigers and leopards tend to prefer coniferous and broad-leaved mixed forest habitats. Therefore, the needle-to-width ratio is also used as an indicator to reflect the function of biodiversity.
2.
Functional indicators for carbon sink function
We divide the carbon sink of forests into five layers from top to bottom, namely the carbon sink of trees, shrubs, herbs, litter, and soil. The sum of these five layers of carbon sink is the total carbon sink. We use the product of biomass and carbon content to calculate carbon sinks.
Tree biomass refers to long-term data collected by forest farms, and the carbon content is referenced from the research data of Wang [84,85,86] and others.
The biomass of shrubs, herbaceous plants, and soil, as well as litter, is determined based on the dry weight obtained from sampling. The carbon content is measured using the concentrated sulfuric acid–potassium dichromate titration method (Beijing Xinbaike Biotechnology Co., Ltd., Beijing, China).
3.
Functional indicators for water source conservation function
Considering that there is not much difference in crown height and there is overlap between tree crowns, we use cumulative crown width to reflect the amount of crown interception, which is the sum of the crown lengths of all trees.
We use the water content of shrubs, grasses, and litter to reflect their water conservation capacity, and we use the maximum soil water holding capacity to reflect the soil water content capacity. The water content of shrubs, herbaceous plants, soil, and litter is determined by measuring the fresh weight and dry weight, with the difference being the proportion of the fresh weight. The maximum water-holding capacity is measured after soaking, with continuous measurements over two days for litter. Soil is weighed after soaking for 12 h, then placed on dry sand for 2 h before being weighed again. Finally, the soil core is dried at 105 °C for 24 h and weighed.
4.
Functional indicators for social service function
When considering the social service function, we mainly consider its forest recreation function, forest landscape function, etc. Therefore, we have selected these three indicators to reflect the social service function:
The pest and disease rate is the proportion of trees infected with pests and diseases.
P e s t   a n d   D i s e a s e   R a t e = P e s t   a n d   D i s e a s e   A f f e c t e d   T r e e   C o u n t T o t a l   N u m b e r   o f   I n d i v i d u a l s
The mortality rate is the proportion of dead trees.
M o r t a l i t y   R a t e = D e a d   T r e e   C o u n t T o t a l   N u m b e r   o f   T r e e s
The wind reversal rate is the proportion of trees blown down by the wind. There are a large number of trees in the area that have been blown down by the wind, which is an important factor affecting the landscape.
W i n d   R e v e r s a l   R a t e = W i n d   R e v e r s a l   C o u n t T o t a l   N u m b e r   o f   T r e e s

2.2.5. Construction of a Multifunctional Evaluation Indicator System

1.
Principles for constructing an evaluation indicator system
When designing evaluation criteria for the multidimensional functionality of spruce–fir forests, the natural attributes of the spruce–fir forests, the social and economic conditions, and the foundations of the areas they are located in should be taken as guidance. Referring to previous research [62,63,64,76] on the evaluation of forest multifunctionality, the construction of an evaluation system must strictly adhere to the following principles: firstly, scientific rigor, ensuring that the forest multifunctional evaluation framework is built on a solid scientific foundation, with clear concepts of various indicators, accurately capturing the unique internal characteristics and manifestations of the object, and the calculation and statistical methods used must be precise and standardized. Secondly, it is systematic and aims to build a comprehensive, accurate, and structurally complete evaluation system, ensuring that it can broadly and deeply reflect the overall state of forest multifunctionality. Thirdly, it should be applicable and targeted. Given the diverse social and economic conditions and forest types in different regions, evaluation indicators should have regional adaptability and be selectively included in evaluation projects that best fit local conditions according to specific situations. Fourthly, it is feasible in practice. When selecting evaluation indicators, it is necessary to fully consider the practical implementation difficulties of data collection, organization, and analysis, ensuring a close integration of theory and practice. The selected indicators should make it easy to conduct on-site investigations, have verifiability, and be easy to implement.
2.
Selection of evaluation indicators
On the basis of research on forest demand and functional structure in the research area [62,63,64,76,87,88,89], this study selected as many relevant indicators as possible, and ultimately selected indicators such as tree layer carbon storage, litter layer carbon storage, shrub grass layer carbon storage, soil layer carbon storage, diversity index, canopy closure, needle width ratio, slope, crown width, shrub layer coverage, herbaceous layer coverage, soil water storage capacity (Soil Maximum Water-Holding Capacity), litter layer water storage capacity (Litter Water-Retention Capacity), mortality rate, pest and disease rate, and wind reversal rate, as shown on Table 3.
Slope, crown width, shrub layer coverage, herbaceous layer coverage, soil water storage capacity, litter layer water storage capacity, etc. directly reflect or affect water source conservation capacity. The carbon storage of the tree layer, shrub layer, litter layer, and soil layer directly reflect the carbon sink function. The social service functions mainly include ornamental value, air purification, forest health, and other values, and indicators such as mortality rate, pest and disease rate, and wind reversal rate are selected to reflect them. Due to the fact that large animals in Northeast China are more suitable for activity in coniferous and broad-leaved mixed forests, and their prey is mostly in shrubs and grasses, a comprehensive consideration of animals and plants is given. The biodiversity functional indicators are selected as diversity comprehensive index, canopy closure, and coniferous to broad-leaved ratio for research.
The results of the indicator survey are shown below. For most indicators, there is no significant difference in different thinning intensities. The shrub coverage, pest and disease rates, and windward deflection rates of untreated plots were significantly higher than those of other plots, while the canopy closure was significantly lower. The incidence of pests and diseases in plots with a thinning intensity of 20% is significantly lower than that of 40%, shown in Table 4.
3.
Quantification and standardization of evaluation indicators
We used a linear proportional normalization method. For a positive indicator, take the maximum value Xmax of the indicator, and then divide each observed value of the variable by the maximum value, which is:
X = X X m a x
For the inverse indicator, take the minimum value Xmin of the indicator, and then divide the minimum value of the variable by each observation value, which is:
X = X m i n X

2.2.6. Data Processing and Analysis

We used Excel for basic data statistics, calculations, and plotting. We used SPSS to conduct one-way ANOVA on the survey data and to construct a forest multifunctional correlation model.

2.3. Research Roadmap

This article takes spruce–fir forest plots with different thinning intensities as the research object. Firstly, the plots are surveyed to obtain indicators including herbs, shrubs, trees, soil, and litter. Using the AHP, EWM, and CM, multifunctional evaluation systems were established to evaluate the functions of forest biodiversity, water conservation, carbon sequestration, and social services. Based on the evaluation results, multifunctional evaluation conclusions can be drawn for spruce–fir forests with different thinning intensities, and comparative analysis can be conducted. Finally, based on the forest management objectives, appropriate adjustments should be made to the forest to improve its functional performance and efficiency. The entire process emphasizes the multifunctionality of forests, aiming to achieve sustainable management and utilization, as shown in Figure 3.

3. Results

3.1. Basic Conditions of the Sample Plot

Based on the data collected from field investigations, the basic statistical results of the nine sample plots are summarized in Table 5. Among these nine plots, plots A1–A3 are the control group, and no thinning measures have been implemented, with a thinning intensity of 0%. Samples B1–B3 were thinned with an intensity of 20%. The C1–C3 plots were thinned with an intensity of 40%. It should be noted that these thinning measures were carried out more than 30 years ago, and during these years, some trees that died due to disease or natural death were harvested and cleared in a timely fashion.
The specific geographical location and characteristics of each sample plot, as well as the basic data on forest growth, are shown in Table 5. The data show that the elevations of these nine plots are similar; they are concentrated between 650 and 750 m. Their slopes roughly face the north or northeast directions. All forest stands in the sample plots are in the middle-age forest stage. The slope positions are all downhill. The slope is distributed between 10° and 15°, which is categorized as a gentle slope. The canopy density is between 0.65 and 0.8, with the lowest being plots A2 and B3 at 0.65 and the highest being plot C2 at 0.8. The plant density fluctuates within the range of 620 to 1213 plants per hectare. The lowest plant density occurs in plot C3, with 620 plants per hectare, while the highest plant density occurs in plot B2, with 1213 plants per hectare. The difference between the maximum and minimum plant densities is nearly double. The average tree height varies between 11.8 m and 14.7 m. C2 has the smallest average tree height of 11.8 m, while B3 has the tallest average tree height of 14.7 m. The average diameter at breast height ranges from 9.57 cm to 12.71 cm, with the C2 plot having the smallest average diameter and the C3 plot having the largest average diameter. There are certain differences in the storage volume among different plots, ranging from 196 to 352 m3 per hectare. Among them, C1 has the lowest storage volume, while B2 has the highest storage volume. The difference between the two is also about twice, which is significant.
According to the results of the analysis of variance, different thinning intensities have a significant impact on plant density. Even after more than 30 years, the plant density of plots with 40% thinning intensity (C1–C3 plots) is still significantly lower than that of other plots. However, the effect of thinning intensity on average breast diameter, average tree height, canopy density, and stand volume is not significant. This means that although high-intensity thinning reduces plant density, it does not have a significant impact on the overall structure, health status, and accumulation of stand volume. Overall, for most forest stand indicators, the impact of thinning intensity is not actually significant after more than 30 years of minimal human interference.

3.2. Multifunctional Evaluation of Forests

According to the multifunctional evaluation index system, the scores of each function are obtained by substituting the normalized values of the indicators. In order to effectively classify the forest multifunctional comprehensive evaluation indices of various plots, we first need to standardize these indices as follows:
M i = F i F m i n F m a x F m i n × 100
According to the score, the multifunctional score is divided into three levels: poor, medium, and excellent. The specific division is shown in Table 6.

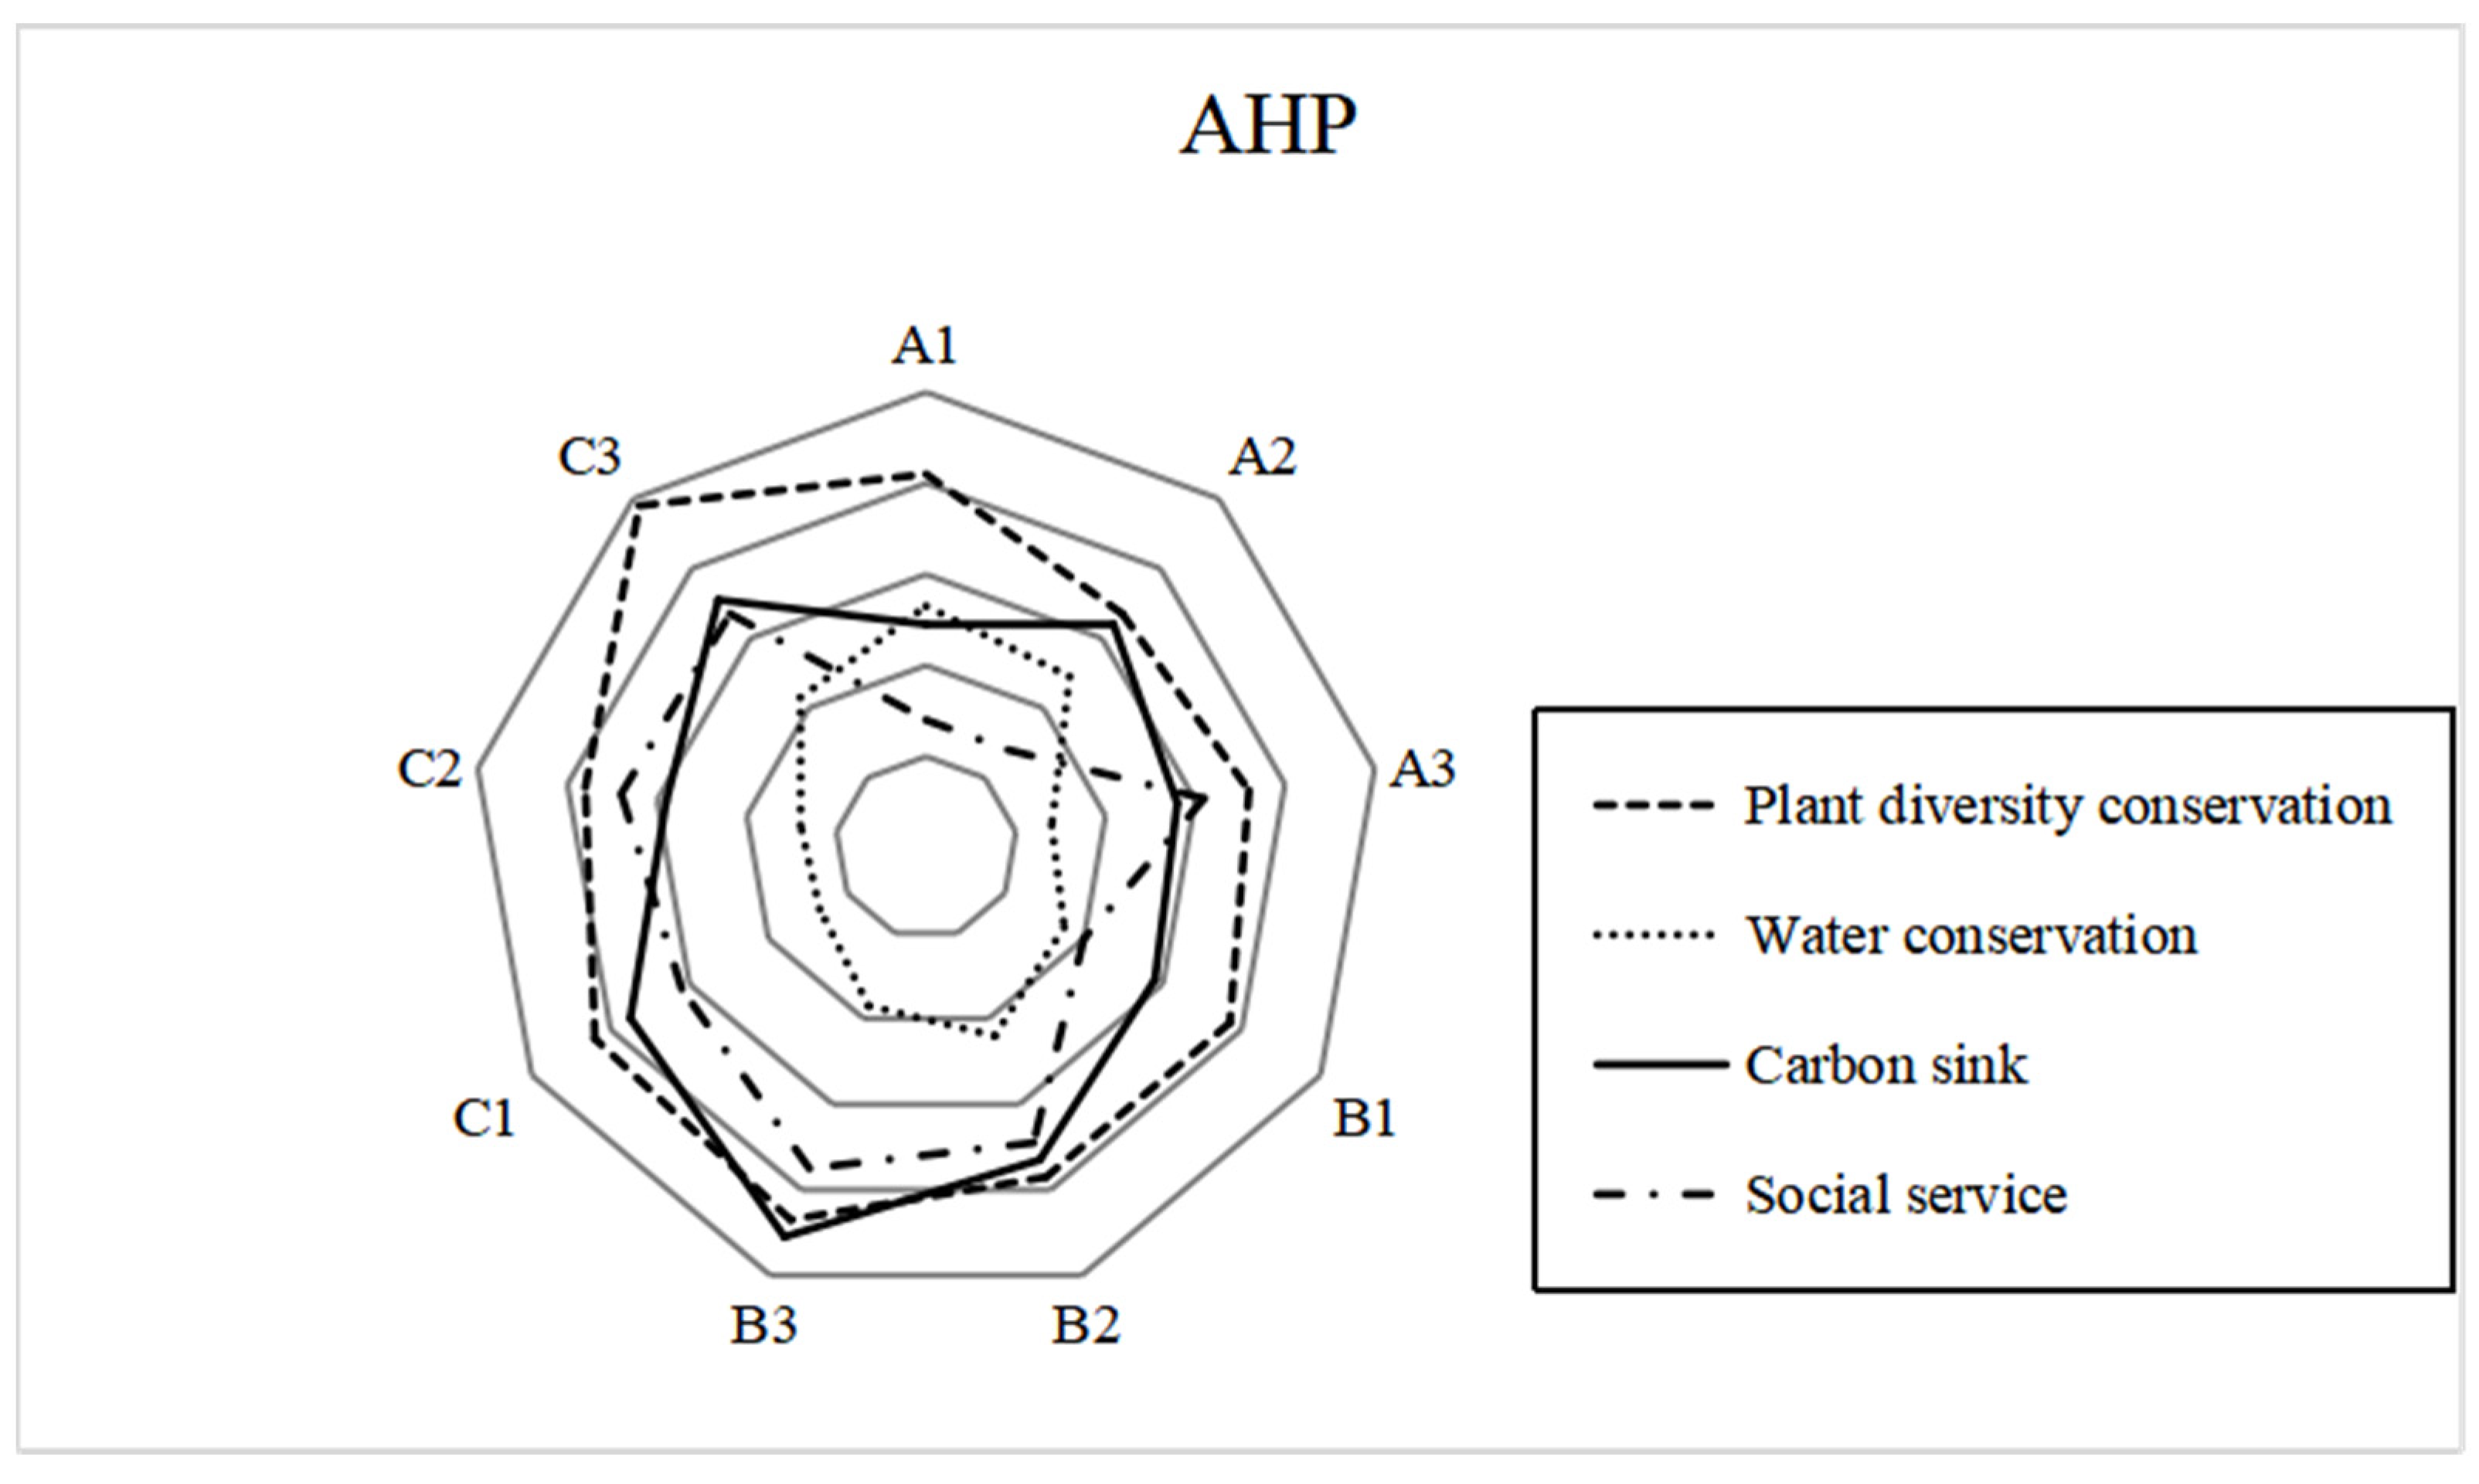
3.2.1. Analytic Hierarchy Process

The constructed judgment matrix is shown in Table 7, Table 8, Table 9, Table 10 and Table 11.
The consistency indicators of each indicator layer meet the requirements, and the overall ranking consistency indicator of the hierarchy is CR = 0.0002 < 0.10, which also meets the consistency and can be used to calculate weights.
According to the AHP, the weights of each indicator are shown in the table below. It can be seen that biodiversity protection is given the highest weight, reaching 0.54, followed by water source conservation and carbon sink function, both at 0.18, and social service function is the lowest, at 0.11, as shown in Table 12.
Table 13 shows the biodiversity conservation function, water conservation function, carbon sink function, social service function, and multifunctional value obtained using the AHP for different locations, as well as their scores and levels.
From the table, it can be seen that, regarding the biodiversity conservation function, the A3 plot had the highest score (0.72), followed by the B1 plot (0.77), while the C3 plot had the lowest score (0.98). Regarding the water conservation function, the A1 plot scored the highest (0.53), followed by the A2 plot (0.49), while the C3 plot scored the lowest (0.43). Regarding the carbon sink function, the C3 plot scored the highest (0.91), followed by the B1 plot (0.73), while the A1 plot scored the lowest (0.56). Regarding the social service function, the B1 plot had the highest score (0.60), followed by the B3 plot (0.75), and the C3 plot had the lowest score (0.67). Regarding multifunctional value, the B1 plot scored the highest (0.63), followed by the B3 plot (0.73), while the C3 plot scored the lowest (0.81). According to the score level, the sample plot can be divided into three levels: excellent, medium, and poor. The best were the B3 and C3 sample plots. The results of the analysis of variance showed that the multifunctional performance of the uncultivated plots was significantly worse than that of the nurtured plots. The difference in multifunctional performance between the 20% and 40% nurtured plots was not significant, as shown in Figure 4.

3.2.2. Entropy Weight Method

According to the EWM, the weights of each indicator are shown in the Table 14. It can be seen that the water conservation function is given the highest weight, reaching 0.30, followed by the water source conservation and carbon sink functions, both at 0.27, and the social service function is the lowest, at 0.15.
The following table shows the biodiversity conservation function, water source conservation function, carbon sink function, social service function, and multifunctional value, scores, and levels obtained by using the entropy weight method for different locations.
From the table, it can be seen that, regarding the biodiversity conservation function, the B3 plot had the highest score (0.12), followed by the B1 plot (0.11), while the A3 plot had the lowest score (0.09). For the water conservation function, the B3 plot scored the highest (0.19), followed by the B1 plot (0.18), while the A3 plot scored the lowest (0.18). For the carbon sink function, the B3 plot had the highest score (0.19), followed by the B1 plot (0.17), while the A3 plot had the lowest score (0.16). For the social service function, the B3 plot had the highest score (0.16), followed by the B1 plot (0.16), while the A3 plot had the lowest score (0.15). For the multifunctional value, the B3 plot scored the highest (0.71), followed by the B1 plot (0.68), while the A3 plot scored the lowest (0.56). According to the score level, the sample plot can be divided into three levels: excellent, medium, and poor. The B2 and B3 sample plots were the best. The results of the analysis of variance showed that the multifunctional performance of the uncultivated plot was significantly worse than that of the nurtured plot, and the multifunctional performance of the plot with a nurtured intensity of 20% was significantly better than that of the plot with a nurtured intensity of 40%, as shown in Table 15 and Figure 5.

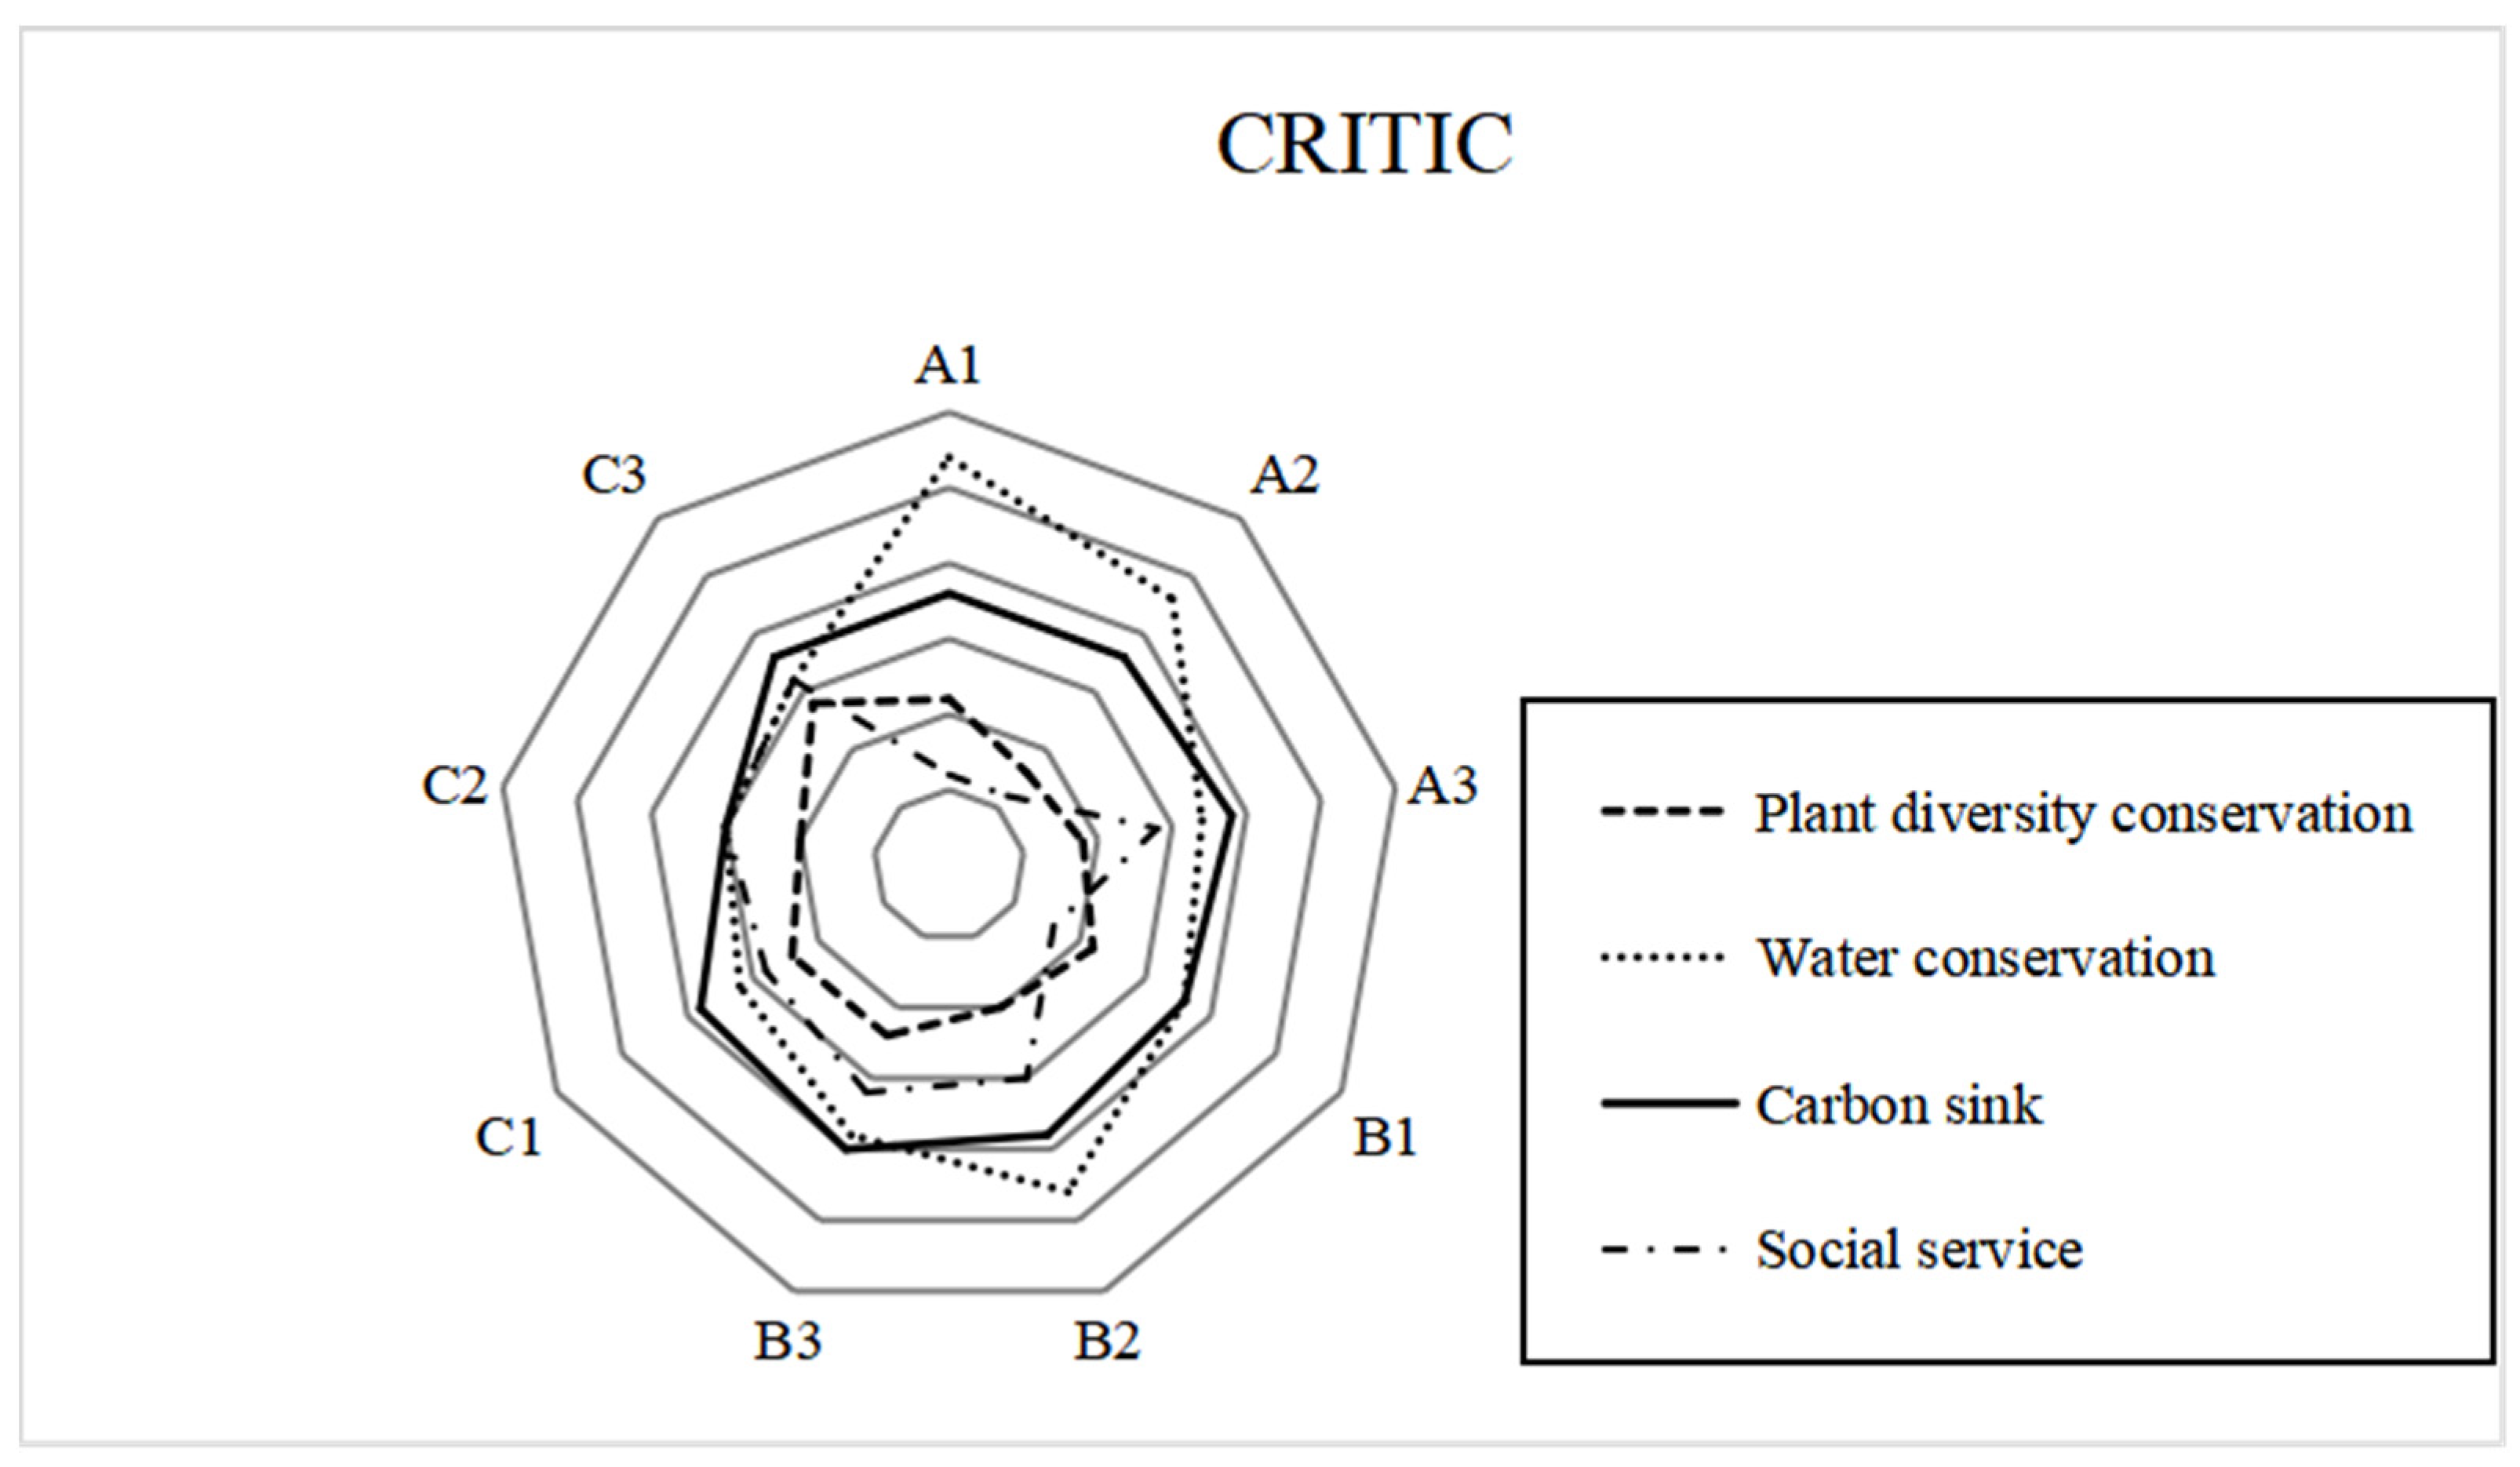
3.2.3. CRITIC Method

According to the CM, the weights of each indicator are shown in the table below. It can be seen that the water conservation function is given the highest weight, reaching 0.38, followed by the carbon sink function, reaching 0.26, and the biodiversity conservation function is the lowest, at 0.15, as shown in Table 16.
The following table shows the biodiversity conservation function, water source conservation function, carbon sink function, social service function, and multifunctional value obtained using the CM in different locations, as well as their scores and levels.
From the table, it can be seen that, for the biodiversity conservation function, the B3 plot had the highest score (0.12), followed by the B1 plot (0.11), while the A3 plot had the lowest score (0.09). For the water conservation function, the B3 plot scored the highest (0.19), followed by the B1 plot (0.18), while the A3 plot scored the lowest (0.18). For the carbon sink function, the B3 plot had the highest score (0.20), followed by the B1 plot (0.18), while the A3 plot had the lowest score (0.17). For the social service function, the B3 plot had the highest score (0.16), followed by the B1 plot (0.15), while the A3 plot had the lowest score (0.15). For the multifunctional value, the B3 plot scored the highest (0.67), followed by the B1 plot (0.66), while the A3 plot scored the lowest (0.57). According to the score level, the sample plot can be divided into three levels: excellent, medium, and poor. The B2 and B3 sample plots were the best. The results of the analysis of variance showed that the multifunctional performance of the uncultivated plot was significantly worse than that of the nurtured plot, and the multifunctional performance of the plot with a nurtured intensity of 20% was significantly better than that of the plot with a nurtured intensity of 40%, as shown in Table 17 and Figure 6.

3.3. Correlation Analysis between Forest Multifunctionality and Thinning Intensity

3.3.1. Consistency Analysis of Different Evaluation Results

According to the evaluation results, the multifunctional values of various places were evenly divided into three levels: excellent, medium, and poor. Kappa tests were conducted, and the results show that the consistency between the AHP and the CM is strong, while the consistency between the EWM and the AHP was average. The consistency between the entropy weight method and the CRITIC Method was extremely strong. Overall, the evaluation conclusions obtained from the above three evaluation methods showed a high degree of consistency, as shown in Table 18 and Table 19.

3.3.2. Correlation Analysis of Different Functions

We normalized the values of each function and calculated the average value, then we observed the scatter plot and analyzed the correlation between each function. Table 20 shows the correlation between various functions, and the results show a significant positive correlation between the social service function and the carbon sink function, while the social service function and water source conservation function show a significant negative correlation.
We built a model of the carbon sequestration function and social service function, as shown in Table 21.
It can be seen that the R-squared of the cubic curve is the highest, at 0.69.

3.3.3. The Coupling Relationship between Different Functions and Multifunctional Values

Based on the above evaluation results, the coupling relationship model between different functions and multifunctional values is shown in the Table 22.

3.4. Construction of Target Structural System

To achieve multifunctional management of spruce–fir forests and fully leverage their water conservation, biodiversity protection, carbon sequestration, and social service functions based on the determined goals of forest multifunctional management, reasonable management measures are taken to adjust the structure of the actual spruce and fir forest stands, achieve the goal of multifunctional management of spruce–fir forests, and further fully leverage the benefits of forest ecology, economy, and society, as shown in Table 23.
Based on the results of the multifunctional evaluation of spruce–fir forests in this article, the forest stand with the highest multifunctional comprehensive value was selected as the reference for the target structure. By integrating the above analysis, the multifunctional target structure of spruce–fir forests was obtained. It can promote future management of spruce and fir forests.

4. Discussion

We have explored the multifunctional performance of natural spruce–fir forests. There have been many studies on artificial forests in the past [90,91], but relatively less research has been conducted on natural forests [92]. The impact of thinning intensity on forest multifunctionality often shows that moderate thinning has the best effect [91,92]. Of course, the specific thinning intensity may depend on the origin of the forest stand, tree species, and forest age [93]. The site conditions (such as slope position, gradient, and aspect [91]) have different impacts. However, from the perspective of overall multifunctionality, moderate thinning still has the best effect, which is consistent with this study. Many studies focus on the individual functions of forests, but we looked at the various functions of forests separately. For the water conservation function of forests, there is also a certain correlation between thinning intensity and its impact. Generally speaking, there is an intensity threshold above which the forest’s water storage capacity is often reduced. Below this value, the impact on water conservation capacity is relatively small or decreases slowly with increasing intensity [94]. There are also studies showing that moderate thinning can improve the water conservation capacity of forests [93], and this improvement in water conservation capacity may be related to time [95]. Appropriate thinning can improve vegetation composition, alter soil properties, and reduce the amount of litter [96,97]. For carbon sink function, short-term logging affects forest carbon sink capacity [98], but this side effect may gradually disappear after a few years [99]. In the long run, this negative impact is not significant [100], and the promoting effect gradually becomes apparent. In some studies, the long-term carbon sequestration capacity is even positively correlated with thinning intensity [101,102]. Thinning releases growth space, reduces competition intensity, and accelerates forest growth and renewal [103,104]. For the biodiversity conservation function, thinning may increase biodiversity as it may promote the growth of some shade-tolerant tree species [105] and promote the growth of understory vegetation. In some studies, there is a positive correlation between thinning intensity and understory vegetation [106]. However, excessive thinning intensity may lead to slow forest recovery and insufficient protection benefits [107,108]. Overall, the relationship between function and thinning intensity is generally consistent with our findings, that is, there exists a value that enables different forest functions to function effectively. In our study, a thinning intensity of 20% can best promote the multifunctional development of spruce–fir coniferous and broad-leaved mixed forests, according to the results of the evaluation.
In forest management, once decision-making or evaluation is involved, the AHP is often indispensable and may have advantages over other methods, mainly because the related issues are often complex and involve multiple aspects and levels; therefore, it is widely used [91,108,109,110]. However, at the same time, the AHP also has many problems, mainly reflected in the subjectivity of indicator weights in evaluation [76], which is why the AHP is often combined with other methods, such as the EWM [76,88,111,112], or combined with CM [113]. In fact, these studies aim to combine other objective weighting methods with the AHP to reduce its subjectivity and uncertainty in weighting. Through this approach, the objectivity of AHP can be improved. In these research practices, it can be found that the combination of these methods with AHP often yields good evaluation results and provides good value in forest management practices. In this study, we can clearly see that the weighting of biodiversity conservation functions obtained through the AHP is significantly higher than other methods, mainly because experts and local managers consider the status of their national parks and the potential value of biodiversity more. Three methods, namely AHP, EWM, and CM, were used in combination, and their evaluation results passed the Kappa test. This also indicates that the consistency of the three methods in evaluating the multifunctional performance of forests is good, and the evaluation results are reliable, which can serve as one of the guidelines for forest management and evaluation.
There are still some aspects of this study that need improvement. At the spatial scale, the forest-related indicators in this study are relatively accurate and comprehensive, but limitations also exist in the field of investigation. Future research can be conducted at a larger regional scale to evaluate the multifunctional situation of spruce–fir forests in a larger area, in order to promote the multifunctional management of spruce–fir forests and obtain more universal and accurate patterns of change. Although some factors in this study involve time series, such as the initial carbon storage of the forest and the long-term thinning and withering losses after tending, the actual evaluation object is the multifunctional performance of the spruce–fir forest in 2023, which is a relatively static evaluation. In order to truly achieve the goal of providing practical guidance for long-term multifunctional management in spruce–fir forests, it is necessary to conduct long-term and continuous evaluations of multifunctional performance, determine reasonable management methods for each period, and promote multifunctional performance at all stages. Due to the fact that the long-term survey factors involved in this study only include data such as breast diameter, it is not possible to scientifically analyze their multifunctional performance. In the future, we can continue to measure the indicators in the evaluation system regularly and conduct dynamic evaluations over a long time span.

5. Conclusions

This study analyzed the impact of different thinning intensities on the multifunctional performance of spruce–fir forests based on the survey results of nine plots. We studied the multifunctional requirements of spruce–fir forests, constructed a multifunctional evaluation system for spruce–fir forests, and planned and adjusted the stand structure of spruce–fir forests, which has certain significance for guiding the multifunctional management of spruce–fir forests.
We comprehensively used AHP, EWM, and CM to construct a multifunctional evaluation system for spruce–fir forests. We studied the functional requirements of spruce–fir forests, and we determined that the main functions of spruce–fir forests are biodiversity conservation, carbon sink, water conservation, and social service. The diversity index, canopy closure, needle-to-width ratio, slope, crown width, shrub layer coverage, herbaceous layer coverage, soil water storage capacity, litter layer water storage capacity, cumulative carbon sequestration of trees, carbon storage of shrubs and grasses, carbon storage of litter layer, soil layer carbon storage, mortality rate, pest and disease rate, and wind reversal rate were used as evaluation indicators. The evaluation results of the three evaluation methods are consistent and have good reference value. The evaluation results are as follows:
  • The thinning intensity has a significant impact on the multifunctional performance of spruce–fir forests (30 years), as evidenced by the fact that the multifunctional performance of the 20% thinning intensity plot performed significantly better than that of the 40% thinning intensity plot, and both of these performed significantly better than the uncured plot. The B3 plot, with the highest multifunctional value, had a thinning intensity of 20%, while the A2 plot, without thinning, had the lowest value.
  • There is a significant correlation between the social service function, water source conservation function, and carbon sink function, while there is no significant correlation between other functions. A coupling relationship model between the social service function, water source conservation function, and carbon sink function was established, and the results showed that the model R2 of the cubic curve is the highest. We constructed coupling relationship models between multifunctional values and different functions, as well as coupling relationship models between different functions and various indicators based on the evaluation results of the three methods.
  • We have constructed a target structural system for spruce–fir forests to guide management practices and apply research results. For the management of spruce–fir forests in the Changbai Mountain area, our research has determined that controlling the logging intensity at around 20% can effectively promote the multifunctionality of forests, and it can be managed using the target structure system constructed in Section 3.4, including controlling relevant indicators such as stand volume, tree species composition, canopy density, plant density, herbal coverage, DBH structure, horizontal distribution, vertical structure, pest and disease rate, and shrub coverage, promoting the forest stand closer to the optimal forest division in the area.
  • The future in-depth research mainly lies in two aspects: first, on the spatial scale, the current survey area is small, and more distribution areas can be surveyed in the future, which is convenient to combine the multifunctional management of spruce–fir forest with the distribution and site conditions so that its application area is wider; secondly, on a temporal scale, there is a lack of continuity in the multifunctional evaluation of spruce forests, which makes it difficult to integrate the growth patterns of spruce forests with multifunctional management and make them more suitable for spruce forests of different ages.

Author Contributions

Conceptualization, W.H. and J.L.; methodology, W.H. and X.W.; software, W.H.; validation, W.H.; formal analysis, W.H. and B.S.; investigation, W.H. and Y.L.; resources, W.H.; data curation, W.H.; writing—original draft preparation, W.H.; writing—review and editing, W.H.; visualization, W.H.; supervision, W.H.; project administration, W.H.; funding acquisition, X.W. All authors have read and agreed to the published version of the manuscript.

Funding

This research was funded by the Lhasa Science and Technology Plan, grant number NO.2023040701004, and the Beijing Representative Office of the World Wildlife Fund (Switzerland) commissioned the project, grant number NO.PO3825.

Data Availability Statement

The raw data supporting the conclusions of this article will be made available by the authors upon request.

Conflicts of Interest

The authors declare no conflicts of interest.

Glossary

WordsMeaning
Analytic Hierarchy Process (AHP)A method proposed by Saaty in the 1970s that combines qualitative and quantitative methods to mathematize the decision-making process.
Entropy weight method (EWM)An objective weighting method that calculates the entropy weight of each indicator based on the degree of dispersion of data and then modifies the entropy weight according to each indicator to obtain a more objective indicator weight.
CRITIC method (CM)An objective weighting method proposed by Diakoulaki. This technique is used to determine the weights of evaluation indicators in a multi-indicator comprehensive assessment system.
Biodiversity conservationThe series of beneficial ecological services and functions provided by biodiversity in ecosystems, which are crucial for maintaining ecological balance, environmental health, and human well-being.
Water conservation functionThe preservation of water through relevant media within a certain time, space range, and conditions. This reflects the process and ability to achieve water retention, long-term maintenance, supply and nourishment, and water regulation within the ecosystem.
Carbon sink functionThe process by which forest ecosystems absorb CO2 from the atmosphere through photosynthesis by plants, convert it into O2, and store it in vegetation and soil, thereby reducing the concentration of CO2 in the atmosphere.
Social service functionThe function of providing places and conditions for human activities such as leisure, entertainment, health, and education.

References

  1. Crow, T.R.; Buckley, D.S.; Nauertz, E.A.; Zasada, J.C. Effects of management on the composition and structure of northern hardwood forests in Upper Michigan. For. Sci. 2002, 48, 129–145. [Google Scholar] [CrossRef]
  2. Lähde, E.; Laiho, O.; Norokorpi, Y.; Saksa, T. Development of Norway spruce dominated stands after single-tree selection and low thinning. Can. J. For. Res. 2002, 32, 1577–1584. [Google Scholar] [CrossRef]
  3. Zhou, J.N. The effect of different degrees of thinning and thinning on artificial forests of Pinus koraiensis. South. Agric. 2023, 17, 109–111. (In Chinese) [Google Scholar] [CrossRef]
  4. Deal, R.L.; Tappeiner, J.C. The effects of partial cutting on stand structure and growth of western hemlock±Sitka spruce stands in southeast Alaska. Forest Ecology and Management 2002, 159, 173–186. [Google Scholar] [CrossRef]
  5. Jaakkola, T.; Makinen, H.; Saranpaa, P. Wood density in Norway spruce: Changes with thinning intensity and tree age. Can. J. For. Res. 2005, 35, 1767–1778. [Google Scholar] [CrossRef]
  6. Jaakkola, T.; Mäkinen, H.; Saranpää, P. Wood density of Norway spruce: Responses to timing and intensity of first commercial thinning and fertilisation. For. Ecol. Manag. 2006, 237, 513–521. [Google Scholar] [CrossRef]
  7. Liziniewicz, M.; Andrzejczyk, T.; Drozdowski, S. The effect of birch removal on growth and quality of pedunculate oak in. For. Ecol. Manag. 2016, 364, 165–172. [Google Scholar] [CrossRef]
  8. Yang, L.; Zhao, C.H.; Xin, H.L.; Yang, L.; Shen, H.L. The effect of thinning intensity on the growth and stand volume of artificial red spruce forests. J. Northwest For. Univ. 2023, 38, 207–213. (In Chinese) [Google Scholar] [CrossRef]
  9. Zhang, H.P. The effect of thinning intensity on the growth of Chinese pine trees. Mod. Hortic. 2024, 47, 64–65, 68. (In Chinese) [Google Scholar] [CrossRef]
  10. Ding, Y.; Huang, J.H.; Xu, Y.; Zang, R.G. The impact of thinning and thinning on biomass recovery in tropical secondary forests in Hainan. J. Ecol. 2021, 41, 5118–5127. (In Chinese) [Google Scholar] [CrossRef]
  11. Li, Q. Forest conservation and biodiversity. J. Shanxi Coal-Min. Adm. Coll. 2008, 1, 212–213. (In Chinese) [Google Scholar]
  12. Peng, M.Y.; Hui, M.L.; He, X.E. The necessity analysis of forest thinning in the Qin ling forest area. Shaanxi For. Technol. 2009, 6, 70–73. (In Chinese) [Google Scholar]
  13. Zou, H.; Qin, L.; He, Y.J. The impact of different forest management measures on wood production and carbon storage. World For. Res. 2015, 28, 12–17. (In Chinese) [Google Scholar]
  14. Yang, Z.H.; Mo, C.C.; Wang, Y.H. The effect of thinning intensity on carbon source/sink of different types of Pinus koraiensis forests with “planting needles to maintain broadness”. J. Beijing For. Univ. 2023, 45, 19–32. (In Chinese) [Google Scholar]
  15. Gao, T.; Song, X.Y.; Ren, Y.Z.; Mao, L.L.; Gao, R.; Dong, X.B. The effect of thinning intensity on carbon dynamics in coniferous and broad-leaved mixed forests. J. Cent. South Univ. For. Technol. 2024, 44, 118–128. (In Chinese) [Google Scholar] [CrossRef]
  16. Liu, P.X. Exploration of the significance, problems, and countermeasures of forest thinning and thinning. New Agric. 2023, 23–24. (In Chinese) [Google Scholar]
  17. Zhou, Y.H. The effect of thinning and thinning on the growth and understory vegetation diversity of Cryptomeria fortunei in western Sichuan. J. Cent. South Univ. For. Technol. 2022, 42, 65–74+84. (In Chinese) [Google Scholar] [CrossRef]
  18. Yang, Y.L. The Impact of Thinning on the Ecological Support Function of Inefficient Cypress Plantations; Sichuan Agricultural University: Chengdu, China, 2015. (In Chinese) [Google Scholar]
  19. Jia, Z.K. Research on the thinning effect of ecological public welfare forests of Pinus tabulaeformis and Platycladus orientalis in mountainous areas of Beijing. Ph.D. Thesis, Beijing Forestry University, Beijing, China, 2007. (In Chinese). [Google Scholar]
  20. Bo, G.X.; Hang, M.J. The effect of different thinning intensities on understory plant diversity in the hard broad-leaved forest of Changbai Mountain. J. Northeast. For. Univ. 2011, 39, 27–29, 73. (In Chinese) [Google Scholar] [CrossRef]
  21. Zhu, Y.J. Evaluation of management effects of different thinning intensities in larch timber forests in the Greater Khingan Mountains region. Forestry 2016, 52, 29–38. (In Chinese) [Google Scholar] [CrossRef]
  22. Zhang, R.; Zhai, M.P. Research progress on the impact of forest thinning on wildlife in forests. World For. Res. 2003, 16, 21–24. (In Chinese) [Google Scholar] [CrossRef]
  23. Fredericksen, T.S.; Ross, B.D.; Hoffman, W.; Ross, E. The impact of logging on wildlife. J. For. 2000, 98, 4. [Google Scholar]
  24. Sakellariou, S.; Tampekis, S. Review of state-of-the-art decision support systems (DSSs) for prevention and suppression of forest fires. J. For. Res. 2017, 28, 1107–1117. [Google Scholar] [CrossRef]
  25. Li, F.; Pan, P.; Zang, Y.; Ouyang, X.Z.; Ning, J.K.; Guo, J.L. A Study on the Optimization Model of Multifunctional Management Spatial Structure of Pinus massoniana Stand in Gannan. J. Southwest For. Univ. 2017, 37, 141–147. (In Chinese) [Google Scholar] [CrossRef]
  26. Zhang, B.W. A Study on Multifunctional Management Evaluation of Aerial Plantation of Pinus massoniana in Xingguo County. Ph.D. Thesis, Jiangxi Agricultural University, Jiangxi, China, 2012. (In Chinese). [Google Scholar]
  27. Wei, X.H.; Sun, Y.J.; Mei, G.Y.; Wang, Y.F. Forest resource evaluation based on multifunctional management. J. Cent. South Univ. For. Technol. 2013, 33, 334–342. (In Chinese) [Google Scholar]
  28. Shi, P.; Körner, C.; Hoch, G. A test of the growth-limitation theory for alpine tree line formation in evergreen and deciduous taxa of the eastern Himalayas. Funct. Ecol. 2008, 22, 213–220. [Google Scholar] [CrossRef]
  29. Ferraz, S.F.B.; de Paula Lima, W.; Rodrigues, C.B. Managing forest plantation landscapes for water conservation. For. Ecol. Manag. 2013, 301, 58–66. [Google Scholar] [CrossRef]
  30. Woodbury, P.B.; Smith, J.E.; Heath, L.S. Carbon sequestration in the U.S. forest sector from 1990 to 2010. For. Ecol. Manag. 2006, 241, 14–27. [Google Scholar] [CrossRef]
  31. Kirby, K.R.; Potvin, C. Variation in carbon storage among tree species: Implications for the management of a small-scale carbon sink project. For. Ecol. Manag. 2007, 246, 208–221. [Google Scholar] [CrossRef]
  32. Li, Q.; Chen, J.; Moorhead, D.L.; DeForest, J.L.; Jensen, R.; Henderson, R. Effects of timber harvest on carbon pools in Ozark forests. Can. J. For. Res. 2007, 37, 2337–2348. [Google Scholar] [CrossRef]
  33. Wang, J.Q.; Li, J.J.; Zhi, H. Estimation of net production, carbon storage, and carbon sink function of forest vegetation in Qilian Mountains. J. Northwest For. Univ. 2017, 32, 1–7. (In Chinese) [Google Scholar]
  34. Pan, Y.J.; Wang, B.; Chen, B.F.; Peng, Q.Z. Research on Carbon Sequestration Function of Chinese Fir Artificial Forest Ecosystem in Dagang Mountain, Jiangxi Province. J. Cent. South Univ. For. Technol. 2013, 33, 120–125. [Google Scholar]
  35. Shi, Q.S.; MEIKERE, M.K.; Zhang, Y.T. Carbon sink function of poplar plantation in Karamay. Arid Zone Research 2015, 32, 388–394. (In Chinese) [Google Scholar]
  36. Zhan, P.; Ou, G.T.; Chen, J.N. Carbon sink function of Jatropha curcas energy forest in Luodian County. Nonwood For. Res. 2013, 31, 146–149. (In Chinese) [Google Scholar]
  37. Li, B.X.; Qu, Y.R. Carbon sink function and economic value evaluation of main artificial forests in Sanling Mountain Forest Park, Guangdong Province. Eucalyptus Technol. 2015, 32, 15–20. (In Chinese) [Google Scholar] [CrossRef]
  38. Lin, S.H.; Yu, X.B.; Wang, X.; Li, J.D. Carbon sink function and economic value evaluation of main forest types in Baisha County, Hainan. Trop. For. 2013, 41, 4–7. (In Chinese) [Google Scholar] [CrossRef]
  39. Qiu, S.Z.; Bo, G.M.; Ding, Q. A Study on Carbon Storage and Carbon Sink Function of Forest Vegetation in Bailongjiang Forest Area. J. Cent. South Univ. For. Technol. 2018, 38, 88–93. (In Chinese) [Google Scholar] [CrossRef]
  40. Xiao, Y.; Liu, S.H.; Wang, G.J. A Study on Carbon Sequestration Function of Four Forest Ecosystems in Hunan Province. J. Nat. Sci. Hunan Norm. Univ. 2010, 33, 124–128. (In Chinese) [Google Scholar] [CrossRef]
  41. Wang, Y.; Xu, P.; Bo, B.; Wang, W. Research progress on evaluation models for water conservation function in forest ecosystems. Ecol. Econ. 2018, 34, 158–164+169. (In Chinese) [Google Scholar]
  42. Hong, Y.C. Forest stand characteristics and water conservation capacity of mixed forests of Pinus massoniana, Fujian Guangdong Castanopsis fargesii, and different ages and layers. J. Northeast. For. Univ. 2017, 45, 53–59. (In Chinese) [Google Scholar] [CrossRef]
  43. Meng, G.T.; Fang, X.J.; Li, G.X. Analysis of Water Conservation Capacity of Different Vegetation Types in the Jinsha River Basin of Yunnan Province. Res. Soil Water Conserv. 2007, 4, 160–163. (In Chinese) [Google Scholar]
  44. Wu, Z.X.; Chen, L.G.; Wu, Z.C. The water conservation function of mixed broad-leaved forests such as Chinese fir and rice old row. J. Fujian For. Sci. Technol. 2017, 44, 43–46, 89. (In Chinese) [Google Scholar] [CrossRef]
  45. Xu, H.L.; Man, X.L.; Sheng, H.C. Comprehensive evaluation of water conservation function of natural larch forests with different stand types in the Greater Khingan Mountains. Chin. Agric. Sci. Bull. 2013, 29, 74–78. (In Chinese) [Google Scholar]
  46. Zhang, Y.D.; Liu, S.R.; Gu, F.X. The impact of vegetation changes in high-altitude forests in Southwest Asia on watershed water production. J. Ecol. 2011, 31, 7601–7608. (In Chinese) [Google Scholar]
  47. Zhang, Z.M.; Yu, X.X.; Niu, Z.Z. Hydrological and ecological functions of different forest litter layers. J. Soil Water Conserv. 2005, 19, 139–143. (In Chinese) [Google Scholar] [CrossRef]
  48. Ru, S.W.; Bo, C.; Pan, Q.H. Litter and Soil Hydrological Effects of Seven Artificial Pure Forests in the Mountainous Areas of Beijing. Inn. Mong. Agric. Univ. 2013, 34, 53–59. (In Chinese) [Google Scholar]
  49. Proença, V.M.; Pereira, H.M.; Guilherme, J.; Vicente, L. Plant and bird diversity in natural forests and in native and exotic plantations in NW Portugal. Acta Oecologica (Montrouge) 2010, 36, 219–226. [Google Scholar] [CrossRef]
  50. Liu, S.L. Heterogeneous Warm Temperate Forest Landscape Biodiversity and Soil Properties. In Proceedings of the 5th National Symposium on Biodiversity Conservation and Sustainable Utilization, Hangzhou, China, 20–22 November 2002. (In Chinese). [Google Scholar]
  51. Ru, W.M.; Zhang, J.T.; Zhang, F. Research on Species Diversity and Community Structure of Lishan Forest Community. J. Appl. Ecol. 2006, 17, 561–566. (In Chinese) [Google Scholar]
  52. Yang, X.J.; Jiang, Z.L. Biodiversity evaluation of forest landscapes in Liyang area. J. Ecol. 2001, 21, 671–675. (In Chinese) [Google Scholar] [CrossRef]
  53. Buhyoff, G.J.; Wellman, J.D.; Harvey, H.; Fraser, R.A. Landscape architects’ interpretations of people’s landscape preferences. Env. Manag. 1978, 6, 255–262. [Google Scholar]
  54. Tyrvainen, L.; Vaananen, H. The economic value of urban forest amenities: An application of the contingent valuation method. Landsc. Urban Plan. 1998, 43, 105–118. [Google Scholar] [CrossRef]
  55. Buhyoff, G.J.; Iv, R.B.H.; John, N.L.; Cordell, H.K. Prediction of scenic quality for southern pine stands. For. Sci. 1986, 32, 769–778. [Google Scholar] [CrossRef]
  56. Das, U.; Behera, B. Geospatial assessment of ecological vulnerability of fragile Eastern Duars Forest integrating GIS-based AHP, CRITIC and AHP-TOPSIS models. Geomat. Nat. Hazards Risk 2024, 15, 2330529. [Google Scholar] [CrossRef]
  57. Fei, C.L. Research on Combination Evaluation Method and Its Application. Master’s Thesis, Central South University, Changsha, China, 2008. (In Chinese). [Google Scholar]
  58. Peng, Z.l.; Zhang, Q.; Yang, S.L. A review of research on comprehensive evaluation theory and methods. Chin. J. Manag. Sci. 2015, 23, 245–256. [Google Scholar]
  59. Filotas, E.; Parrott, L.; Burton, J.P. Viewing forests through the lens of complex systems science. Ecosphere 2014, 5, 1–23. [Google Scholar] [CrossRef]
  60. Messier, C.; Puettmann, K.; Filotas, E. Dealing with Non-linearity and Uncertainty in Forest Management. Curr. For. Rep. 2016, 2, 150–161. [Google Scholar] [CrossRef]
  61. Tampekis, S.; Samara, F. An eco-efficient and economical optimum evaluation technique for the forest road networks: The case of the mountainous forest of Metsovo, Greece. Environ. Monit. Assess. 2018, 190, 134. [Google Scholar] [CrossRef]
  62. Zhao, J.; Liu, D.L.; Zheng, X.X. The Application of GIS in Forest Multifunctional Evaluation of Jinguoling Forest Farm. J. Northwest For. Univ. 2010; 25, 207–209+215. (In Chinese) [Google Scholar]
  63. Liu, B.Y.; Zhao, J.; Liu, D.L. Construction of a multifunctional evaluation index system for forests in Jinguoling Forest Farm. J. Cent. South For. Univ. 2012, 32, 158–161. (In Chinese) [Google Scholar] [CrossRef]
  64. Zhao, X.M.; Liu, D.M.; Zheng, X.X. Exploration of Forest Multifunctional Evaluation Index System in Beijing Badaling Forest Farm. For. Resour. Manag. (In Chinese). 2010, 45–48+123. (In Chinese) [Google Scholar] [CrossRef]
  65. Diakoulaki, D.; Mavrotas, G.; Papayannakis, L. Determining objective weights in multiple criteria problems: The critic method. Comput. Oper. Res. 1995, 22, 763–770. [Google Scholar] [CrossRef]
  66. Li, W.H.; Luo, T.X. Biological productivity pattern and mathematical model of spruce-fir forest in Chinese. Chin. J. Ecol. 1997, 61–68. [Google Scholar]
  67. Wagle, B.H.; Weiskittel, A.R.; Berrill, J.P. Tree-level responses to commercial thinning in spruce-fir forests across northern Maine, USA. For. Ecol. Manag. 2023, 546, 121358. [Google Scholar] [CrossRef]
  68. Sun, G.H. The wild vegetable resources and their development prospects in Changbai Mountain area. Jilin For. Technol. 1995, 5, 32–36. (In Chinese) [Google Scholar]
  69. Yuan, Z.T.; Li, M.; He, Z.Y. Research on the Evaluation Index System for the Construction of “Ping An Sea Area”—Taking (In Chinese). Zhejiang Province as an Example. J. Saf. Environ. 2019, 19, 1884–1891. (In Chinese) [Google Scholar] [CrossRef]
  70. Li, Z.J.; Wang, T. Application of Improved Analytic Hierarchy Process Entropy Weight Method in the Evaluation of Groundwater Resource Carrying Capacity in Zhoukou City. J. Nat. Sci. Heilongjiang Univ. 2023, 40, 84–91. (In Chinese) [Google Scholar] [CrossRef]
  71. Jia, P.; Li, X.B.; Wang, J.X. Comparison of several kinds of typical comprehensive evaluation methods. China Hosp. Stat. 2008, 15, 351–353. [Google Scholar]
  72. Matveeva, A.G. Experimental Industrial Fellings with Undergrowth Preservation in Fir–Spruce Forests of Khabarovsk Krai. Contemp. Probl. Ecol. 2022, 15, 891–896. [Google Scholar] [CrossRef]
  73. Wang, Z.C.; Kang, X.G.; Luo, X.X. Progress in Forest Health Evaluation Research. J. Northwest For. Univ. 2010, 25, 163–169. [Google Scholar]
  74. Zou, Z.H.; Sun, J.N.; Ren, G.P. Entropy weighting method for fuzzy evaluation factors and its application in water quality evaluation. J. Environ. Sci. 2005, 552–556. [Google Scholar] [CrossRef]
  75. Chen, S.Y.; Wu, X.G.; Han, W. Determination of Technical Condition Index Weights for Concrete Beam Bridges Based on Least Squares AHP-CRITIC Combination Weighting. J. Shenyang Univ. (Nat. Sci. Ed.) 2024, 36, 171–178. (In Chinese) [Google Scholar] [CrossRef]
  76. Zuo, Z. Multifunctional Evaluation and Management of Deciduous Pine Forests in Changbai Mountain. Ph.D. Thsis, Beijing Forestry University, Beijing, China, 2021. (In Chinese). [Google Scholar] [CrossRef]
  77. Samal, R.; Dash, M. Ecotourism, biodiversity conservation and livelihoods: Understanding the convergence and divergence. Int. J. Geoheritage Parks 2023, 11, 1–20. [Google Scholar] [CrossRef]
  78. Ge, F.C. Study on the Water Conservation Function of Typical Artificial Vegetation on the Loess Plateau. Ph.D. Thsis, Northwest A&F University, Xianyang, China, 2023. (In Chinese). [Google Scholar] [CrossRef]
  79. Wang, S.Y. Prediction of Forest Carbon Sequestration Potential in Heilongjiang Province. Master’s Thesis, Northeast Forestry University, Harbin, China, 2020. (In Chinese). [Google Scholar] [CrossRef]
  80. Pugh, T.; Lindeskog, M.; Smith, B.; Poulter, B. Role of forest regrowth in global carbon sink dynamics. Proc. Natl. Acad. Sci. USA 2019, 116, 4382–4387. [Google Scholar] [CrossRef] [PubMed]
  81. Chen, X.F.; Shen, G.F. Analysis of Several Important Concepts of Forest Recreation. World For. Res. 2000, 1, 69–76. (In Chinese) [Google Scholar] [CrossRef]
  82. Lv, Y.; Ye, T.; Lv, F.Z. Exploring the Comprehensive Index of Species Diversity. For. Resour. Manag. 2013, 4, 84–87. (In Chinese) [Google Scholar] [CrossRef]
  83. Chen, X.; Bu, Z.J.; Wang, S.Z. A study on the distribution and environmental relationship of seven mosses in the Hani peatland of Changbai Mountain. Wetl. Sci. 2008, 2, 310–315. (In Chinese) [Google Scholar] [CrossRef]
  84. Fan, C.N. Carbon Estimation and Distribution Characteristics of Forest Vegetation in Jilin Province. Ph.D. Thsis, Northeast Forestry University, Heilongjiang, China, 2014. [Google Scholar]
  85. Li, Y.; Kong, L.C.; Shan, D.C. A Study on Carbon Pool of Pinus koraiensis and Abies spruce Forests in Changbai Mountain. Jilin For. Technol. 2002, 31, 7–9, 12. (In Chinese) [Google Scholar] [CrossRef]
  86. Wang, W.J.; Wang, K.; Wang, Y.Y. Comparative Study on the Composition Characteristics and Carbon Sink Function of Trees, Shrubs and Grasses in Northeast Coniferous and Broadleaf Forests. J. Beijing For. Univ. 2022, 44, 52–67. (In Chinese) [Google Scholar] [CrossRef]
  87. Zhao, J. The Application of GIS in Forest Multifunctional Evaluation of Jinguoling Forest Farm. Master’s Thesis, Beijing Forestry University, Beijing, China, 2011. (In Chinese). [Google Scholar]
  88. Jia, D.P.; Wang, X.J.; Liu, Y. Forest Health Evaluation of Jingouling Forest Farm. J. Northeast. For. Univ. 2019, 47, 47–52+57. (In Chinese) [Google Scholar] [CrossRef]
  89. Meng, C.; Zheng, X.X.; Jiang, G.J. Health evaluation of spruce and fir forests in Jingouling Forest Farm, Jilin. J. Northwest For. Univ. 2014, 29, 190–194. (In Chinese) [Google Scholar]
  90. Zhang, H. Early Effects of Disturbance Tree Thinning on Stand Structure and Multifunction of Pinus massoniana Plantation. Master’s Thesis, Sichuan Agricultural University, Yaan, China, 2023. (In Chinese). [Google Scholar] [CrossRef]
  91. Zhang, M.Y.; Wang, X.J. A Multi-function Evaluation of Different Thinning Intensities on Cunninghamia lanceolata Plantation. J. Northeast. For. Univ. 2017, 45, 29–33. (In Chinese) [Google Scholar] [CrossRef]
  92. Gu, L. Comprehensive Evaluation of Dynamic Forest Based on Multi-Function Decision Model In Jingouling Forest Farm. Ph.D. Thesis, Beijing Forestry University, Beijing, China, 2012. (In Chinese). [Google Scholar]
  93. Zhang, Q.Q.; Dong, X.B. Effects of Tending Thinning Intensity on Water Conservation in Different Succession Stages of Larix gmelinii Forest. J. Northeast. For. Univ. 2019, 47, 55–63. (In Chinese) [Google Scholar] [CrossRef]
  94. Wu, X.M.; Yu, X.X.; Chen, L.-h.; Jia, G.-d.; Qiu, Y.-x. PENG Xiu-wen Effects of thinning intensity on the understory water-holding capacity of Journal of Pinus sylvestris var. mongolica plantation in the Bashang area of north China. Appl. Ecol. 2021, 32, 2347–2354. (In Chinese) [Google Scholar] [CrossRef]
  95. Chen, S.S.; Xu, J.W. Effects of different thinning intensities on temporal and spatial patterns of water conservation of Pinus massoniana. J. Ecol. 2017, 37, 6753–6760. (In Chinese) [Google Scholar]
  96. Tang, H.H.; Zhang, W.Q. Effects of Cunninghamia lanceolata Stand Reconstructing on the Water-Holding Capacities of Soil and Litter in Southern Subtropical Region. Res. Soil Water Conserv. 2014, 21, 47–53. (In Chinese) [Google Scholar] [CrossRef]
  97. Qi, J.H.; Zhang, Y.J.; Zhang, Y.; Liu, Y. Water-holding capacity of an evergreen broadleaf forest in Ailao Mountain and its functions in mitigating the effects of Southwest China drought. J. Ecol. 2012, 32, 1692–1702. (In Chinese) [Google Scholar]
  98. Campbell, J.; Alberti, G.; Martin, J.; Law, B.E. Carbon dynamics of a ponderosa pine plantation following a thinning treatment in the northern Sierra Nevada. For. Ecol. Manag. 2008, 257, 453–463. [Google Scholar] [CrossRef]
  99. Zhang, H.; Liu, S.; Yu, J.; Li, J.; Shangguan, Z.; Deng, L. Thinning increases forest ecosystem carbon stocks. For. Ecol. Manag. 2024, 555, 121702. [Google Scholar] [CrossRef]
  100. Davis, C.S.; Hessl, E.A. Forest carbon sequestration changes in response to timber harvest. For. Ecol. Manag. 2009, 258, 2101–2109. [Google Scholar] [CrossRef]
  101. Lu, K.N.; Zhang, X. Effects of Tending Thinning on Diameter Class Distribution and Carbon Sequestration Rate of Natural Forest of Larix gmelinii in Cold Temperate Zone. J. Inn. Mong. For. Sci. Technol. 2024, 50, 17–23. (In Chinese) [Google Scholar]
  102. Wang, Z.C.; Li, Y.X.; Meng, Y.B.; Wang, C. Effect of Thinning on Biomass and Carbon Density of Mixed Conifer and Broadleaf Secondary Natural Forest. J. Northeast. For. Univ. 2021, 49, 5–11. (In Chinese) [Google Scholar]
  103. Vernon, J.M.; Sherriff, L.R.; van Mantgem, P.; Kane, J.M. Thinning, tree-growth, and resistance to multi-year drought in a mixed-conifer forest of northern California. For. Ecol. Manag. 2018, 422, 190–198. [Google Scholar]
  104. Roberts, D.S.; Harrington, A.C. Individual tree growth response to variable-density thinning in coastal Pacific Northwest forests. For. Ecol. Manag. 2008, 255, 2771–2781. [Google Scholar] [CrossRef]
  105. Bartels, S.F.; Macdonald, S.E. Dynamics and recovery of forest understory biodiversity over 17 years following varying levels of retention harvesting. J. Appl. Ecol. 2023, 60, 725–736. [Google Scholar] [CrossRef]
  106. Zhang, J.S.; Qiu, L. Effect of Thinning Intensity on Understory Vegetation of Pinus taiwanensis plantation. J. Gansu Agric. Univ. 2024, 1–9. (In Chinese) [Google Scholar]
  107. Halpern, C.B.; Halaj, J.; Evans, S.A.; Dovčiak, M. Level and pattern of overstory retention interact to shape long-term responses of understories to timber harvest. Ecol. Appl. 2012, 22, 2049–2064. [Google Scholar] [CrossRef] [PubMed]
  108. Johnson, S.; Strengbom, J.; Kouki, J. Low levels of tree retention do not mitigate the effects of clearcutting on ground vegetation dynamics. For. Ecol. Manag. 2014, 330, 67–74. [Google Scholar] [CrossRef]
  109. Huang, Y. Study on the Multi-Functional Evaluation of Pinustabulaeformis Plantation on Loess Plateau. Master’s Thesis, Northwest A&F University, Xianyang, China, 2017. (In Chinese). [Google Scholar]
  110. Jiang, L. Multifunction Evaluation System of Overcutting Forest in Daxing’an Moutains Based on GIS Technique. Master’s Thesis, Northeast Forestry University, Harbin, China, 2016. (In Chinese). [Google Scholar]
  111. Xie, X.J. Study on Multi-functional of Cunninghamia Lanceolata Non-commercial Forest in the South of China—Case on Fu Shou State-Oened Forest Farm; Central South University of Forestry and Technology: Changsha, China, 2015. (In Chinese) [Google Scholar]
  112. Tian, G. Evaluation of Recreation Resources in National Forest Parks Based on AHP Entropy Weight Method. J. Green Sci. Technol. 2023, 25, 148–156. (In Chinese) [Google Scholar] [CrossRef]
  113. Li, H.L. Study on ecological effect of Larix principis-rupprechtii forest based on AHP and entropy weight method. J. Hebei For. Sci. Technol. 2022, 7–13. (In Chinese) [Google Scholar] [CrossRef]
Figure 1. Location map of the sample site.
Forests 15 01703 g001
Figure 2. Evaluation method.
Forests 15 01703 g002
Figure 3. Research roadmap.
Forests 15 01703 g003
Figure 4. Score of each function based on the AHP.
Forests 15 01703 g004
Figure 5. Score of various functions based on EWM.
Forests 15 01703 g005
Figure 6. Score of various functions based on CM.
Forests 15 01703 g006
Table 1. Locations of sample sites.
Thinning IntensityPlot NumberPlot Area (ha)Age ClassAspect (°)Elevation (m)Slope PositionSlope Gradient (°)Coordinates
0A10.21Middle-aged forestNortheast by East 10°653Lower1043°21′29″ N, 130°11′75″ E
A20.21Middle-aged forestNortheast by East 10°663Lower1043°21′10″ N, 130°10′41″ E
A30.21Middle-aged forestNorthwest by West 20°664Lower1543°21′15″ N, 130°10′57″ E
20B10.21Middle-aged forestNortheast by East 20°706Lower1443°21′15″ N, 130°11′37″ E
B20.21Middle-aged forestNortheast by East 20°686Lower1543°21′51″ N, 130°10′26″ E
B30.21Middle-aged forestNortheast by East 20°688Lower1543°22′21″ N, 130°10′7″ E
40C10.21Age ClassDue North694Lower1543°21′15″ N, 130°10′59″ E
C20.21Middle-aged forestNortheast by East 10°689Lower1543°21′52″ N, 130°10′26″ E
C30.21Middle-aged forestNortheast by East 20°681Lower1043°22′23″ N, 130°10′8″ E
Table 2. Sample site survey.
Survey ObjectNumber of SurveysIndicators
TreesAll surveyedTree height, DBH, canopy density, mortality rate, disease and pest rate, diversity composite index, volume
Shrubs5 quadrats of 5 m × 5 m along the diagonalSpecies, cover, height, biomass, diversity index, carbon content, water content
Herbaceous5 quadrats of 1 m × 1 m within shrub quadratsSpecies, cover, height, biomass, diversity index, carbon content, water content
Litter5 quadrats of 1 m × 1 m along the diagonalMaximum water-holding capacity, biomass, carbon content
Soil2 soil profiles with a diameter of 0.8 mMaximum water-holding capacity, soil water content
Table 3. Multifunctional evaluation indicators.
Objective LayerCriterion LayerAlternative Layer
Forest MultifunctionalityWater Conservation FunctionSlope, Crown Cover, Shrub Layer Cover, Soil Water Storage Capacity, Herbaceous Layer Cover, Litter Layer Water Storage Capacity
Carbon Sequestration FunctionTree Layer Carbon Storage, Shrub and Herb Layer Carbon Storage, Litter Layer Carbon Storage, Soil Layer Carbon Storage
Biodiversity FunctionCanopy Density, Conifer to Broadleaf Ratio, Diversity Index
Social Service FunctionWind Damage Rate, Mortality Rate, Pest and Disease Incidence Rate
Table 4. Evaluation indicators.
PlotCanopy DensityConifer–Broadleaf RatioMortality RateShrub CoverHerbaceous CoverWindthrow and Breakage RateSoil Water-Holding Capacity (t/kha)Litter Interception amount(t·hm−2)Tree Carbon Content (t/ha)Litter Carbon Content (kg/m2)Soil Carbon Content (/cm2)Cumulative Crown Projection (km)Pest and Diseases Infestation RateShrub–Herb Biomass (t/ha)Biodiversity Composite Index
A10.7 a0.2 a0.2 a25.6 a74.0 a0.05 a7.0 a6.6 a54.1 a1.4 a3.3 a1.6 a10.0 a23 a0.7 a
A20.7 a0.3 a0.2 a22.2 a40.5 a0.06 a3.2 a14.0 a78.0 a2.2 a2.4 a1.3 a10.0 a23.5 a0.3 a
A30.7 a0.3 a0.1 a12.8 a69.0 a0.02 a3.6 a8.6 a65.1 a1.2 a5.4 a1.1 a8.0 a20.5 a0.3 a
B10.5 a0.2 a0.2 a6.2 b67.0 a0.03 b7.1 a10.0 a66.0 b1.6 a4.4 a1.0 a8.0 b26 a0.8 a
B20.7 a0.2 a0.1 a7.8 b59.5 a0.01 b9.6 a13.0 a124.2 b2.2 a4.0 a1.9 a5.0 b13.5 a0.6 a
B30.7 a0.3 a0.2 a3.0 b81.5 a0.01 b5.9 a16.1 a132.5 b2.4 a3.6 a1.2 a5.0 b21.5 a0.8 a
C10.8 a0.2 a0.1 a6.8 b99.0 a0.01 b3.0 a6.7 a97.3 b1.6 a4.9 a1.3 a8.0 c24 a0.7 a
C20.8 a0.2 a0.1 a4.2 b37.6 a0.01 b6.8 a9.3 a122.0 b1.9 a5.0 a1.0 a8.0 c6 a0.6 a
C30.8 a0.3 a0.1 a5.2 b78.5 a0.02 b3.8 a6.3 a102.2 b1.0 a2.1 a1.5 a8.0 c44.2 a0.8 a
Different lowercase letters in the table reflect the differences between different thinning intensities (p < 0.05).
Table 5. Basic information of sample sites.
Thinning IntensityPlot NumberCanopy DensityStem Density (Plants/ha)Average Tree Height (m)Average DBH (cm)Volume (m³/ha)Needle Width RatioDeath RateCumulative Crown Width (m/ha)Shrub Layer CoverageHerb CoverageWind Reversal RateSoil Water Storage Capacity (t/hm2)Water Storage Capacity of Litter Layer (t/hm2)Carbon Storage of Tree Layer (t/hm2)
0A10.7 a876 a13.1 a11.55 a296.00 a0.2 0.2 156925.6 74.0 0.05 6981.5 6.6 54.1
A20.65 a667 a13.3 a11.68 a238.67 a0.3 0.2 1271 22.2 40.5 0.06 3225.8 14.0 78.0
A30.71 a700 a13.9 a11.91 a265.65 a0.3 0.1 1148 12.8 69.0 0.02 3644.3 8.6 65.1
20B10.5 a555 a12.8 a11.14 a175.60 a0.2 0.2 992 6.2 67.0 0.03 7090.6 10.0 66.0
B20.7 a1213 a12.8 a10.40 a352.19 a0.2 0.1 1870 7.8 59.5 0.01 9633.6 13.0 124.2
B30.65 a640 a14.7 a12.23 a256.90 a0.3 0.2 1226 3.0 81.5 0.01 5916.8 16.1 132.5
40C10.76 a675 b12.2 a10.60 a196.05 a0.2 0.1 1336 6.8 99.0 0.01 2993.1 6.7 97.3
C20.8 a983 b11.8 a9.57 a237.50 a0.2 0.1 975 4.2 37.6 0.01 6799.9 9.3 122.0
C30.75 a620 b14.2 a12.71 a256.90 a0.3 0.1 1508 5.2 78.5 0.02 3775.7 6.3 102.2
Different lowercase letters in the table reflect the differences between different thinning intensities (p < 0.05).
Table 6. Multifunctional level classification.
Mi[0, 33][34, 66][67, 100]
Multifunctional levelPoorMediumExcellent
Table 7. Criteria layer judgment matrix.
Criterion LayerBiodiversity ConservationWater ConservationCarbon SinkSocial ServiceWeight Vector
Biodiversity conservation1.003.003.005.000.54
Water conservation0.331.001.001.670.18
Carbon sink0.331.001.001.670.18
Social service0.200.600.601.000.11
λ m a x = 4.02 , CI = 0.01, RI = 0.9, CR = 0.01 < 0.1
Table 8. Water source conservation function judgment matrix.
Criterion LayerSlopeCrown DiameterShrub Layer CoverageHerb CoverageSoil Water Storage CapacityWater Storage Capacity of Litter LayerWeight Vector
Slope1.004.008.007.002.004.000.47
Crown diameter0.251.002.001.750.501.000.12
Shrub layer coverage0.130.501.000.880.250.500.06
Herb coverage0.140.571.141.000.290.570.07
Soil water storage capacity0.502.004.000.291.002.000.16
Water storage capacity of litter layer0.251.002.000.572.001.000.12
λ m a x = 6.13 , C I = 0.03, RI = 1.62, CR = 0.02 < 0.1
Table 9. Carbon sink function judgment matrix.
Criterion LayerCarbon Storage of Tree LayerCarbon Storage in the Shrub LayerCarbon Storage in Litter LayerSoil Layer Carbon StorageWeight Vector
Carbon storage of tree layer1.005.006.005.000.64
Carbon storage in the shrub layer0.201.000.831.000.12
Carbon storage in litter layer0.171.201.000.860.12
Soil layer carbon storage0.201.001.171.000.13
λ m a x = 4.02 , CI = 0.01, RI = 0.9, CR = 0.01 < 0.1
Table 10. Biodiversity Function Judgment Matrix.
Criterion LayerDiversity IndexCanopy DensityConiferous and Broad-Leaved RatioWeight Vector
Diversity index1.001.001.000.33
Canopy density1.001.001.000.33
Needle width ratio1.001.001.000.33
λmax = 3, CI = 0, RI = 0, CR = 0 < 0.1
Table 11. Social service function judgment matrix.
Criterion LayerDeath RatePest and Disease RateWind Reversal RateWeight Vector
Death rate1.001.001.000.33
Pest and disease rate1.001.001.000.33
Wind reversal rate1.001.001.000.33
λ m a x = 3 , CI = 0, RI = 0, CR = 0 < 0.1
Table 12. Indicator weights based on AHP.
Total WeightFactor Layer WeightsBenchmark Layer Weight
Biodiversity conservation function A (0.54)Diversity composite index (0.333)Diversity index a1 (0.18)
Canopy density (0.333)Canopy density a2 (0.18)
Coniferous and broad-leaved ratio (0.333)Coniferous and broad-leaved ratio a3 (0.18)
Water conservation function B (0.18)Slope (0.47)Slope b1 (0.08)
Crown diameter (0.12)Crown diameterb2 (0.02)
Shrub layer coverage (0.06)Shrub layer coverage b3 (0.01)
Herb coverage (0.07)Herb coverage b4 (0.01)
Soil water storage capacity (0.16)Soil water storage capacity b5 (0.03)
Water storage capacity of litter layer (0.13)Water storage capacity of litter layer b6 (0.02)
Carbon sink function C (0.18)Carbon storage of tree layer (0.64)Carbon storage of tree layerc1 (0.12)
Carbon storage in the shrub layer (0.12)Carbon storage in the shrub layerc2 (0.02)
Carbon storage in litter layer (0.12)Carbon storage in litter layer c3 (0.02)
Soil layer carbon storage (0.13)Soil layer carbon storage c4 (0.02)
Social service function D (0.11)Death rate (0.33)Death rate d1 (0.04)
Pest and disease rate (0.33)Pest and disease rate d2 (0.04)
Wind reversal rate (0.33)Wind reversal rate d3 (0.04)
Table 13. Analytic Hierarchy Process scores.
Sample PlotBiodiversity Conservation Function Water Conservation FunctionCarbon Sink FunctionSocial Service Function Multifunctional ValueScoreLevel
A10.820.530.490.280.6530 aPoor
A20.670.490.640.280.590 aPoor
A30.720.280.560.620.618 aPoor
B10.770.350.580.400.6318Poor
B20.770.440.730.690.7362 bMedium
B30.870.370.910.750.7889 bExcellent
C10.840.270.750.620.7153 bMedium
C20.760.280.580.680.6843 bPoor
C30.980.430.710.670.81100 bExcellent
Different lowercase letters in the table reflect the differences between different thinning intensities (p < 0.05).
Table 14. Indicator weights based on EWM.
Total WeightFactor Layer WeightsBenchmark Layer Weight
Biodiversity conservation function A (0.27)Diversity composite index (0.333)Diversity index a1 (0.09)
Canopy density (0.41)Canopy density a2 (0.11)
Conifer–broadleaf ratio (0.26)Coniferous and broad-leaved ratio a3 (0.07)
Water conservation function B (0.30)Slope (0.34)Slope b1 (0.12)
Crown diameter (0.11)Crown diameterb2 (0.04)
Shrub layer coverage (0.13)Shrub layer coverage b3 (0.05)
Herb coverage (0.11)Herb coverage b4 (0.04)
Soil water storage capacity (0.05)Soil water storage capacity b5 (0.02)
Water storage capacity of litter layer (0.08)Water storage capacity of litter layer b6 (0.03)
Carbon sink function C (0.27)Carbon storage of tree layer (0.12)Carbon storage of tree layerc1 (0.06)
Carbon storage in the shrub layer (0.04)Carbon storage in the shrub layerc2 (0.01)
Carbon storage in litter layer (0.56)Carbon storage in litter layer c3 (0.14)
Soil layer carbon storage (0.28)Soil layer carbon storage c4 (0.06)
Social service function D (0.15)Death rate (0.33)Death rate d1 (0.06)
Pest and disease rate (0.27)Pest and disease rate d2 (0.14)
Wind reversal rate (0.40)Wind reversal rate d3 (0.05)
Table 15. Entropy weight method score.
Sample PlotBiodiversity Conservation Function Water Conservation FunctionCarbon Sink FunctionSocial Service Function Multifunctional ValueScoreLevel
A10.110.270.140.060.6031 aPoor
A20.080.240.160.060.5921 aPoor
A30.090.180.160.140.564 aPoor
B10.110.180.170.080.560Poor
B20.100.230.170.150.6882 bExcellent
B30.120.190.190.160.71100 bExcellent
C10.110.160.190.140.6351 cMedium
C20.100.150.150.150.6244 cMedium
C30.130.160.160.150.6458 cMedium
Different lowercase letters in the table reflect the differences between different thinning intensities (p < 0.05).
Table 16. Indicator weights based on CM.
Total WeightFactor Layer WeightsBenchmark Layer Weight
Biodiversity conservation function A (0.14)Diversity composite index (0.50)Diversity index a1 (0.07)
Canopy density (0.21)Canopy density a2 (0.03)
Conifer–broadleaf ratio (0.29)Coniferous and broad-leaved ratio a3 (0.04)
Water conservation function B (0.38)Slope (0.13)Slope b1 (0.10)
Crown diameter (0.11)Crown diameterb2 (0.05)
Shrub layer coverage (0.26)Shrub layer coverage b3 (0.07)
Herb coverage (0.13)Herb coverage b4 (0.07)
Soil water storage capacity (0.18)Soil water storage capacity b5 (0.06)
Water storage capacity of litter layer (0.18)Water storage capacity of litter layer b6 (0.07)
Carbon sink function C (0.26)Carbon storage of tree layer (0.23)Carbon storage of tree layerc1 (0.06)
Carbon storage in the shrub layer (0.27)Carbon storage in the shrub layerc2 (0.07)
Carbon storage in litter layer (0.23)Carbon storage in litter layer c3 (0.06)
Soil layer carbon storage (0.27)Soil layer carbon storage c4 (0.07)
Social service function D (0.22)Death rate (0.41)Death rate d1 (0.09)
Pest and disease rate (0.23)Pest and disease rate d2 (0.05)
Wind reversal rate (0.36)Wind reversal rate d3 (0.08)
Table 17. CRITIC score.
Sample PlotBiodiversity Conservation Function Water Conservation FunctionCarbon Sink FunctionSocial Service Function Multifunctional ValueScoreLevel
A10.110.270.180.060.5832 aPoor
A20.080.230.180.060.540 aPoor
A30.090.170.190.140.5720 aPoor
B10.110.180.180.080.545Poor
B20.100.230.190.150.6693 bExcellent
B30.120.190.200.160.67100 bExcellent
C10.120.160.190.140.6152 cMedium
C20.100.150.150.150.5727 cPoor
C30.140.160.180.160.6365 cMedium
Different lowercase letters in the table reflect the differences between different thinning intensities (p < 0.05).
Table 18. Classification of multifunctional evaluation levels for various locations.
Sample PlotAHPEWMCRITIC
A1PoorPoorPoor
A2PoorPoorPoor
A3PoorPoorPoor
B1PoorPoorPoor
B2MediumExcellentExcellent
B3ExcellentExcellentExcellent
C1MediumMediumMedium
C2PoorMediumPoor
C3ExcellentMediumMedium
Table 19. Kappa consistency test results.
AHPEWMCM
AHP10.470.63
EWM0.4710.83
CM0.630.831
Table 20. Correlation between various functions.
CorrelationBiodiversity Conservation Function Water Conservation FunctionCarbon Sink FunctionSocial Service Function
Biodiversity conservation function1−0.0690.1170.447
Water conservation function−0.0691−0.425−0.668 *
Carbon sink function0.117−0.42510.677 *
Social service function 0.447−0.668 *0.677 *1
* indicates significant correlation.
Table 21. Social service function to carbon sink function model.
Social Service Function–Carbon Sink FunctionModel β 0 β 1 β 2 β 3 R 2
Linear y = β 0 + β 1 x 0.1380.875 0.459
Quadratic curve y = β 0 + β 1 x + β 2 x 2 0.097−0.2051.094 0.461
Composite curve ln y = ln β 0 + x ln β 1 4.84 × 10−41106.1 0.057
Growth curve ln y = β 0 + β 1 x −7.6327.009 0.057
Logarithmic curve y = β 0 + β 1 ln x 0.8530.277 0.447
Cubic curve y = β 0 + β 1 x + β 2 x 2 + β 3 x 3 0.0032.261−3.1441.9330.690
S-curve ln y = β 0 + β 1 / x −3.521−0.088 0.005
Exponential curve ln y = ln β 0 + β 1 x 4.84 × 10−47.009 0.057
Inverse function y = β 0 + β 1 / x 0.744−0.32 0.349
Power function ln y = ln β 0 + β 1 ln x 0.001−2.298 0.141
Logistic function y = 1 1 μ + β 0 β 1 x 20640.001 0.057
Table 22. Coupling relationship model between different functions and multifunctional values.
MethodFunctionModel
AHP F1Biodiversity conservation function A1A1 = 0.33a1 + 0.33a2 + 0.33a3
Water conservation function B1B1 = 0.48b1 + 0.12b2 + 0.06b3 + 0.07b4 + 0.15b5 + 0.13b6
Carbon sink function C1C1 = 0.64c1 + 0.12c2 + 0.12c3
Social service function D1D1 = 0.33d1 + 0.33d2 + 0.33d3
Multifunctional valueF1 = 0.54A1 + 0.18B1 + 0.18C1 + 0.11D1
EWM F2Biodiversity conservation function A2A2 = 0.33a1 + 0.41a2 + 0.26a3
Water conservation function B2B2 = 0.34b1 + 0.11b2 + 0.13b3 + 0.11b4 + 0.05b5 + 0.08b6
Carbon sink function C2C2 = 0.04c1 + 0.28c2 + 0.56c3
Social service function D2D2 = 0.33d1 + 0.27d2 + 0.40d3
Multifunctional valueF2 = 0.27A2 + 0.30B2 + 0.27C2 + 0.15D2
CM F3Biodiversity conservation function A3A2 = 0.50a1 + 0.21a2 + 0.29a3
Water conservation function B3B2 = 0.13b1 + 0.11b2 + 0.26b3 + 0.13b4 + 0.18b5 + 0.18b6
Carbon sink function C3C2 = 0.23c1 + 0.27c2 + 0.27c3
Social service function D3D2 = 0.41d1 + 0.23d2 + 0.36d3
Multifunctional valueF3 = 0.14A3 + 0.38B3 + 0.26C3 + 0.22D3
Table 23. Target structural system of spruce–fir forests.
Forest Stand Structure FactorTarget StructureForest Stand Structure FactorTarget Structure
Stand volume250~300 m3/haDBH structureInverted J-shaped distribution
Tree species compositionBroad-leaved tree species ≥20%Horizontal distributionRandom distribution
Canopy density0.7~0.8Vertical structureArbor, shrub, and grass laminated forest
Plant density620 plants/haPest and disease rate≤8%
Herbal coverage≥75%Shrub coverage≥5%
Disclaimer/Publisher’s Note: The statements, opinions and data contained in all publications are solely those of the individual author(s) and contributor(s) and not of MDPI and/or the editor(s). MDPI and/or the editor(s) disclaim responsibility for any injury to people or property resulting from any ideas, methods, instructions or products referred to in the content.

