Effects of Litter Removal and Biochar Application on Soil Properties in Urban Forests of Southern China

 , , and
Abstract
:1. Introduction
2. Materials and Methods
2.1. Study Site
2.2. Experimental Design
2.3. Soil Sample Collection and Processing
2.4. Measurements of Soil Properties
2.5. Statistical Analysis
3. Results
4. Discussion
5. Conclusions
Author Contributions
Funding
Data Availability Statement
Acknowledgments
Conflicts of Interest
References
- Nowak, D.J.; Hirabayashi, S.; Bodine, A.; Greenfield, E. Tree and forest effects on air quality and human health in the United States. Environ. Pollut. 2014, 193, 119–129. [Google Scholar] [CrossRef] [PubMed]
- Endreny, T.A. Strategically growing the urban forest will improve our world. Nat. Commun. 2018, 9, 1160. [Google Scholar] [CrossRef] [PubMed]
- Huovila, A.; Siikavirta, H.; Rozado, C.; Rökman, J.; Tuominen, P.; Paiho, S.; Hedman, A.; Ylén, P. Carbon-neutral cities: Critical review of theory and practice. J. Clean. Prod. 2022, 341, 130912. [Google Scholar] [CrossRef]
- Endreny, T.; Santagata, R.; Perna, A.; De Stefano, C.; Rallo, R.F.; Ulgiati, S. Implementing and managing urban forests: A much needed conservation strategy to increase ecosystem services and urban wellbeing. Ecol. Model. 2017, 360, 328–335. [Google Scholar] [CrossRef]
- O’Brien, L.E.; Urbanek, R.E.; Gregory, J.D. Ecological functions and human bene ts of urban forests. Urban For. Urban Green. 2022, 75, 127707. [Google Scholar] [CrossRef]
- Krishna, M.P.; Mohan, M. Litter decomposition in forest ecosystems: A review. Energy Ecol. Environ. 2017, 2, 236–249. [Google Scholar] [CrossRef]
- Morffi-Mestre, H.; Ángeles-Pérez, G.; Powers, J.S.; Andrade, J.L.; Feldman, R.E.; May-Pat, F.; Chi-May, F.; Dupuy-Rada, J. Leaf litter decomposition rates: Influence of successional age, topography and microenvironment on six dominant tree species in a tropical dry forest. Front. For. Glob. Chang. 2023, 6, 1082233. [Google Scholar] [CrossRef]
- Kurmangozhinov, A.; Xue, W.; Li, X.; Zeng, F.; Sabit, R.; Tusun, T. High biomass production with abundant leaf litterfall is critical to ameliorating soil quality and productivity in reclaimed sandy desertification land. J. Environ. Manag. 2020, 263, 110373. [Google Scholar] [CrossRef]
- Giweta, M. Role of litter production and its decomposition, and factors affecting the processes in a tropical forest ecosystem: A review. J. Ecol. Environ. 2020, 44, 11. [Google Scholar] [CrossRef]
- Gomyo, M.; Kuraji, K. Effect of the litter layer on runoff and evapotranspiration using the paired watershed method. J. For. Res. 2016, 21, 306–313. [Google Scholar] [CrossRef]
- Cao, Y.; Li, X.; Li, Y.; Guo, J.; Qi, Y. Quantification and proxy indicators of the carbon pool in urban tree litterfall: A case study of urban green spaces in Beijing. Forests 2024, 15, 144. [Google Scholar] [CrossRef]
- Ferreira, M.L.; Souza, L.C.; Conti, D.D.M.; Quaresma, C.C.; Tavares, A.R.; da Silva, K.G.; Kniess, C.T.; Camargo, P.B.D. Soil biodiversity in urban forests as a consequence of litterfall management: Implications for São Paulo’s ecosystem services. Sustainability 2018, 10, 684. [Google Scholar] [CrossRef]
- Hill, S.K.; Hale, R.L.; Grinath, J.B.; Folk, B.T.; Nielson, R.; Reinhardt, K. Looking beyond leaves: Variation in nutrient leaching potential of seasonal litterfall among different species within an urban forest. Urban Ecosyst. 2022, 25, 1097–1109. [Google Scholar] [CrossRef]
- Rahman, M.A.; Pawijit, Y.; Xu, C.; Moser-Reischl, A.; Pretzsch, H.; Rotzer, T.; Pauleit, S. A comparative analysis of urban forests for storm-water management. Sci. Rep. 2023, 13, 1451. [Google Scholar] [CrossRef] [PubMed]
- Templer, P.; Templer, T.J.W.; Hutyra, L.R.; Raciti, S.M. Nitrogen and carbon export from urban areas through removal and export of litterfall. Environ. Pollut. 2015, 197, 256–261. [Google Scholar] [CrossRef]
- Cheng, Y.; Chen, J.; Zhu, J.; Li, Z.; Wu, J. Effects of litter removal and biochar addition on soil microbial biomass and community structure in a subtropical forest. Appl. Soil Ecol. 2021, 169, 104148. [Google Scholar]
- Fierer, N. Embracing the unknown: Disentangling the complexities of the soil microbiome. Nat. Rev. Microbiol. 2017, 15, 579–590. [Google Scholar] [CrossRef]
- Kotze, D.; Ghosh, S.; Hui, N.; Jumpponen, A.; Lee, B.; Lu, C.; Lum, S.; Pouyat, R.; Szlavecz, K.; Wardle, D.; et al. Urbanization minimizes the effects of plant traits on soil provisioned ecosystem services across climatic regions. Glob. Chang. Biol. 2021, 27, 4139–4153. [Google Scholar] [CrossRef]
- Lehmann, J.; Joseph, S. Biochar for Environmental Management: Science, Technology and Implementation; Taylor & Francis: Milton Park, UK, 2024. [Google Scholar]
- Kookana, R.S.; Sarmah, A.K.; van Zwieten, L.; Krull, E.; Singh, B. Biochar application to soil: Agronomic and environmental benefits and unintended consequences. Adv. Agron. 2011, 112, 103–143. [Google Scholar]
- Spokas, K.A.; Novak, J.M.; Venterea, R.T.; Baker, J.M. Biochar’s role as an alternative N-fertilizer: Ammonia capture. Plant Soil 2012, 350, 35–42. [Google Scholar] [CrossRef]
- Song, Y.; Zheng, Z.; Yu, Z.; Li, Q. The effects of biochar addition on soil microbial community structure and function after litter removal in a subtropical forest. Eur. J. Soil Biol. 2021, 102, 103347. [Google Scholar]
- Somerville, P.D.; Farrell, C.; May, P.B.; Livesley, S.J. Biochar and compost equally improve urban soil physical and biological properties and tree growth, with no added benefit in combination. Sci. Total Environ. 2020, 706, 135736. [Google Scholar] [CrossRef] [PubMed]
- Luo, Z.; Feng, W.; Luo, Y.; Baldock, J.; Wang, E. Soil organic carbon dynamics jointly controlled by climate, carbon inputs, soil properties and soil carbon fractions. Glob. Chang. Biol. 2017, 23, 4430–4439. [Google Scholar] [CrossRef] [PubMed]
- Güsewell, S.; Gessner, M.O. N:P ratios influence litter decomposition and colonization by fungi and bacteria in microcosms. Funct. Ecol. 2009, 23, 211–219. [Google Scholar] [CrossRef]
- Lin, L.; Guo, Q.; Wang, J.; Yu, Z.; Xu, Z. Effects of Camphor tree (Cinnamomum camphora) on soil microbial community and soil enzyme activities in an urban forest ecosystem. Urban For. Urban Green. 2020, 48, 126571. [Google Scholar]
- Li, Y.; Li, X. Morphological diversity and spatial distribution of Cinnamomum camphora (L.) Presl in urban green spaces: A case study in Xi’an, China. Urban For. Urban Green. 2019, 40, 168–175. [Google Scholar]
- Escobedo, F.J.; Kroeger, T.; Wagner, J.E. Urban forests and pollution mitigation: Analyzing ecosystem services and disservices. Environ. Pollut. 2011, 159, 2078–2087. [Google Scholar] [CrossRef]
- Yang, J.; McBride, J.; Zhou, J.; Sun, Z. The urban forest in Beijing and its role in air pollution reduction. Urban For. Urban Green. 2005, 3, 65–78. [Google Scholar] [CrossRef]
- Zhang, J.; Liu, X.; Chen, Z.; Han, X.; Zhang, W.; Zhong, W. Response of microbial biomass carbon and nitrogen to land use change: A meta-analysis. Appl. Soil Ecol. 2021, 168, 104129. [Google Scholar]
- Jeffery, S.; Verheijen, F.G.; van der Velde, M.; Bastos, A.C. A quantitative review of the effects of biochar application to soils on crop productivity using meta-analysis. Agric. Ecosyst. Environ. 2011, 144, 175–187. [Google Scholar] [CrossRef]
- Carlyle, C.N.; Fraser, L.H.; Turkington, R. Spatial and temporal patterns of soil water availability in a temperate grassland ecosystem. Ecohydrology 2019, 12, e2073. [Google Scholar]
- Meng, F.; Hu, L.; Zhang, H.; Yu, L. Effects of litter removal and addition on soil moisture, soil temperature, and soil respiration in a subtropical secondary forest in China. Forests 2019, 10, 225. [Google Scholar]
- Zheng, H.; Zhang, Z.; Wang, C.; Zhang, Y.; Liu, S. Influence of biochar on soil properties and microbial community composition in a subtropical forest in Southern China. Forests 2020, 11, 1043. [Google Scholar]
- Joseph, S.; Cowie, A.L.; Van Zwieten, L.; Bolan, N.; Budai, A.; Buss, W.; Cayuela, M.L.; Graber, E.R.; Ippolito, J.A.; Kuzyakov, Y.; et al. How biochar works, and when it doesn’t: A review of mechanisms controlling soil and plant responses to biochar. GCB Bioenergy 2021, 13, 1731–1764. [Google Scholar] [CrossRef]
- Wu, S.; Liu, X.; Bai, L.; Zhang, X.; Wu, J. Biochar soil amendments modify the impacts of land-use changes on soil moisture and temperature: Evidence from the Loess Plateau, China. Catena 2021, 203, 105296. [Google Scholar]
- Agegnehu, G.; Srivastava, A.K.; Bird, M.I. The role of biochar and biochar-compost in improving soil quality and crop performance: A review. Appl. Soil Ecol. 2017, 119, 156–170. [Google Scholar] [CrossRef]
- Novak, J.M.; Busscher, W.J.; Laird, D.L.; Ahmedna, M.; Watts, D.W.; Niandou, M.A.J.S. Impact of biochar amendment on fertility of a southeastern coastal plain soil. Soil Sci. 2009, 174, 105–112. [Google Scholar] [CrossRef]
- Rahman, M.H.; Chaturvedi, S.; Sharma, P. Impact of urbanization on hydrology and water quality: A review. Water 2020, 12, 366. [Google Scholar]
- Glaser, B.; Lehmann, J.; Zech, W. Ameliorating physical and chemical properties of highly weathered soils in the tropics with charcoal–A review. Biol. Fertil. Soils 2002, 35, 219–230. [Google Scholar] [CrossRef]
- Yahdjian, L.; Sala, O.E.; Austin, A.T. Differential controls of water input on litter decomposition and nitrogen dynamics in the Patagonian steppe. Ecosystems 2006, 9, 128–141. [Google Scholar] [CrossRef]
- Kammann, C.I.; Ratering, S.; Eckhard, C.; Müller, C. Biochar and hydrochar effects on greenhouse gas (carbon dioxide, nitrous oxide, and methane) fluxes from soils. J. Environ. Qual. 2011, 41, 1052–1066. [Google Scholar] [CrossRef] [PubMed]
- Blanco-Canqui, H.; Lal, R. No-tillage and soil-profile carbon sequestration: An on-farm assessment. Soil Sci. Soc. Am. J. 2008, 72, 693–701. [Google Scholar] [CrossRef]
- Jiang, J.; Zhang, L.; Xie, H.; Li, H. Effects of biochar addition on soil properties and rice production: A meta-analysis. Geoderma 2018, 319, 62–69. [Google Scholar]
- Lehmann, J.; da Silva, J.P., Jr.; Steiner, C.; Nehls, T.; Zech, W.; Glaser, B. Nutrient availability and leaching in an archaeological Anthrosol and a Ferralsol of the Central Amazon basin: Fertilizer, manure and charcoal amendments. Plant Soil 2003, 249, 343–357. [Google Scholar] [CrossRef]
- Joseph, S.; Lehmann, J.; Agegnehu, G. Biochar for climate change mitigation and soil health. Soil Tillage Res. 2010, 116, 109–134. [Google Scholar]
- Sohi, S.P.; Krull, E.; Lopez-Capel, E.; Bol, R. A review of biochar and its use and function in soil. Adv. Agron. 2010, 105, 47–82. [Google Scholar]
- Yu, Y.; Zhang, Y.; Wang, Q.; Liu, Y.; Liu, X. Responses of soil microbial communities and enzyme activities to litter removal and biochar addition in a subtropical forest. Forests 2020, 11, 1014. [Google Scholar]
- Liang, J.; Li, Q.; Gao, J.; Feng, J.; Zhang, X.; Wu, Y.; Yu, F. Biochar rhizosphere addition promoted Phragmites australis growth and changed soil properties in the Yellow River Delta. Sci. Total Environ. 2021, 761, 143291. [Google Scholar] [CrossRef]
- DeForest, J.L.; Zak, D.R.; Pregitzer, K.S.; Burton, A.J. Atmospheric nitrate deposition and the microbial degradation of cellobiose and vanillin in a northern hardwood forest. Soil Biol. Biochem. 2004, 36, 965–971. [Google Scholar] [CrossRef]
- Shen, J.; Yuan, L.; Zhang, J.; Li, H.; Bai, Z.; Chen, X.; Zhang, W.; Zhang, F. Phosphorus dynamics: From soil to plant. Plant Physiol. 2011, 156, 997–1005. [Google Scholar] [CrossRef]
- Zheng, H.; Wang, Z.; Deng, X.; Herbert, S.; Xing, B.; Liao, Y. Effects of biochar amendment on soil phosphorus availability and nutrient cycling: A meta-analysis. Sci. Total Environ. 2020, 717, 137187. [Google Scholar]
- Azeem, M.; Sun, T.; Jeyasundar, P.; Han, R.; Li, H.; Abdelrahman, H.; Shaheen, S.; Zhu, Y.; Li, G. Biochar-derived dissolved organic matter (BDOM) and its influence on soil microbial community composition, function, and activity: A review. Crit. Rev. Environ. Sci. Technol. 2023, 53, 1912–1934. [Google Scholar] [CrossRef]
- Qiu, H.; Liu, J.; Boorboori, M.; Li, D.; Chen, S.; Ma, X.; Cheng, P.; Zhang, H. Effect of biochar application rate on changes in soil labile organic carbon fractions and the association between bacterial community assembly and carbon metabolism with time. Sci. Total Environ. 2023, 855, 158876. [Google Scholar] [CrossRef]
- Fuentes, J.P.; Bown, H.E.; Perez-Quezada, J.F.; Franck, N. Litter removal in a sclerophyll forest: Short- and medium-term consequences for soil properties. Soil Sci. Soc. Am. J. 2014, 78, 634–644. [Google Scholar] [CrossRef]
- Nguyen, T.T.N.; Wallace, H.W.; Xu, C.; Zwieten, L.; Weng, Z.H.; Xu, Z.; Che, R.; Tahmasbian, I.; Hu, H.W.; Bai, S.H. The effects of short term, long term and reapplication of biochar on soil bacteria. Sci. Total Environ. 2018, 636, 142–151. [Google Scholar] [CrossRef]
- Jeffery, S.; Verhoeven, E.; van der Heijden, M. Biochar effects on soil properties and plant growth: A review of the literature. Agric. Ecosyst. Environ. 2017, 240, 158–175. [Google Scholar]
- Kabir, E.; Kim, K.H.; Kwon, E.E. Biochar as a tool for the improvement of soil and environment. Front. Environ. Sci. 2023, 11, 1324533. [Google Scholar]
- Manral, V.; Bargali, K.; Bargali, S.S.; Karki, H.; Chaturvedi, R.K. Seasonal dynamics of soil microbial biomass C, N and P along an altitudinal gradient in Central Himalaya, India. Sustainability 2023, 15, 1651. [Google Scholar] [CrossRef]
- Wang, Z.; Guo, L.; Li, W.; Feng, G. Impact of biochar on soil microbial biomass and community structure in poplar plantation soil with continuous monoculture. Catena 2020, 194, 104747. [Google Scholar]
- Dong, H.; Zhang, S.; Lin, J.; Zhu, B. Responses of soil microbial biomass carbon and dissolved organic carbon to drying-rewetting cycles: A meta-analysis. Catena 2021, 207, 105610. [Google Scholar] [CrossRef]


| Forest Type | Stand Density (Tree ha−1) | Mean DBH (cm) | Mean Tree Height (m) | Canopy Width (m) |
|---|---|---|---|---|
| Evergreen Broad-leaved Forests * | 1025 ± 325 | 22.2 ± 12.3 | 12.5 ± 4.3 | 4.9 × 5.1 |
| Soil Property. | Factor | df | F | p |
|---|---|---|---|---|
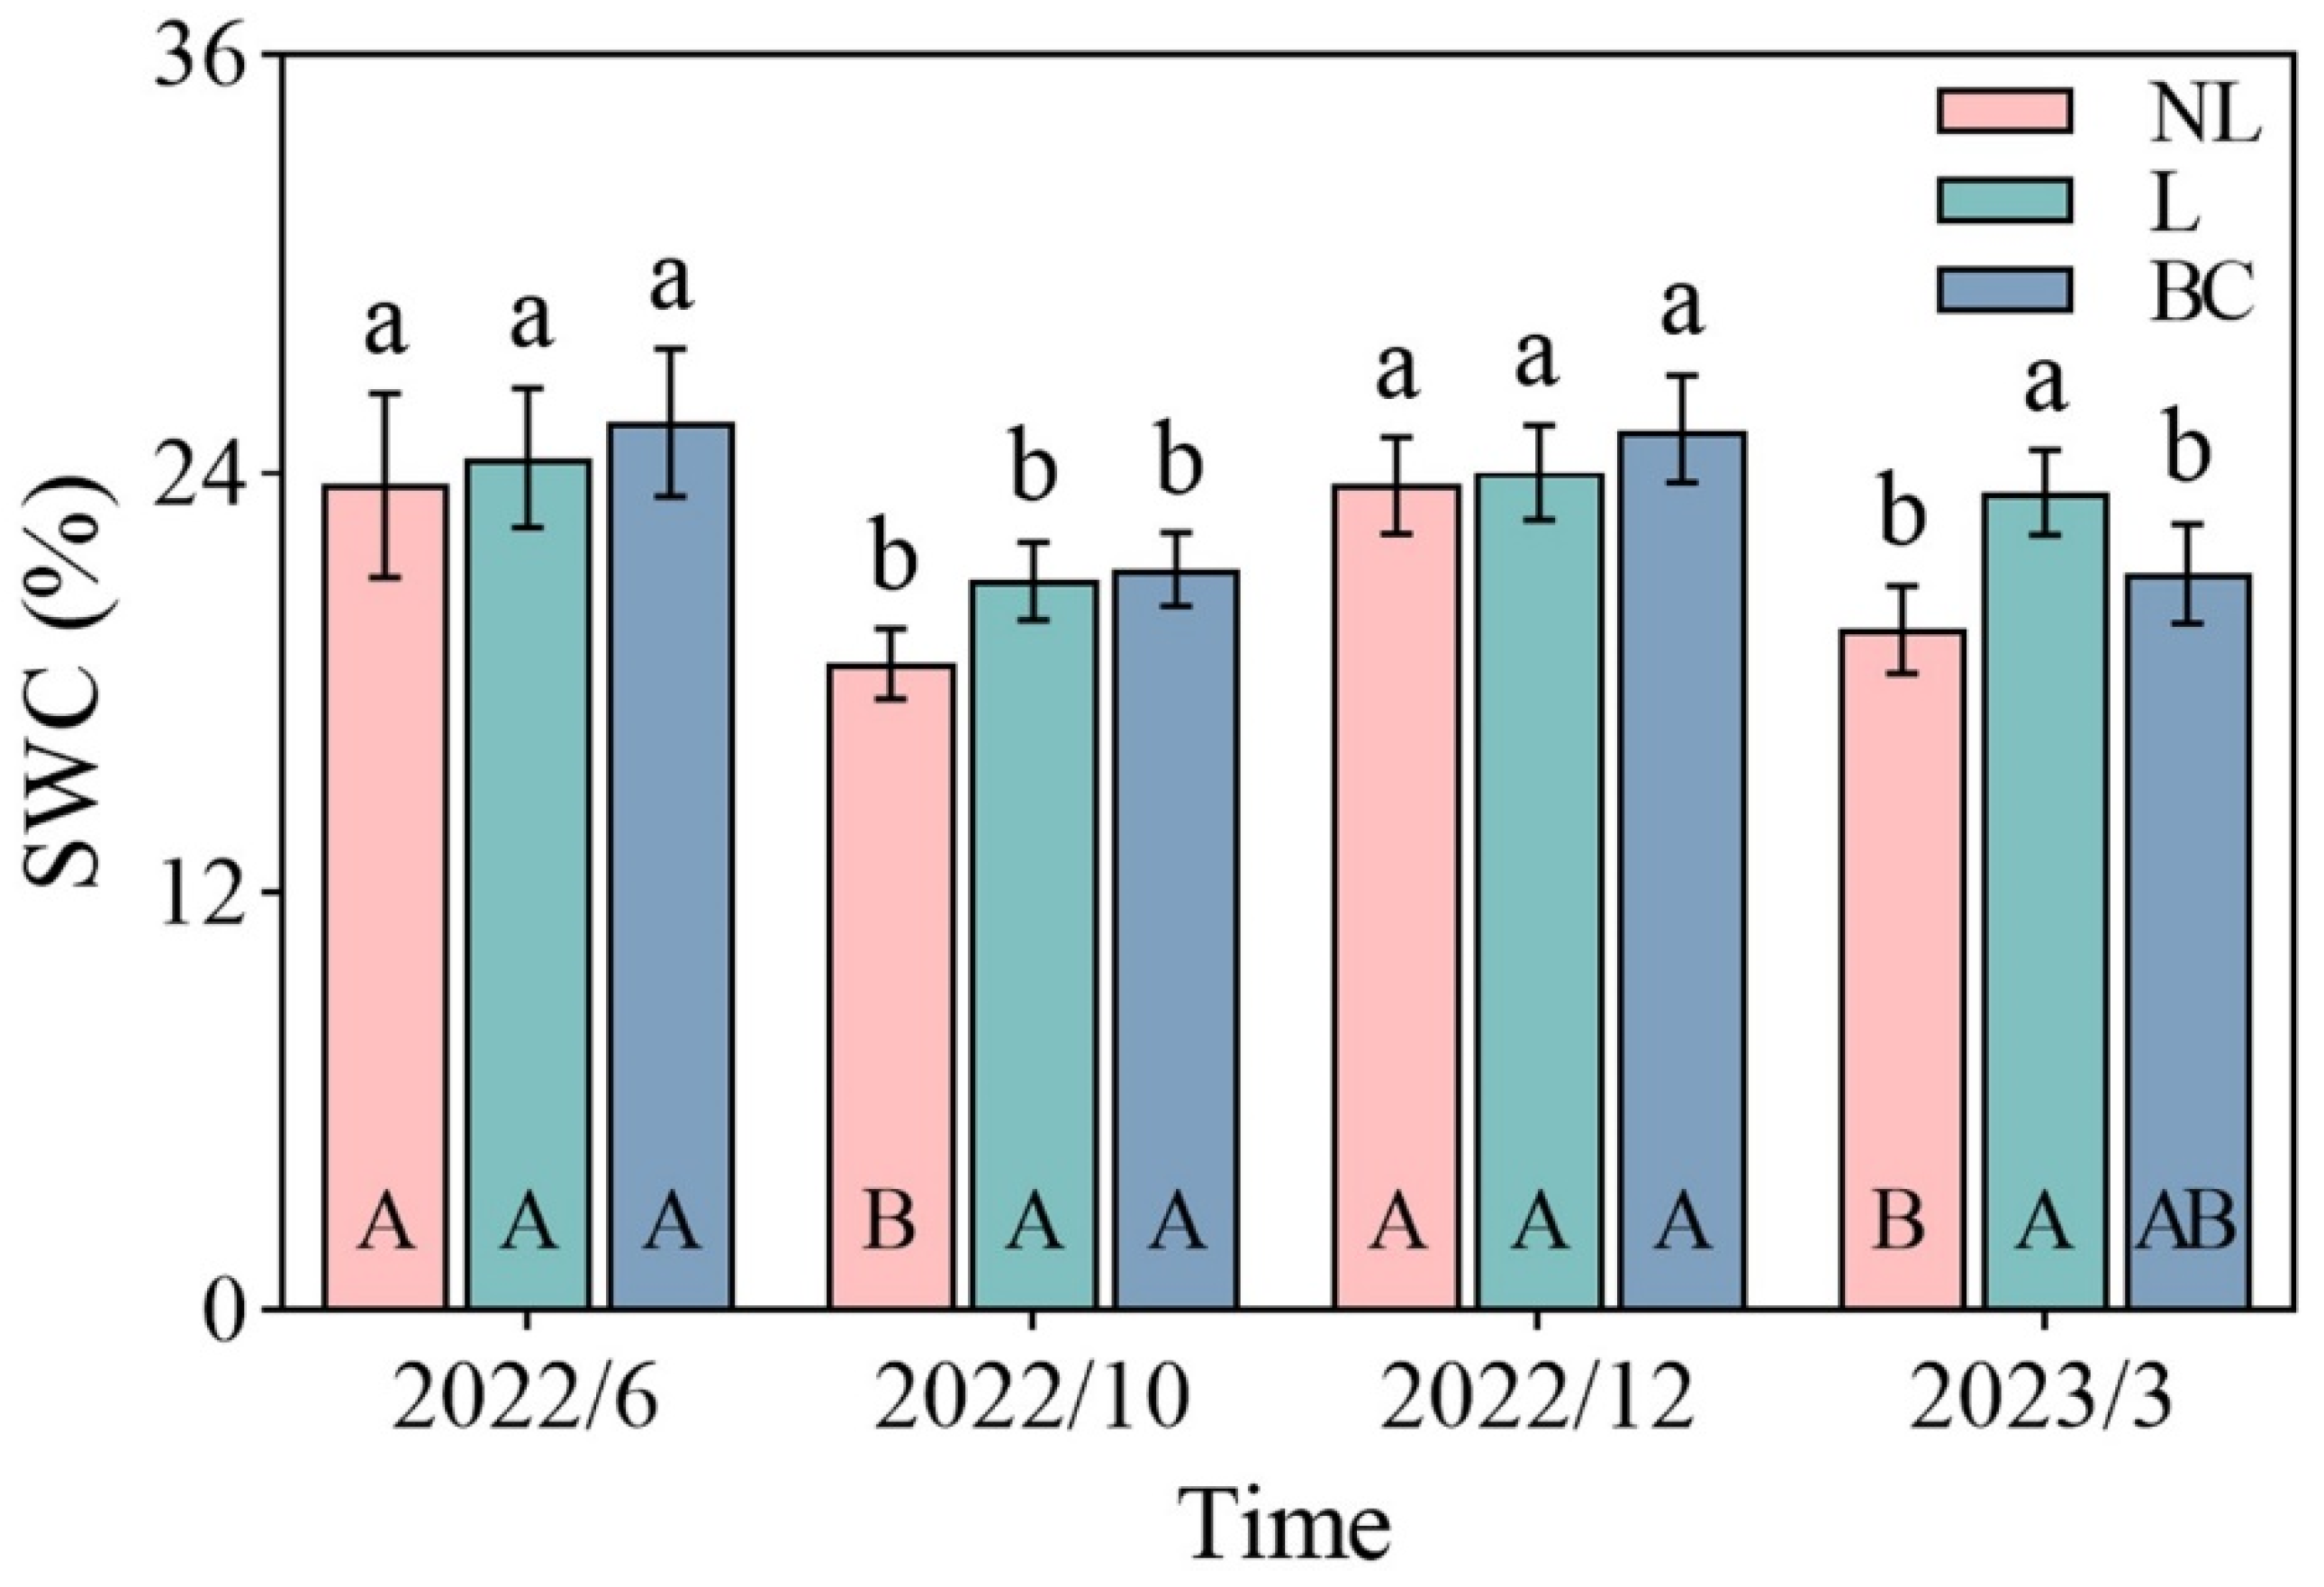
| SWC (%) | Time | 3 | 16.51 | *** |
| Treat | 2 | 5.79 | ** | |
| Time × Treat | 6 | 1.13 | ||
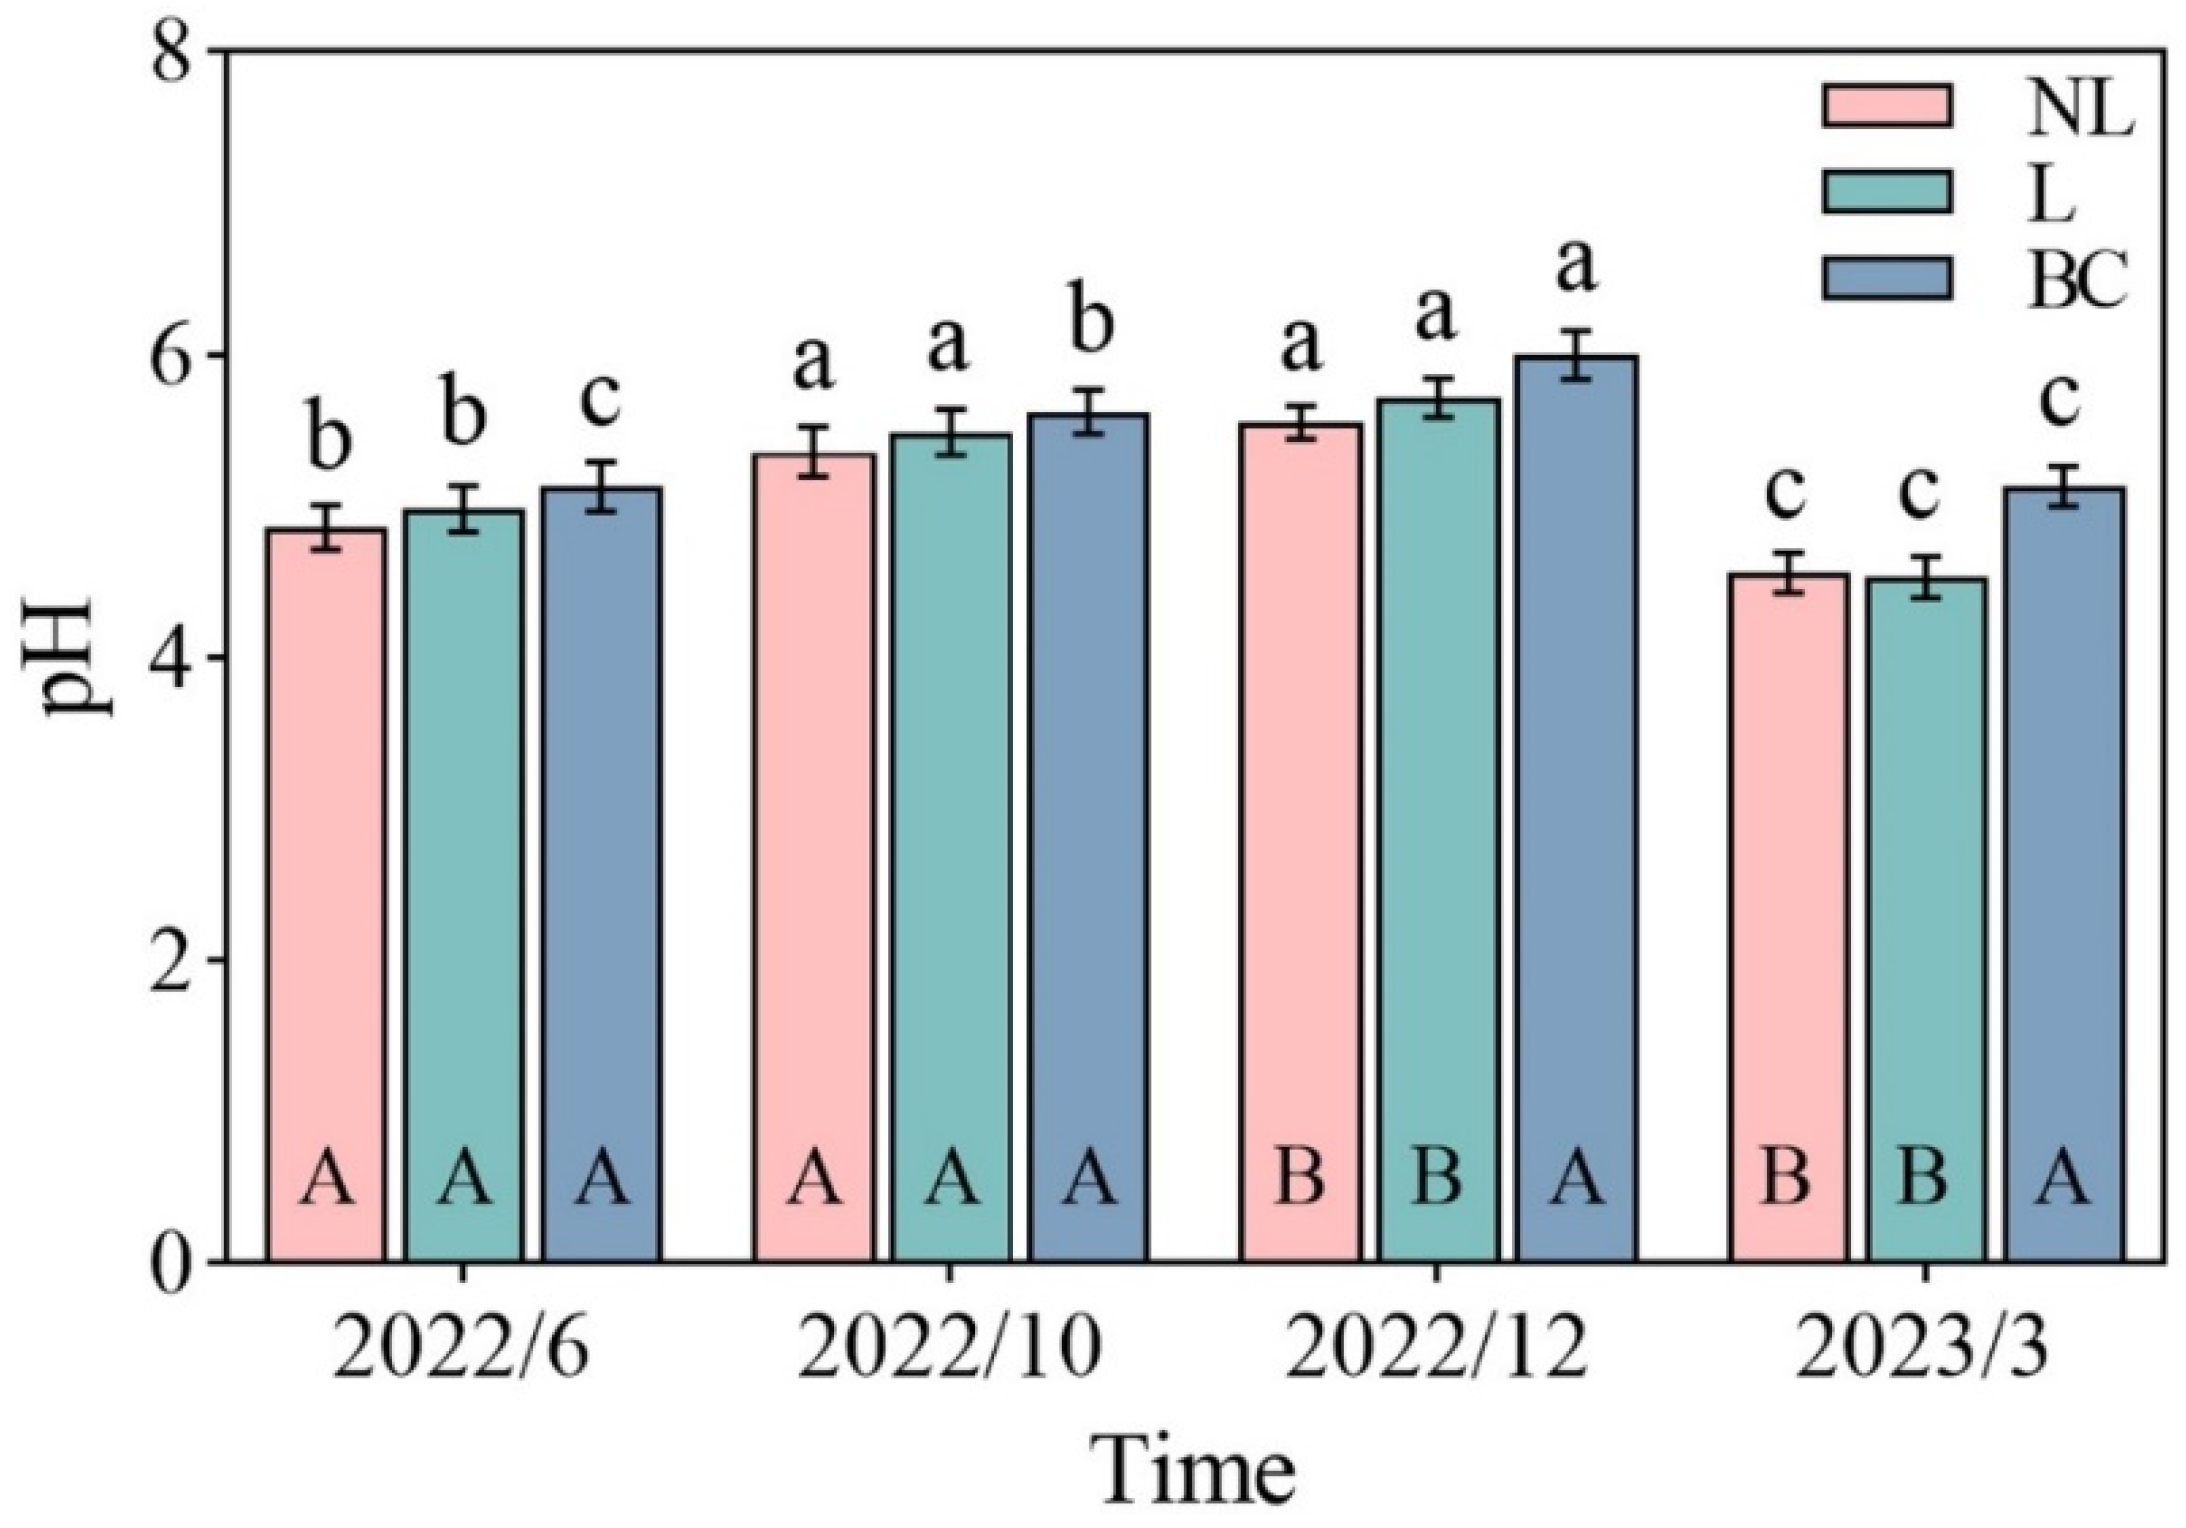
| pH | Time | 3 | 92.29 | *** |
| Treat | 2 | 23.20 | *** | |
| Time × Treat | 6 | 1.81 | ||
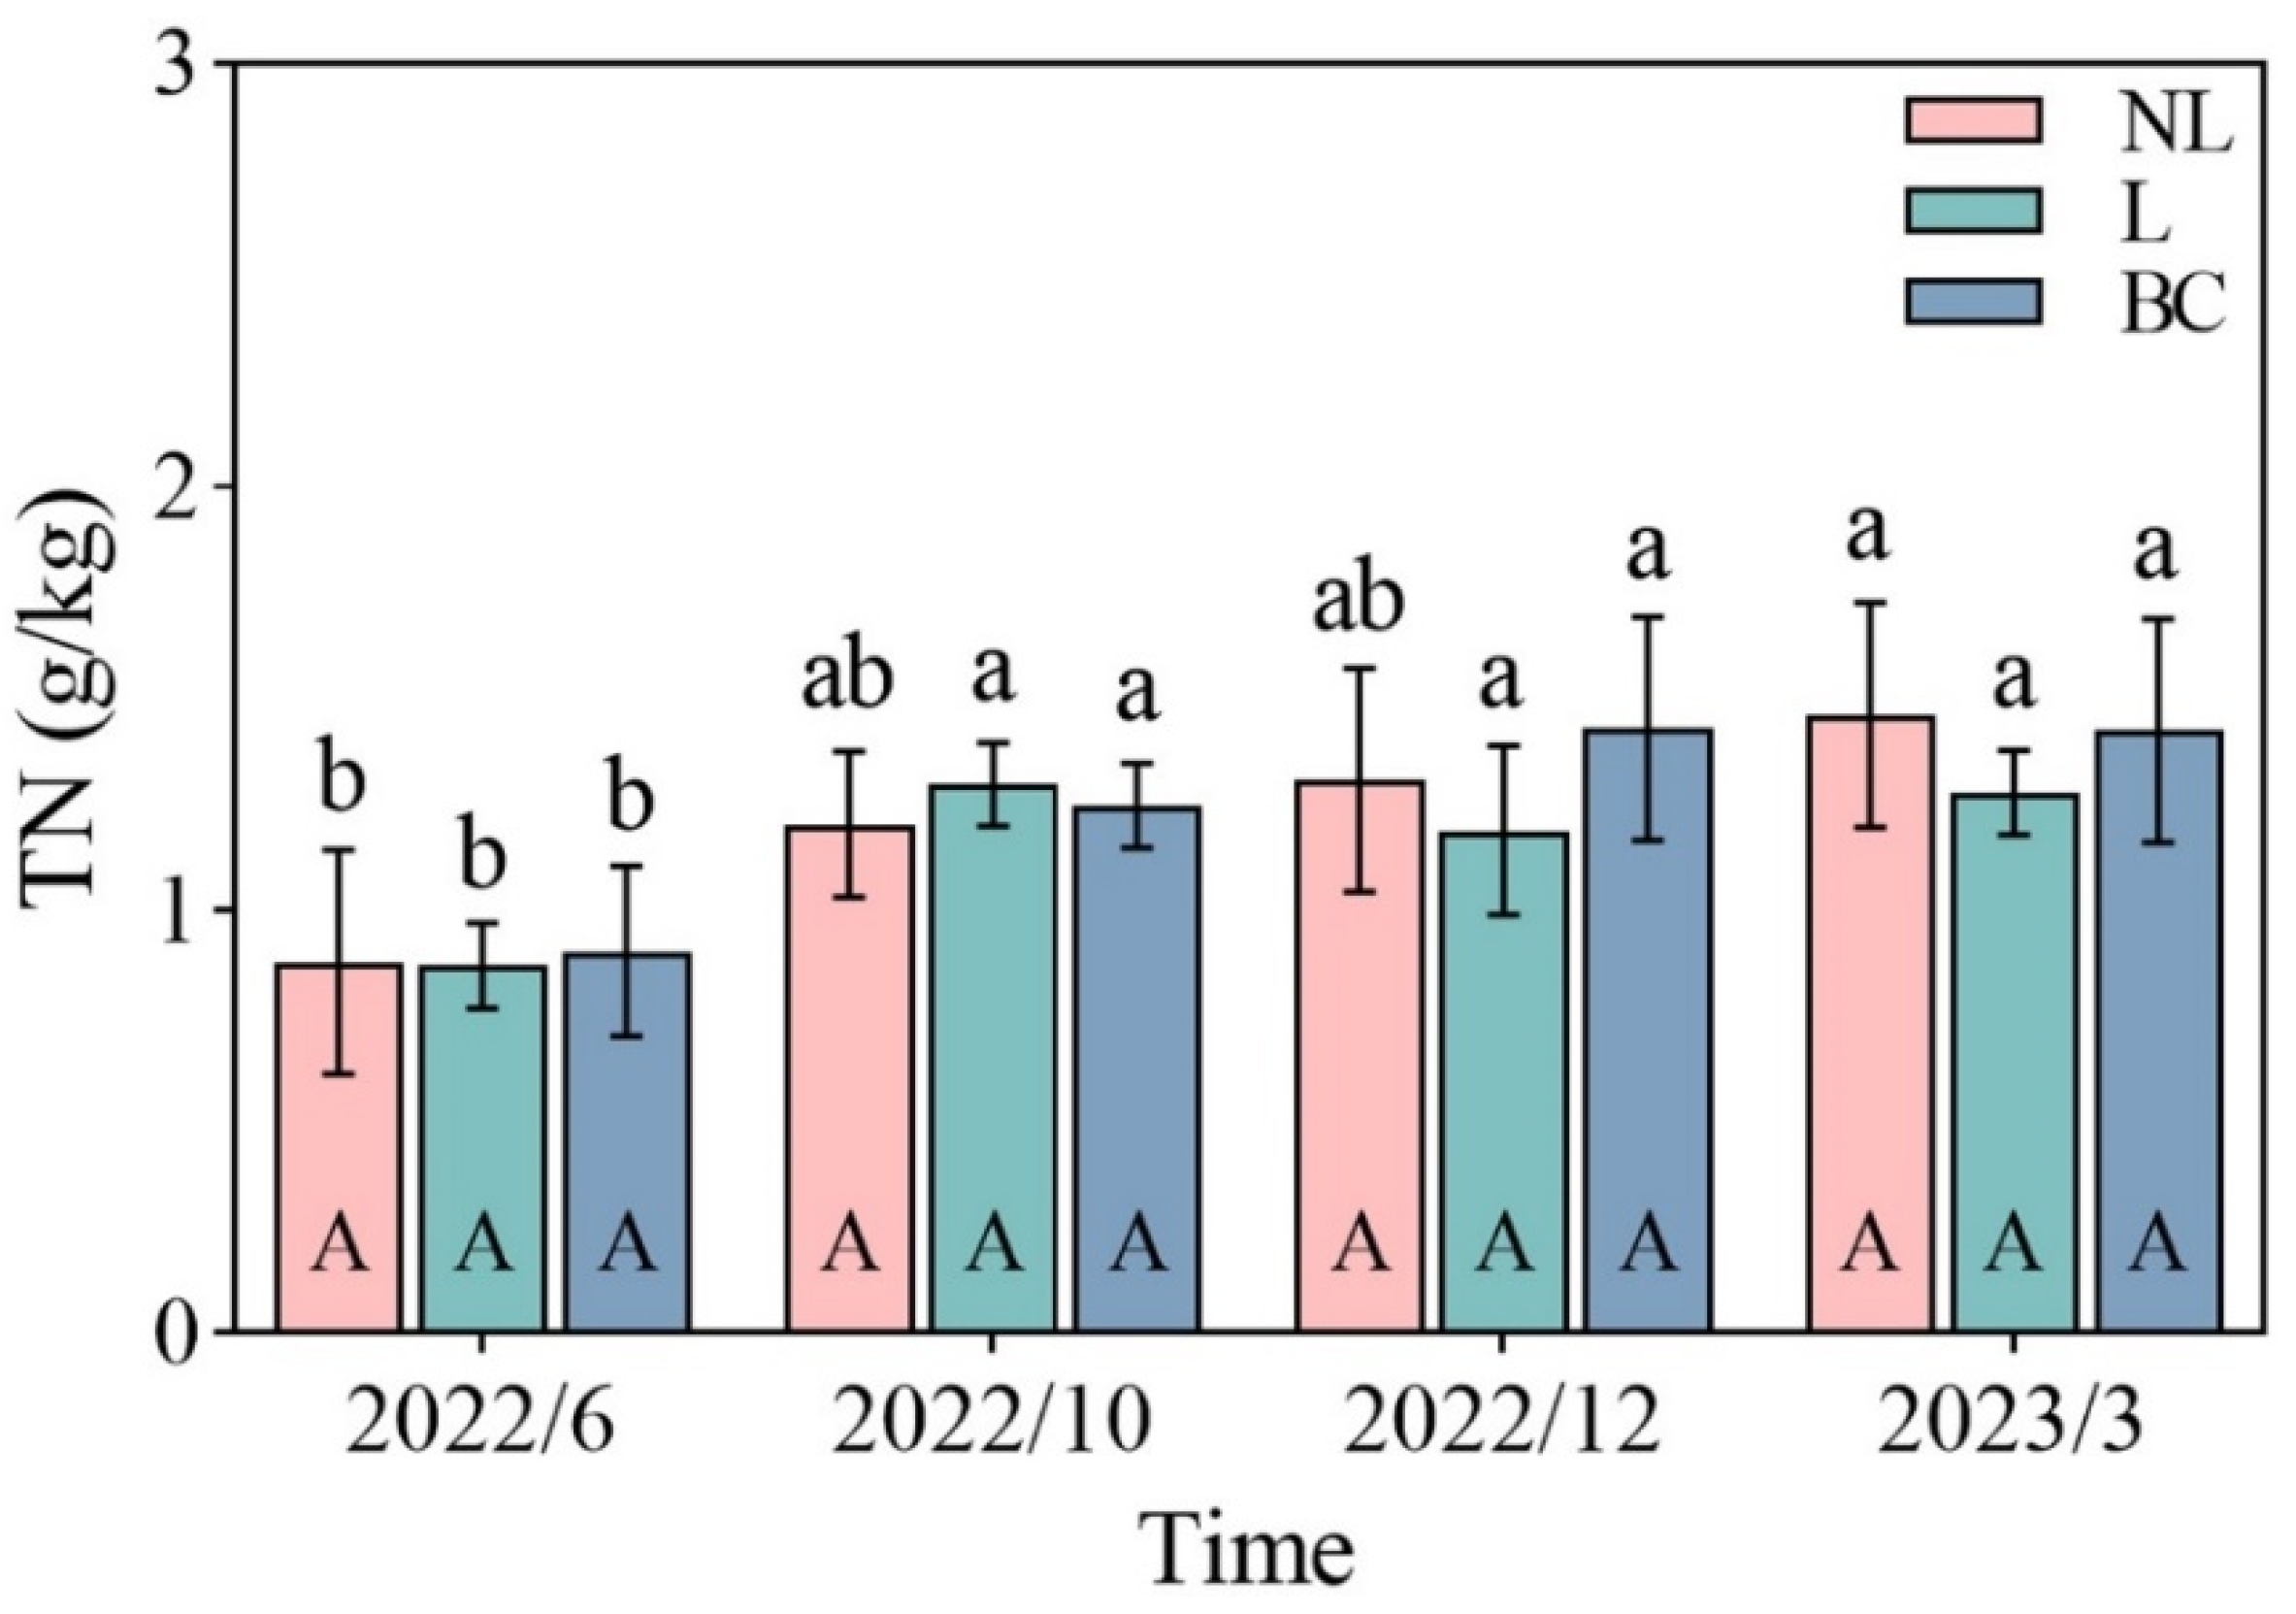
| TN (g/kg) | Time | 3 | 10.75 | *** |
| Treat | 2 | 0.62 | ||
| Time × Treat | 6 | 0.43 | ||
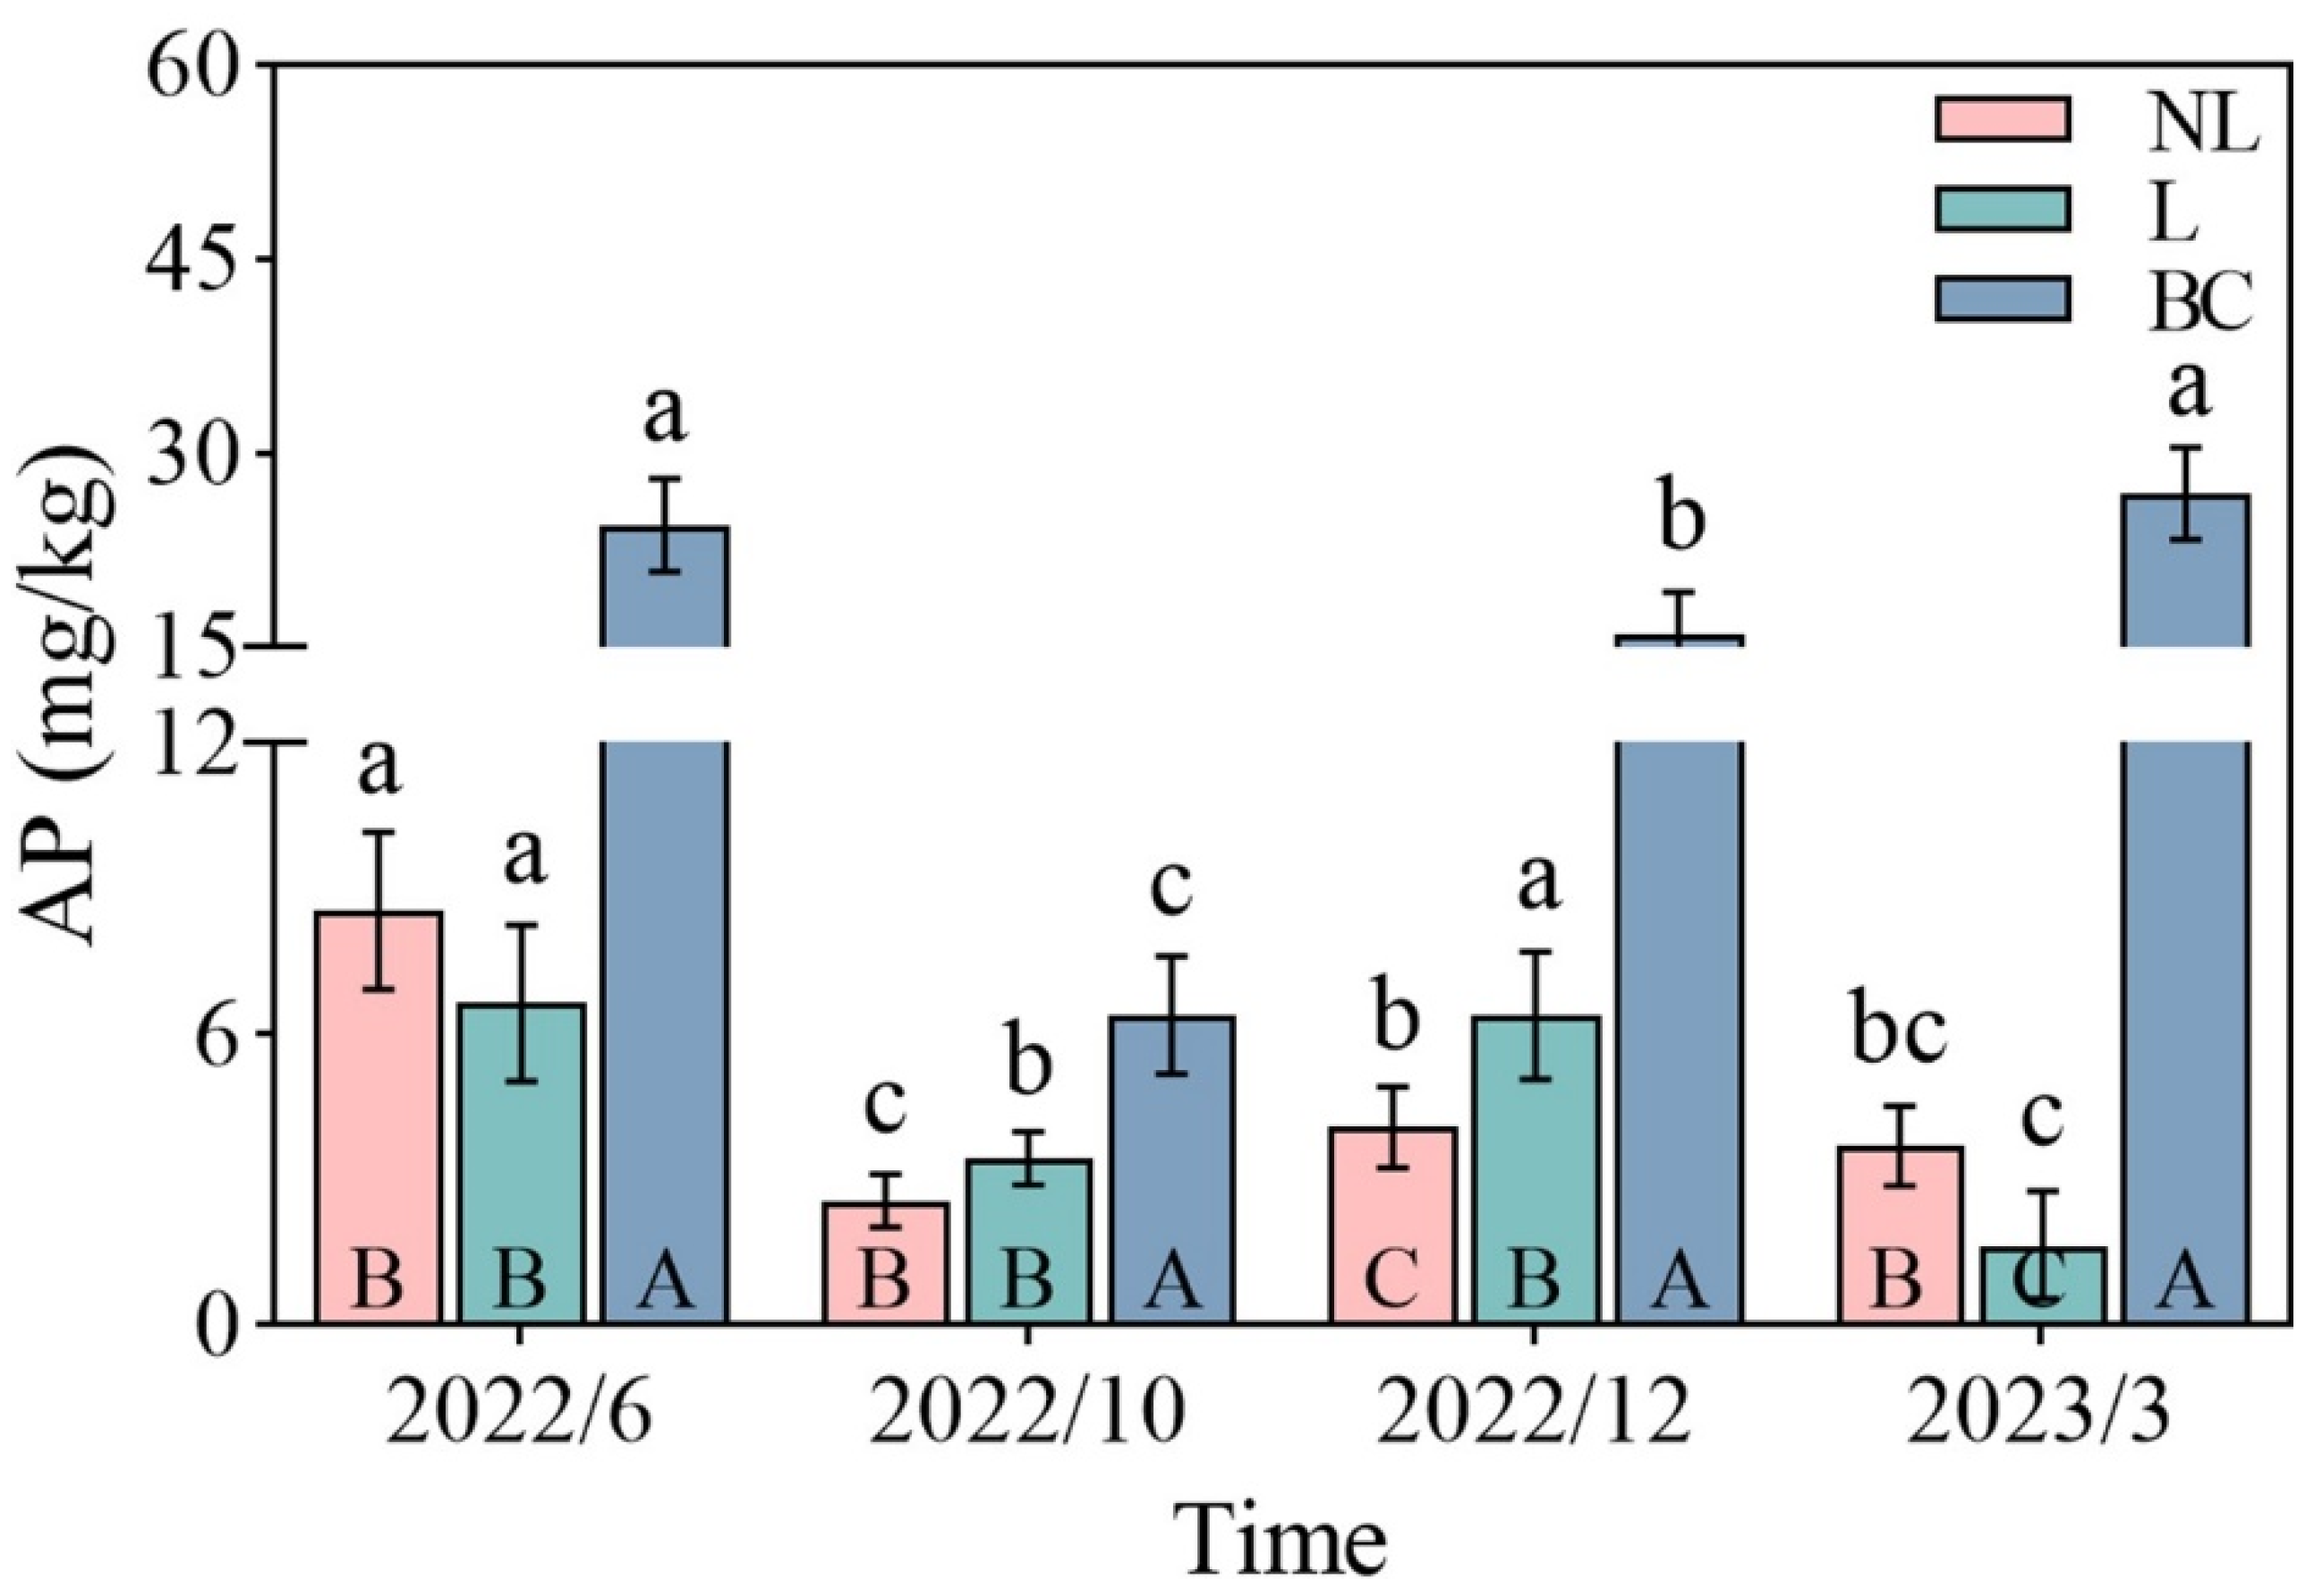
| AP (mg/kg) | Time | 3 | 33.08 | *** |
| Treat | 2 | 190.05 | *** | |
| Time × Treat | 6 | 20.39 | *** | |
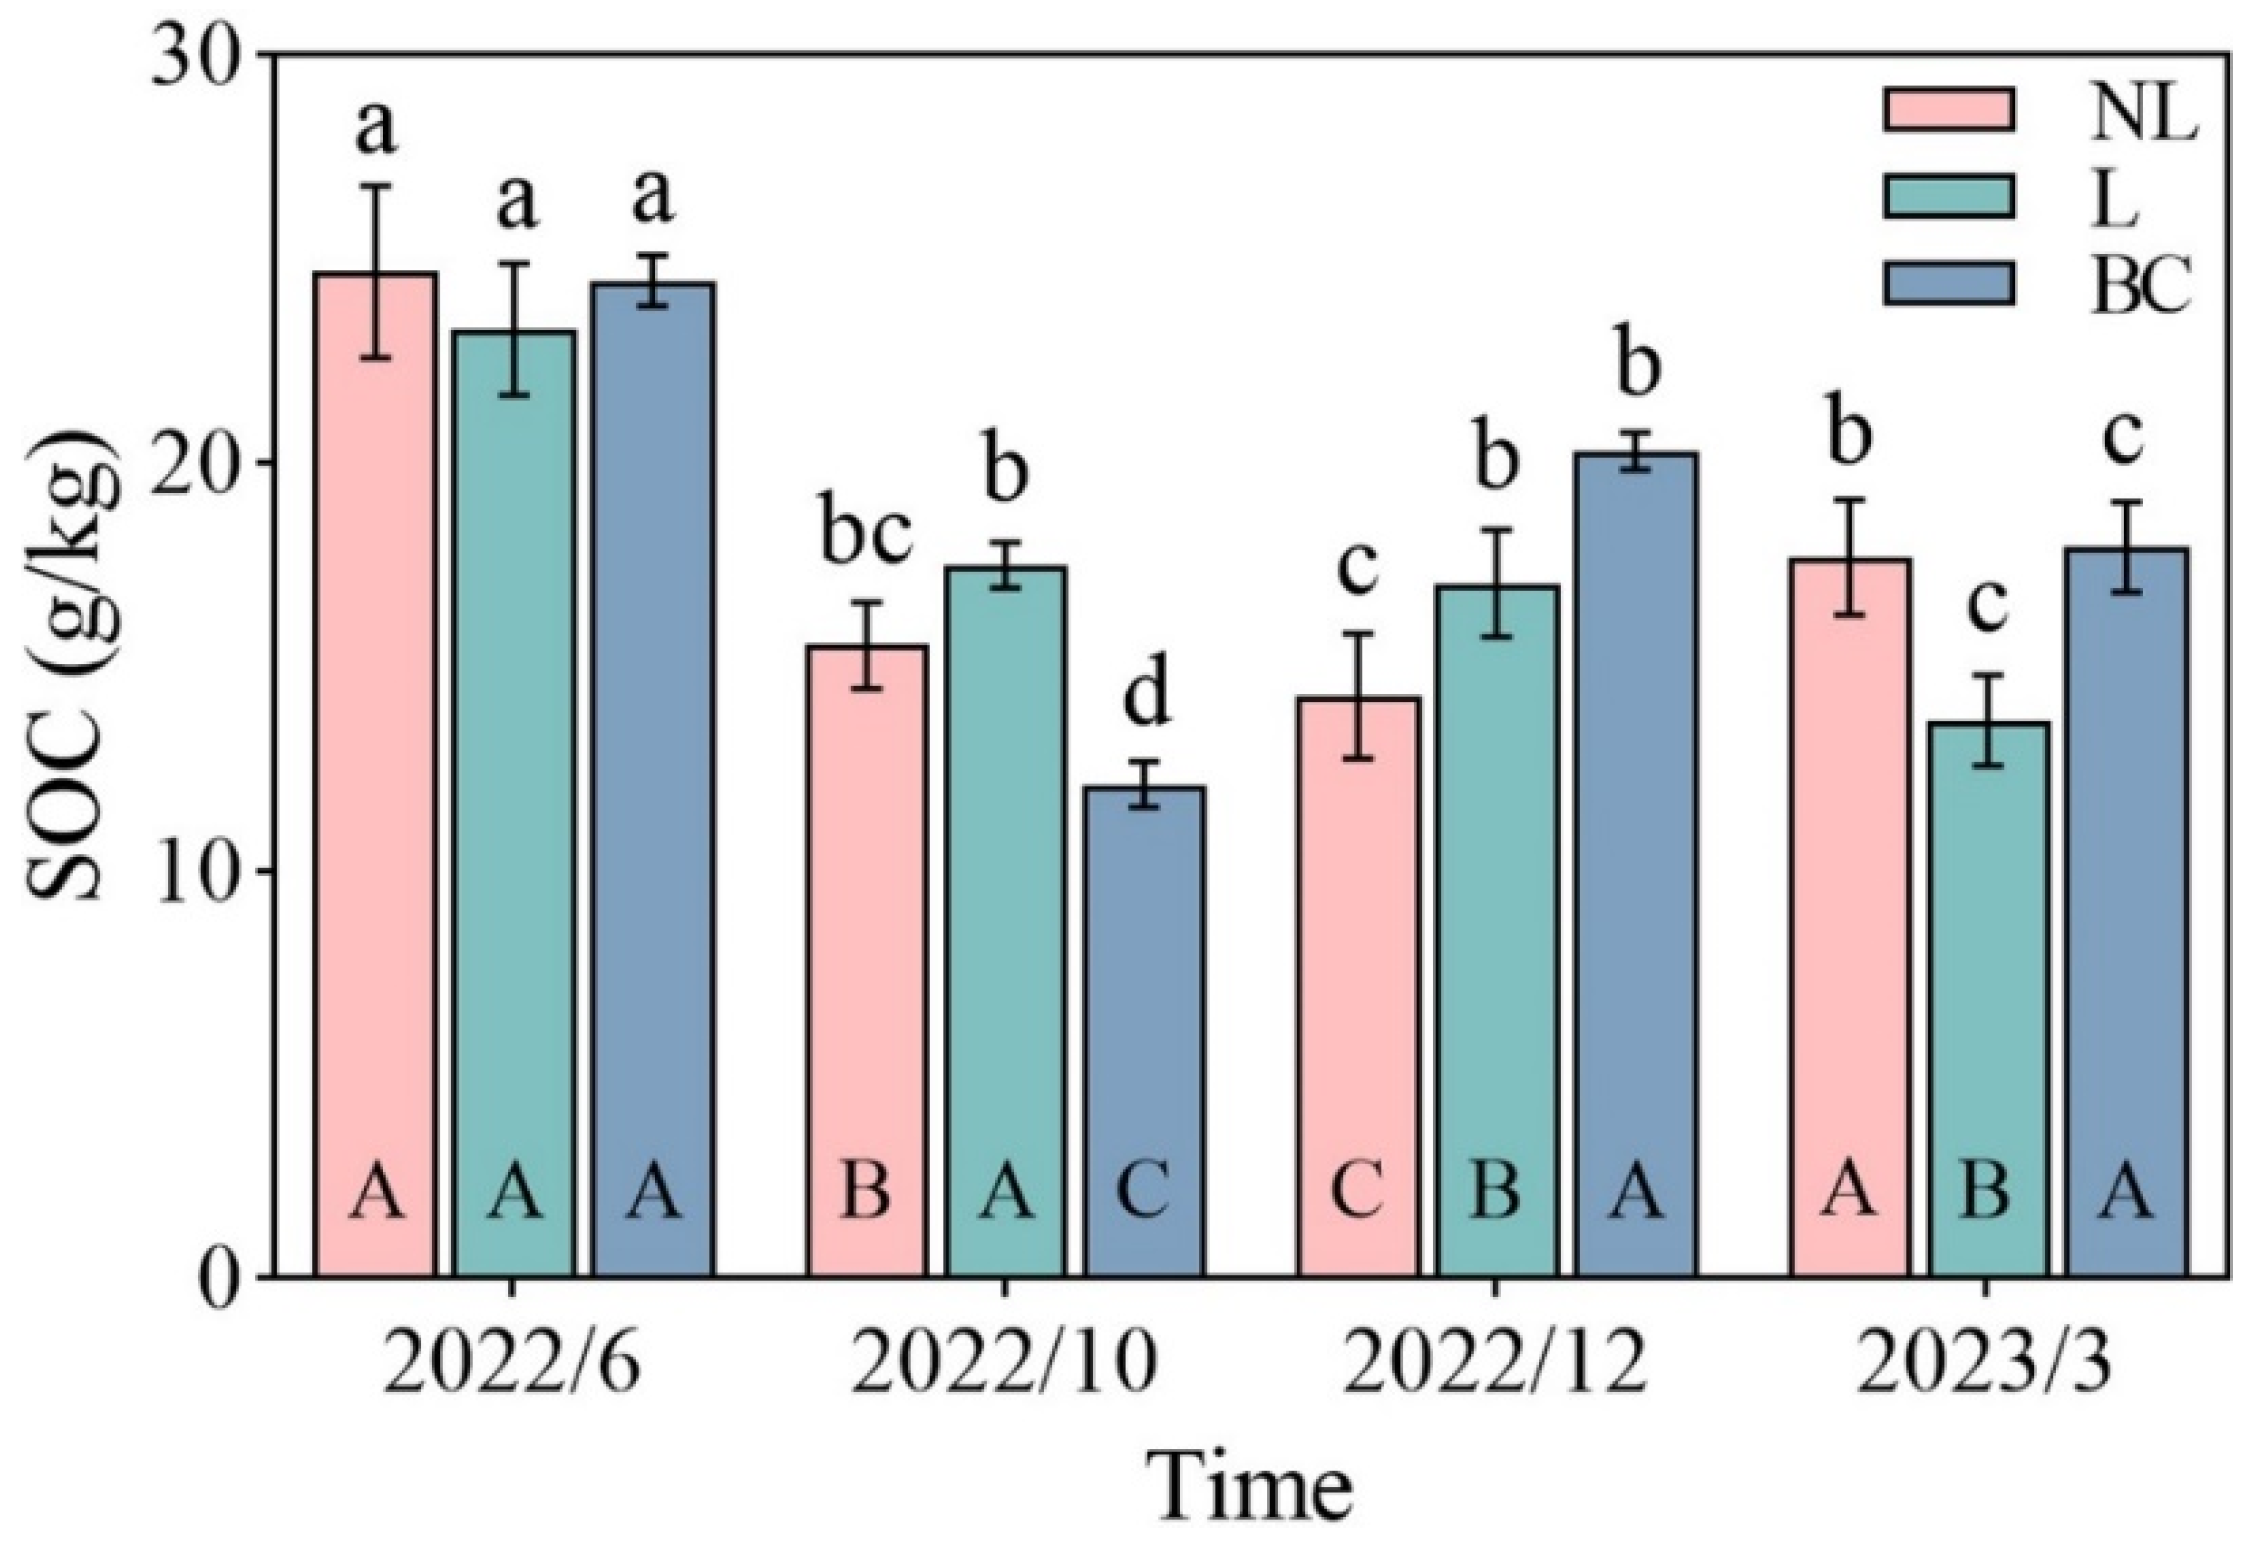
| SOC (g/kg) | Time | 3 | 99.10 | *** |
| Treat | 2 | 1.53 | ||
| Time × Treat | 6 | 14.78 | *** | |
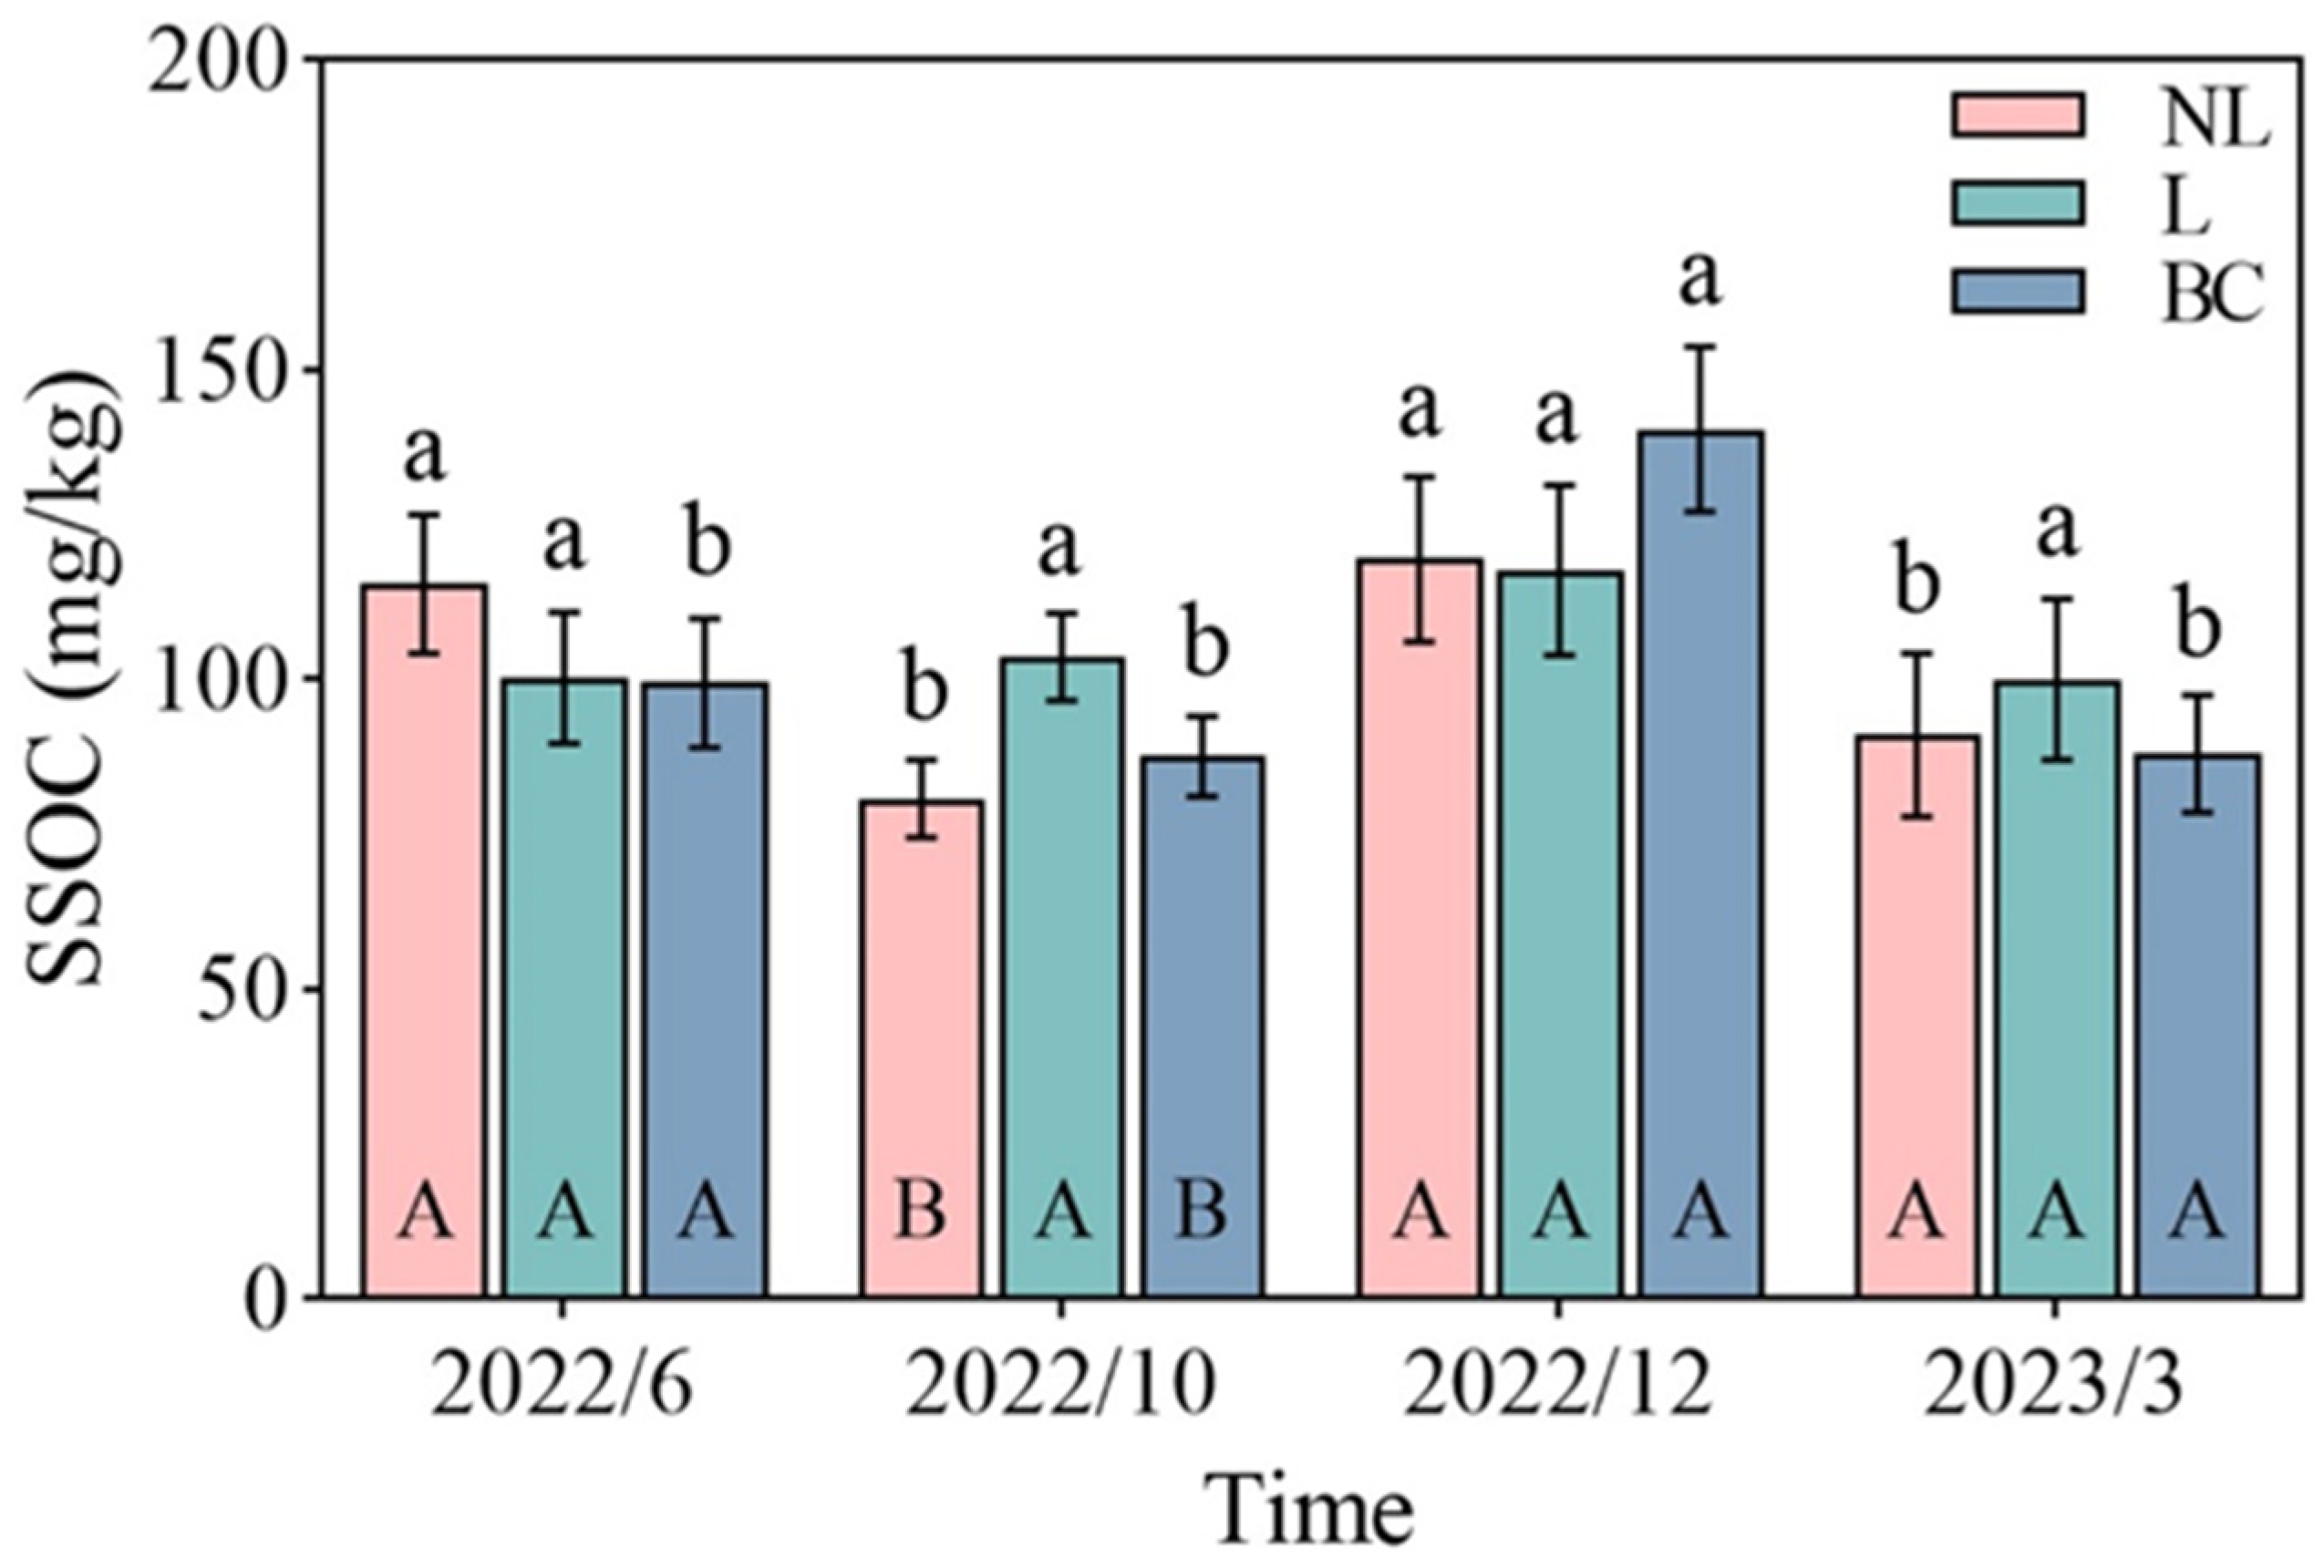
| SSOC (mg/kg) | Time | 3 | 19.24 | *** |
| Treat | 2 | 0.35 | ||
| Time × Treat | 6 | 3.35 | * | |
| MBC (mg/kg) | Time | 3 | 269.67 | *** |
| Treat | 2 | 127.95 | *** | |
| Time × Treat | 6 | 19.25 | *** |
Disclaimer/Publisher’s Note: The statements, opinions and data contained in all publications are solely those of the individual author(s) and contributor(s) and not of MDPI and/or the editor(s). MDPI and/or the editor(s) disclaim responsibility for any injury to people or property resulting from any ideas, methods, instructions or products referred to in the content. |
© 2024 by the authors. Licensee MDPI, Basel, Switzerland. This article is an open access article distributed under the terms and conditions of the Creative Commons Attribution (CC BY) license (https://creativecommons.org/licenses/by/4.0/).
Share and Cite
Yan, T.; Liu, X.; Yan, W.; Lei, J.; Peng, Y.; Wang, J.; Zhang, X.; Chen, X. Effects of Litter Removal and Biochar Application on Soil Properties in Urban Forests of Southern China. Forests 2024, 15, 1745. https://doi.org/10.3390/f15101745
Yan T, Liu X, Yan W, Lei J, Peng Y, Wang J, Zhang X, Chen X. Effects of Litter Removal and Biochar Application on Soil Properties in Urban Forests of Southern China. Forests. 2024; 15(10):1745. https://doi.org/10.3390/f15101745
Chicago/Turabian StyleYan, Tianyi, Xin Liu, Wende Yan, Junjie Lei, Yuanying Peng, Jun Wang, Xiang Zhang, and Xiaoyong Chen. 2024. "Effects of Litter Removal and Biochar Application on Soil Properties in Urban Forests of Southern China" Forests 15, no. 10: 1745. https://doi.org/10.3390/f15101745