Article

Developing GIS-Based Algorithm of Stand Spatial Structure Index and Its Implementation

1
Research Institute of Forest Resource Information Techniques, Chinese Academy of Forestry, Beijing 100091, China
2
Key Laboratory of Forest Management and Growth Modelling, National Forestry and Grassland Administration (NFGA), Beijing 100091, China
3
Institute of Forestry, Tribhuvan University, Kathmandu 44600, Nepal
4
Industrial Development Planning Institute, National Forestry and Grassland Administration (NFGA), Beijing 100010, China
*
Author to whom correspondence should be addressed.
Forests 2024, 15(10), 1755; https://doi.org/10.3390/f15101755 (registering DOI)
Submission received: 20 August 2024 / Revised: 28 September 2024 / Accepted: 1 October 2024 / Published: 6 October 2024
(This article belongs to the Section Forest Ecology and Management)

Abstract

:
Accurate information of the fine-scale spatial patterns of trees and their interactions within a stand is critical for explaining the competition, health and vigor status, and future development of a stand. There are a number of indices which can show such patterns, but the stand spatial structure index is the most important. This index can be quantified based on the spatial information of trees (tree positions) within a stand and has paramount importance in identifying candidate trees to be thinned. This study develops a software tool (algorithm), which can conveniently and accurately estimate the stand spatial structure index. Our proposed algorithm considers the spatial relationships between a reference tree and its four adjacent trees, and computes the three most important stand structure indices (neighborhood comparison, uniform angle index and species mingling) using GIS (ArcEngine) and the C# programming language. The implementation of the developed algorithm (stand spatial structure index) shows that, for any reference tree assumed, its four adjacent trees identified by each of the three stand spatial structure indices (uniform angle index—UAI, mingling—M and neighborhood comparison—NC) are the same, indicating the consistency and accuracy between the three-stand spatial structural indices. For the same tree species in a forest stand, the computational results from each of the spatial structure indices used (UAI, M, NC) are also the same. Thus, the results of this algorithm developed in this study are consistent with that of the Winkelmass1.0 software (a type of software used to simulate stand spatial structure). As this article is based on the GIS technique, the computational results can be visually displayed and implemented on actual maps, making it more convenient and intuitive for forest management. The proposed approach will be useful for accurately identifying the trees to be thinned and helpful for maintaining the vigor stand structure. This study also demonstrates the implementation of the algorithm to the real-world data and proves that the computational process is simple and efficient. The application of this algorithm for the identification of trees to be thinned may help the stakeholders to focus their attention towards multi-functional forest management. The algorithm will also provide an important basis for optimizing thinning and maintaining well-structured forest stands.

1. Introduction

A stable and healthy forest can be a good foundation for sustainable forest management, as such a forest has well-structured stands and can provide multi-functions. This forest can have a high productivity potential in terms of goods and services. The near-nature forest management, which provides multi-functionality through the adjustment of the stand structures, has largely been recognized in recent years [1,2,3,4,5]. Stand spatial structure refers to the spatial patterns of trees within a stand and the spatial configuration of tree attributes in a certain space or area. Stand spatial structure describes the spatial information pertaining to a stand position with emphasis on the determinate nature of the tree position [6,7,8]. The spatial structure information is of great significance for scientific forest management, as it provides the important basis for optimizing stand structure through thinning. An analysis of the spatial position of a stand determines not only the competitive interaction between adjacent trees, but also the spatial niche between trees and the growth potential and stability of surrounding stands [3,4,6]. In recent years, the analysis of stand spatial structure has become a main research agenda in stand simulation and forest management.
Managing forests based on establishing a spatial relationship of any reference tree and its four adjacent trees is generally referred to as a structured forest management [1,3,4,6]. This approach follows a system of structure determining multiple functions, helps develop the near-nature forest management strategy and quantifies trees and stand attributes. The structure-based forest management was first applied in Germany, which is also known as the European structured forest management or the target tree management, whereby a forest microenvironment can be precisely quantified using the relationship of the adjacent trees of a reference tree [6]. There can be a set of tree-level spatial arrangements in a stand, and they are uniform angle index (UAI), dominance index, and species mingling, or simply a mingling (M) index [4,5]. The measurements of the spatial relationship among the trees in any structural unit (a spatial pattern of some nearest trees from a reference tree; for example, four trees) can provide the reflection of a stand distribution, species diversity, stand size variation, and the juxtaposition of trees. UAI measures trees’ spatial pattern within a stand. This measurement is simple to compute and convenient to apply and has a precise differentiation ability. However, it does not require angle measurement between adjacent trees and a reference tree. The precise quantification of a UAI-based stand structure index provides an appropriate selection of trees for thinning or selection felling. Tree selection should be simple but considerably accurate, and therefore this index can be considered helpful for scientific forest management [4]. The dominance index, which is also known as neighborhood comparison (NC), is based on the parameter of any tree or dominant tree in a stand which has been successfully used in the analysis of stand spatial structure by researchers. For example, using UAI, M, and NC, Chen et al. analyzed the Mongolian forest stand structures in the over-felling forest area of Northeast China using tree height, diameter at breast height (DBH), crown width and tree biomass as input variables [9]; Hao et al. analyzed NC and applied this to the spatial structure analysis of the willow plantation [10]. Zhao et al. explored the methods and implementation of the stand spatial dominance using NC [11]. In this study, for example, the proportion of structural units with absolute dominance in the forest stand (NC = 0 ratio) was used to reflect the degree of spatial dominance in the forest stand, and the average and maximum values of comparative indicators (diameter at breast height, tree height, or crown width) were used to reflect the magnitude of changes in the dominant individuals in the forest stand.
The structure-based forest management is an integrated approach and is specially targeted for single tree management [3]. This approach not only accurately describes stand structure, but also reveals the comprehensive relationship between stand structures, competition intensity, and species diversity. This approach formulates the management measures, which can be useful for quantifying tree and stand attributes and adjusting stand structures. The structure-based forest management (multi-functional forest management) can effectively improve the forest quality and reduce the problems associated with development and utilization of forest resources [12].
The real-world application of the structure-based forest management requires appropriate software and algorithms that can compute the stand spatial indices and analyze the spatial structural attributes. For example, a software—Winkelmass 1.0—can be used to simulate the stand spatial structure, which is commonly used in China. Liu et al. have used this software to analyze the spatial structure of Mongolian oak stands in China [2]. Even though there has been an increased use of the information technology in forestry in recent years, developing software and algorithms for stand optimization through thinning based on the GIS technique is still limited. In this study, (a) an algorithm is proposed to compute the three most important forest structure indices (UAI, M, and NC) by considering the spatial relationship between the reference tree and four adjacent trees using GIS (ArcEngine) and the C# programming language; (b) this algorithm not only computes the spatial structure index of individual trees, but also the spatial structure index of an entire stand, and the computational process is simple and efficient; and (c) this study visually displays the spatial structure indicators of individual trees, tree species, and the entire forest stand in Geographic Information System (GIS), making their spatial structure more intuitive and convenient. The results presented in the article may be considered as a convenient tool for computing and visualizing the spatial structure index of any forest stands, which facilitates the implementation of research results in actual forest management, providing an especially important basis for the optimization of thinning and maintaining spatially well-structured forest stands of the secondary forests. It can be easily used to identify thinning trees on GIS maps, help stakeholders to focus their attention on multi-functional forest management, and ultimately serve a stable and healthy forest ecosystem. In addition, this study is based on information technology, such as GIS, making complex techniques convenient for forest management and production time. The research results will help cultivate information technology personnel, and promote forestry informatization and modernization.

2. Materials and Methods

2.1. Study Area

This study was conducted in the Jin-Gou-Lin forest farm located in the Wangqing county of Jilin province, China (Figure 1). The study area has the longitudes of 130°5′ to 130°20′ E and the latitude of 43°17′ to 43°25′ N). It is characterized by a daily mean temperature of 4.7 °C, with a mean daily maximum of 11.9 °C, a mean daily minimum of −1.2 °C, average snowy days of 38.3, and an average precipitation of 560 mm with the dominant rainy months of May to September. The area is located in the region of the Changbai Mountains, with the minimum and maximum elevation of 300 m and 1200 m, respectively. Its slope varies from 5° to 35°. The study area is also dominated by the flora of Changbai Mountain, with gray-brown soil from basalt mid–low mountain ash, with a soil thickness of about 40 cm.

2.2. Data

In 2013, we selected the secondary natural mixed forests in the forest farm and established two sample plots of 100 m × 100 m (Figure 1c). The sample plots had elevation of 740 to 760 m, and there are different slopes. After the years of origin, stand has grown to the natural secondary growth of Larix gmelinii spruce coniferous broad-leaved mixture with Larix olgonsis, Picea jezoensis and Abies nephrolepis as the main coniferous larch, mixed with a small amount of Pinus koraiensis, Fraxinus mandshurica, Betula platyphylla, Tilia tuan szysz, Acer mandshushuricum, Betula costata, Ulmus propinqua and other broad-leaved tree species. Within each sample plot, 100 10 m × 10 m sub-sample plots were designed (Figure 2), where the number of each sub-plot was represented with two digits, with the first digit indicating the column number and the second digit indicating the row of a sub-sample plot. For the field survey, we recorded tree position and sample-plot location variables, such as altitude, gradient and slope position, and measured DBH, height, the crown width of a target tree (Z), special target tree (S), interference tree (B), and general tree (N). Additional information of the experiment area is also available in Pang et al. [5].

2.3. Computing Spatial Structure Indices and Developing Algorithm
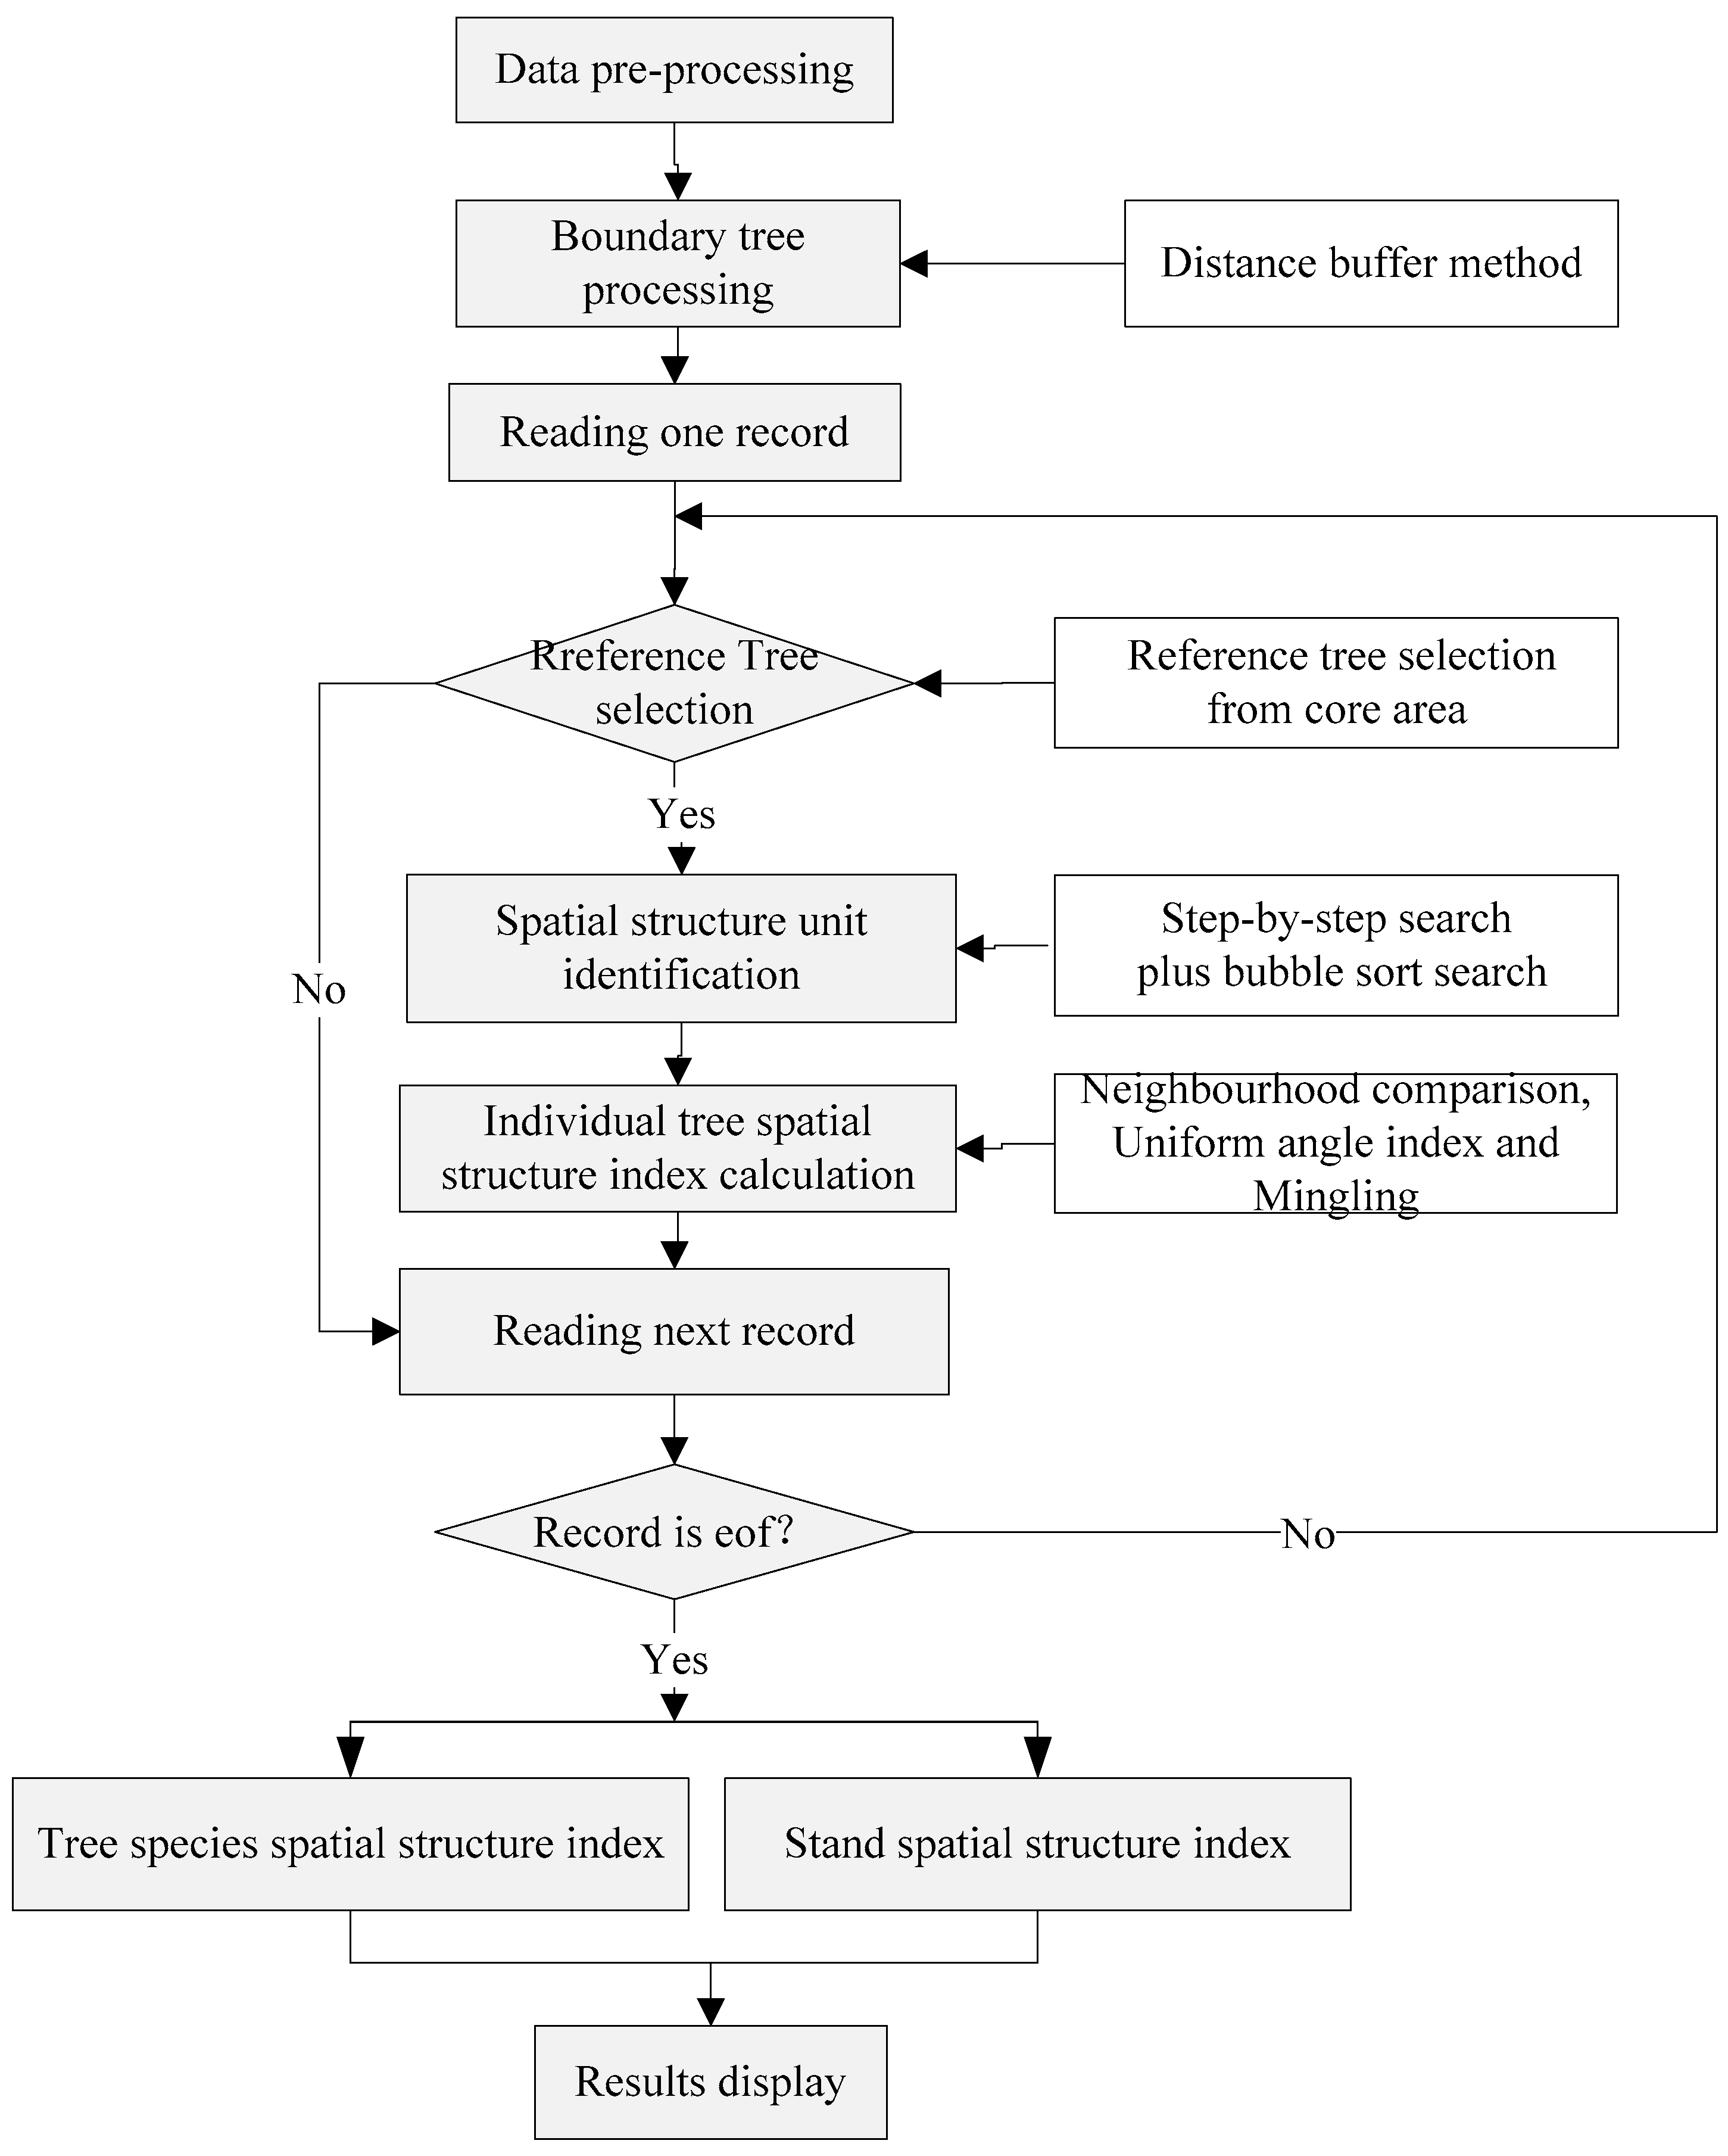
2.3.1. Study Design

We prepared data for computing three stand spatial structural indices (uniform angle index—UAI, mingling—M, neighborhood comparison—NC), which were briefly introduced in Section 1. The distance buffer method was used to identify plot-boundary trees and the reference tree in the core area of a sample plot. The four most appropriate trees adjacent to a reference tree were identified and marked. Then, all those three spatial structure indices were computed. The steps involved in identifying trees and indices for the computational process are shown in Figure 3.
  • Step 1: Data pre-processing
We prepared a dataset, which involves the logical checking of incorrectly entered or missing data in the sample plots. The relative coordinates of the sample plot and its sub-sample plots were obtained. This involves the transformation of sub-sample plot coordinates (x, y) to the corresponding relative coordinates (X, Y) as below:
  • X = the first digit of the small sample plot × 10 + x.
  • Y = the second digit of the small sample plot × 10 + y.
  • where X and x are the relative coordinates of the sample plot and sub-sample plot, respectively; similarly, Y and y are the relative coordinates of the sample plot and sub-sample plot respectively.
  • Step 2: The identification of boundary trees
The plot-boundary trees could pose problems in obtaining an accurate spatial structure index, as off-plot trees might reduce the accuracy. Thus, it was necessary to apply the boundary correction method, which plays an important role in stand spatial structure and single tree competition index. We applied the distance buffer method, which involves setting up a 5 m buffer zone inside the sample plot [3,13]. Since boundary trees could only be used as adjacent trees, it was necessary to mark them with F. As trees in the core area of sample plot might be used as adjacent trees or reference trees, they were marked with T.
  • Step 3: Selecting the reference tree
Trees marked with T in the second step were considered reference trees; that is, any tree in the core area of a sample plot was assumed as a reference tree.
  • Step 4: The identification of a spatial structure unit
The stand spatial structure unit is a basic unit consisting of a certain number of the nearest neighboring trees of a reference tree [1,4,6]. Determining the minimum number of adjacent trees of any reference tree and its spatial structure unit can be challenging, even though researchers have evaluated different alternatives for this [12,14]. We employed a commonly used method of determining the spatial structure unit, which consists of a reference tree and its four nearest neighboring trees within a sample plot [1,3,4]. The search and bubble sorting methods were used to identify the four nearest neighboring trees of any reference tree considered (Figure 4).
  • Step 5: Computing single tree spatial structure index
The computation of the indices mainly involves determining the unit of stand spatial structure through the isolation of the tree species, tree competition, tree distribution pattern, the vertical structure of a stand, and so on. As mentioned in Section 1, UAI, M, and NC were used to describe the tree competition, tree distribution pattern, and tree isolation, respectively. These indices are widely used in the study of forest spatial structure [3,4,5,9,11,15]. They express the difference among the spatial stand structures. We computed each of them as described below.
Uniform angle index (UAI): This measures the spatial distribution pattern of trees. It has a considerable discriminant ability, is simple and convenient to use, and does not need to measure the angle between the adjacent trees. This can be quantified by Equation (1).
W i = 1 n j = 1 n z i j
where W i is the UAI of a reference tree i , and describes the uniformity of the adjacent trees around the reference tree i, n is the number of adjacent trees for a reference tree i , n = 4, and z i j is a discrete variable. The angle represents the minimum angle of any two adjacent trees j that are the closest to each other. When the angle between the adjacent tree j and the reference tree i is less than a given standard α0 (= 72°), z i j = 1, otherwise, z i j = 0.
Mingling (M): This is a tree species diversity measurement method based on the spatial relationship of adjacent trees—the tree species spatial diversity index (TSS). This can be quantified by Equation (2).
M i = 1 n j = 1 n v i j
where M i is the M of reference tree i , and v i j is a discrete variable. When a reference tree and an adjacent tree are not the same species, v i j = 1, otherwise v i j = 0.
Neighborhood comparison (NC): It is a metric of the stand spatial dominance. This can be quantified by Equation (3).
U i = 1 n j = 1 n k i j
where U i is a NC of reference tree i , and k i j is a discrete variable. When DBH, H and the crown width of an adjacent tree are smaller than those of a reference tree i , k i j = 0, otherwise k i j = 1. The smaller the value of U i , the larger the reference tree would be, compared to the adjacent trees.
After computing the spatial structure indices of any reference tree, the index values were updated. Then, the stand spatial structure index of the next reference tree is repeatedly computed until all the trees in the core area of the sample plot were included in a computation.
  • Step 6: The spatial structure index of tree species
Based on the three computed spatial structure indices (UAI, M, and NC) of each tree, their average value for each tree species was obtained according to the classification of the tree species, which is the index value of a tree species of interest.
  • Step 7: Stand spatial structure index
Based on the computed values of the spatial structure indices of each tree (UAI, M, and NC) regardless of the species of interest, the average of all the trees was obtained, which is the index value of the stand spatial structure.
  • Step 8: Displaying the results
This step provides the results or computed values of the stand structure indices and their displays in different tables and figures (Figure 5, Figure 6 and Figure 7). The interpretation of results could be carried out appropriately, such as the mean UAI value falling within a range of 0.475–0.517, belonging to the random distribution, with a mean value of >0.517 belonging to aggregate distribution, and a mean value of <0.475 belonging to the uniform distribution [16,17]. The results were also analyzed with and without tree species considered.

2.3.2. Algorithm of Stand Spatial Structural Unit

The stand spatial structure unit is the basic unit composed of the nearest neighbor trees of a reference tree [4]. The basis is formed by computing the spatial index and analyzing the stand spatial structure characteristics. Determining the number of adjacent trees is the most critical tasks. There is a controversy about how to determine the number of adjacent trees [14]. For example, Tang et al. proposed using the Voronoi diagram to determine the nearest adjacent tree of a reference tree [18], while Li et al., used the weighted Voronoi diagram to determine the adjacent tree of a reference tree [19]. Our study considered the four nearest neighboring trees (N) of a reference tree, this is simple and explanatory, and it can meet the requirements of the spatial structure analysis of a stand [3,4,5,6,20].
Our study used a systematic search and bubble sorting methods to select the four nearest competitor trees around any assumed reference tree (Figure 5). A systematic search considers a reference tree as an original point for finding trees in the range according to a certain step size. The Euclidean distance between the reference tree and the four nearest tees was computed and the bubble sorting method was used to find out the four nearest trees of a reference tree, whose numbers were updated in the records of the reference tree, and the stand spatial structure index was computed.
The bubble sorting method is the intuitive sorting algorithm, which needs to be executed repeatedly in sequence and compares two elements at a time. If the order of the elements is wrong, they could be exchanged. The whole process only ends when the numbers are sorted. Its name refers to the way in which the smallest element slowly “floats” to the top of the sequence through the process. The bubble sorting method can improve the sorting efficiency by setting a Flag sign. The algorithm is depicted in Figure 5.
As shown in Figure 5, our algorithm first reads the coordinates of a reference tree, and then determines the search step size. The algorithm takes the relative coordinates of a reference tree as an origin, and determines the search range according to step size k = i. It traverses the number of trees searched; if the number of trees is ≥5 (one reference tree plus its four nearest trees), the step-by-step search ends. Otherwise, it gradually increases the search radius, k = k + i, and continues searching until the condition (one reference tree plus its four nearest trees) is met. Then, the Euclidean distance of a reference tree from each adjacent tree is computed, and four trees closest to a reference tree are found by the improved bubble sorting method. In this study, the step size I = 1 was used, and the best step size was selected according to stand density.
After the adjacent trees are identified, the spatial structure unit is defined. In this study, the angle between the adjacent trees was obtained using the cosine inverse function. Specifically, assuming that the first adjacent tree was a starting point, the angle between the first adjacent tree and other three adjacent trees was computed. Selecting the nearest tree with the smallest angle as the second adjacent tree, the algorithm computes the angle between second adjacent tree and other two remaining adjacent trees. After selecting the adjacent tree with the smallest angle as a third adjacent tree, the remaining tree would be the fourth adjacent tree.

2.3.3. Algorithm Implementation Based on GIS

We implemented our newly developed algorithm to the real-world data. The development platform is the Microsoft NET Framework 4.0 using the ArcEngine 10.0, access 7.0 database, C# language, and Personal GeoDataBase spatial data storage technology. This function was integrated into the secondary forest-tending decision support system.

3. Results

Figure 6 and Figure 7 are the implemented algorithm and its functional interface.
As shown in Figure 6, clicking the “Aalculate” button in the GIS business system and selecting the spatial structure factor to be computed in the open window can automatically carry out the computational processes, and update the results. The results of this algorithm are consistent with that of the Winkelmass 1.0 software. Specifically, firstly, for the reference tree, its corresponding four adjacent trees are the same, which indicates that they maintain the consistency in selecting spatial structural units. Secondly, for any individual tree, its spatial structure indices (UAI, M, and NC) are also the same. As this article is based on GIS technology, the calculation results can be visually displayed and implemented on actual maps, making it more convenient and intuitive for forest management. The spatial structure index of the tree is the main basis for the computation of the spatial stand structure index. The distribution of the spatial structure indices can be visualized by bar chart (Figure 7).
It can be seen from Figure 7 that the uniform angle index of a stand is mostly 0.5, which means that most trees are randomly distributed regardless of the tree species.

4. Discussion

The GIS technique has been used in various sectors worldwide, including in China, especially in forestry sector. In the past, GIS technology was mainly used for forestry thematic mapping and forestry resource data management. With the rapid development of information technology and the increasing demand for forest industry applications, in recent years, different levels (provinces, cities, counties) of forest resource data management systems have been established based on GIS technology. For example, various types of forestry business systems and the national forest land “one map” intelligent platform have been established, including the forest grass ecological network perception system in China. Pang et al. developed the provincial forestry information sharing platform and public welfare forest management platform [21,22,23]. Yang et al. developed the auxiliary decision-making system for harvesting trees based on GIS [24]. The development and application of these information systems, to a certain extent, has promoted the degree and level of forestry information in China. The forest spatial structure unit is a driving factor for forest growth process, and therefore its quantitative information can play a decisive role in the future development of forests. In recent years, with the increasing demand for the precise forest information, research on forest spatial structure has become increasingly important for sustainable forest management [25,26,27,28,29]. However, the research and development of the stand spatial structure software based on GIS technology is rarely reported. Therefore, our study, to some extent, can fill the gap in this regard.
The computation of the spatial stand structure index can be easily realized by importing the sample plot data into the system after their pre-processing based on the GIS, which automatically provides the values of three stand structure indices. Users of the algorithm do not need to determine the detailed processes of computing various indices, such as neighborhood comparison, uniform angle index, and species mingling; just clicking the mouse would accomplish the computation processes for any sample plot-size in a few seconds. The computational procedure for a single sample plot would be similar to that of the multiple sample plots, and the results can be clearly visualized graphically, e.g., Figure 7.
Our proposed algorithm is based on the forest spatial structure indicators computed using the data of only two sample plots, and provides the estimates of the most important indices, such as uniform angle index, species mingling, and neighborhood comparison. However, one may assume this sample size would not be adequate, because the wider variability in trees’ growth and development could not be covered. With the advancement of this type of research, one needs to consider data from diversified sample plots (small and large, mixed species and pure, the plots in slope and flat land, etc.), and to increase the confidence of the computed information of stand spatial structural indices. In our study, spatial structural units were determined based on the four adjacent trees, which may not be adequate competitors for a reference tree considered. The weighted Voronoi diagrams or any other searching methods can be applied to determine the precise spatial structural units.
This can be the future development trend in forest spatial structure research, which aims to construct an optimization objective function for forest spatial structure and intuitively express the overall spatial structure differences in forest stands [30,31]. With the support of information technology, our proposed algorithm will be applied as a forest management decision supporting software. By constructing an optimization objective function for forest spatial structure and analyzing the relevant indicators, it will automatically select thinning trees to serve the core tree management and precise forest management processes.
The requirement of our algorithm involves investigating the position or relative position of individual tree, which is time-consuming and laborious. This would also pose difficulty in practical application. However, with the promotion and application of the information technology, especially remote sensing-based techniques (e.g., LiDAR and UAV), it would be easier to obtain the position of individual trees, and data acquisition efficiency can be substantially improved.

5. Conclusions

This study analyzed the demand and current situation of modern forest management and forest spatial structure indices. Taking the survey data of the Jingouling Forest Farm in the experimental area as an example, an algorithm was developed to calculate three spatial structure indices (uniform angle index, mingling, and neighborhood comparison) and the detailed calculation steps of the spatial structure indices is provided. Our proposed algorithm is based on the ArcEngine platform and C# language.
The proposed algorithm can quantitatively express the spatial structure indices of the entire forest stand, as well as the spatial structure of tree species or individual trees. The quantified stand spatial structure indices are vividly expressed through the graphics and tables, greatly promoting and facilitating the quantitative and visual application of forest stand spatial structure indicators.
Our study can be easily used to identify thinning trees on the GIS maps and will help stakeholders raise the awareness of multi-functional forest management, ultimately serving to ensure stable and healthy forest ecosystems.

Author Contributions

L.P.: Conceptualization, Methodology, Writing—Original Draft, Writing—Review and Editing. D.X. (Dongbo Xie): Software, Validation, Visualization. R.P.S.: Methodology, Supervision, Writing—Review and Editing. D.X. (Dengping Xu): Data Curation, Software. L.F.: Conceptualization, Methodology, Supervision, Writing—Review and Editing. All authors have read and agreed to the published version of the manuscript.

Funding

This research was funded by the National Key Research and Development Program of China [grant no. 2022YFD2201005].

Data Availability Statement

The original contributions presented in the study are included in the article, further inquiries can be directed to the corresponding author.

Acknowledgments

We would like to thank all the people that contributed to the forest plot survey for this study and the anonymous reviewers for their helpful comments on earlier versions of this manuscript.

Conflicts of Interest

The authors declare that they have no competing interests.

References

  1. Hui, G.Y.; Von Gadow, K.; Hu, Y.B.; Xu, H. Structured Forest Management; China Forestry Press: Beijing, China, 2007. [Google Scholar]
  2. Liu, F.Q.; Yang, X.B.; Wang, X.Y.; Song, Q.F.; Lu, S.W. Spatial Structure of Quercusmongolica Forest in Hebei Wuling Mountain Nature Reserve. Forest Resour. Manag. 2010, 6, 60–64. [Google Scholar] [CrossRef]
  3. Dong, L.B.; Wei, H.Y.; Liu, Z. Optimizing Forest Spatial Structure with Neighborhood-Based Indices: Four Case Studies from Northeast China. Forests 2020, 11, 413. [Google Scholar] [CrossRef]
  4. Dong, L.B.; Bettinger, P.; Liu, Z.G. Optimizing neighborhood-based stand spatial structure: Four cases of boreal forests. For. Ecol. Manag. 2022, 506, 119965. [Google Scholar] [CrossRef]
  5. Pang, L.; Wang, G.; Sharma, R.P.; Lu, J.; Tang, X.; Fu, L. Simulation of Thinning by Integrating Tree Competition and Species Biodiversity for Target Tree-Based Management of Secondary Forests. Forests 2023, 14, 1896. [Google Scholar] [CrossRef]
  6. Hui, G.Y.; Von Gadow, K. Quantitative Analysis of Forest Spatial Structure; Science and Technology Press: Beijing, China, 2003. [Google Scholar]
  7. Pommerening, A. Evaluating structural indices by reversing forest structural analysis. For. Ecol. Manag. 2006, 224, 266–277. [Google Scholar] [CrossRef]
  8. Tang, M.P. Advances in study of Forest Spatial Structure. Sci. Silvae Sin. 2010, 46, 117–122. [Google Scholar]
  9. Chen, X.M.; Zhang, H.R.; Jiang, H.Q. Analysis and Evaluation on Spatial Structure of Quercusmongolica Forests in Over logged Region in Northeast China. J. Southwest For. Univ. 2010, 30, 20–24. [Google Scholar] [CrossRef]
  10. Hao, Y.Q.; Wang, J.X.; Wang, Q.H.; Lu, Y.C.; Zhong, F.L.; Wu, X.Y. Neighborhood comparison of Cryptomeria fortunei plantation by using different cariables. Chin. J. Appl. Ecol. 2006, 17, 751–754. [Google Scholar]
  11. Zhao, Z.H.; Hui, G.Y.; Hu, Y.B.; Li, Y.F.; Wang, H.X. Application of stand Spatial advantage degree based on the neighborhood comparison. J. Beijing For. Univ. 2014, 36, 78–82. [Google Scholar]
  12. Hui, G.Y.; Hu, Y.B.; Zhao, Z.H. Research Progress of Structure-based Forest Management. For. Res. 2018, 31, 85–93. [Google Scholar] [CrossRef]
  13. Zhou, H.M.; Hui, G.Y.; Zhao, Z.H.; Hu, Y.B. Treatment Methods of Plot Boundary Trees in Spatial Forest Structure Analysis. Sci. Silvae Sin. 2009, 45, 1–5. [Google Scholar] [CrossRef]
  14. Cao, X.Y.; Li, J. Research Progress on Indicators of the Stand Spatial Structure. For. Resour. Manag. 2016, 4, 65–73. [Google Scholar] [CrossRef]
  15. Zhou, C.F.; Wang, B.H.; Wang, W.W.; Zhao, P.X.; Li, W.Z. Stability evaluation of different forest communities in Huanglongshan mountain based on the spatial structure index. J. Cent. South Univ. For. Technol. 2018, 38, 76–82. [Google Scholar] [CrossRef]
  16. Zhang, H.R.; Tang, S.Z. Research on Sustainable Management Technology of Natural Forests in Northeast China; China Forestry Publishing House: Beijing, China, 2011. [Google Scholar]
  17. Hui, G.Y.; Li, L.; Zhao, Z.H.; Dang, P.X. Analysis method of forest spatial distribution layout. Acta Ecol. Sin. 2007, 27, 4717–4728. [Google Scholar] [CrossRef]
  18. Tang, M.P.; Zhou, G.M.; Chen, Y.G.; Zhao, M.S.; He, Y.B. Mingling of Evergreen Broad-Leaved Forests in Tianmu Mountain Based on Voronoi Diagram. Sci. Silvae Sin. 2009, 35, 1–5. [Google Scholar] [CrossRef]
  19. Li, J.P.; Fang, X.N.; Feng, Y.; Sun, H.; Cao, X.Y.; Zhao, C.Y.; Li, J.X. Tree competition indexes based on weighted Voronoi diagram. J. Beijing For. Univ. 2015, 37, 61–68. [Google Scholar] [CrossRef]
  20. Hui, G.Y.; Hu, Y.B. Expression of spatial isolation degree of tree species in mixed forest. For. Res. 2001, 14, 23–27. [Google Scholar]
  21. Pang, L.F.; Tang, X.M.; Liu, P.J. Development of the Provincial Forestry Information Sharing Platform Based on WebGIS. J. Northwest For. Univ. 2011, 26, 180–184. [Google Scholar]
  22. Pang, L.F.; Mao, Y.X.; Liu, P.J.; Zhang, Y.; Hou, R.X. Analysis and research of backstage management of shared platform of forestry information based on ArcIMS. J. Northwest A F Univ. 2007, 35, 98–101. [Google Scholar]
  23. Pang, L.F.; Mao, Y.X.; Tang, X.M. Research on Hainan Province Ecological Forest Management and Protection System Based on ArcGIS Server. For. Resour. Manag. 2010, 6, 113–118. [Google Scholar] [CrossRef]
  24. Yang, X.C.; Liu, D.L.; Zheng, X.X. Decision and Development of Support System for Deforestation Based on GIS. J. Northwest For. Univ. 2015, 30, 217–222. [Google Scholar] [CrossRef]
  25. Pretzsch, H. Analysis and modeling of spatial stand structures methodological considerations based on mixed beech-larch stands in Lower Saxony. For. Ecol. Manag. 1997, 3, 237–253. [Google Scholar] [CrossRef]
  26. Pommerening, A. Approaches to quantifying forest structures. Forestry 2002, 75, 305–324. [Google Scholar] [CrossRef]
  27. Tang, M.P.; Tang, S.Z.; Lei, X.D.; Li, X.F. Study on Spatial Structure Optimizing Model of Stand Selection Cutting. Sci. Silvae Sin. 2004, 40, 25–31. [Google Scholar] [CrossRef]
  28. Tang, M.P.; Xu, W.B.; Chen, Y.G.; Lou, M.H.; Chou, J.X.; Pang, C.h.M.; Zhao, M.S. Spatial Structure Optimizing Adjustment and Control Model of Phyllostachys edulis Stand. Sci. Silvae Sin. 2013, 49, 120–125. [Google Scholar] [CrossRef]
  29. Qiu, J.X.; Tang, M.P.; Lou, M.H.; Shen, L.F.; Pang, C.H.M.; Zou, Y.Q. Analysis of the spatial structure and competition with a Phyllostachys edulis standbased on an improved Hegyi model. Acta Ecol. Sin. 2016, 36, 1058–1065. [Google Scholar]
  30. Dong, L.B.; Liu Zh, G.; Ma, Y.; Ni, B.L.; Li, Y. A new composite index of stand spatial structure for natural forest. J. Beijing For. Univ. 2013, 35, 16–22. [Google Scholar]
  31. Zhang, L.Q.; Li, L.; Yang, H.; Xie, Y. Stand structure optimization and adjustment of natural forest in Changbai Mountains based on AHP-CRITIC combination weight method. J. Beijing For. Univ. 2023, 45, 74–83. [Google Scholar] [CrossRef]
Figure 1. (a) The study area and its location in (b) Jilin Province and (c) China; and (d) the spatial distribution of the permanent sample plots and individual trees.
Forests 15 01755 g001
Figure 2. A demonstration of the 100 m × 100 m sample plot and 10 m × 10 m sub-plots. “A” represents the plot center. Two digital numbers were used to identify the sub-plots with the first and second number, indicating the column and row of the sub-plot.
Forests 15 01755 g002
Figure 3. A flow chart showing major steps involved in computing stand spatial structure indices; eof stands for end of file; it is a special value and indicates that the end of file is read.
Forests 15 01755 g003
Figure 4. Stand spatial structural unit.
Forests 15 01755 g004
Figure 5. A flow chart depicting the processes for identifying adjacent trees for a given reference tree by the algorithm developed in this study.
Forests 15 01755 g005
Figure 6. Algorithmic computation of spatial stand structure index interface.
Forests 15 01755 g006
Figure 7. Stand spatial structure index. CONI stands for coniferous forest, NO1 BL stands for one broad-leaved forest, and NO2 BL stands for other broad-leaved forest.
Forests 15 01755 g007
Disclaimer/Publisher’s Note: The statements, opinions and data contained in all publications are solely those of the individual author(s) and contributor(s) and not of MDPI and/or the editor(s). MDPI and/or the editor(s) disclaim responsibility for any injury to people or property resulting from any ideas, methods, instructions or products referred to in the content.

