Article

Stress Responses to Bark Beetle Infestations among Pine (Pinus sylvestris), Fir (Abies alba), and Beech (Fagus sylvatica) Trees

1
Laboratory of Plant Biotechnologies, Institute of Experimental Botany of the Czech Academy of Sciences, 165 02 Prague, Czech Republic
2
Bioanalytical Service Laboratory, Institute of Experimental Botany of the Czech Academy of Sciences, 165 02 Prague, Czech Republic
3
Laboratory of Hormonal Regulations in Plants, Institute of Experimental Botany of the Czech Academy of Sciences, 165 02 Prague, Czech Republic
4
Department of Forest Tree Species Biology and Breeding, Forestry and Game Management Research Institute, Strnady 136, 252 02 Jíloviště, Czech Republic
5
Department of Applied Ecology, Faculty of Environmental Sciences, Czech University of Life Sciences, 165 00 Prague, Czech Republic
*
Author to whom correspondence should be addressed.
Forests 2024, 15(10), 1761; https://doi.org/10.3390/f15101761
Submission received: 23 September 2024 / Revised: 1 October 2024 / Accepted: 5 October 2024 / Published: 8 October 2024
(This article belongs to the Section Forest Ecophysiology and Biology)

Abstract

:
Insect infestation triggers multiple defense responses in plants, both locally at the infection site and systemically throughout the plant, including the production of feeding deterrents, toxins, defensive proteins, enzymes, and secondary metabolites. Our study aimed to compare the endogenous levels of antioxidative enzymes, photosynthetic pigments, phytohormones, total phenols, and flavonoids in bark-beetle-infested and uninfested trees. We evaluated the surviving trees in bark-beetle-infested stands, assessing both the condition and defense of uninfested and infested beech (Fagus sylvatica), pine (Pinus sylvestris), and fir (Abies alba) trees. Sampling was performed at six affected sites in the Czech Republic, targeting trees that were resilient to significant health deterioration caused by abiotic and biotic factors. The results showed different levels of most of the measured compounds in the three species. Among all the tested species, photosynthetic pigment levels showed the strongest association with infestation status, which was generally lower in the infested plants. For chlorophyll a, extremely significant reductions were observed from 123 ± 20.6 to 101 ± 17.9 μg/g dry weight (DW) in pine, from 231 ± 33.1 to 199 ± 22.2 μg/g DW in beech, and from 60 ± 5.66 to 51.3 ± 6.27 μg/g DW in fir. In contrast, enzymatic activities indicated only isolated instances of significant association, whereas antioxidative properties (total phenolic content, flavonoids, and 2,2-diphenyl-1-picrylhydrazyl radical scavenging capacity) were not significantly associated with infestation status. There was a statistically significant increase in glutathione reductase activity in infested fir and pine trees. However, this difference was not statistically significant in beech. In contrast, a significant increase in superoxide dismutase activity was detected in infected beech trees. Phytohormones have emerged as the most diverse group of analyzed compounds. Cytokinins were the most distinct, with many of them being significantly increased in infested pines, whereas both beech and fir showed only one significant association. Additionally, derivatives of jasmonic acid also showed a distinct pattern of change associated with bark beetle infestation, with the levels of three out of the four analyzed jasmonates being significantly decreased in infested pines, whereas no effects were observed in beeches and firs. Notably, many phytohormones were significantly elevated in the infested pine, whereas both beech and fir exhibited only one significant association. Overall, the data showed that pines responded differently to bark beetles than to beeches or firs. The greatest changes in phytohormones were observed in pine, whereas the most significant changes in photosynthetic pigments were observed in beech and fir trees.

1. Introduction

In recent decades, pest infestation has been a major cause of tree mortality, altering ecosystem functioning and microclimates and resulting in significant forest loss worldwide. Extreme weather alters the distribution of tree species and their susceptibility to abiotic and biotic stressors [1,2]. Notably, climate change influences the population dynamics and abundance of exothermic organisms, such as insect herbivores, and enhances the pathogenicity of fungal diseases [3,4,5]. Consequently, trees are stressed not only by changes in temperature and water conditions but also by increased numbers of bark beetles whose development is accelerated by higher temperatures [6]. For example, bark beetle damage to Scots pine increased eightfold between 2010 and 2019 [7], and in the coming decades, bark beetle damage in the European region is projected to increase almost sixfold compared with that between 1971 and 2010 [8]. Another study suggested that there will be a 60%–220% increase in bark beetle disturbance during the 21st century, depending on the changing climatic conditions [9].
Intensive and regulated forest management has been practiced in the Czech Republic, resulting in monodominant forests with low biodiversity. Increased mortality in coniferous monocultures with Norway spruce (Picea abies (L.) Karst.) or Scots pine (Pinus sylvestris L.) is caused by an increasing number of wind storms, droughts, or related bark beetle calamities [10]. Among these factors, drought has the greatest impact on tree mortality [11]. Moreover, the development of parasites has been strongly promoted by drought, leading to several physiological adaptations in insects, such as accelerated development, enhanced detoxification systems, favor of mutualistic microorganisms, and induction of genetic changes [12]. The dominant pest species recorded in the Czech Republic include bark beetles (Ips acuminatus and Ips sexdentatus) and wood-destroying insects (Phaenops cyanea and Sirex noctilio) [13,14,15]. White fir (Abies alba) stands have significantly worsened owing to further attacks by Pityokteines spinidens and Pissodes piceae [16].
Drought-sensitive and disturbance-prone species, such as Norway spruce and beech (Fagus sylvatica L.), experience high mortality [1]. Moreover, beech is often significantly damaged by combined infestation with Cryptococcus fagisuga, Taphrorychus bicolor, and fungi. Insects create holes in the bark of the tree, which become entry points for fungi [17]. Changes in saproxylic beetle communities in wind-disturbed beech stands are mainly caused by bark beetles such as Xylosandrus germanus, Xyleborinus saxesenii, and T. bicolor [18].
Coniferous trees have physical and chemical defenses that protect them from insect and pathogen attacks [19]. However, drought can lead to reduced carbon uptake owing to stomatal closure and decreased photosynthetic rates [20]. It negatively affects the production of defensive metabolites [21,22,23] and tolerance mechanisms such as compensatory growth [23]. The degree of resistance of Norway spruce trees to mass inoculation with a bark-beetle-associated fungus can be predicted based on the diversity of constitutive phloem phenols and their ability to induce phenol synthesis in response to wounding. Trees under water stress during bark beetle infestation lack induced resin flux owing to a combination of lower turgor pressure in the epithelial cells of the resin canaliculi, a depletion of phloem carbohydrates due to induced terpene synthesis, and a reduction in the total supply of carbohydrates for resin production caused by low photosynthesis [24]. Trees inhibit the growth of ophiostomatoid fungi by producing defensive phenolic compounds, such as resveratrol [25]. Moreover, drought can further impair defense induction, such as the formation of traumatic resin ducts in response to physical injury, insects, and fungal attacks [26]. Therefore, a reduction in the production of defense chemicals due to drought stress may alter the susceptibility of the tree not only to initial attacks by organisms but also to subsequent ones by different organisms.
The primary defense compounds in oak leaves are condensed tannins [27], whereas in coniferous trees, these compounds are terpenoids [28]. Deciduous trees contain large amounts of phenolics in their leaves, bark, wood, and roots [29,30,31]. Tannins act as broad-spectrum defense mechanisms against herbivores, and seasonally increasing tannin levels are responsible for concentrating herbivores in spring [32]. However, insects may vary in their responses to tannins based on their level of adaptation to polyphenols [33].
A comprehensive understanding of the physiological and morphological mechanisms underlying drought defense and tolerance is essential for effective forest planning and management in a progressively warmer world. Only with detailed knowledge of detrimental agents and their impacts on drought-stressed trees can appropriate forest protection methods be planned and implemented. In this study, we hypothesized that the nature and severity of these effects would be contingent on regional characteristics (e.g., feeding guild, ecology, and population levels in previous years) and the tolerance of the host type to stress. Several biochemical markers were monitored in three typical forest tree species: beech, pine, and fir. Our objective was to compare the endogenous levels of these compounds between bark-beetle-infested and uninfested trees to identify the key elements of resistance and assess the biochemical response to the additional stress of infestation.

2. Material and Methods

2.1. Study Area

The study area comprised six locations within the Czech Republic (see Table 1). In the selected stands, 10 control (uninfested) trees and 15 stressed by bark beetles (infested) trees were selected for each site. The presence of bark beetles was determined based on the number of boring holes, which were counted in each tree within three strips (2 × 0.1 m). Only trees devoid of holes were selected as controls (uninfested). Trees with an approximate density of 0.15–0.2 sinkholes per dm2 were selected for the infested group. This density threshold ensured sufficient stress intensity while allowing tree survival until the end of the sampling period. Additionally, the possibility of heavy infestation by root-knot nematodes in the crown area, which could lead to premature death, was systematically ruled out for each tree using binoculars. T. bicolor was recorded on beech, predominantly P. cyanea on pines, and P. spinidens on firs.
Experimental plots for beech (Fagus sylvatica) were located on strongly sloping sites with highly skeletal soil. These are relatively natural beech stands corresponding to the acidophilous, sometimes flowery beech forests of the Luzulo-Fagion sylvaticae or Fagion sylvaticae associations. Within these stands, the tree canopy was completely dominated by beech, with minimal presence of shrub vegetation. The herbaceous ground cover varied from site to site, along with differing species compositions. While some areas were almost devoid of herbaceous vegetation, others featured a relatively dense herbaceous ground cover with species ranging from those adapted to partially nutrient-rich habitats to nitrophilous habitats, indicating localized nutrient enrichment.
Experimental stands of Scots pine (Pinus sylvestris) were located within cultural stands, which closely resemble pine oak forests or acidophilous oak forests characteristic of the Gensito germanicae-Quercion association. The soil at both sites was sandy and nutrient-poor. The tree canopy was dominated by P. sylvestris, complemented by Quercus robur. Within the shrub layer, tree species occurred together with the relatively uncommon Betula pendula, Frangula alnus, and the non-native Prunus serotina (located in Stará Boleslav). The herbaceous ground cover was dominated by Calluna vulgaris, Avenella felxuosa, Agrostis capillaris, and other acidophilous and nutrient-poor species. Additionally, the expansive Calamagrostis epigejos was found at the Stará Boleslav site. Both stands were considerably altered by forest management, with the plant communities reflecting the combined effects of large-scale management in pine stands and the frequent introduction of non-native tree species in the surrounding stands (Q. rubra).
Experimental areas for white fir (Abies alba) were located within diverse types of stands. The Nové Město n. Metují site encompassed a sloping stand with a natural regeneration of fir, which, from the phytocenological perspective, is akin to beech forests of the Fagion association. The soil at this site was highly skeletal, and the vegetation within the herbaceous and shrub layers was relatively rich and diverse, featuring species such as Rubus fruticosus agg. In contrast, the Rychnov n. Kněžnou site represented an economic forest that differed from the previous site, with secondary spruce forests that were likely present in the vicinity of fir stands.

2.2. Plant Material Sampling

Plant samples were collected from freshly cut needles and foliage in May of 2022. Tree canopy sampling was conducted using a tree plucker. Approximately 10 g of leaf tissue was collected from three locations on the crown, and a composite sample was created to represent the test tree. Samples were collected from the lower green parts of tree crowns. The height of the tree crown deployment (lower part) depended on the individual position of the tree and the tree species in the forest stand (4–21 m) and was therefore variable. Sampling was primarily conducted from the southern sunlit side of the tree to ensure the uniformity of the collection methodology. The collected plant material was immediately preserved in liquid nitrogen at the site and subsequently stored at −80 °C for further processing.

2.3. Enzyme Extraction

Total soluble proteins were extracted by grinding 200 mg of plant cells in 2 mL of 50 mM potassium phosphate buffer, pH 7.0 supplemented with 0.1 mM EDTA, 1% PVP, and 0.5% Triton-X 100. Homogenates were centrifuged at 14,000× g at 4 °C for 10 min. Supernatants were collected, and protein content was determined using the Bradford method [34] using bovine serum albumin as a standard (125–2000 µg L−1); enzyme activity involved in the antioxidant defense machinery protecting the plants against oxidative stress damage was determined using the supernatants.

2.4. Antioxidative Enzyme Activity Assays

The activities of the antioxidant enzymes superoxide dismutase (SOD) [EC 1.15.1.1], catalase (CAT) [EC 1.11.1.6], glutathione S-transferase (GST) [EC 2.5.1.18], ascorbate peroxidase (APX) [EC 1.11.1.11], and guaiacol-specific peroxidase [EC 1.11.1.7] were measured in leaves using standard spectrophotometric methods using a Tecan Infinite 200 microplate reader (Tecan Group Ltd., Männedorf, Switzerland) according to the method described by Stuchlikova et al. [35] with some modifications. SOD activity was determined according to El-Shabrawi [36] by measuring the ability of the enzyme to inhibit the photochemical reduction of nitroblue tetrazolium (NBT). The reaction mixture contained K-P buffer (50 mM, pH 7), xanthine-oxidase (0.1 U), CAT (0.1 U), and enzyme extract (20 µL), and the reaction was started by the addition of xanthin (2.36 mM). One unit (U) of SOD caused 50% inhibition of NBT within 2 min. Peroxidase (POD) was assayed as previously described by Drotar et al. [37]. The reaction mixture (190 µL) consisted of 50 mM K-P buffer (pH 7.0), 3.4 mM guaiacol, and 9 mM H2O2, and the reaction was started by the addition of 10 µL enzyme extract. Activity was assayed by monitoring the increase in absorbance at 420 nm due to the oxidation of guaiacol (e = 26.6 mM−1 cm−1). CAT activity was determined spectrophotometrically by measuring the rate of H2O2 decrease at 240 nm [38]. The reaction mixture consisted of 50 mM potassium phosphate buffer (pH 7.0), 10 mM H2O2, and 10 µL enzyme extract. CAT activity was expressed as mmol of catalyzed H2O2 (e = 36 µM−1 cm−1) per min per milligram of protein. APX activity was determined by the decrease in absorbance at 290 nm, as described by Vanacker et al. [39]. The reaction mixture consisted of 50 mM potassium phosphate buffer (pH 7.0), 0.1 mM ascorbate, 0.12 mM H2O2 (e = 2.8 mM−1 cm−1), and 20 µL enzyme extract. APX activity was expressed as mmol of oxidized ascorbate per min per milligram of protein. GST activity was determined using 1-chloro-2,4-dinitrobenzene as the substrate [40]. The reaction mixture contained the enzyme extract, 1.0 mM glutathione, and 1.0 mM CDNB. The rate of increase in absorbance was spectrophotometrically measured at 340 nm at 25 °C for 5 min for CDNB (e = 9.6 mM−1 cm−1). This wavelength corresponded to the appropriate UV maximum of the substrate.
The specific activities of SOD, CAT, POD, APX, and GST were expressed as units per milligram of protein. All samples were measured in triplicate.

2.5. Chlorophyll and Carotenoids Measurement

Pigments were extracted from 5 mg of freeze-dried fiddlehead samples with 1 mL of acetone, 0.001% of an antioxidant, and butylated hydroxytoluene (BHT, 2,6-di-tert-butyl-4-methylphenol, Sigma-Aldrich, Prague, Czech Republic), and centrifuged for 5 min at 9000× g (microcentrifuge Sigma 1–14, Sigma Laborzentrifugen GmbH, Osterode am Harz, Germany). The supernatant was separated, and the sediment was re-extracted and centrifuged as described above. Subsequently, the supernatants were combined and evaporated under a nitrogen flow. Dry pigment mixtures were stored at −80 °C and dissolved in 200 µL of acetone before analysis. Chlorophyll a, chlorophyll b, and carotenoids such as neoxanthin, violaxanthin, antheraxanthin, lutein, zeaxanthin, and β-carotene were detected using a high-performance liquid chromatography/ultraviolet-visible (HPLC/UV-VIS) system, consisting of a gradient pump beta, an autosampler HTA 300, a Watrex Nucleosil column (120-5-C18, 250 × 4 mm, 5 µm particle size), a UV-VIS detector Sapphire, and a vacuum degasser DG 3014 (ECOM, Prague, Czech Republic). The gradient ranged from 100% solvent A (acetonitrile/methanol/water, 80/12/10, v/v/v) to 100% solvent B (methanol/ethyl acetate, 95/5, v/v); both solvent mixtures contained 0.01% BHT. The total analysis time was 25 min, during which the gradient ran for 2–5 min at a flow rate of 1 mL·min−1, and the samples were detected at 445 nm. Quantification of the detected carotenoids was performed using the Clarity software (DataApex, Prague, Czech Republic). Pigment content was expressed in micrograms of pigment per gram of dry leaves (µg·g−1 DW). Carotenoids were isolated from tobacco leaves, and individual carotenoids were separated and purified using HPLC as previously described. The carotenoid purity measured using HPLC was 95%–98%. The carotenoid standards were quantified using a Hitachi 2200 spectrophotometer (Hitachi Ltd., Tokyo, Japan) and absorption coefficients.

2.6. Preparation of Sample Extract for Detection of Antioxidative Compounds

Freeze-dried homogenized (using mortar and pestle) needles and leaves (100 mg) were extracted in 5 mL 80% MeOH, enhanced with 10 s sonication, for 24 h at room temperature (22 °C) in the dark. The extracts were centrifuged at 4000 rpm for 10 min (Hettich Centrifuge, Universal 32R, Tuttlingen, Germany), and the supernatant was collected and stored at −20 °C before use. Total phenol content, total flavonoid content, and antioxidant capacity were determined.

2.7. Total Phenol Content

The total phenol content was determined using the Folin-Ciocalteu reagent [41]. Briefly, the extracts were prepared as described in Section 2.5, diluted in water to fall within the calibration curve, over the limit of quantification (LOQ), and incubated with Folin-Ciocalteu reagent in 96-well microplates for 10 min shaking at 200 rpm at room temperature. The reaction was terminated using 12% anhydrous sodium carbonate. Absorbance was read at 760 nm using a Tecan Infinite M200 PRO microplate reader (Tecan Group, Männedorf, Switzerland) after incubating in the dark for 30 min at 37 °C. The total phenol content was expressed as micrograms of gallic acid equivalents per gram of dry weight (µg GAE g−1 DW), using the mean of three individual measurements. The calibration curve was constructed with gallic acid concentrations ranging from 1.172–25 µg mL−1 (R2 ≥ 0.99), with a limit of detection (LOD) of 2.110 ± 0.193 µg mL−1 and an LOQ of 3.782 ± 0.372 µg mL−1.

2.8. Total Flavonoid Content

The total flavonoid content was determined using the aluminum chloride method in alkaline and acidic solutions [42], using extracts prepared as described in Section 2.5 and diluted in water to fall within the calibration curve, over the LOQ.
For the alkaline reaction, the samples were incubated in 96-well microplates in a solution containing sodium nitrate (final concentration 21.74 mM) for 5 min at room temperature. Aluminum trichloride was added to a final concentration of 22.5 mM, and after shaking at 200 rpm for 6 min, sodium hydroxide was added to a final concentration of 200 mM. The absorbance was read at 510 nm, and the total flavonoid content was expressed as micrograms of rutin equivalent per gram of dry weight (µg R g−1 DW) using the mean of three individual measurements. The calibration curve was obtained with rutin from 11.7–750 µg mL−1 (R2 ≥ 0.99), with an LOD of 11.509 ± 4.264 µg mL−1 and an LOQ of 22.848 ± 6.302 µg mL−1.
For the acidic reaction, the samples were incubated in a solution of aluminum trichloride (final concentration: 12.4 mM) and potassium acetate to a final concentration of 20 mM. The absorbance was read at 415 nm after 10 min of incubation, and the total flavonoid content was expressed in µg R g−1 DW using the mean of three individual measurements. The calibration curve was constructed with a rutin from 4.69–300 µg mL−1 (R2 ≥ 0.99), with an LOD of 5.920 ± 1.040 µg mL−1 and an LOQ of 7.776 ± 1.287 µg mL−1.

2.9. Evaluation of Antioxidant Capacity

Antioxidant capacity was determined using the 2,2-diphenyl-1-picrylhydrazyl (DPPH) assay as described by Langhansova et al. [43]. Briefly, the extracts were diluted in MeOH to meet the concentration range of the positive control Trolox (2.5–160 µM), over the LOQ. The samples were then mixed with 1 mM DPPH (2,2-diphenyl-1-picrylhydrazyl) and the elimination of this free radical was evaluated after 30 min of room temperature incubation in 96-well microplates. The absorbance of reduced DPPH was read at 517 nm, and the results were expressed as µM Trolox equivalent in 1 g of dry weight (µM TE∙g−1 DW). The positive control Trolox was applied at a concentration of 1.25–80 µM (R2 ≥ 0.99), with an LOD of 1.61 ± 1.097 µM and an LOQ of 15.24 ± 3.241 µM.

2.10. Phytohormone Analysis

Phytohormones were analyzed according to the method described by Prerostova et al. [44]. Briefly, samples (approximately 10 mg FW; two biological samples per experiment, resulting in six data points in total) were homogenized with zirconia balls in a FastPrep-24 5G homogenizer (MP Biomedicals, Irvine, CA, USA) for 40 s at 6 m s−1 and extracted twice with cold (−20 °C) methanol/water/formic acid (15/4/1, v/v/v). The following isotope-labeled standards were added at 10 pmol per sample: 13C6-IAA (Cambridge Isotope Laboratories, Tewksbury, MA, USA); 2H4-SA (Sigma-Aldrich, Saint Louis, MO, USA); 2H3-PA, 2H3-DPA (NRC-PBI, Canada); 2H6-ABA, 2H5-JA, 2H5-tZ, 2H5-tZR, 2H5-tZRMP, 2H5-tZ7G, 2H5-tZ9G, 2H5-tZOG, 2H5-tZROG, 15N4-cZ, 2H3-DZ, 2H3-DZR, 2H3-DZ9G, 2H3-DZRMP, 2H7-DZOG, 2H6-iP, 2H6-iPR, 2H6-iP7G, 2H6-iP9G, 2H6-iPRMP, 2H2-GA19, (2H5)(15N1)-IAA-Asp, and (2H5)(15N1)-IAA-Glu (Olchemim, Olomouc, Czech Republic). The extracts were centrifuged for 20 min at 4 °C and 17,000× g, and the supernatants were concentrated using an Christ Alpha RVC vacuum evaporator (Labexchange—Die Laborgerätebörse GmbH, Burladingen, Germany; 40 °C, 15 mbar, 1.5 h). Phytohormones were separated using a reverse-phase-cation exchange SPE column Oasis-MCX (Waters, Milford, MA, USA), yielding an acid fraction eluted with methanol and a basic fraction eluted with 0.35 M NH4OH in 60% MeOH. The acid and basic fractions were dried in a vacuum evaporator and resuspended in 30 μL of 15% acetonitrile and 5% MeOH, respectively. Phytohormone content was analyzed using an Ultimate 3000 HPLC system (Dionex, Sunnyvale, CA, USA) coupled to a 3200 Q TRAP hybrid triple quadrupole/linear ion trap mass spectrometer (Applied Biosystems, Waltham, MA, USA). Phytohormone metabolites were quantified using the isotope dilution method with multilevel calibration curves (R2 > 0.99) and the Analyst 1.5 software package (Applied Biosystems, Waltham, MA, USA).

2.11. Statistical Evaluation

All analyses were performed on at least 10–15 biological samples, with 3 independent technical measurements performed for each sample according to a particular assay. The measured levels of each compound were adjusted for the effect of locality by dividing each value by the mean of the appropriate locality and multiplying the result by the mean of that particular species. The resulting adjusted values were compared between infested and uninfested trees using the Mann-Whitney U test. All reported p values were two-tailed, and the level of statistical significance was set at α = 0.05. The values presented in Section 3 are the means and medians of the adjusted values. The data were processed and analyzed using MATLAB (version R2021a, MathWorks Inc., Natick, MA, USA).

3. Results

A substantial amount of data were measured in this study; therefore, we categorized the parameters into four groups: photosynthetic pigments, antioxidant enzymes, phytohormones, and antioxidant parameters. Representatives from each group are presented, where there was a significant difference between the uninfested and infested trees. Additional data, based on this scale, are presented in Table 2.

3.1. Photosynthetic Pigments

The most significant differences between the uninfested and infested trees were observed in terms of photosynthetic pigment content (Table 2). Notably, a significant reduction in chlorophyll a and b contents was observed in all three species of infested trees. For chlorophyll a, extremely significant reductions were observed from 123 ± 20.6 to 101 ± 17.9 μg/g DW (p = 0.0007) in pine, from 231 ± 33.1 to 199 ± 22.2 μg/g DW (p = 0.0017) in beech, and from 60 ± 5.66 to 51.3 ± 6.27 μg/g DW (p < 3.4 × 10⁻⁵) in fir (Figure 1A). Similarly, a significant reduction in the chlorophyll b content was observed. However, regarding the chlorophyll a/b ratio, an extremely significant reduction occurred only in fir, whereas the differences between the infested and uninfested pine and beech trees were not significant. Significant changes were also observed in the xanthophyll cycle pigments (violaxanthin, antheraxanthin, and zeaxanthin), which were best illustrated by de-epoxidation state values (Figure 1B). In the infested pine and fir, the values significantly increased from 0.170 ± 0.057 to 0.225 ± 0.087 (p = 0.014) and from 0.213 ± 0.032 to 0.233 ± 0.034 (p = 0.025), respectively. In infested beeches, there was a significant increase (p < 3.5 × 10⁻⁸) in values from 0.205 ± 0.030 to 0.300 ± 0.050.

3.2. Antioxidative Parameters

Among the antioxidant parameters, total phenolic content, flavonoid content, and DPPH radical scavenging capacity were determined. There were no statistically significant differences (0.06 ≤ p ≤ 0.88) in the measured values between the infested and uninfested trees. The DPPH radical scavenging capacity is presented in Figure 2, and the remaining results are included in the Table 2.

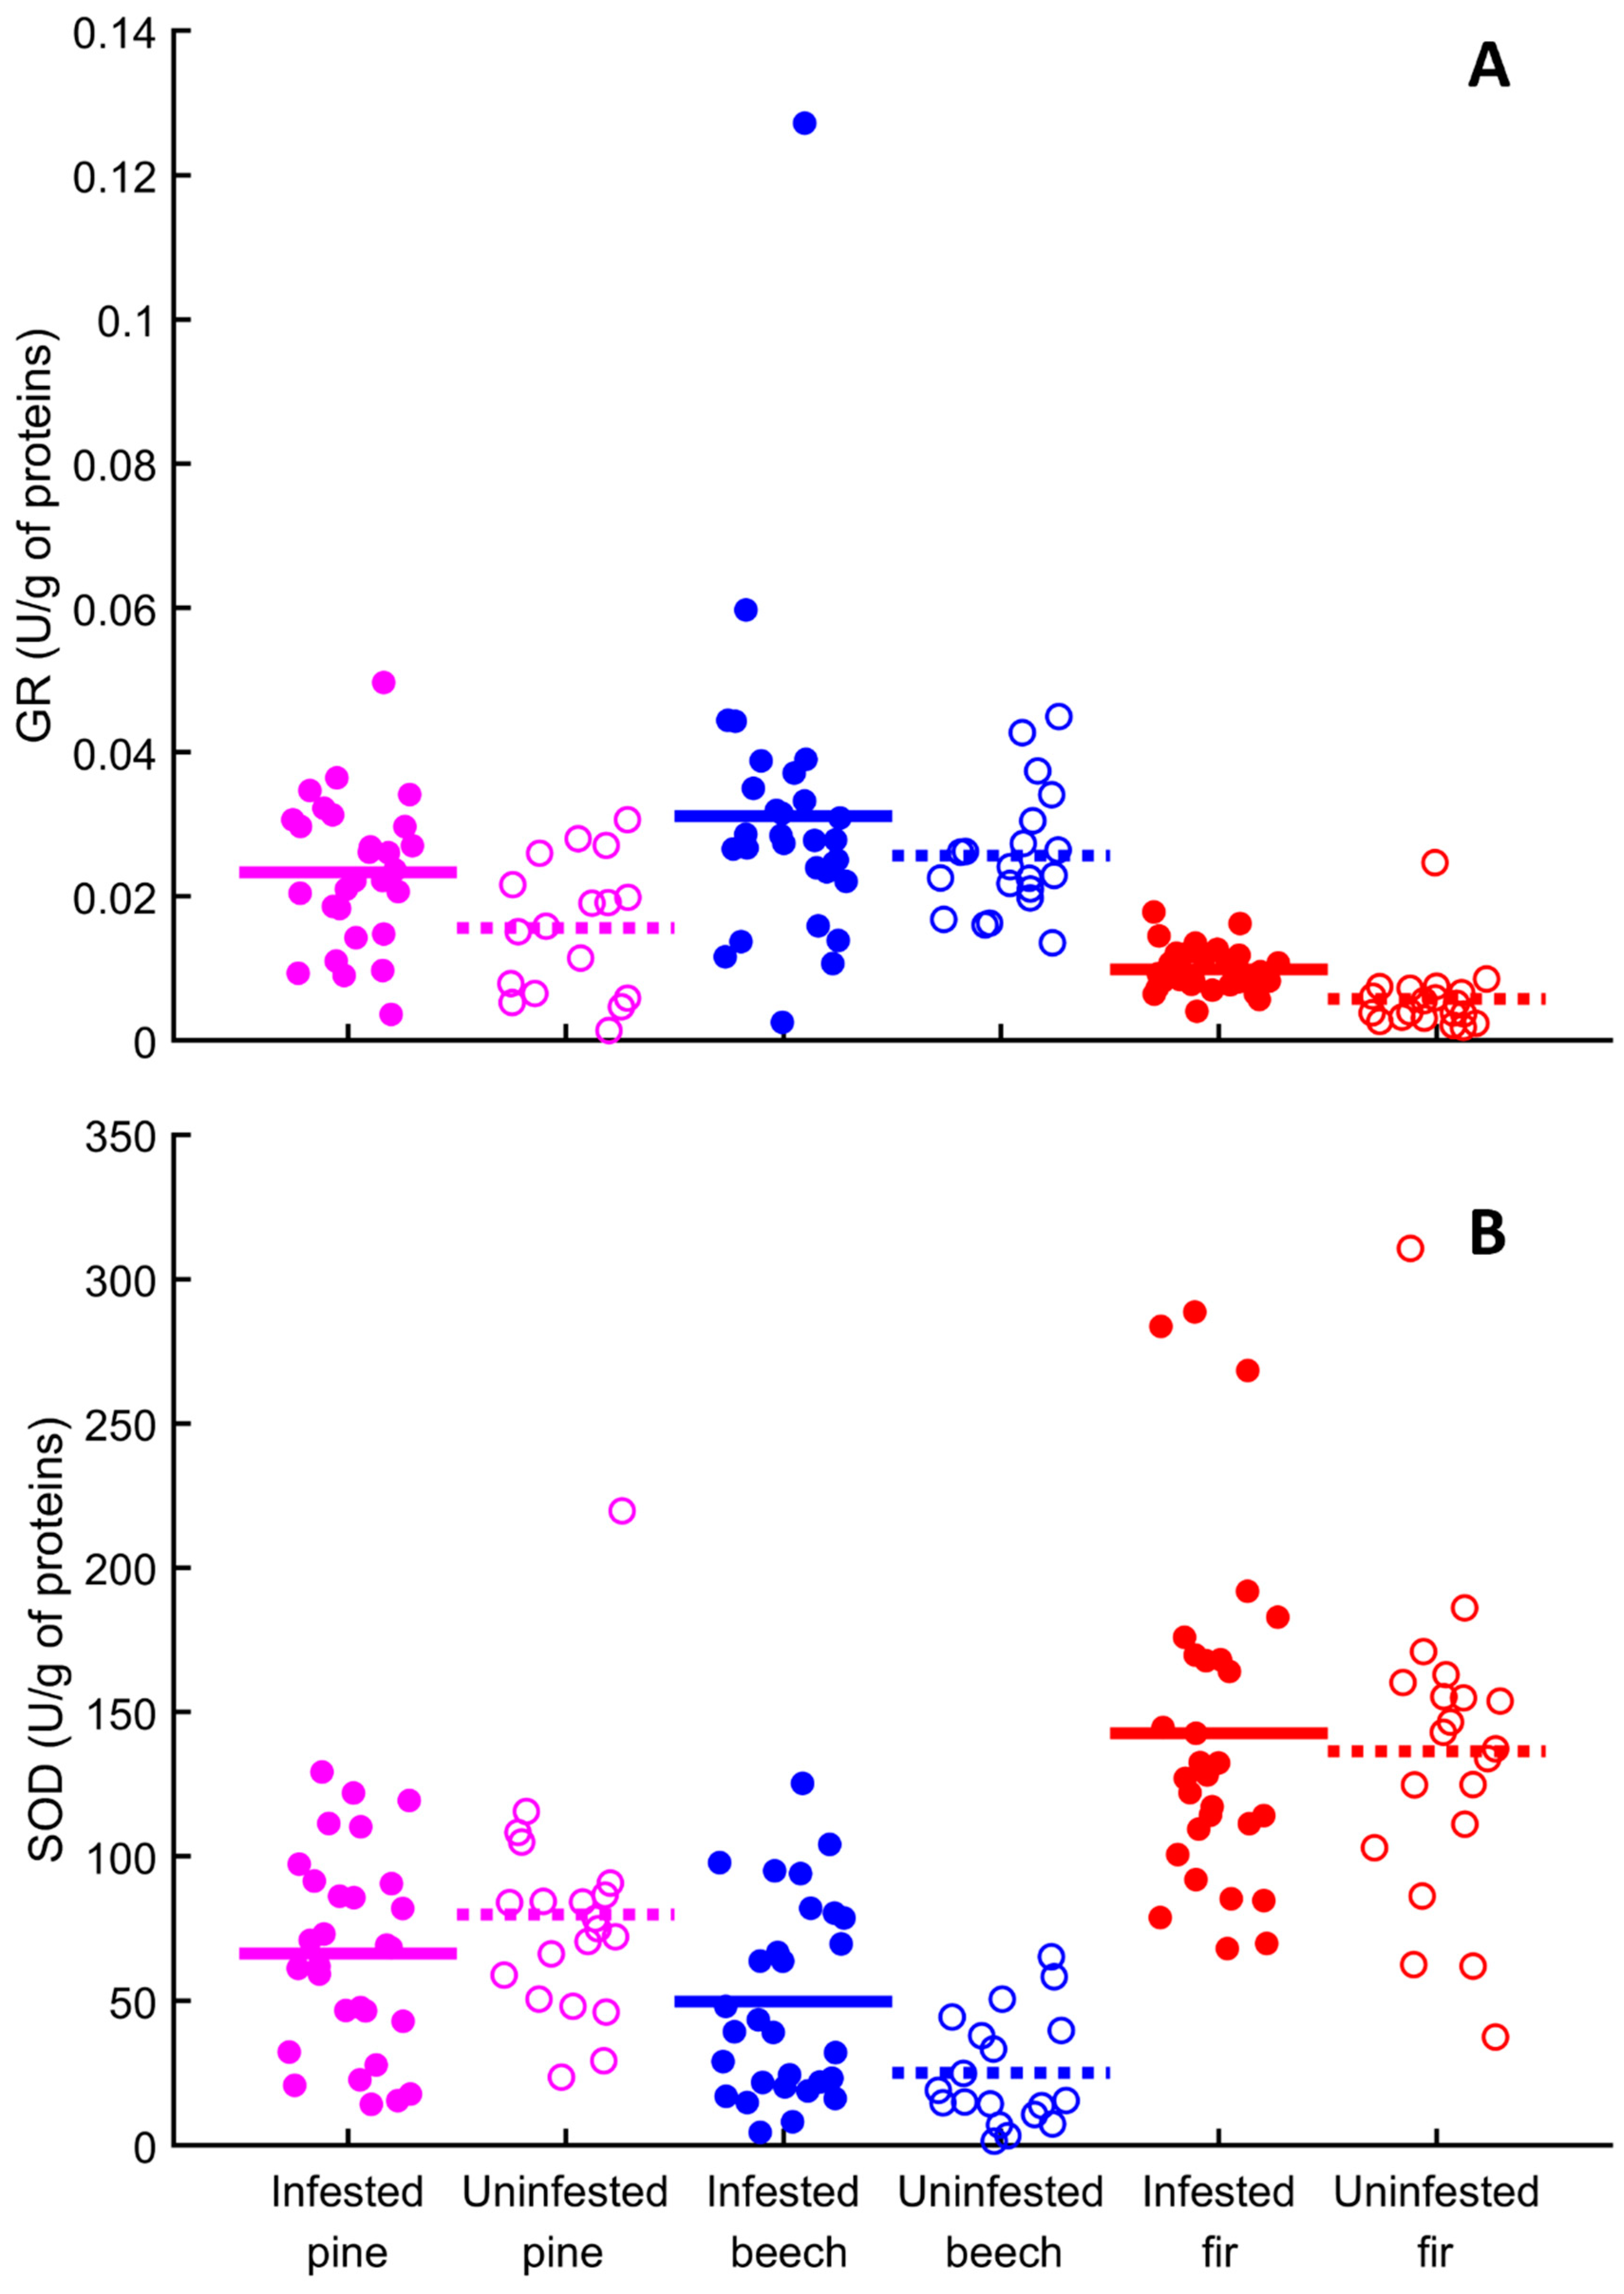
3.3. Antioxidant Enzymes

There was a significant increase in glutathione reductase (GR) activity in fir (from 0.006 ± 0.005 to 0.010 ± 0.003 U/mg protein, p < 0.6 × 10⁻⁵) and a significant increase in activity in pine (from 0.016 ± 0.009 to 0.023 ± 0.010 U/mg protein, p = 0.0198). There was also an increase in beech (from 0.026 ± 0.009 to 0.031 ± 0.021 U/mg protein); however, this difference was not significant (p > 0.187) (Figure 3A). Regarding SOD activity, a very significant increase in infested plants was determined in beech (from 25.1 ± 19.2 to 49.8 ± 33.7 U/mg protein, p = 0.0054). Additionally, a non-significant increase in the activity of the infested fir plants was observed (Figure 3B). The activities of other enzymes were slightly increased in the infested trees; however, the differences were not significant (Table 2).

3.4. Phytohormones

The analysis showed that the highest number of significant changes in phytohormone content was observed in pine. Conversely, the number of significant differences between infested and uninfested beech trees was very low, and particularly for fir trees.
In pine trees, a significant to extremely significant increase in cytokinin content was observed. For example, the content of trans-zeatin-O-glucoside increased from 0.770 ± 0.648 pmol/g FW (p = 1.07 × 10⁻⁴) in uninfested pines to 2.23 ± 1.59 pmol/g FW in infested pines (Figure 4A). An equally extremely significant response to bark beetle infestation was observed for dihydrozeatin-O-glucoside, where the content increased from 3.68 ± 3.06 to 11.6 ± 6.74 pmol/g FW (p = 4.53 × 10⁻⁵) in infested pines. In beech and fir, no significant differences were observed in cytokinin levels between infested and uninfested trees, except for N6-isopentenyladenosine (iPR). The iPR content in beech decreased significantly in the infested trees (from 5.83 ± 1.58 to 4.66 ± 1.75 pmol/g FW, p = 0.013), whereas a significant increase was observed in infested fir (from 1.28 ± 0.963 to 1.98 ± 1.57 pmol/g FW, p = 0.044) (Table 2).
The jasmonate content decreased significantly only in pine, with a particularly significant decrease in jasmonic acid (JA) from 219 ± 180 to 106 ± 111 pmol/g FW (p = 0.0066) in infested trees (Figure 4B). There were no significant differences between the other two tree species tested (0.094 ≤ p ≤ 0.158). However, an increase in JA and JA methyl ester contents was observed in the infested trees (Table 2).
At the auxin abundance level, it was not possible to generalize the results for all three species (Table 2). In most cases where significant differences were observed between infested and uninfested trees, there was a reduction in the content of one of the auxins in the infested trees. An extremely significant reduction in pine (from 118 ± 75.0 to 30.3 ± 30.5 pmol/g FW, p = 1.61 × 10⁻⁴) and a very significant reduction in fir (from 489 ± 341 to 141 ± 155 pmol/g FW, p = 2.70 × 10⁻³) was observed for methyl 2-(1H-indol-3-yl) acetate (IAA-Me) (Figure 4C). In contrast, beech showed a non-significant increase (p = 0.280) in the IAA-Me (Table 2).
Phenolic content did not differ significantly between the infested and uninfested trees. However, a significant increase in salicylic acid (SA) content was observed in beeches (from 587 ± 271 to 763 ± 267 pmol/g FW; p = 0.043). There was also an increase in SA in pines and firs, but it was not significant (from 206 ± 78.3 to 229 ± 122 pmol/g FW in pines and from 336 ± 393 to 341 ± 506 pmol/g FW in firs) (0.794 ≤ p ≤ 0.961) (Figure 4D). Additionally, a significant decrease in benzoic acid content was observed in pine trees (Table 2).
The last group of phytohormones detected was abscisic acid (ABA) and its derivatives. In beech and fir, the differences between infested and uninfested trees were not significant; however, in general, there was a slight increase in ABA derivatives in infested trees. In pine, we observed a highly significant decrease in ABA content from 10.774 ± 4.558 to 5.838 ± 4.315 nmol/g FW (p = 0.0012) and a further significant increase in abscisic acid methyl ester from 7.43 ± 6.26 to 12.6 ± 8.29 pmol/g FW (p = 0.022) (Figure 4E,F). For other ABAs, a non-significant decrease (0.065 ≤ p ≤ 0.863) in content was observed in infested pines (Table 2).

4. Discussion

Insect infestation activates multiple defense responses in plants both locally and systemically, such as the production of feeding deterrents, toxins, defensive proteins, enzymes, and secondary metabolites. Plants also often respond by altering their chlorophyll content [45].

4.1. Photosynthetic Pigments

When assessing the effects of biotic and abiotic stressors on the monitored tree populations, changes in photosynthetic pigment content were monitored. Our results showed a significant decrease in the content of chlorophyll a and chlorophyll b in infested plants across the monitored tree species, which is consistent with the findings of other studies [45,46,47,48]. Similar conclusions have been drawn when monitoring the effects of abiotic stress, particularly drought [49]. In contrast, some studies have reported an increase in chlorophyll content in response to insect herbivory [50], whereas others have not observed any changes, such as in oak [51]. However, a decrease in pigment content has also been observed in studies that have monitored changes in leaf reflectance [9]. The average reflectance of infested leaves was higher than that of healthy leaves and was related to chlorophyll degradation [52]. Chlorophyll degradation in trees attacked by bark beetles is a significant indicator of the physiological stress and damage inflicted by these pests [46].
In addition to their irreplaceable roles in photosynthesis, carotenoids are crucial in protecting plants against biotic and abiotic stressors. In our study, lower total carotenoid content was observed in infested plants, which corresponds to changes in chlorophyll content and suggests damage to the photosynthetic apparatus owing to stress [46]. Changes in carotenoid content of the xanthophyll cycle (violaxanthin, antheraxanthin, and zeaxanthin) indicate a stress response in plants [53]. This response was particularly evident in beech and fir trees, with no major differences observed in pine trees. These results indicate that, while the photosynthetic apparatus was damaged by stress in all monitored species, the protective function of xanthophyll cycle pigments was activated only in beech and fir. Carotenoids do not react as clearly as chlorophylls [54]. The carotenoid levels increase after infestation and decrease after a prolonged period [55] or simply decrease [56]. Therefore, this response to stress is not universal.

4.2. Antioxidative Parameters

Multiple studies have provided evidence that a major factor in resistance to bark beetle attack is the increased formation of resin, which is notably higher in uninfested trees than in susceptible trees. Trees defend themselves against bark beetles by increasing the production of phenolic compounds, which are likely to be part of the tree’s defense strategy against bark beetles and other pathogens, thus contributing to its overall resistance to pest infestations [57,58,59,60]. However, in our study, we found no significant differences in total phenol content and antioxidant activity, as determined by the DPPH scavenging capacity. This suggests that there may be no substantial differences in antioxidant phenolic compounds content between the uninfested and susceptible trees. The phenolic content can increase when spruce trees are attacked, more as a reaction to pathogens introduced by bark beetles during infestation than to the pest attack itself, possibly because of the antimicrobial properties of phenolic compounds. Nagel et al. [61] demonstrated in their study that the concentration of phenolic compounds increases after fungal inoculation, indicating their role as inducible antioxidant compounds. Their findings also suggested that before fungal inoculation, the total amounts of monoterpenes, diterpenes, and phenolics were greater in trees that had been previously attacked than in those under current attack or not attacked, implying that the previously attacked trees had higher constitutive levels of these antioxidant compounds.

4.3. Antioxidant Enzymes

One mechanism for scavenging reactive oxygen species is to increase the activity of the antioxidant enzymes. Previous studies have highlighted the correlation between the level of damage caused by insects and the activity of antioxidant enzymes (SOD, CAT, and POD) in plants [46,62,63]. In particular, an increase in SOD activity, which converts the superoxide radicals generated by NADPH oxidase into hydrogen peroxide, has been described in response to insect attacks across various plant species. For example, a significantly higher amount of SOD in infested plants than in the control was found in the leaves of date palms attacked by Dubas bugs [64], as well as in Populus cathayana infested by Melampsora larici-populina in both male and female trees [65]. Similarly, elevated activities of SOD, POD, and CAT in winter jujube leaves were reported to be induced by Apolygus lucorum damage [66] and in sorghum after shoot fly attack [67]. In our experiments, a significant increase in SOD activity was observed in the infested beeches, whereas a non-significant increase in activity was observed in the infested fir.
However, the effects of antioxidant enzymes involved in hydrogen peroxide reduction and those involved in the ascorbate-glutathione cycle, such as POD, GR, and GST, are not consistent. For example, Nikolic et al. [68] found that CAT activity was significantly reduced in oak leaves infested with Corythucha arcuata, whereas APX activity increased. However, POD activity remained unchanged. Conversely, Li et al. [66] reported significant increases in POD, CAT, and SOD activities in winter jujube leaves induced by A. lucorum damage. In our study, POD and CAT activities were only slightly increased in infested trees, whereas APX and GST activities remained unaltered across all monitored tree species. Notably, there was a highly significant increase in GR activity in fir.

4.4. Phytohormones

Biochemically, the stress response of trees is a complex mechanism primarily triggered by a combination of drought stress, fungal infection, and herbicide insect pests. These defense responses are regulated by phytohormones, with key players including ABA, JA, SA, and ethylene [69,70,71,72]. For instance, in Sitka spruce (Picea sitchensis), induction of ethylene pathway genes has been linked to mechanical injury and insect browsing. Nagel et al. [61] reported that infection of mature spruce tree bark by the fungus E. polonica induces the jasmonate pathway but not the salicylic acid pathway. The amounts of JA and several other JA metabolites increased substantially in all categories of tree samples after inoculation with E. polonica, regardless of the bark beetle infestation history. However, SA was not detected either before or after the inoculation. Zhao et al. [73] reported changes in the metabolome and JA, SA, indolyl-acetic acid (IAA), and ABA contents of Chinese pine after stimulation with Chinese pine caterpillar feeding. A previous study reported that Chinese pine triggers the flavonoid pathway after caterpillar feeding and mechanical wounding, in contrast to JA, IAA, and ABA. JA and SA were mainly involved in the development of resistance, whereas the expression of the growth-related hormones IAA and ABA showed no significant changes. In Douglas fir (Pseudotsuga menziesii) and giant sequoia (Sequoiadendron giganteum), the formation of traumatic resin channels is induced by ethylene and methyljasmonate in response to wounding [74].
Our experimental design was intended to exclude the effects of drought stress because all trees grew under the same water conditions at the selected sites. Consequently, any observed stress can be primarily attributed to the effects of bark beetle infestation, which is potentially compounded by fungal infections. Interestingly, these trees exhibited distinct responses to insect infestations. In pine, we noted a decrease in JA and other jasmonates and a significant increase in some cytokinins. Conversely, fir and beech showed no discernible effects. Notably, SA content increased significantly only in beech. These findings are consistent with the observations of Zlobin et al. [75], who reported a significant increase in active CK content due to water stress in pine needles even during the initial stages of treatment. However, unlike our study, they did not observe a significant positive response of jasmonate levels to water-deficit conditions in pine and spruce seedlings. Thus, it is possible that the measured phytohormone levels are related to drought stress in pines rather than insect-feeding stress.

5. Conclusions

This study reported changes in the metabolomes of pine, fir, and beech following bark beetle infestation. Our data highlight the distinct species-specific responses to the investigated compounds. However, our interest was not in the baseline levels but rather in the manner in which the levels differed between bark-beetle-infested and uninfested plants in each species. Notably, pigment levels exhibited the strongest association with the infestation status across all species, consistently showing lower levels in the infested plants. In contrast, enzymatic activity showed only isolated cases of significantly associated variables, and antioxidative properties failed to produce any variables associated with infestation status. Phytohormones, including cytokinins, ABA derivatives, auxins, JA derivatives, and phenolic phytohormones, were the most diverse and numerous groups of biochemical parameters we analyzed. Among these, cytokinins were the most distinct, with many significantly increased in infested pines, whereas both beech and fir showed only one significant association. Interestingly, the cytokinin forms associated with pine infestation comprised all CK families (cZ-, tZ-, DZ-, and iP-families) as well as multiple metabolic types (free bases, nucleotides, and O-glucosides). Additionally, derivatives of jasmonic acid also showed a distinct pattern of change associated with bark beetle infestation, with the levels of three out of four analyzed jasmonates being significantly decreased in infested pine, whereas no effects were observed in beech and fir.
In summary, the data showed that pines responded differently to bark beetles than to beeches or fir. The greatest changes in phytohormones were observed in pine, whereas the most significant changes in photosynthetic pigments were observed in beech and fir. However, further research is needed to understand the balance between the defensive responses to herbivory and their effects on tree growth.

Author Contributions

P.S.: Conceptualization, Supervision, Funding acquisition, Project administration, Writing—original draft, Writing—review and editing, R.P.: Investigation, Writing—original draft, L.L.: Investigation, Writing—original draft, K.M.: Investigation, Writing—review and editing, M.D.: Investigation, Writing—review and editing, Š.P.: Investigation, Writing—original draft, D.H.: Investigation, Writing—original draft, T.M.S.: Investigation, Writing—review and editing, P.I.D.: Investigation, Writing—review and editing, A.G.: Investigation, Writing—review and editing, P.M.: Conceptualization, Funding acquisition, Project administration, Writing—review and editing, A.V.: Methodology, Writing—review and editing, M.F.: Resources, Writing—review and editing, H.C.: Writing—review and editing, P.H.: Formal analysis, Data curation, Writing—original draft, K.B.-B.: Investigation, Writing—review and editing. All authors have read and agreed to the published version of the manuscript.

Funding

The author(s) declare that financial support was received for the research, authorship, and/or publication of this article. Supported by grant NAZV, No. QK22020062 financed by the Ministry of Agriculture of the Czech Republic.

Institutional Review Board Statement

Not applicable.

Informed Consent Statement

Not applicable.

Data Availability Statement

Original data presented in the study are included in the main text, and further inquiries can be directed to the corresponding author.

Conflicts of Interest

The authors declare no conflict of interest.

References

  1. Allen, C.D.; Macalady, A.K.; Chenchouni, H.; Bachelet, D.; McDowell, N.; Vennetier, M.; Kitzberger, T.; Rigling, A.; Breshears, D.D.; Hogg, E.H.; et al. A global overview of drought and heat-induced tree mortality reveals emerging climate change risks for forests. For. Ecol. Manag. 2010, 259, 660–684. [Google Scholar] [CrossRef]
  2. Huang, J.; Kautz, M.; Trowbridge, A.M.; Hammerbacher, A.; Raffa, K.F.; Adams, H.D.; Goodsman, D.W.; Xu, C.; Meddens, A.J.H.; Kandasamy, D.; et al. Tree defence and bark beetles in a drying world: Carbon partitioning, functioning and modelling. New Phytol. 2020, 225, 26–36. [Google Scholar] [CrossRef]
  3. Jactel, H.; Petit, J.; Desprez-Loustau, M.-L.; Delzon, S.; Piou, D.; Battisti, A.; Koricheva, J. Drought effects on damage by forest insects and pathogens: A meta-analysis. Glob. Change Biol. 2012, 18, 267–276. [Google Scholar] [CrossRef]
  4. Weiskopf, S.R.; Rubenstein, M.A.; Crozier, L.G.; Gaichas, S.; Griffis, R.; Halofsky, J.E.; Hyde, K.J.W.; Morelli, T.L.; Morisette, J.T.; Muñoz, R.C.; et al. Climate change effects on biodiversity, ecosystems, ecosystem services, and natural resource management in the United States. Sci. Total Environ. 2020, 733, 137782. [Google Scholar] [CrossRef]
  5. Sommerfeld, A.; Rammer, W.; Heurich, M.; Hilmers, T.; Müller, J.; Seidl, R. Do bark beetle outbreaks amplify or dampen future bark beetle disturbances in Central Europe? J. Ecol. 2021, 109, 737–749. [Google Scholar] [CrossRef]
  6. Netherer, S.; Panassiti, B.; Pennerstorfer, J.; Matthews, B. Acute Drought Is an Important Driver of Bark Beetle Infestation in Austrian Norway Spruce Stands. Front. For. Glob. Change 2019, 2, 39. [Google Scholar] [CrossRef]
  7. Lubojacký, J.; Lorenc, F.; Liška, J.; Knížek, M. Hlavní problémy v ochraně lesa v Česku v roce 2018 a prognóza na rok 2019. In Zpravodaj Ochrany Lesa Knížek M (Hrsg.); Forest Protection Service and Forestry and Game Management Research Institute: Prague, Czech Republic, 2019; pp. 14–19. Available online: www.vulhm.cz/files/uploads/2019/06/ZOL_22_2019.pdf (accessed on 7 October 2024).
  8. Hlásny, T.; König, L.; Krokene, P.; Lindner, M.; Montagné-Huck, C.; Müller, J.; Qin, H.; Raffa, K.F.; Schelhaas, M.-J.; Svoboda, M.; et al. Bark Beetle Outbreaks in Europe: State of Knowledge and Ways Forward for Management. Curr. Forestry Rep. 2021, 7, 138–165. [Google Scholar] [CrossRef]
  9. Dobor, L.; Hlásny, T.; Rammer, W.; Zimová, S.; Barka, I.; Seidl, R. Is salvage logging effectively dampening bark beetle outbreaks and preserving forest carbon stocks? J. Appl. Ecol. 2020, 57, 67–76. [Google Scholar] [CrossRef]
  10. Messier, C.; Bauhus, J.; Sousa-Silva, R.; Auge, H.; Baeten, L.; Barsoum, N.; Bruelheide, H.; Caldwell, B.; Cavender-Bares, J.; Dhiedt, E.; et al. For the sake of resilience and multifunctionality, let’s diversify planted forests! Conserv. Lett. 2022, 15, e12829. [Google Scholar] [CrossRef]
  11. Bose, A.K.; Gessler, A.; Büntgen, U.; Rigling, A. Tamm review: Drought-induced Scots pine mortality—Trends, contributing factors, and mechanisms. For. Ecol. Manag. 2024, 561, 121873. [Google Scholar] [CrossRef]
  12. Durand-Gillmann, M.; Cailleret, M.; Boivin, T.; Nageleisen, L.-M.; Davi, H. Individual vulnerability factors of Silver fir (Abies alba Mill.) to parasitism by two contrasting biotic agents: Mistletoe (Viscum album L. ssp. abietis) and bark beetles (Coleoptera: Curculionidae: Scolytinae) during a decline process. Ann. For. Sci. 2014, 71, 659–673. [Google Scholar] [CrossRef]
  13. Foit, J.; Čermák, V. Colonization of disturbed Scots pine trees by bark- and wood-boring beetles. Agr. Forest Entomol. 2014, 16, 184–195. [Google Scholar] [CrossRef]
  14. Hlávková, D.; Doležal, P. Cambioxylophagous Pests of Scots Pine: Ecological Physiology of European Populations—A Review. Front. For. Glob. Change 2022, 5, 864651. [Google Scholar] [CrossRef]
  15. Háva, J.; Holuša, J. First record of the siricid Urocerus albicornis, an invasive alien pest, in the Czech Republic. J. Appl. Entomol. 2019, 143, 487–491. [Google Scholar] [CrossRef]
  16. Rouault, G.; Candau, J.-N.; Lieutier, F.; Nageleisen, L.-M.; Martin, J.C.; Warzée, N. Effects of drought and heat on forest insect populations in relation to the 2003 drought in Western Europe. Ann. For. Sci. 2006, 63, 613–624. [Google Scholar] [CrossRef]
  17. Stauder, C.M.; Utano, N.M.; Kasson, M.T. Resolving host and species boundaries for perithecia-producing nectriaceous fungi across the central Appalachian Mountains. Fungal Ecol. 2020, 47, 100980. [Google Scholar] [CrossRef]
  18. Perlík, M.; Kraus, D.; Bußler, H.; Neudam, L.; Pietsch, S.; Mergner, U.; Seidel, D.; Sebek, P.; Thorn, S. Canopy openness as the main driver of aculeate Hymenoptera and saproxylic beetle diversity following natural disturbances and salvage logging. For. Ecol. Manag. 2023, 540, 121033. [Google Scholar] [CrossRef]
  19. Franceschi, V.R.; Krokene, P.; Christiansen, E.; Krekling, T. Anatomical and chemical defenses of conifer bark against bark beetles and other pests. New phytol. 2005, 167, 353–376. [Google Scholar] [CrossRef] [PubMed]
  20. Gaylord, M.L.; Kolb, T.E.; Pockman, W.T.; Plaut, J.A.; Yepez, E.A.; Macalady, A.K.; Pangle, R.E.; McDowell, N.G. Drought predisposes piñon–juniper woodlands to insect attacks and mortality. New Phytol. 2013, 198, 567–578. [Google Scholar] [CrossRef]
  21. Arango-Velez, A.; El Kayal, W.; Copeland, C.C.J.; Zaharia, L.I.; Lusebrink, I.; Cooke, J.E.K. Differences in defence responses of Pinus contorta and Pinus banksiana to the mountain pine beetle fungal associate Grosmannia clavigera are affected by water deficit. Plant Cell Environ. 2016, 39, 726–744. [Google Scholar] [CrossRef]
  22. Netherer, S.; Kandasamy, D.; Jirosová, A.; Kalinová, B.; Schebeck, M.; Schlyter, F. Interactions among Norway spruce, the bark beetle Ips typographus and its fungal symbionts in times of drought. J. Pest. Sci. 2021, 94, 591–614. [Google Scholar] [CrossRef] [PubMed]
  23. Erbilgin, N.; Galvez, D.A.; Zhang, B.; Najar, A. Resource availability and repeated defoliation mediate compensatory growth in trembling aspen (Populus tremuloides) seedlings. PeerJ 2014, 2, e491. [Google Scholar] [CrossRef] [PubMed]
  24. Kolb, T.; Keefover-Ring, K.; Burr, S.J.; Hofstetter, R.; Gaylord, M.; Raffa, K.F. Drought-Mediated Changes in Tree Physiological Processes Weaken Tree Defenses to Bark Beetle Attack. J. Chem. Ecol. 2019, 45, 888–900. [Google Scholar] [CrossRef]
  25. Sallé, A.; Monclus, R.; Yart, A.; Lieutier, F. Effect of phenolic compounds on the in vitro growth of two fungi associated with Ips typographus. Forest Pathol. 2005, 35, 298–304. [Google Scholar] [CrossRef]
  26. Klutsch, J.; Shamoun, S.; Erbilgin, N. Drought stress leads to systemic induced susceptibility to a necrotrophic fungus associated with mountain pine beetle in Pinus banksiana seedlings. PLoS ONE 2017, 12, e0189203. [Google Scholar] [CrossRef] [PubMed]
  27. Barton, K.E.; Koricheva, J. The Ontogeny of Plant Defense and Herbivory: Characterizing General Patterns Using Meta-Analysis. Am. Nat. 2010, 175, 481–493. [Google Scholar] [CrossRef] [PubMed]
  28. Forkner, R.E.; Marquis, R.J.; Lill, J.T. Feeny revisited: Condensed tannins as anti-herbivore defences in leaf-chewing herbivore communities of Quercus. Ecol. Entomol. 2004, 29, 174–187. [Google Scholar] [CrossRef]
  29. Bussotti, F.; Gravano, E.; Grossoni, P.; Tani, C. Occurrence of tannins in leaves of beech trees (Fagus sylvatica) along an ecological gradient, detected by histochemical and ultrastructural analyses. New Phytol. 1998, 138, 469–479. [Google Scholar] [CrossRef]
  30. Dubeler, A.; Voltmer, G.; Gora, V.; Lunderstadt, J.; Zeeck, A. Phenols from Fagus sylvatica and their role in defence against Cryptococcus fagisuga. Phytochem. 1997, 45, 51–57. [Google Scholar] [CrossRef]
  31. Mämmelä, P. Phenolics in selected European hardwood species by liquid chromatography-electrospray ionisation mass spectrometry. Analyst 2001, 126, 1535–1538. [Google Scholar] [CrossRef]
  32. Feeny, P. Seasonal changes in oak leaf tannins and nutrients as a cause of spring feeding by winter moth caterpillars. Ecology 1970, 51, 565–581. [Google Scholar] [CrossRef]
  33. Barbehenn, R.V.; Walker, A.C.; Uddin, F. Antioxidants in the midgut fluids of a tannin-tolerant and a tannin-sensitive caterpillar: Effects of seasonal changes in tree leaves. J. Chem. Ecol. 2003, 29, 1099–1116. [Google Scholar] [CrossRef] [PubMed]
  34. Bradford, M.M. A rapid and sensitive method for the quantitation of microgram quantities of protein utilizing the principle of protein-dye binding. Anal. Biochem. 1976, 72, 248–254. [Google Scholar] [CrossRef] [PubMed]
  35. Stuchlikova, L.R.; Skalova, L.; Szotakova, B.; Syslova, E.; Vokral, I.; Vanek, T.; Podlipna, R. Biotransformation of flubendazole and fenbendazole and their effects in the ribwort plantain (Plantago lanceolata). Ecotoxicol. Environ. Saf. 2018, 147, 681–687. [Google Scholar] [CrossRef]
  36. El-Shabrawi, H.; Kumar, B.; Kaul, T.; Reddy, M.K.; Singla-Pareek, S.L.; Sopory, S.K. Redox homeostasis, antioxidant defense, and methylglyoxal detoxification as markers for salt tolerance in Pokkali rice. Protoplasma 2010, 245, 85–96. [Google Scholar] [CrossRef]
  37. Drotar, A.; Phelps, P.; Fall, R. Evidence for glutathione-peroxidase activities in cultured plant-cells. Plant Sci. 1985, 42, 35–40. [Google Scholar] [CrossRef]
  38. Verma, S.; Dubey, R.S. Lead toxicity induces lipid peroxidation and alters the activities of antioxidant enzymes in growing rice plants. Plant Sci. 2003, 164, 645–655. [Google Scholar] [CrossRef]
  39. Vanacker, H.; Carver, T.L.W.; Foyer, C.H. Pathogen-induced changes in the antioxidant status of the apoplast in barley leaves. Plant Physiol. 1998, 117, 1103–1114. [Google Scholar] [CrossRef] [PubMed]
  40. Habig, W.H.; Pabst, M.J.; Jakoby, W.B. Glutathione-S-Transferases—First enzymatic step in mercapturic acid formation. J. Biol. Chem. 1974, 249, 7130–7139. [Google Scholar] [CrossRef]
  41. Singleton, V.L.; Rossi, J.A. Colorimetry of Total Phenolics with Phosphomolybdic-Phosphotungstic Acid Reagents. Am. J. Enol. Vitic. 1965, 16, 144–158. [Google Scholar] [CrossRef]
  42. Matić, P.; Sabljić, M.; Jakobek, L. Validation of Spectrophotometric Methods for the Determination of Total Polyphenol and Total Flavonoid Content. J. AOAC Int. 2017, 100, 1795–1803. [Google Scholar] [CrossRef] [PubMed]
  43. Langhansova, L.; Pumprova, K.; Haisel, D.; Ekrt, L.; Pavicic, A.; Zajíčková, M.; Vanek, T.; Dvorakova, M. European ferns as rich sources of antioxidants in the human diet. Food Chem. 2021, 356, 129637. [Google Scholar] [CrossRef] [PubMed]
  44. Prerostova, S.; Dobrev, P.I.; Kramna, B.; Gaudinova, A.; Knirsch, V.; Spichal, L.; Zatloukal, M.; Vankova, R. Heat acclimation and inhibition of cytokinin degradation positively affect heat stress tolerance of Arabidopsis. Front. Plant Sci. 2020, 11, 87. [Google Scholar] [CrossRef]
  45. Baldy, R.W.; DeBenedictis, J.A.; Johnson, L.; Weber, E.; Baldy, M.; Osborn, B.; Burleigh, J. Leaf colour and vine size are related to yield in a phylloxera-infested vineyard. Vitis 1996, 35, 201–205. [Google Scholar] [CrossRef]
  46. Liu, J.; Chen, H.; Wang, J.; Chen, X.; Yang, Z.; Liang, J. Photosynthetic traits and antioxidative defense responses of Pinus yunnanensis after joint attack by bark beetles Tomicus yunnanensis and T. minor. J. For. Res. 2019, 30, 2031–2038. [Google Scholar] [CrossRef]
  47. Aldea, M.; Hamilton, J.G.; Resti, J.P.; Zangerl, A.R.; Berenbaum, M.R.; DeLucia, E.H. Indirect effects of insect herbivory on leaf gas exchange in soybean. Plant Cell Environ. 2005, 28, 402–411. [Google Scholar] [CrossRef]
  48. Tang, J.Y.; Zielinski, R.E.; Zangerl, A.R.; Crofts, A.R.; Berembaum, M.R.; DeLucia, E.H. The differential effects of herbivory by first and fourth instars of Trichoplusia ni (Lepidoptera: Noctuidae) on photosynthesis in Arabidopsis thaliana. J. Exp. Bot. 2006, 57, 527–536. [Google Scholar] [CrossRef] [PubMed]
  49. Arpiwi, N.L.; Muksin, I.K.; Nio, S.A. Drought Stress Decreases Morphophysiological Characteristics of Pongamia pinnata (L.) Pierre a Biodiesel Tree. Pak. J. Biol. Sci. 2023, 26, 463–471. [Google Scholar] [CrossRef]
  50. Bown, A.W.; Hall, D.E.; MacGregor, K.B. Insect footsteps leaves stimulate the accumulation of 4-aminobutyrate and can be visualized through increased chlorophyll fluorescence and superoxide production. Plant Physiol. 2002, 129, 1430–1434. [Google Scholar] [CrossRef]
  51. Cárdenas, A.; Gallardo, P. Relationship between insect damage and chlorophyll content in mediterranean oak species. Appl. Ecol. Environ. Res. 2016, 14, 477–491. [Google Scholar] [CrossRef]
  52. Abdullah, H.; Darvishzadeh, R.; Skidmore, A.K.; Groen, T.A.; Heurich, M. European spruce bark beetle (Ips typographus L.) green attack affects foliar reflectance and biochemical properties. Int. J. Appl. Earth Obs. Geoinf. 2018, 64, 199–209. [Google Scholar] [CrossRef]
  53. Demmig-Adams, B.; Adams, W.W. The role of xanthophyll cycle carotenoids in the protection of photosynthesis. Trends Plant Sci. 1996, 1, 21–26. [Google Scholar] [CrossRef]
  54. Pastierovič, F.; Kalyniukova, A.; Hradecký, J.; Dvořák, O.; Vítámvás, J.; Mogilicherla, K.; Tomášková, I. Biochemical Responses in Populus tremula: Defending against Sucking and Leaf-Chewing Insect Herbivores. Plants 2024, 13, 1243. [Google Scholar] [CrossRef] [PubMed]
  55. Golan, K.; Rubinowska, K.; Kmieć, K.; Kot, I.; Górska-Drabik, E.; Łagowska, B.; Michałek, W. Impact of scale insect infestation on the content of photosynthetic pigments and chlorophyll fluorescence in two host plant species. Arthropod-Plant Inte. 2015, 9, 55–65. [Google Scholar] [CrossRef]
  56. Othmen, S.B.; Boussaa, F.; Hajji-Hedfi, L. Effects of nymphal density (Bactericera trigonica) and feeding on photosynthetic pigments, proline content and phenolic compounds in car-rot plants. Eur. J. Plant. Pathol. 2022, 163, 51–59. [Google Scholar] [CrossRef]
  57. Krajnc, A.U. A temporal analysis of antioxidative defense responses in the phloem of Picea abies after attack by Ips typographus. Tree Physiol. 2009, 29, 1059–1068. [Google Scholar] [CrossRef]
  58. Krajnc, A.U.; Kristl, J.; Ivancic, A. Application of salicylic acid induces antioxidant defense responses in the phloem of Picea abies and inhibits colonization by Ips typographus. For. Ecol. Manag. 2011, 261, 416–426. [Google Scholar] [CrossRef]
  59. Wainhouse, D.; Rose, D.R.; Peace, A.J. The influence of preformed defences on the dynamic wound response in Spruce bark. Funct. Ecol. 1997, 11, 564–572. [Google Scholar] [CrossRef]
  60. Korolyova, N.; Buechling, A.; Lieutier, F.; Yart, A.; Cudlín, P.; Turčáni, M.; Jakuš, R. Primary and secondary host selection by Ips typographus depends on Norway spruce crown characteristics and phenolic-based defenses. Plant Sci. 2022, 321, 111319. [Google Scholar] [CrossRef]
  61. Nagel, R.; Hammerbacher, A.; Kunert, G.; Phillips, M.A.; Gershenzon, J.; Schmidt, A. Bark Beetle Attack History Does Not Influence the Induction of Terpene and Phenolic Defenses in Mature Norway Spruce (Picea abies) Trees by the Bark Beetle-Associated Fungus Endoconidiophora polonica. Front. Plant Sci. 2022, 13, 892907. [Google Scholar] [CrossRef]
  62. Manzoor, M.; Yang, L.; Wu, S.; El-Shafie, H.; Haider, M.S.; Ahmad, J.N. Feeding preference of Rhynchophorus ferrugineus (Oliver) (Coleoptera: Curculionidae) on different date palm cultivars and host biochemical responses to its infestation. Bull. Entom. Res., Lond. 2022, 112, 494–501. [Google Scholar] [CrossRef] [PubMed]
  63. Sau, A.K.; Dhillon, M.K.; Trivedi, N. Activation of antioxidant defense in maize in response to attack by Sesamia inferens (Walker). Phytoparasitica 2022, 50, 1043–1058. [Google Scholar] [CrossRef]
  64. Khan, A.L.; Asaf, S.; Khan, A.; Khan, A.; Imran, M.; Al-Harrasi, A.; Lee, I.-J.; Al-Rawahi, A. Transcriptomic analysis of Dubas bug (Ommatissus lybicus Bergevin) infestation to Date Palm. Sci. Rep. 2020, 10, 11505. [Google Scholar] [CrossRef]
  65. Zhang, S.; Lu, S.; Xu, X.; Korpelainen, H.; Li, C. Changes in antioxidant enzyme activities and isozyme profiles in leaves of male and female Populus cathayana infected with Melampsora larici-populina. Tree Physiol. 2010, 30, 116–128. [Google Scholar] [CrossRef]
  66. Li, L.M.; Men, X.Y.; Ye, B.H.; Yu, Y.; Zhang, A.S.; Li, L.L.; Zhou, X.H.; Zhuang, Q.Y. Defense enzyme activity of Winter Jujube at different stages induced by the damage of Apolygus lucorum. Sci. Agric. Sin. 2014, 47, 191–198. [Google Scholar] [CrossRef]
  67. Kumari, A.; Goyal, M.; Mittal, A.; Kumar, R. Defensive capabilities of contrasting sorghum genotypes against Atherigona soccata (Rondani) infestation. Protoplasma 2022, 259, 809–822. [Google Scholar] [CrossRef]
  68. Nikolic, N.; Pilipovic, A.; Drekic, M.; Kojic, D.; Poljakovic-Pajnik, L.; Orlovic, S.; Arsenov, D. Physiological responses of pedunculate oak (Quercus robur L.) to Corythucha arcuata (Say, 1832) attack. Arch. Biol. Sci. 2019, 71, 167–176. [Google Scholar] [CrossRef]
  69. Kunkel, B.N.; Brooks, D.M. Cross talk between signaling pathways in pathogen defense. Curr. Opin. Plant Biol. 2002, 5, 325–331. [Google Scholar] [CrossRef] [PubMed]
  70. Eldhuset, T.D.; Nagy, N.E.; Volařík, D.; Børja, I.; Gebauer, R.; Yakovlev, I.A.; Krokene, P. Drought affects tracheid structure, dehydrin expression, and above- and belowground growth in 5-year-old Norway spruce. Plant Soil. 2013, 366, 305–320. [Google Scholar] [CrossRef]
  71. Jackson, G.E.; Irvine, J.; Grace, J.; Khalil, A.A.M. Abscisic acid concentrations and fluxes in droughted conifer saplings. Plant Cell Environ. 1995, 18, 13–22. [Google Scholar] [CrossRef]
  72. Tan, W.; Blake, T.J. Drought tolerance, abscisic acid and electrolyte leakage in fast-and slow-growing black spruce (Picea mariana) progenies. Physiol. Plant. 1993, 89, 817–823. [Google Scholar] [CrossRef]
  73. Zhao, Y.; Zhou, G.; Sun, T.; Wang, L.; Xu, Q.; Liu, J.; Gao, B. Metabolites and Plant Hormones Related to the Resistance Response to Feeding Stimulation and Leaf Clipping Control in Chinese Pine (Pinus tabuliformis Carr.). Curr. Issues Mol. Biol. 2023, 45, 1086–1099. [Google Scholar] [CrossRef] [PubMed]
  74. Hudgins, J.W.; Franceschi, V.R. Methyl jasmonate-induced ethylene production is responsible for conifer phloem defense responses and reprogramming of stem cambial zone for traumatic resin duct formation. Plant Physiol. 2004, 135, 2134–2149. [Google Scholar] [CrossRef] [PubMed]
  75. Zlobin, I.E.; Vankova, R.; Pashkovskiy, P.P.; Dobrev, P.; Kartashov, A.V.; Ivanov, Y.V.; Kuznetsov, V.V. Profiles of endogenous phytohormones and expression of some hormone-related genes in Scots pine and Norway spruce seedlings under water deficit. Plant Physiol. Biochem. 2020, 151, 457–468. [Google Scholar] [CrossRef]
Figure 1. Chlorophyll a content (μg/g DW) (A) and de-epoxidation state values (dimensionless) (B) adjusted for the effect of locality in needles of fir (red color) and pine (magenta color) trees and leaves of beech (blue color) trees. Number of infested trees (nI) = 30, number of uninfested trees (nU) = 20. Samples were collected on two sites (nI/nU = 15/10 per site).
Forests 15 01761 g001
Figure 2. DPPH radical scavenging capacity adjusted for the effect of locality (µM Trolox eqv./g DW) in needles of fir (red color) and pine (magenta color) trees and leaves of beech (blue color) trees. Number of infested trees (nI) = 30, number of uninfested trees (nU) = 20. Samples were collected on two sites (nI/nU = 15/10 per site).
Forests 15 01761 g002
Figure 3. Glutathione reductase (GR) activity (A) and superoxide dismutase (SOD) activity (B) adjusted for the effect of locality (U/mg of proteins) in needles of fir (red color) and pine (magenta color) trees and leaves of beech (blue color) trees. Number of infested trees (nI) = 30, number of uninfested trees (nU) = 20. Samples were collected on two sites (nI/nU = 15/10 per site).
Forests 15 01761 g003
Figure 4. Trans-zeatin-O-glucoside (tZOG) (A), jasmonic acid (JA) (B), methyl 2-(1H-indol-3-yl)acetate (IAA-Me) (C), salicylic acid (SA) (D), abscisic acid (ABA) (E), and abscisic acid methyl ester (ABA-Me) (F) content adjusted for the effect of locality (pmol/g FW) in needles of fir (red color) and pine (magenta color) trees and leaves of beech (blue color) trees. Number of infested trees (nI) = 30, number of uninfested trees (nU) = 20. Samples were collected on two sites (nI/nU = 15/10 per site).
Forests 15 01761 g004
Table 1. Locality, area, annual temperature, and precipitation on investigated sites. Source of meteorological data: Czech Hydrometeorological Institute (https://www.chmi.cz/, accessed on 7 October 2024).
TreeLocalityCoordinatesArea (ha)Annual Temperature *
(°C)
Annual Precipitation **
(mm)
Beech
(Fagus sylvatica)
Buková horaN 50.67662
E 14.21815
5.549.6
8.6
1.0
524
640
82
VrabinecN 50.71306
E 14.2183
7.53
Pine
(Pinus sylvestris)
Stará BoleslavN 50.21140
E 14.70668
1.6610.0
9.0
1.0
618
583
106
PodbrahyN 50.22586
E 14.74161
0.64
Fir
(Abies alba)
Rychnov nad KněžnouN 50.15704
E 16.33344
1.329.0
8.2
0.8
679
732
93
Nové Město nad MetujíN 50.34794
E 16.16489
1.49
* numbers in column below: annual temperature 2022, long-term air temperature normal 1991–2020, deviation from long-term normal 1991–2020. ** numbers in column below: precipitation 2022, long-term precipitation normal 1991–2020, precipitation amount as % of the long-term normal 1991–2020.
Table 2. List of measured parameters adjusted for the effect of locality in needles of fir and pine trees and leaves of beech trees. Number of infested trees (nI) = 30, number of uninfested trees (nU) = 20. Samples were collected on two sites (nI/nU = 15/10 per site).
PineBeechFir
InfestedUninfestedpInfestedUninfestedpInfestedUninfestedp
ParameterUnitMean (SD)Mean (SD)Mean (SD)Mean (SD)Mean (SD)Mean (SD)
neoxanthinμg/g DW42.0 (20.8)67.0 (34.9) 28.7 (5.75)35.5 (7.18) 21.0 (3.31)26.9 (3.40)
violaxanthinμg/g DW4.36 (1.26)6.60 (2.10) 23.4 (6.16)31.7 (5.66) 9.57 (1.32)9.46 (1.01)
antheraxanthinμg/g DW0.705 (0.212)0.941 (0.197) 4.76 (1.22)4.33 (0.826) 1.20 (0.303)0.751 (0.143)
zeaxanthinμg/g DW0.953 (0.443)0.853 (0.180) 8.39 (1.96)6.27 (1.03) 2.51 (0.670)2.30 (0.526)
b-caroteneμg/g DW75.6 (21.5)110 (49.0) 12.1 (2.60)14.6 (2.19) 3.72 (0.685)4.01 (1.04)
chl a/b ratio 2.08 (0.246)2.19 (0.373) 2.37 (0.143)2.38 (0.161) 2.49 (0.112)2.74 (0.143)
de-epoxidation state 0.225 (0.087)0.170 (0.057) 0.300 (0.050)0.205 (0.030) 0.233 (0.034)0.213 (0.032)
xanthophyll cycle pigmentsμg/g DW6.02 (1.26)8.39 (2.04) 36.5 (7.45)42.5 (6.19) 13.3 (1.98)12.5 (1.36)
luteinμg/g DW80.3 (20.9)97.3 (17.9) 138 (16.4)156 (18.3) 70.5 (8.16)85.3 (7.69)
chlorophyll aμg/g DW101 (17.9)123 (20.6) 199 (22.2)231 (33.1) 51.3 (6.27)60.0 (5.66)
chlorophyll bμg/g DW208 (39.9)269 (60.9) 469 (45.1)547 (82.0) 128 (15.6)164 (14.2)
total chlorophyllμg/g DW310 (55.4)392 (76.7) 667 (65.2)777 (113) 179 (21.6)224 (19.2)
total carotenoidsμg/g DW204 (58.3)283 (93.6) 216 (20.1)249 (23.4) 108 (12.6)130 (12.2)
total phenolµg GAE/g DW19.1 (4.39)19.5 (3.65) 12.6 (3.91)12.2 (4.25) 13.5 (4.07)11.7 (2.89)
DPPH radical scavenging capacityµM TE/g DW90.4 (18.5)86.3 (22.5) 75.9 (16.9)78.8 (11.5) 81.6 (11.8)81.7 (8.43)
flavonoids (alkalic matrix)µg R/g DW24.9 (8.70)25.1 (6.29) 51.7 (21.7)44.4 (18.6) 28.3 (10.2)30.1 (7.93)
flavonoids (acidic matrix)µg R/g DW11.8 (3.06)10.1 (3.28) 12.8 (3.21)11.8 (2.02) 11.8 (1.73)12.5 (1.33)
GSTU/mg proteins0.021 (0.010)0.022 (0.010) 0.033 (0.019)0.026 (0.014) 0.016 (0.005)0.015 (0.004)
GRU/mg proteins0.023 (0.010)0.016 (0.009) 0.031 (0.021)0.026 (0.009) 0.010 (0.003)0.006 (0.005)
GPX (POX)U/mg proteins0.002 (0.003)0.003 (0.002) 0.007 (0.003)0.006 (0.005) 0.004 (0.003)0.003 (0.001)
APXU/mg proteins0.065 (0.044)0.068 (0.058) 0.093 (0.043)0.098 (0.042) 0.176 (0.058)0.162 (0.054)
CATU/mg proteins8.59 (5.13)9.11 (6.78) 34.6 (22.8)31.8 (8.94) 5.62 (1.63)4.68 (2.13)
SODU/mg proteins66.4 (34.4)79.9 (41.0) 49.8 (33.7)25.1 (19.2) 143 (58.5)136 (57.0)
ABAnmol/g FW5.83 (4.32)10.77 (4.56) 0.451 (0.281)0.357 (0.284) 2.54 (2.12)1.81 (1.16)
ABA-Mepmol/g FW12.6 (8.29)7.43 (6.26) 1.02 (1.55)0.854 (0.807) 1.13 (2.48)0.317 (0.341)
ABA-GEnmol/g FW49.08 (25.83)65.41 (28.13) 2.49 (1.15)2.32 (1.46) 27.77 (21.66)19.66 (10.13)
PApmol/g FW88.4 (54.6)90.8 (82.1) 31.1 (49.3)26.0 (31.3) 1536 (1414)1105 (634)
DPAnmol/g FW0.040 (0.040)0.039 (0.037) 0.125 (0.136)0.207 (0.227) 11.20 (13.40)17.18 (42.59)
7OH-ABApmol/g FW116 (68.9)166 (112) 28.6 (43.6)27.7 (37.3) 1139 (927)809 (401)
9OH-ABApmol/g FW61.8 (37.8)65.9 (40.5) 15.6 (16.5)13.6 (14.2) 1417 (1305)1020 (585)
JApmol/g FW106 (111)219 (180) 1431 (1292)970 (911) 79.4 (95.0)32.0 (42.4)
JA-Ilepmol/g FW88.7 (87.9)162 (129) 337 (341)460 (514) 31.8 (35.5)10.9 (22.6)
JA-Mepmol/g FW74.1 (47.9)106 (58.7) 95.2 (66.0)68.3 (53.6) 32.9 (29.1)23.3 (18.7)
DiH-JApmol/g FW21.9 (18.4)28.1 (20.3) 36.8 (29.1)46.0 (61.3) 17.7 (17.4)15.8 (18.0)
tZpmol/g FW0.643 (0.540)0.534 (0.525) 0.494 (0.382)0.370 (0.173) 0.647 (0.528)0.545 (0.184)
iPpmol/g FW2.05 (1.39)2.26 (1.49) 3.31 (1.48)3.30 (1.46) 1.11 (0.693)0.819 (0.618)
DZpmol/g FW2.01 (1.57)1.83 (1.97) 0.718 (0.675)0.966 (1.03) 1.61 (1.33)1.34 (1.14)
cZpmol/g FW1.31 (0.809)0.913 (0.695) 0.471 (0.814)0.283 (0.185) 0.446 (0.238)0.443 (0.440)
tZRpmol/g FW5.27 (2.09)4.35 (2.15) 1.21 (0.691)1.25 (0.681) 7.89 (2.29)6.77 (2.40)
iPRpmol/g FW6.36 (3.31)6.21 (4.25) 4.66 (1.75)5.83 (1.58) 1.98 (1.57)1.28 (0.963)
DZRpmol/g FW5.98 (2.82)6.51 (3.35) 0.913 (0.942)0.648 (0.374) 6.27 (2.47)7.01 (3.49)
cZRpmol/g FW2.34 (1.39)2.38 (0.918) 0.694 (0.375)0.748 (0.387) 3.03 (1.39)2.28 (0.915)
tZOGpmol/g FW2.23 (1.59)0.770 (0.648) 1.26 (1.02)1.36 (1.18) 1.08 (0.685)0.934 (0.510)
tZROGpmol/g FW26.9 (15.6)16.1 (16.8) 0.821 (0.790)1.12 (1.29) 10.4 (4.37)9.97 (4.44)
DZOGpmol/g FW11.6 (6.74)3.68 (3.06) 0.844 (0.598)0.822 (0.720) 2.07 (1.06)2.09 (1.25)
DZROGpmol/g FW5.71 (2.44)4.32 (2.37) 2.52 (2.17)2.88 (3.10) 5.66 (3.54)6.31 (4.42)
cZOGpmol/g FW1.17 (0.720)1.18 (0.727) 0.488 (0.415)0.547 (0.577) 0.993 (1.17)0.834 (1.60)
cZROGpmol/g FW31.8 (13.2)28.8 (14.9) 0.360 (0.261)0.472 (0.306) 21.5 (10.6)20.8 (8.48)
DZ7Gpmol/g FW0.749 (1.02)0.323 (0.533) 11.5 (10.4)8.68 (8.94) 4.89 (8.43)3.06 (2.77)
tZRMPpmol/g FW1.71 (1.83)0.905 (1.19) 21.7 (12.5)20.0 (12.3) 4.20 (2.34)4.55 (2.97)
iPRMPpmol/g FW4.30 (2.41)2.33 (1.19) 3.11 (3.18)5.09 (4.62) 9.09 (3.17)10.1 (5.30)
DZRMPpmol/g FW5.87 (4.52)4.46 (3.92) 2.39 (2.60)4.00 (4.05) 4.90 (3.00)4.97 (3.41)
cZRMPpmol/g FW7.53 (4.58)6.96 (3.59) 5.01 (3.81)6.72 (5.51) 16.1 (7.01)15.4 (5.01)
MeS-Zpmol/g FW0.492 (0.847)1.16 (2.25) 0.957 (1.34)0.748 (1.13) 0.479 (0.940)0.409 (0.503)
MeS-ZRpmol/g FW21.1 (7.60)21.6 (5.64) 59.8 (18.3)49.3 (15.6) 15.0 (6.31)13.6 (4.51)
MeS-iPpmol/g FW0.297 (0.562)1.00 (2.17) 0.849 (1.22)0.599 (0.833) 0.531 (1.35)0.315 (0.518)
SApmol/g FW229 (122)206 (78.3) 763 (267)587 (271) 341 (506)336 (393)
BzApmol/g FW344 (171)465 (215) 1046 (933)722 (408) 495 (711)395 (271)
PAApmol/g FW547 (213)468 (175) 488 (222)410 (225) 543 (381)650 (369)
PAAMpmol/g FW2.97 (1.57)3.93 (2.00) 4.67 (2.34)4.33 (1.44) 8.21 (10.4)7.47 (8.62)
IAApmol/g FW140 (91.4)162 (90.8) 87.1 (64.1)55.1 (55.5) 20.8 (16.0)13.3 (6.91)
IAA-Mepmol/g FW30.3 (30.5)118 (75.0) 161 (168)86.8 (69.1) 141 (155)489 (341)
IAA-Glupmol/g FW0.774 (2.12)1.48 (2.58) 0.421 (0.636)0.550 (0.692) 0.098 (0.101)0.053 (0.045)
IAA-Alapmol/g FW0.380 (0.545)0.209 (0.345) 4.70 (5.54)5.82 (6.84) 4.34 (2.98)4.05 (2.13)
IAA-GEpmol/g FW11.6 (10.3)11.0 (9.46) 5.58 (4.05)5.59 (3.49) 15.1 (6.93)16.3 (6.34)
OxIAApmol/g FW51.5 (42.3)56.2 (31.8) 18.8 (19.0)15.8 (17.6) 1.04 (1.68)0.695 (1.11)
5OH-IAApmol/g FW0.591 (0.639)0.771 (1.20) 2.78 (1.61)3.98 (2.10) 3.65 (5.32)1.31 (3.92)
OxIAA-GEpmol/g FW108 (105)63.6 (57.6) 78.4 (31.2)111 (52.2) 13.6 (6.56)14.0 (3.12)
I3Apmol/g FW15.5 (14.2)19.5 (9.25) 22.7 (14.2)22.4 (10.5) 2.63 (2.21)2.66 (2.80)
ILacApmol/g FW1.03 (1.50)1.35 (1.03) 1.37 (1.38)1.77 (1.61) 1.74 (1.30)1.73 (0.919)
OxIAA-Glupmol/g FW1.15 (1.80)0.830 (0.772) 41.9 (28.2)45.9 (20.1) 1.11 (1.18)1.05 (1.29)
OxIAA-Asppmol/g FW7.11 (7.12)5.35 (4.39) 3808 (1487)5380 (2310) 6.02 (3.79)5.97 (2.57)
Legend of significance:
extremely significant increase in infected plantsp ≤ 0.001 significant decrease in infected plantsp ≤ 0.05
very significant increase in infected plantsp ≤ 0.01 very significant decrease in infected plantsp ≤ 0.01
significant increase in infected plantsp ≤ 0.05 extremely significant decrease in infected plantsp ≤ 0.001
insignificant resultp > 0.05white
Disclaimer/Publisher’s Note: The statements, opinions and data contained in all publications are solely those of the individual author(s) and contributor(s) and not of MDPI and/or the editor(s). MDPI and/or the editor(s) disclaim responsibility for any injury to people or property resulting from any ideas, methods, instructions or products referred to in the content.

