Article

Analysis of Spatial and Temporal Trends of Vegetation Cover Evolution and Its Driving Forces from 2000 to 2020—A Case Study of the WuShen Counties in the Maowusu Sandland

1
College of Water Resources and Civil Engineering, Inner Mongolia Agricultural University, Huhhot 010018, China
2
Horqin Left Wing Rear Banner Water Conservancy Technical Service Center, Tongliao 028000, China
3
Inner Mongolia Yellow River Ecological Research Institute, Huhhot 010020, China
4
Collaborative Innovation Center for Integrated Management of Water Resources and Water Environment in the Inner Mongolia Section of the Yellow River Basin, Hohhot 010018, China
5
Institute of Pastoral Water Resources Science, Ministry of Water Resources, Hohhot 010018, China
6
Inner Mongolia Jinhuayuan Environmental Resources Engineering Consulting Limited Liability Company, Huhhot 010018, China
7
Tongliao Water Resources Development Center, Tongliao 028000, China
*
Author to whom correspondence should be addressed.
Forests 2024, 15(10), 1762; https://doi.org/10.3390/f15101762
Submission received: 28 July 2024 / Revised: 3 October 2024 / Accepted: 4 October 2024 / Published: 8 October 2024

Abstract

:
The WuShen counties in the hinterland of the Maowusu Sandland are located in the “ecological stress zone” of the forest–steppe desert, with low vegetation cover, a strong ecosystem sensitivity, and poor stability under the influence of human activities. Therefore, it is important to study and analyze the changes in vegetation growth in this region for the purpose of objectively evaluating the effectiveness of desertification control in China’s agricultural and pastoral intertwined zones, and formulating corresponding measures in a timely manner. In this paper, the spatial and temporal variations in the vegetation NDVI in the WuShen counties of the Maowusu Sandland and their response relationships with driving factors were investigated by using a trend test, center of gravity transfer model, partial correlation calculation, and residual analysis, and by using the MOD13A3 vegetation NDVI time series data from 2000 to 2020, as well as the precipitation, temperature, and potential evapotranspiration data from the same period. The results showed the following: ① The regional vegetation NDVI did not fluctuate significantly with latitude and longitude, and the NDVI varied between 0.227 and 0.375 over the 21-year period, with a mean increase of 0.13 for the region as a whole and an increase of 0.61 for the region of greatest change. Of the area, 86.83% experienced a highly significant increase, and the trend in increase around rivers and towns was higher than that in the northwestern inland flow area, with the overall performance of “low in the west and high in the east”. ② Only 2.07% of the vegetation NDVI center of gravity did not shift, and the response with climate factors was mainly characterized by having consistent or opposite center of gravity changes with precipitation and potential evapotranspiration. ③ Human activities have been the dominant factor in the vegetation NDVI change, with 75.89 percent of the area positively impacted by human activities, and human activities in the southwest inhibiting the improvement of vegetation in the area. The impact of human activities on the unchanged land type area is increasing, most obviously in the farmland area, and the impact of human activities on the changed land type area is gradually decreasing in the area where the farmland becomes impervious. The vegetation in the area above 1300 m above sea level is degraded by the environment and human activities. The research results can provide scientific support for the implementation of ecological fine management and the formulation of corresponding ecological restoration and desertification control measures in the Maowusu Sandland. At the same time, it is expected to serve as a baseline for other studies on the evolution of vegetation in agro-pastoral zones.

1. Introduction

Global natural ecosystems are facing a critical situation with significant climate change and increasing impacts of human activities [1]. Vegetation not only serves as a “link” connecting ecological elements such as soil, hydrology, and atmosphere in the terrestrial material cycle and energy flow but also regulates the exchange of material and energy among the various layers of the earth system [2]. Climate change and human activities are the main driving factors of vegetation change, and analyzing the pattern of change in vegetation and exploring the role of driving factors in the context of global change are the frontiers of terrestrial surface system research, and also one of the key areas of global change research [3].
The normalized vegetation index (NDVI) is the most commonly used indicator to characterize the condition of vegetation, which is closely related to vegetation cover, growth conditions, biomass, and photosynthesis intensity, and objectively reflects the information on vegetation cover in the study area on a large spatial and temporal scale, which is considered to be an effective indicator for detecting the changes in the regional vegetation and the ecological environment [4].
Previous studies have found that the impact of human activities on vegetation improvement in the Yellow River Basin is significantly higher than that of climate change [5]. Changes in vegetation cover in the southwestern region are closely related to land-use changes. In general, human activities in this region are more likely to cause damage to vegetation growth, and climate change is more likely to promote vegetation growth [6]. Temperature and precipitation promote the improvement of vegetation, and the influence of human activities gradually decreases [7]. Vegetation changes along China’s eastern coast are dominated by human activities and climate change [8]. Vegetation improvement in the Hulun Lake Basin is mainly influenced by precipitation [9]. Vegetation improvement in the Sanjiangyuan area is mainly affected by sunshine hours and temperature, and human activities hurt growth. However, ecological afforestation projects have positively affected vegetation [10]. Vegetation in the Yangtze River Basin is mainly affected by temperature [11]. Vegetation changes in the Poyang Lake Basin are closely related to land use and population behavior [12]. The future trend of vegetation in the Upper White Nile River (UWNR) is dominated by negative sustainability, with 62.54% of the vegetation degrading in the future. The relative impact of human activities on vegetation change is 64.5%, which is higher than the impact of climate change (35.5%). Human activities, such as agriculture, are significant contributors to this impact. The main drivers are the rapid growth in the global population and the rapid urbanization of human settlements [13]. Summer NDVI fluctuations in Mongolia in 1982–2015 were mainly controlled by precipitation, with summer contributing the most to annual productivity; the effect of temperature on the NDVI was significant in spring and fall, and human activities caused a significant decrease in the NDVI in the more densely populated areas (high mountainous regions in western Mongolia and steppe regions in central Mongolia) [14]. Concurrently, analogous challenges have been encountered in disparate regions worldwide, including Africa. Xu et al. posited that precipitation represents the primary climatic factor influencing vegetation change in East Africa, with human activities exerting a more pronounced influence on the enhancement of net primary productivity (NPP) than climate change. Conversely, climate change exerts a more pronounced influence on the reduction in NPP than human activities [15]. Zeng et al. employed a machine-learning approach to model and analyze the relationship between the NDVI and climate variables, and concluded that air temperature and precipitation were the most significant climatic drivers influencing NDVI trends across the Sahel–Sudan–Guinea region [16]. Xiao et al. identified changes in population size and land-use area as the primary factors influencing the evolution of forest cover in Africa [17]. Liu et al. determined that human land use and resource extraction, rather than climate trends or short-term climatic anomalies, were the predominant drivers of recent vegetation change in the UGF region of West Africa [18]. In summary, most of the current studies on vegetation-driven response are based on the vegetation NDVI and time series of precipitation, temperature, and other meteorological factors using trend analysis, partial correlation analysis, and residual analysis to achieve the quantitative separation of vegetation drivers. The spatial response relationship between vegetation and driving factors is rarely analyzed. Therefore, in this study, we introduced the fishing net analysis and center of gravity shift model to analyze the response between the NDVI and center of gravity change among driving factors, which is conducive to exploring the mechanism of the regional vegetation-driven response from multiple scales.
As a forest–grassland–desert “ecological coercion zone” with low vegetation cover, strong ecosystem sensitivity, and poor stability of human activities, it is of great significance to study the growth and change in vegetation in the Maowusu Sandland for the purpose of objectively evaluating the effectiveness of desertification control in China’s agricultural and pastoral intertwined zones, and formulating corresponding measures in a timely manner [19]. The results of previous studies on vegetation changes in the Maowusu Sandland show that the vegetation cover in the region is low but the trend of improvement is obvious, vegetation cover is significantly higher in the southern region than in the northern region, and human activities help to improve the vegetation cover. At the monthly scale, the temperature is the main climatic driver of vegetation growth, while at the annual scale, precipitation is the main climatic driver of dominant vegetation growth, and the contribution of human activities is slightly higher than that of climate change in both improved and degraded vegetation areas [20]. Vegetation cover shows a continuous upward trend, with a spatial characteristic of “low in the west and high in the east”, and the future development trend of vegetation cover in the region is dominated by continuous improvement and continuous degradation [21]. At present, in the analysis of vegetation-driving factors in the Maowusu Sandland, most of the factors selected have been precipitation and air temperature as climate factors, and the regional characteristic that the evaporation of the Maowusu Sandland is much larger than the precipitation has been ignored. Potential evapotranspiration is an important indicator of climate change and is closely related to the vegetation cover of the region. In addition, the impact of increasing human activities in the region is an important point that should not be ignored. The region continues to carry out basic grassland protection, including forbidding, resting, and rotating grazing, a grass–animal balance system, and “forest chief + sheriff”, “forest chief + procurator”, and other N measures, which are of great significance to the improvement of regional vegetation.
In this paper, we use residual analyses to quantify the role of human activities in vegetation changes and separate the regions based on CLCD land cover data, which reduces the uncertainty of the results of the residual analyses to a certain extent. The implementation of a series of ecological restoration and management projects in the Maowusu Sandland in recent years has led to an increasingly dramatic impact of human activities on the regional ecology. However, previous studies lacked quantitative analyses of the response between human activities and vegetation in the Maowusu Sandland. Wang et al. concluded that changes in vegetation cover in the Maowusu Sandland are the result of multiple factors interacting with each other, so we would like to use partial correlation analyses to strip away the effects of other factors to discuss the impacts caused by a single factor. Compared with previous studies, we would like to use a center of gravity shift model to analyze the spatial dynamics of vegetation cover and use potential evapotranspiration as an indicator to explore the deeper vegetation cover-driven relationships in the region [22]. Based on this, this study used a 1 km raster dataset of the NDVI, precipitation, air temperature, and potential evapotranspiration, and adopted the methods of trend test, the center of gravity transfer model, and multiple regression residual analysis, as well as separating the impacts of anthropogenic activities in the region according to the land-use and elevation data, to reduce the uncertainty of the response between anthropogenic activities and vegetation to a certain extent. The temporal and spatial changes in the NDVI and its relationship with the response to vegetation in the Maowusu Sandland from 2000 to 2020 were investigated. The aim of this study was to investigate the spatial and temporal changes of the NDVI and its response characteristics to driving factors from 2000 to 2020, to provide scientific support for ecological restoration and management in the Maowusu Sandland, as well as in other areas, such as Africa.

2. Materials and Methods

2.1. Overview of the Study Area

The Maowusu Sandland is one of the four major sandlands in China, stretching across the southern part of Ordos City in Inner Mongolia, the northern part of Yulin City in Shaanxi Province, and the northeastern part of Yanchi County in Wuzhong City in Ningxia Province, with a total area of 38,000 km2 of sandland. The study area of this paper was selected to be located in the WuShen counties of Ordos City in the Inner Mongolia Autonomous Region in the hinterland of the Maowusu Sandland, which covers an area of 11,645 km2, nearly one-third of the sandland, which is an important area of the sandland. The WuShen counties have a temperate continental monsoon climate with obvious seasonality: cold and dry in winter and warm and rainy in summer. The annual precipitation is between 300 and 400 mm, mainly concentrated in July to September. The average temperature for many years is 6.0~8.5 °C, with the average temperature in January being about −8 °C and that in July being about 24 °C. The average annual evaporation far exceeds the precipitation, which is about 2000 mm, creating an arid climate. The northwesterly winds that prevail in the sandy areas in spring and winter, coupled with the fact that the terrain slopes from the northwest to the southeast, make for higher wind speeds, further exacerbating soil erosion and desertification. The main vegetation types in the study area are diverse, mainly including semi-scrub and herbaceous vegetation, meadows and marshes, saline vegetation, etc., which play an important role in maintaining the ecological balance and protecting the soil. Salix is one of the important plant species in the area, which is of great significance to the ecological balance and economic development of the area. As a result, the impact of increasing human activities on the vegetation in the region needs to be urgently identified. On the one hand, overgrazing and reclamation of farmland for agriculture and animal husbandry can lead to grassland degradation and soil desertification; industrial activities such as coal mining and chemical production can also damage and pollute the land. On the other hand, vegetation restoration projects, such as the “Three North Protective Forest Project”, “Returning Farmland to Forests and Grasslands”, and other policies and measures, also promote vegetation restoration. Environmentally, the study area is characterized by widespread sandland dunes, interspersed with sandland dunes on beams and beaches, with the terrain tilting from the northwest to the southeast, and the elevation ranging from 1000 to 1500 m. The ecological environment in the area is fragile and subject to desertification. The regional ecological environment is relatively fragile and sensitive to the impact of desertification, which is unstable in time and space. Moreover, the intermingling of many ethnic groups and the consequent emergence of a variety of corresponding land-use decisions have led to the diversification and complexity of land-use patterns in the region, and have also posed a great threat to the biodiversity of the region [21].

2.2. Data Sources and Pre-Processing

Based on the NDVI and meteorological data, this paper analyses the spatial patterns of land types, major towns, river systems, and large-scale water-using industries and mines in the region, which helps to reveal the characteristics of vegetation-driven responses in the study area at multiple scales and levels (Figure 1).
To analyze the spatial and temporal evolution of the regional vegetation and the driving weights at the raster scale, this paper uses the same spatial and temporal scale dataset for the computational analyses. The NDVI data were obtained using the MOD13A3 dataset released periodically by NASA with a temporal resolution of once a month and a spatial resolution of 1 km. Based on the month-by-month NDVI raster data in the dataset, the maximum composite method [23] was used to obtain year-by-year NDVI raster data for the period 2000–2020. Temperature data were obtained from the Zenodo website [24]. Precipitation data from Science Data Bank [25]. The results show that the model can effectively respond to the spatial and temporal distribution of precipitation and temperature in the region. The potential evapotranspiration dataset was derived from the month-by-month potential evapotranspiration dataset for China published by Peng Shouzhang (2022) of the National Tibetan Plateau Science Data Center, which was obtained using the Hargreaves potential evapotranspiration formulae based on the 1 km month-by-month mean, minimum, and maximum temperature datasets for China [26,27,28,29]. The raster skin of the above data collection was extracted to the same spatial and temporal scales, and the raster was used as the basic computational unit for trend analysis and driving element calculation.
The low spatial resolution of the NDVI selected for the study may have resulted in insufficient details of human activities. On this basis, human activities were further analyzed using subsurface data such as land type data. The year-by-year land cover dataset for China was obtained from the team of Prof Yang Jie and Prof Huang Xin from Wuhan University. This dataset contains year-by-year 30 m resolution land cover information for China from 1985–2021 [30,31], and defines a new classification system for the distribution of land-use types in China. The dataset was evaluated based on 5463 visually interpreted samples and third-party test samples, with an overall accuracy of 80%, which is in good agreement with existing thematic products on land cover (Global Forest Change, Global Surface Water, and Impervious Surface Time Series datasets). The 30-meter resolution DEM topographic data and STRM elevation data are based on data published by the National Aeronautics and Space Administration (NASA), the United States Department of Defense, the National Mapping Agency (NMA) and the National Geodetic Survey (NGS). STRM elevation data are jointly surveyed by NASA and the National Mapping Agency (NIMA) of the US Department of Defense at a spatial resolution of 30 m.

2.3. Research Methodology

2.3.1. Theil–Sen Trend Analysis with MK Significance Test

The Sen trend analysis method represents a robust non-parametric approach to estimating the slope, which can scientifically and intuitively reflect the trend of time series data over a period of time and assess the trend of change [32,33,34]. The calculation formula is as follows:
β = m e d i a n x j x i j i , j > i
where x i and x j are the values of the vegetation N D V I in years i and j , respectively, where i , j = 1 , 2 , 3 , , n ; m e d i a n is the median function. When β > 0, it means that the overall trend of the vegetation N D V I is increasing, and the regional vegetation cover tends to improve; when β = 0, it means that the overall vegetation N D V I remains basically unchanged, and the regional vegetation cover tends to stabilize; when β < 0, it means that the overall trend of the vegetation N D V I is decreasing, and the regional vegetation cover tends to deteriorate.
The MK significance test was used as a complement to the Sen slope estimation to test the significance of the trend in the vegetation cover time series. It is worth noting that this method may be affected by the autocorrelation of the NDVI data itself and produce misleading results. It was found that the autocorrelation coefficient was 0.014 when the number of lagged periods of the NDVI was 1, and the autocorrelation coefficient decreased with the increase in lagged periods, so this method was used in this paper to analyze the results. The formula is as follows:
Z = S 1 var S , S > 0 0 , S = 0 S + 1 var S , S < 0 S = i = 1 n 1 j = i + 1 n s i g n x j x i var S = n n 1 2 n + 5 18 s i g n x j x i = 1 , x j x i > 0 0 , x j x i = 0 1 , x j x i < 0
where n is the length of the dataset, s i g n is the sign function, and x i and x j are the set of sample time series data. S is the test statistic and Z is the standardized test statistic. When the absolute value of Z is greater than 1.65, 1.96, and 2.58, it means that the trend passes the significance test with confidence levels of 90%, 95%, and 99%, respectively.
In this paper, they were graded based on the slope and significance level: highly significant increase ( β > 0, 2.58 < Z ), significant increase ( β > 0, 1.96 < Z ≤ 2.58), marginally significant increase ( β > 0, 1.65 < Z ≤ 1.96), insignificant increase ( β > 0, Z ≤ 1.65), insignificant decrease ( β < 0, Z ≤ 1.65), marginally significant decrease ( β < 0, 1.65 < Z ≤ 1.96), significant decrease ( β < 0, 1.96 < Z ≤ 2.58), and highly significant decrease ( β < 0, 2.58 < Z ).

2.3.2. Fishnet Analysis and Center of Gravity Shift Model

Fishnet analysis [35] is a spatial analysis technique used to divide the study area into a number of equally sized grids so that the characteristics of each of its grids can be studied. The center of gravity transfer model [36] is a method for analyzing the change in the center of gravity of a spatial variable as it shifts through space over time. The formulae are given below:
X m = i = 1 n c m , i x i i = 1 n c m , i Y m = i = 1 n c m , j y j i = 1 n c m , j R = east X 2020 X 2000 > 0 , Y 2020 Y 2000 = 0 northeast X 2020 X 2000 > 0 , Y 2020 Y 2000 > 0 north X 2020 X 2000 = 0 , Y 2020 Y 2000 > 0 northwest X 2020 X 2000 < 0 , Y 2020 Y 2000 > 0 west X 2020 X 2000 < 0 , Y 2020 Y 2000 = 0 southwest X 2020 X 2000 < 0 , Y 2020 Y 2000 < 0 south X 2020 X 2000 = 0 , Y 2020 Y 2000 < 0 southeast X 2020 X 2000 > 0 , Y 2020 Y 2000 < 0
where X m and Y m are the longitude and latitude of the center of gravity of the spatial distribution of the driver in year m , respectively; C m , i is the value of the driver at image i in year m ; x i is the longitude of image i ; y i is the latitude of image i ; and R is the direction of the shift of the center of gravity of the driver. The subsequent analysis focuses on the consistent, opposite, and several other perspectives of the direction of transfer between elements.

2.3.3. Partial Correlation Analysis and t-Test

Partial correlation analysis is the analysis of the correlation between two variables after excluding the effect of other variables [37]. The formula is calculated as follows:
R y j = i = 1 n y i y ¯ j i j ¯ i = 1 n y i y ¯ 2 i = 1 n j i j ¯ 2 R y j , c = R y j R y c R j c 1 R y c 2 1 R j c 2 R y j , c k = R y j , c R y k , c R j k , c 1 R y k , c 2 1 R j k , c 2
where R y j is the correlation coefficient between the two variables, y i and j i are the y and j values in year i , y ¯ and j ¯ are the average values of y and j in the study period, R y j , c is the partial correlation coefficient of y and j in the case of control variable c , R y j , R y c , and R j c are the correlation coefficients of their corresponding two variables, R y j , c k is the partial correlation coefficient of y and j in the case of control variables c and k , and R y j , c , R y k , c , and R j k , c are the partial correlation coefficients of their corresponding variables; when R y j , c k > 0, the two variables are positively correlated, and when R y j , c k < 0, the two variables are negatively correlated. The larger absolute value indicates a stronger relationship between the two.
The t -test was used to determine the significance of the partial correlation coefficients, and the statistic was calculated using the following formula:
t = R y j , c k 1 R y j , c k 2 n m 1
where R y j , c k is the partial correlation coefficient; n is the sample size; and m is the number of independent variables.

2.3.4. Multivariate Regression Residual Analysis

The effects of climate change and non-climatic factors, such as human activities, on NDVI change were distinguished using multiple linear regression residual analysis [38,39,40]. The calculation formula is as follows:
N D V I p r e = a × T + b × P + c × S R + d + ε N D V I r e s = N D V I o b s N D V I p r e
where N D V I o b s , N D V I p r e and N D V I r e s are the observed value of N D V I based on remote sensing images, the predicted value of N D V I based on the regression model, and the residual value of N D V I (dimensionless), respectively; a , b , c and d are the coefficients of the regression model, and ε is the random error; and T , P and P E T are the mean air temperature, cumulative precipitation, and potential evapotranspiration in °C, mm, and mm, respectively.

2.3.5. Driver Determination and Calculation

The trends of N D V I C C (under the influence of climate change) and N D V I H A (under the influence of human activities) were calculated using one-way linear regression [41,42], and the relative contributions of the drivers were calculated in conjunction with Table 1 [20].

3. Results

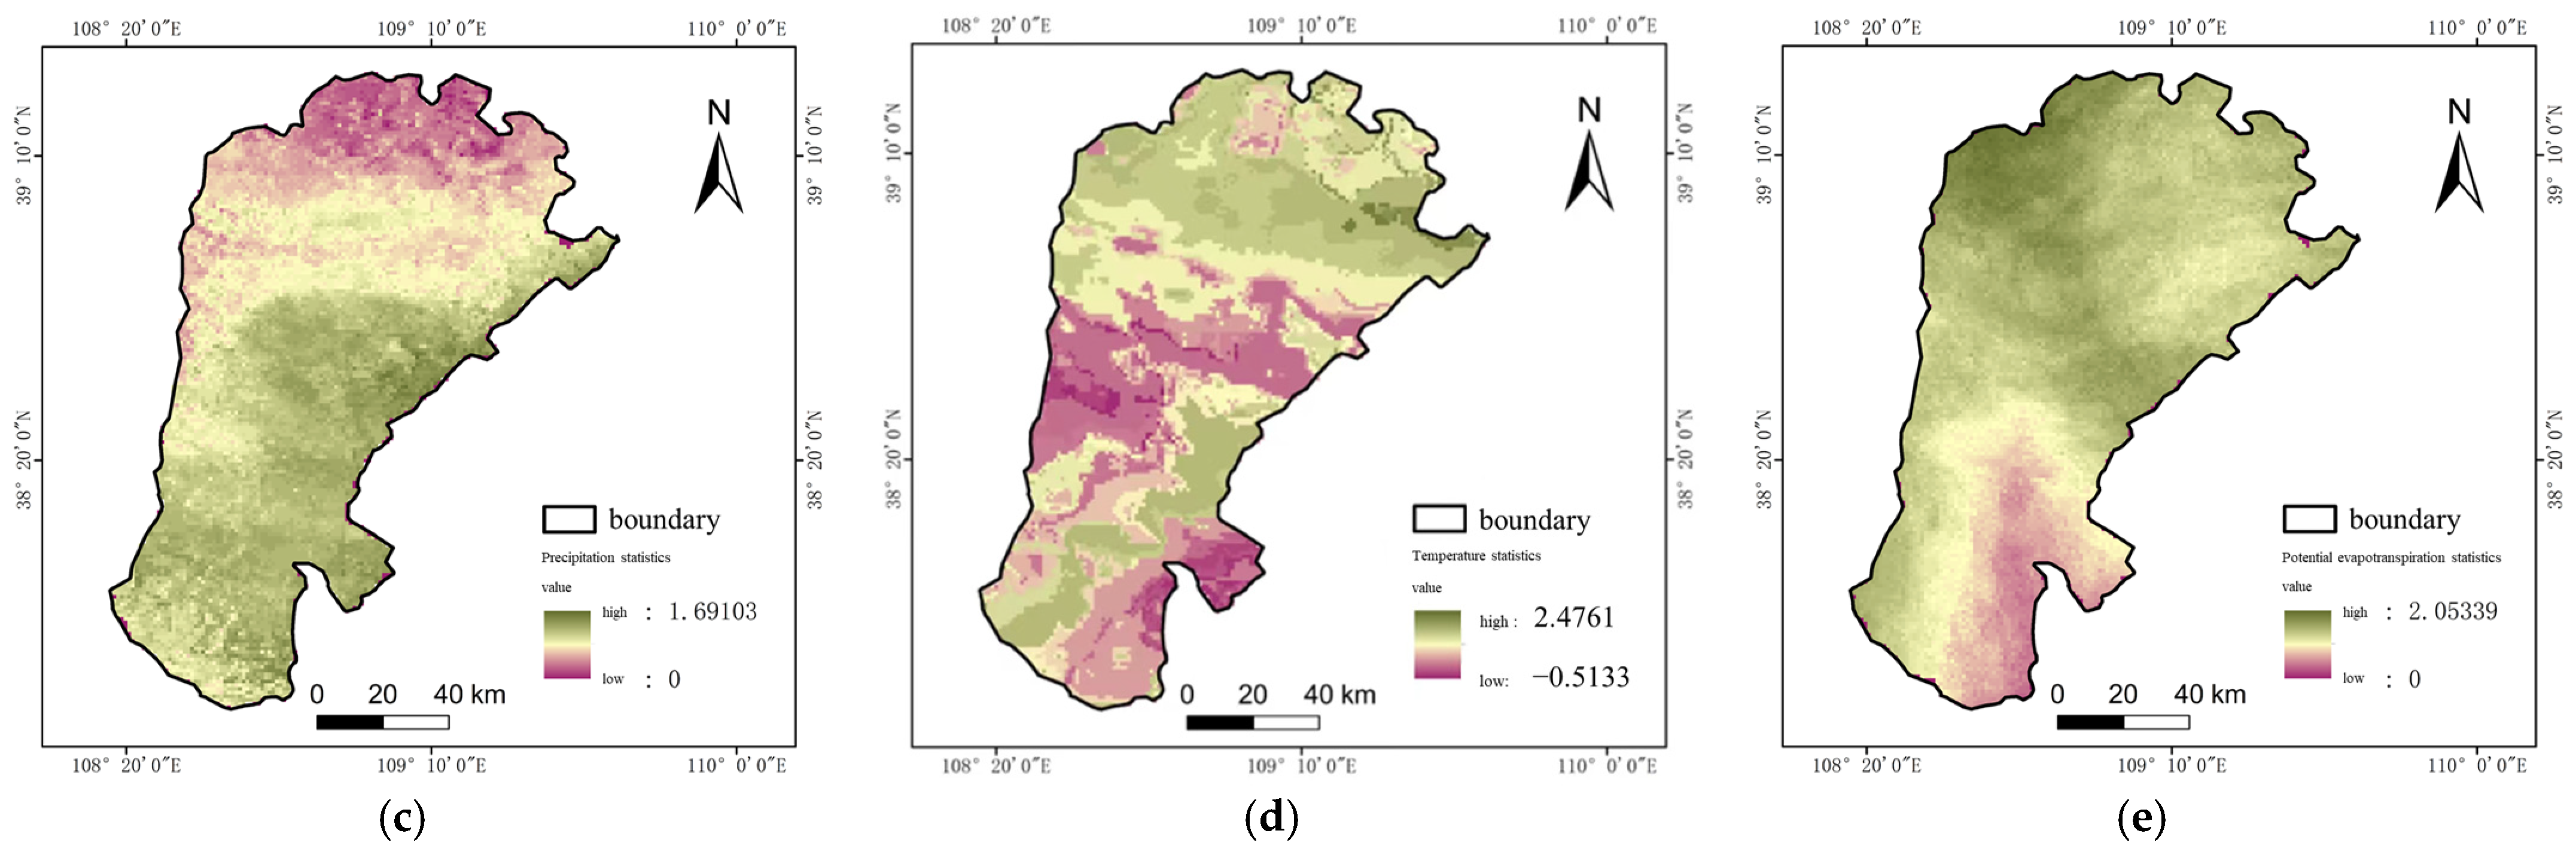
3.1. Characterization of Temporal and Spatial Variations of NDVI and Climate Factors

The multi-year mean NDVI showed a weak increasing trend with increasing longitude, with an increase of 0.0001 per 1° increase in longitude, and a decreasing trend with increasing latitude, with a decrease of 0.0691 per 1° increase in latitude (Figure 2a,b). From 2000 to 2020, the NDVI varied between 0.227 and 0.375, with minimum and maximum values occurring in 2000 and 2018, respectively, and an overall increasing trend over the 21 years. The lowest and highest recorded values were observed in the years 2000 and 2018, respectively. The climatic conditions fluctuated, but the overall trend showed a slow increase. The results showed that the sharp increase in NDVI was caused by the sharp increase in precipitation in the study area, while the sharp decrease in precipitation had less effect on the NDVI; this indicates that the ecological recharge project has been effective in avoiding the destruction of vegetation in the study area (Figure 2c).
From 2000 to 2020, there was a markedly pronounced increase in the NDVI across 86.83 percent of the study area. The region as a whole increased by 0.13 over the 21 years, with the largest change in the NDVI increasing by 0.61. The percentage of areas with significant, insignificant, or nonsignificant upward trends in the study area was 11.89 percent, and only 0.4 percent of the area showed a decreasing trend. The multi-year average NDVI values for the regions exhibiting a highly significant increase, a significant increase, a marginally significant increase, a nonsignificant increase, no change, a nonsignificant decrease, and a marginally significant decrease are presented below, significant decrease values were 0.2957, 0.2947, 0.2878, 0.2841, 0.0769, 0.2676, 0.2933, and 0.3341, respectively, and the values of the NDVI in the non-changing regions were much smaller than those in the changing regions (Figure 3b). The NDVI growth rate gradually decreased from southeast to northwest. The growth trend in the NDVI in the watersheds of the Wuding River, Nalin River, Hailutu River, and Baihe River was significantly higher than that in the northwestern inland watersheds and in the areas of large towns and large-scale industrial and mining enterprises, and the strongest growth trend was in the south of the Batuwan Reservoir of the Wuding River, where villages and communities are concentrated and there are no large-scale industrial and mining enterprises, which indicates that urban construction inevitably causes a certain degree of destruction of the vegetation (Figure 3a).
All the climatic elements in the study area show an increasing trend, with precipitation realized as a large increase in the south and a small increase in the north (Figure 3c). A significant downward trend in the southeast and center of temperature change and an upward trend in the rest of the region were found (Figure 3d). Potential evapotranspiration shows an overall upward trend, with a significant increase in the northwestern part of the country (Figure 3e). In conclusion, the interannual variability of climatic elements in the study area fluctuates considerably and is shown to have been increasing over the 21-year period.

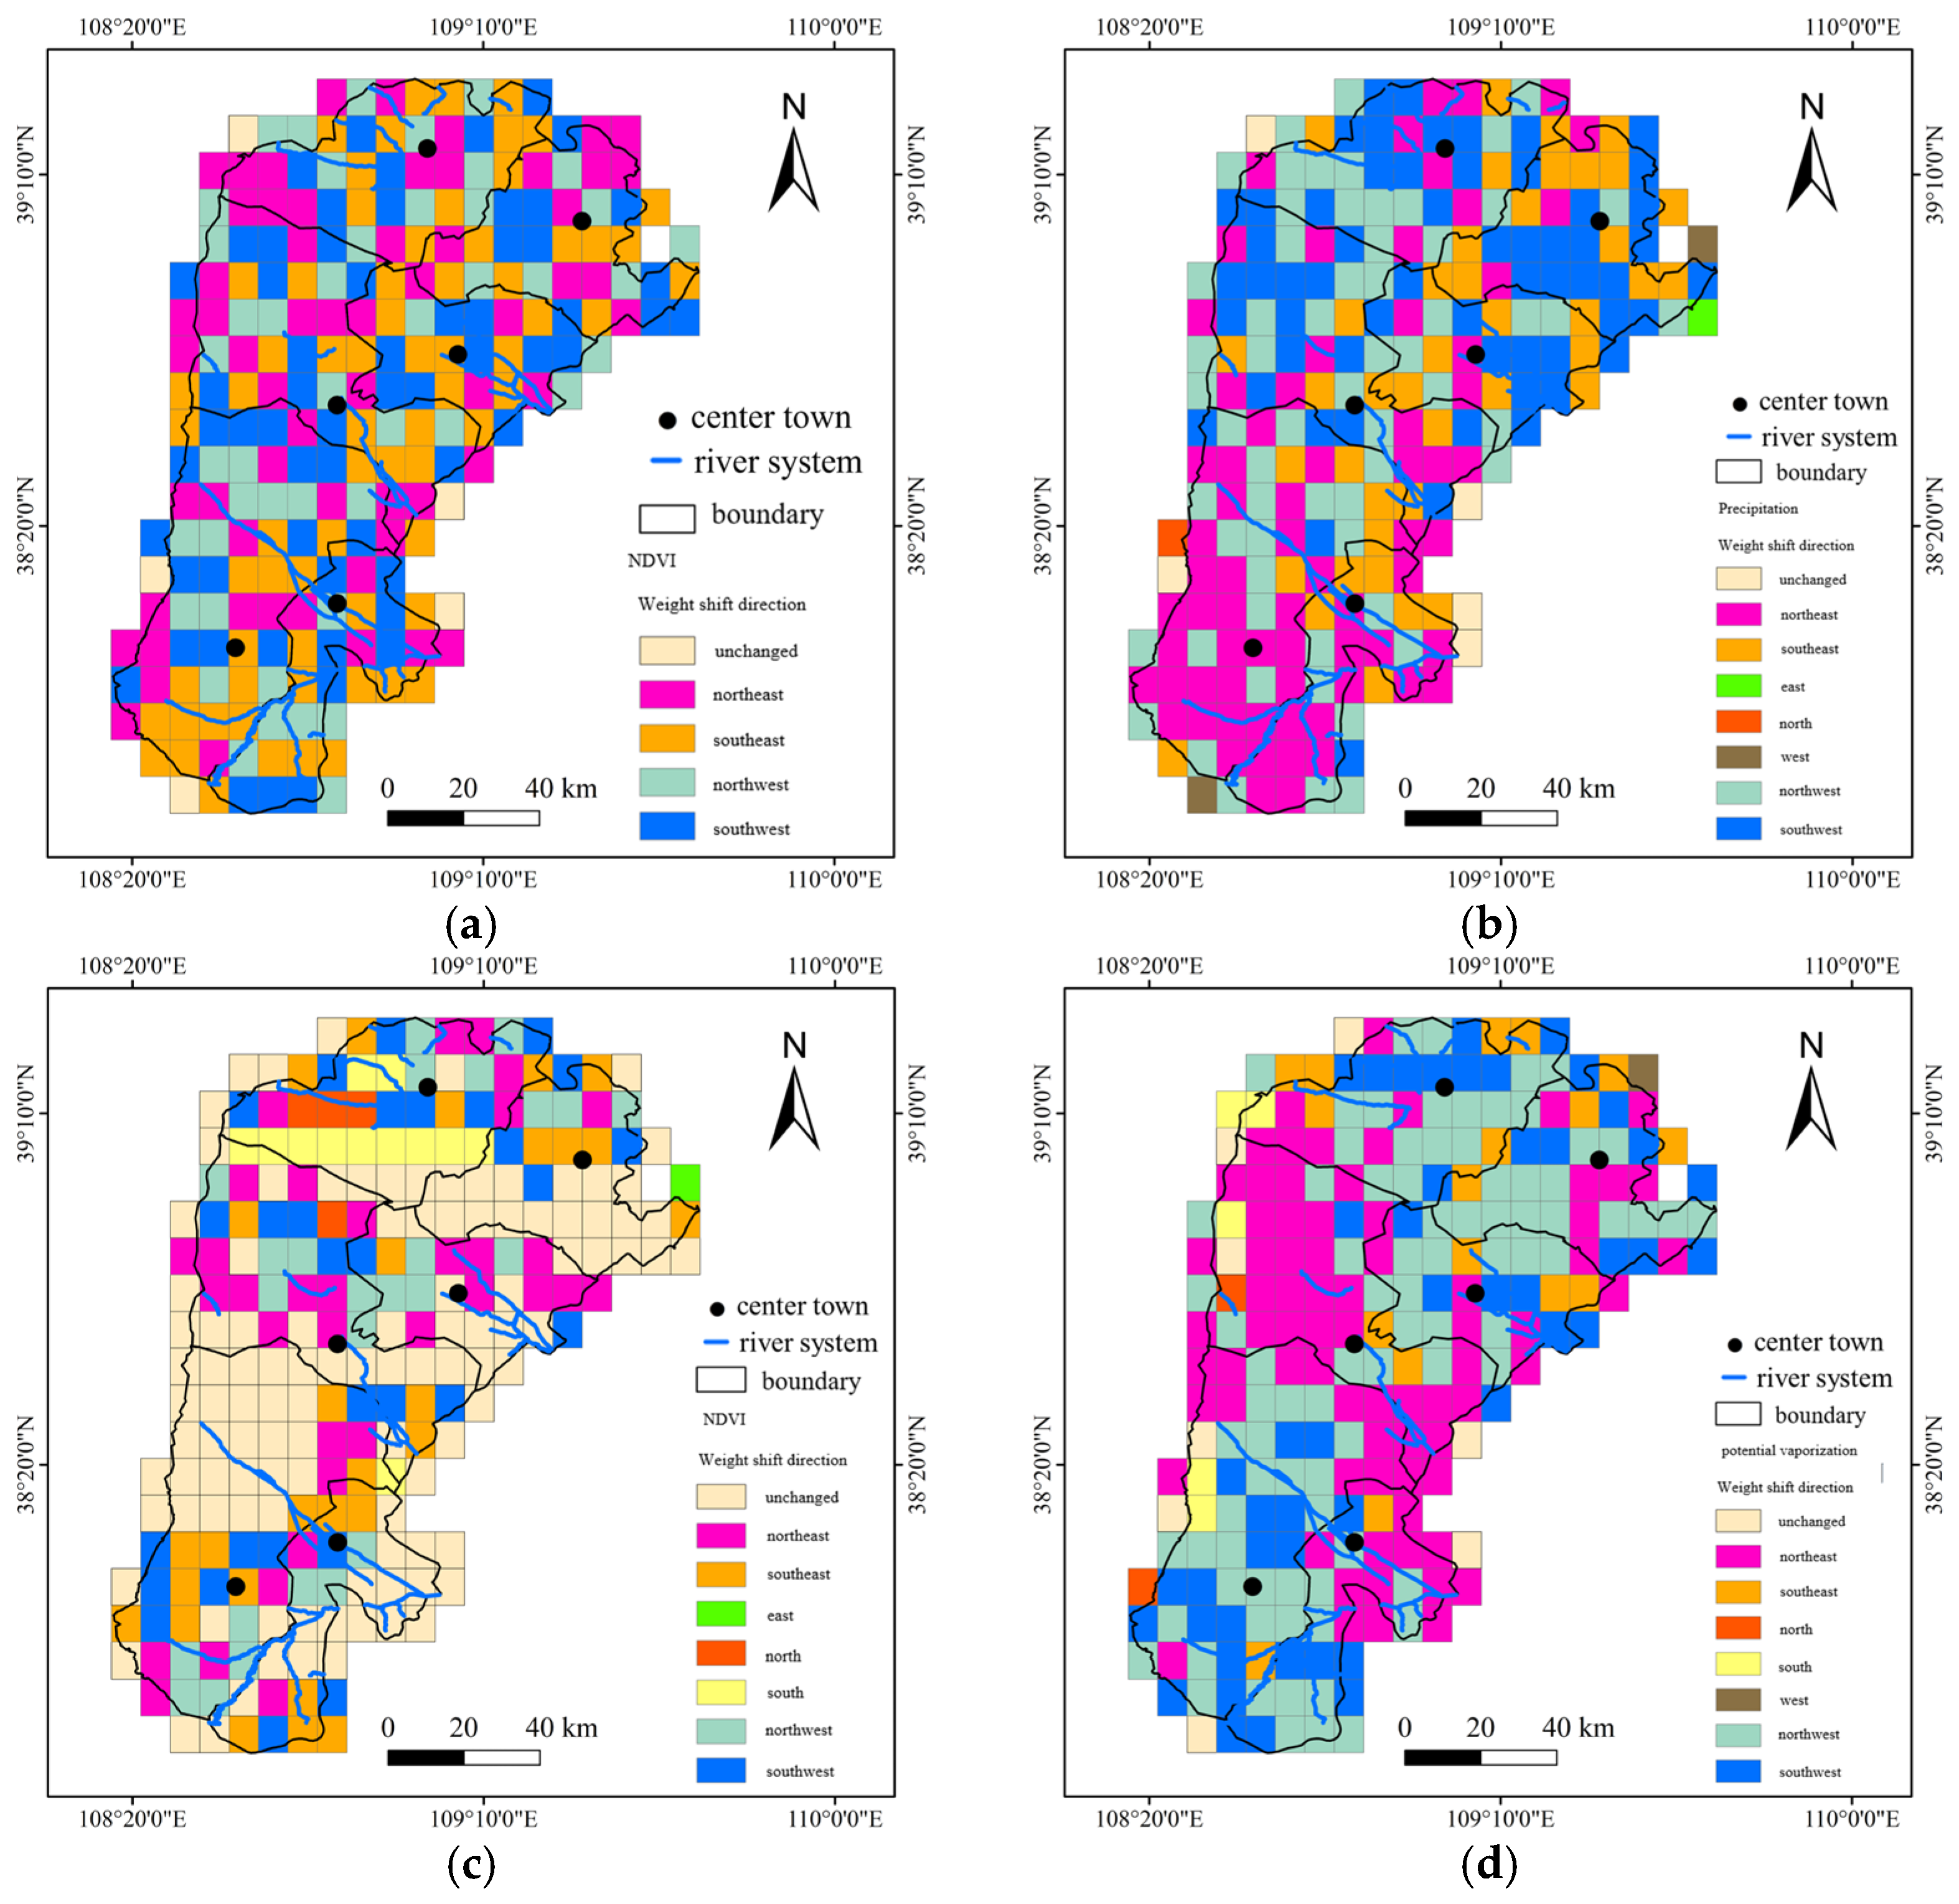
3.2. Vegetation NDVI and Climate Factor Center of Gravity Changes and Mutual Response

Compared with the year 2000, the 241 grids in 2020 had five kinds of changes in the center of gravity of the annual NDVI change: an unchanged direction, a northeastward shift, a southeastward shift, a northwestward shift, and a southwestward shift. The changes were uniform and unconcentrated, and the number of grids with changes accounted for 2.07%, 24.9%, 19.09%, 25.31%, and 28.63%, respectively. The results of the grids show that the NDVI in large towns such as Tuke Town, Wuxiazao Town, Garutu Town, Ulantaolegui Town, Wudinghe Town, and Sulide Sumu Township tended toward dispersing the center of gravity to the town periphery, which indicates that the changes in the vegetation growth trend in the study area are to a large extent caused by human activities (Figure 4a).
Compared with 2000, in 2020, the 241 grids of the annual precipitation change’s center of gravity shifted in the directions of unchanged, to the northeast, to the southeast, to the east, to the north, to the west, to the northwest, and to the southwest, and had obvious concentration and unevenness. The number of grids of change accounted for ratios of 2.07 percent, 29.05 percent, 17.01 percent, 0.41 percent, 0.41 percent, 0.83 percent, 25.73 percent, and 24.48 percent, respectively, with more and more concentrated grids having shifted to the northeast in the south, and more and more concentrated grids having shifted to the southwest in the north, which indicates that the annual precipitation tends to concentrate in areas such as the town of Garuto in the central part of the research area (Figure 4b).
Compared with the year 2000, the 241 grids in 2020 had eight kinds of shifts in the center of gravity of the annual mean temperature change, including the directions of unchanged, to the northeast, to the southeast, to the east, to the north, to the south, to the northwest, and to the southwest, and the number of grids accounted for 44.81 percent, 14.11 percent, 11.62 percent, 0.41 percent, 1.66 percent 4.98 percent, 10.37 percent, and 12.03 percent of the total number of grids, respectively. Among these, the grids with no change in direction were concentrated and accounted for the largest proportion, indicating that the spatial fluctuation in the annual mean temperature was small and irregular (Figure 4c).
Compared with 2000, in 2020, the 241 grids of the annual potential evapotranspiration’s center of gravity shifted in the direction of unchanged, to the northeast, to the southeast, to the north, to the south, to the west, to the northwest, and to the southwest, and had a certain degree of concentration. The number of grids in the direction of the shift accounted for 3.32 percent, 31.12 percent, 7.05 percent, 0.83 percent, 2.07 percent, 0.41 percent, 35.27 percent, and 19.92 percent, respectively, indicating that the potential evapotranspiration in the northern region tends to shift from two sides to the middle, whereas in the southern region, it tends to shift from the middle to the two sides (Figure 4d).
In the center of gravity shift responses between the NDVI and climate factors, the number of grids with consistent or opposite spatial responses to precipitation and potential evapotranspiration was significantly larger than that of responses to air temperature, and they were more evenly distributed. The number of grids with consistent or opposite responses between precipitation and potential evapotranspiration in the center of gravity shift responses between climate factors is also significantly larger than that between precipitation and temperature. The results suggest that the spatial response between temperature and NDVI is more complex than that between precipitation and potential evapotranspiration, which may be related to the small and irregular spatial fluctuation in temperature (Figure 5 and Table 2).

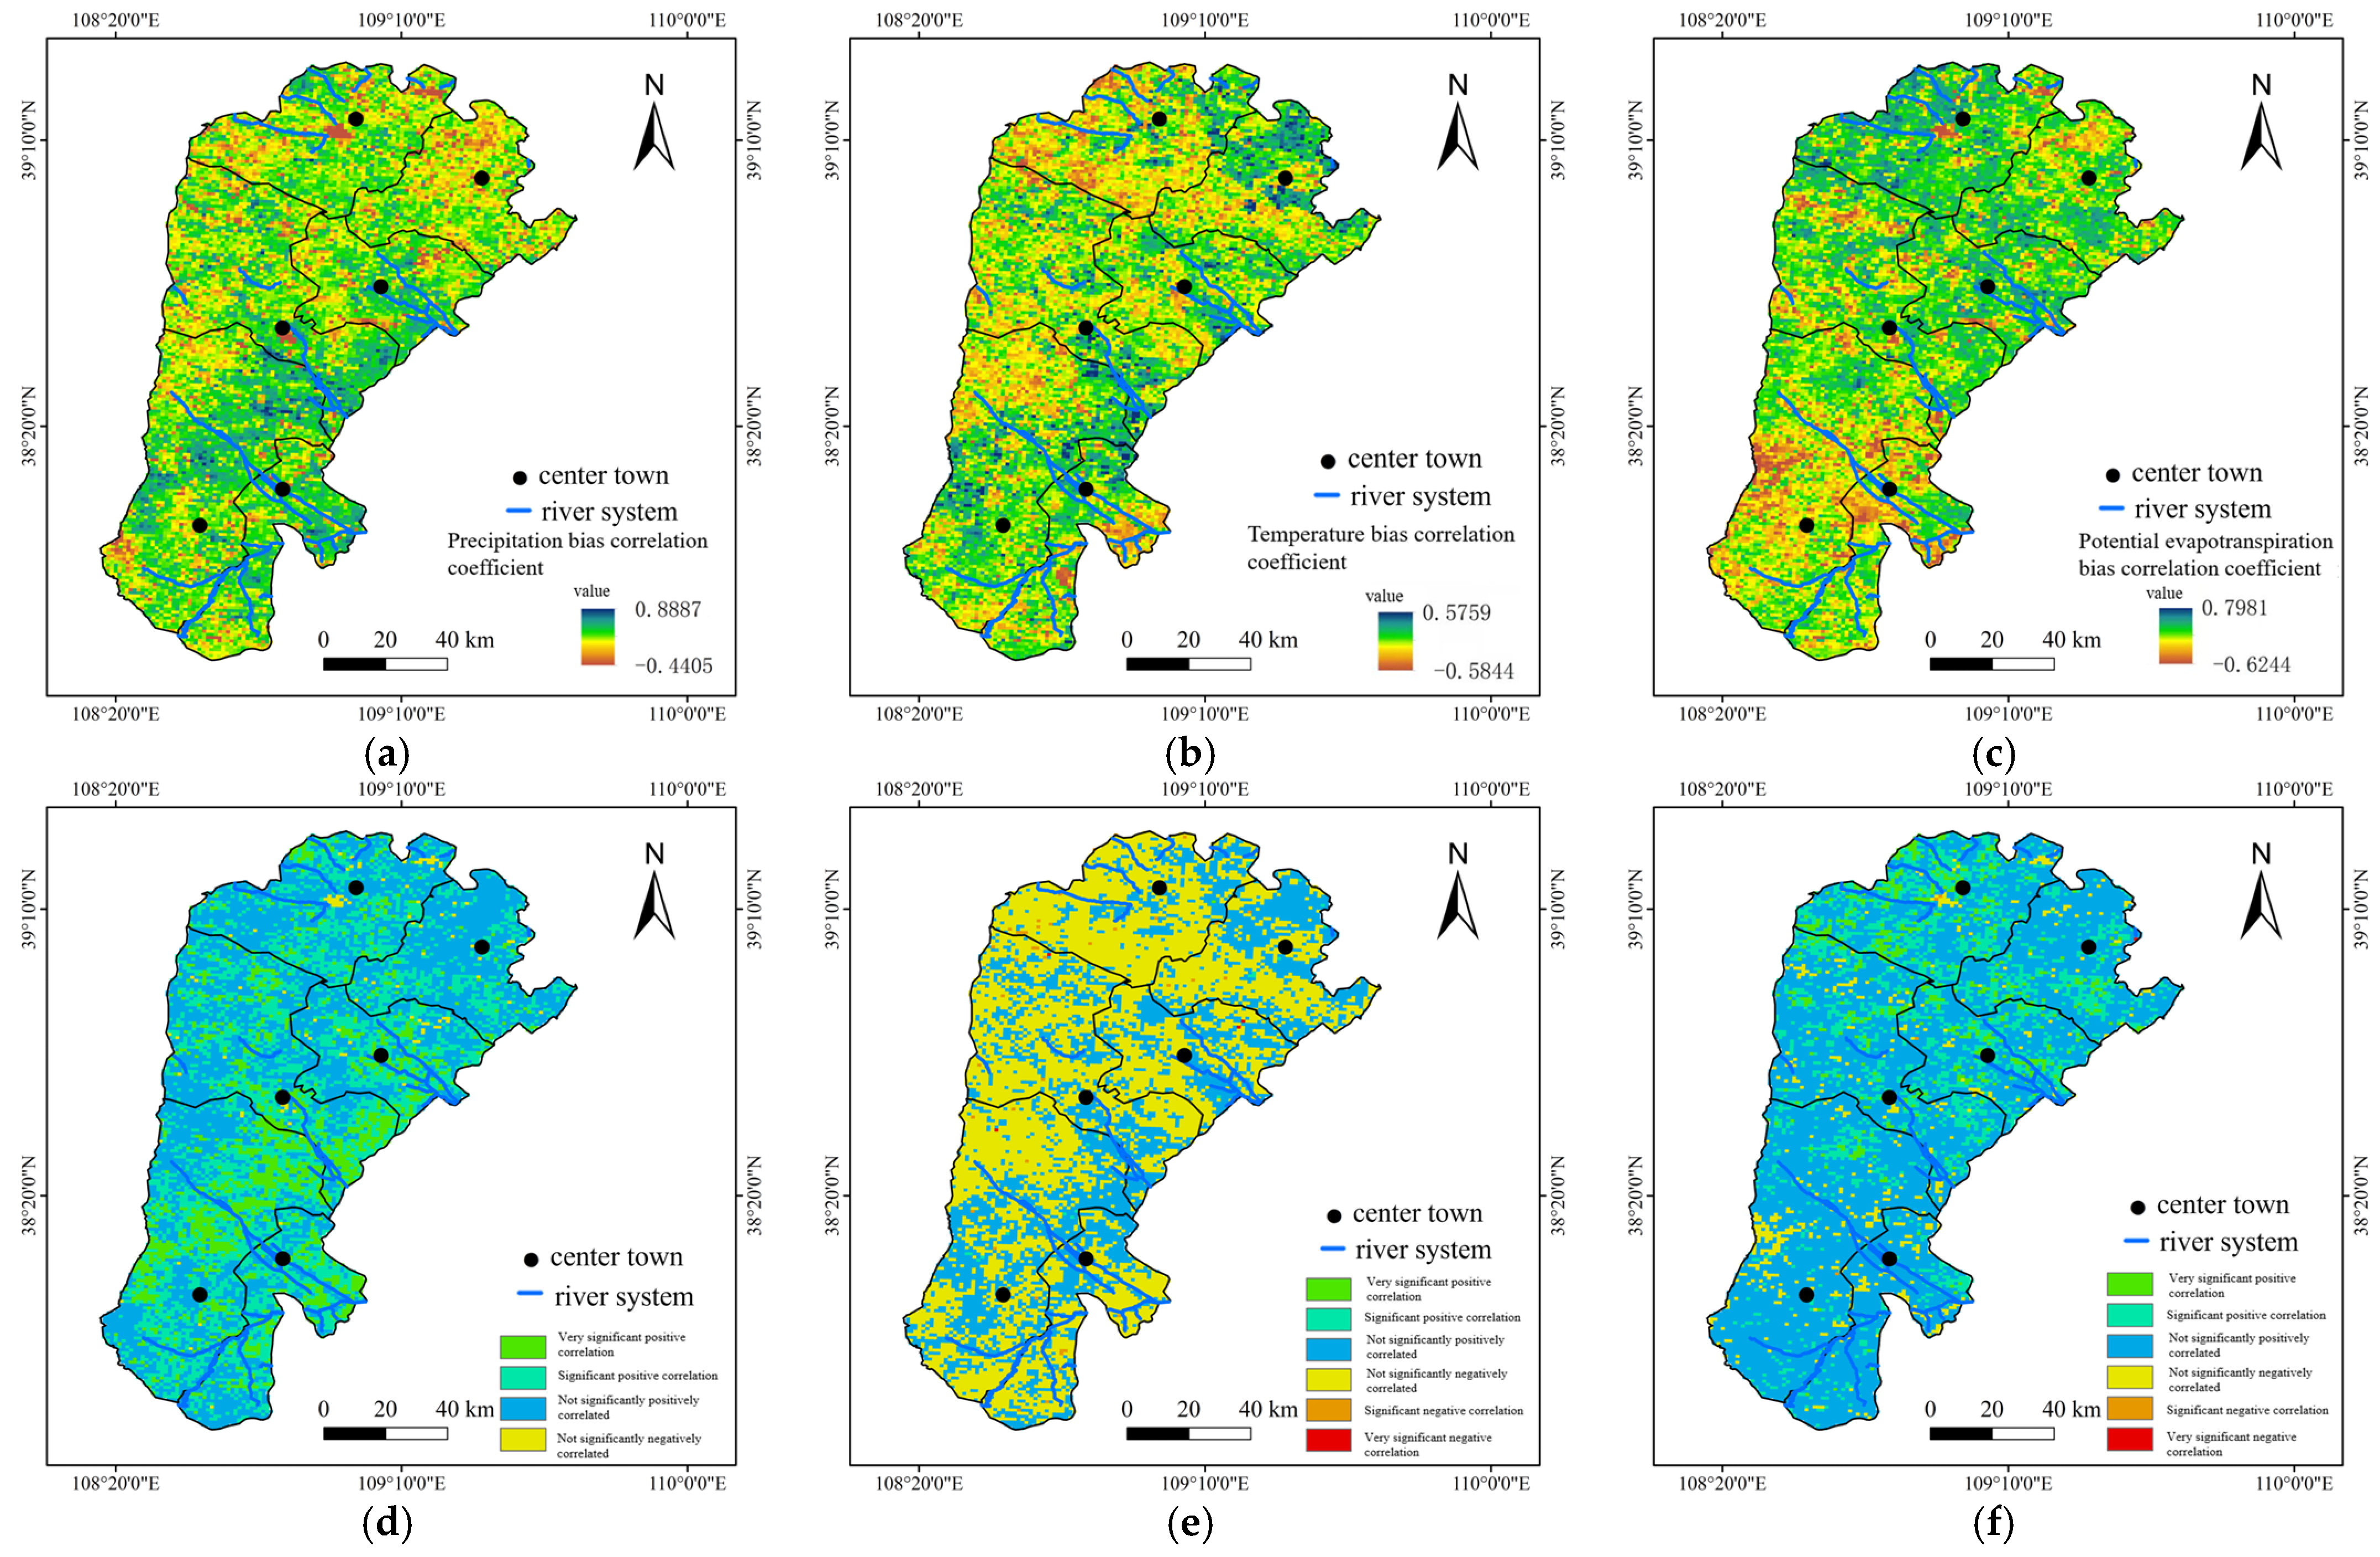
3.3. Partial Correlation between NDVI and Climate Factors

The mean values of the partial correlation coefficients between NDVI and precipitation, air temperature, and potential evapotranspiration from 2000 to 2020 were 0.4447, −0.0393, and 0.3308, respectively, with the highest correlation between NDVI and precipitation, the second highest correlation between NDVI and potential evapotranspiration, and the lower and negative correlation between NDVI and air temperature (Figure 6a–c). The correlation between NDVI and precipitation was significantly higher in the southeastern outflow river area, the Maowusu Sandland Park Nature Reserve, Garutu Town, and the periphery of Ulaan Tolgoi Town than in the northwestern inland flow area, Tuk Town, and Wuxiazao Town. The correlation between the NDVI and potential evapotranspiration was significantly higher in Wuxiazao Township and Tuk Township than in the regions of southern Sulide Sumu Township and Wudinghe Township, and the southwestern instream flow area showed a negative correlation. The results showed that the NDVI and precipitation in the study area showed a decreasing trend from east-central to northwest and southwest, the temperature showed a decreasing trend from east-central and the northeast Tuk Township area to all around, and the potential evapotranspiration showed a trend of north—high and south—low (Figure 6d–f). This indicates that alterations in precipitation and temperature patterns along the eastern riparian zone are more likely to influence vegetation growth patterns, whereas potential evapotranspiration in the northwestern instream region is of greater concern for vegetation.

3.4. Relative Contribution of Drivers to Changes in Vegetation NDVI

The area of the study area where the residuals showed a positive trend (89.10 percent) was much larger than the area with a negative trend (10.90 percent); this indicates that human activities have played a significant positive role in contributing to the growth of vegetation cover in the study area between 2000 and 2020. There was spatial heterogeneity in the positive or negative impacts of human activities on vegetation in different regions, with relatively high residual trend values for the Wuding River, Nalin River, Hailutu River, and Baihe River, among which the trend was the largest and most concentrated in the southeastern corner of the Batuwan Reservoir of the Wuding River, which was significantly related to the fact that the CLCD land type in this region was farmland. Inland flow areas, large towns, and large water-using industrial and mining enterprises had relatively low values, and in a few areas, human activities even inhibited the improvement in vegetation; such areas have mostly bare land, relatively small populations, and well-developed animal husbandry, which together lead to changes in vegetation cover (Figure 7).
The region exhibits a positive relative contribution of climate change to the NDVI in 98.97 percent of the areas under consideration. Among them, the area with a 0–40 percent relative contribution of climate change is the largest; the areas with higher relative contributions are mainly in the northeastern and central Shadipai Nature Reserve, and Nao’er in the northwestern endorheic zone; and the areas with a negative contribution of climate to the NDVI are mainly concentrated in the southern region (Figure 7b) (Table 3). The proportion of the area exhibiting a positive contribution of human activities to the NDVI was 93.69%. Of the total area, 72.09% demonstrated a human effect exceeding 60%, and the negative-effect area of human activities was mainly concentrated in the southwestern Sulid Sumu Township (Figure 7c) (Table 3). The results showed that human activities were the dominant factor of vegetation change in the study area, and the rest of the region was positively affected by different driving factors, except for southwestern Sulide Sumu, central Garutu Township, and a few areas in the north where dominant human activities negatively affected the NDVI, and the area positively dominated by human activities accounted for the largest percentage (75.89%) of the total area (Figure 7d). This suggests that while the ecology of the WuShen counties has been greatly improved by human impacts over the years, there are still areas that are worthy of focusing on and restoring.

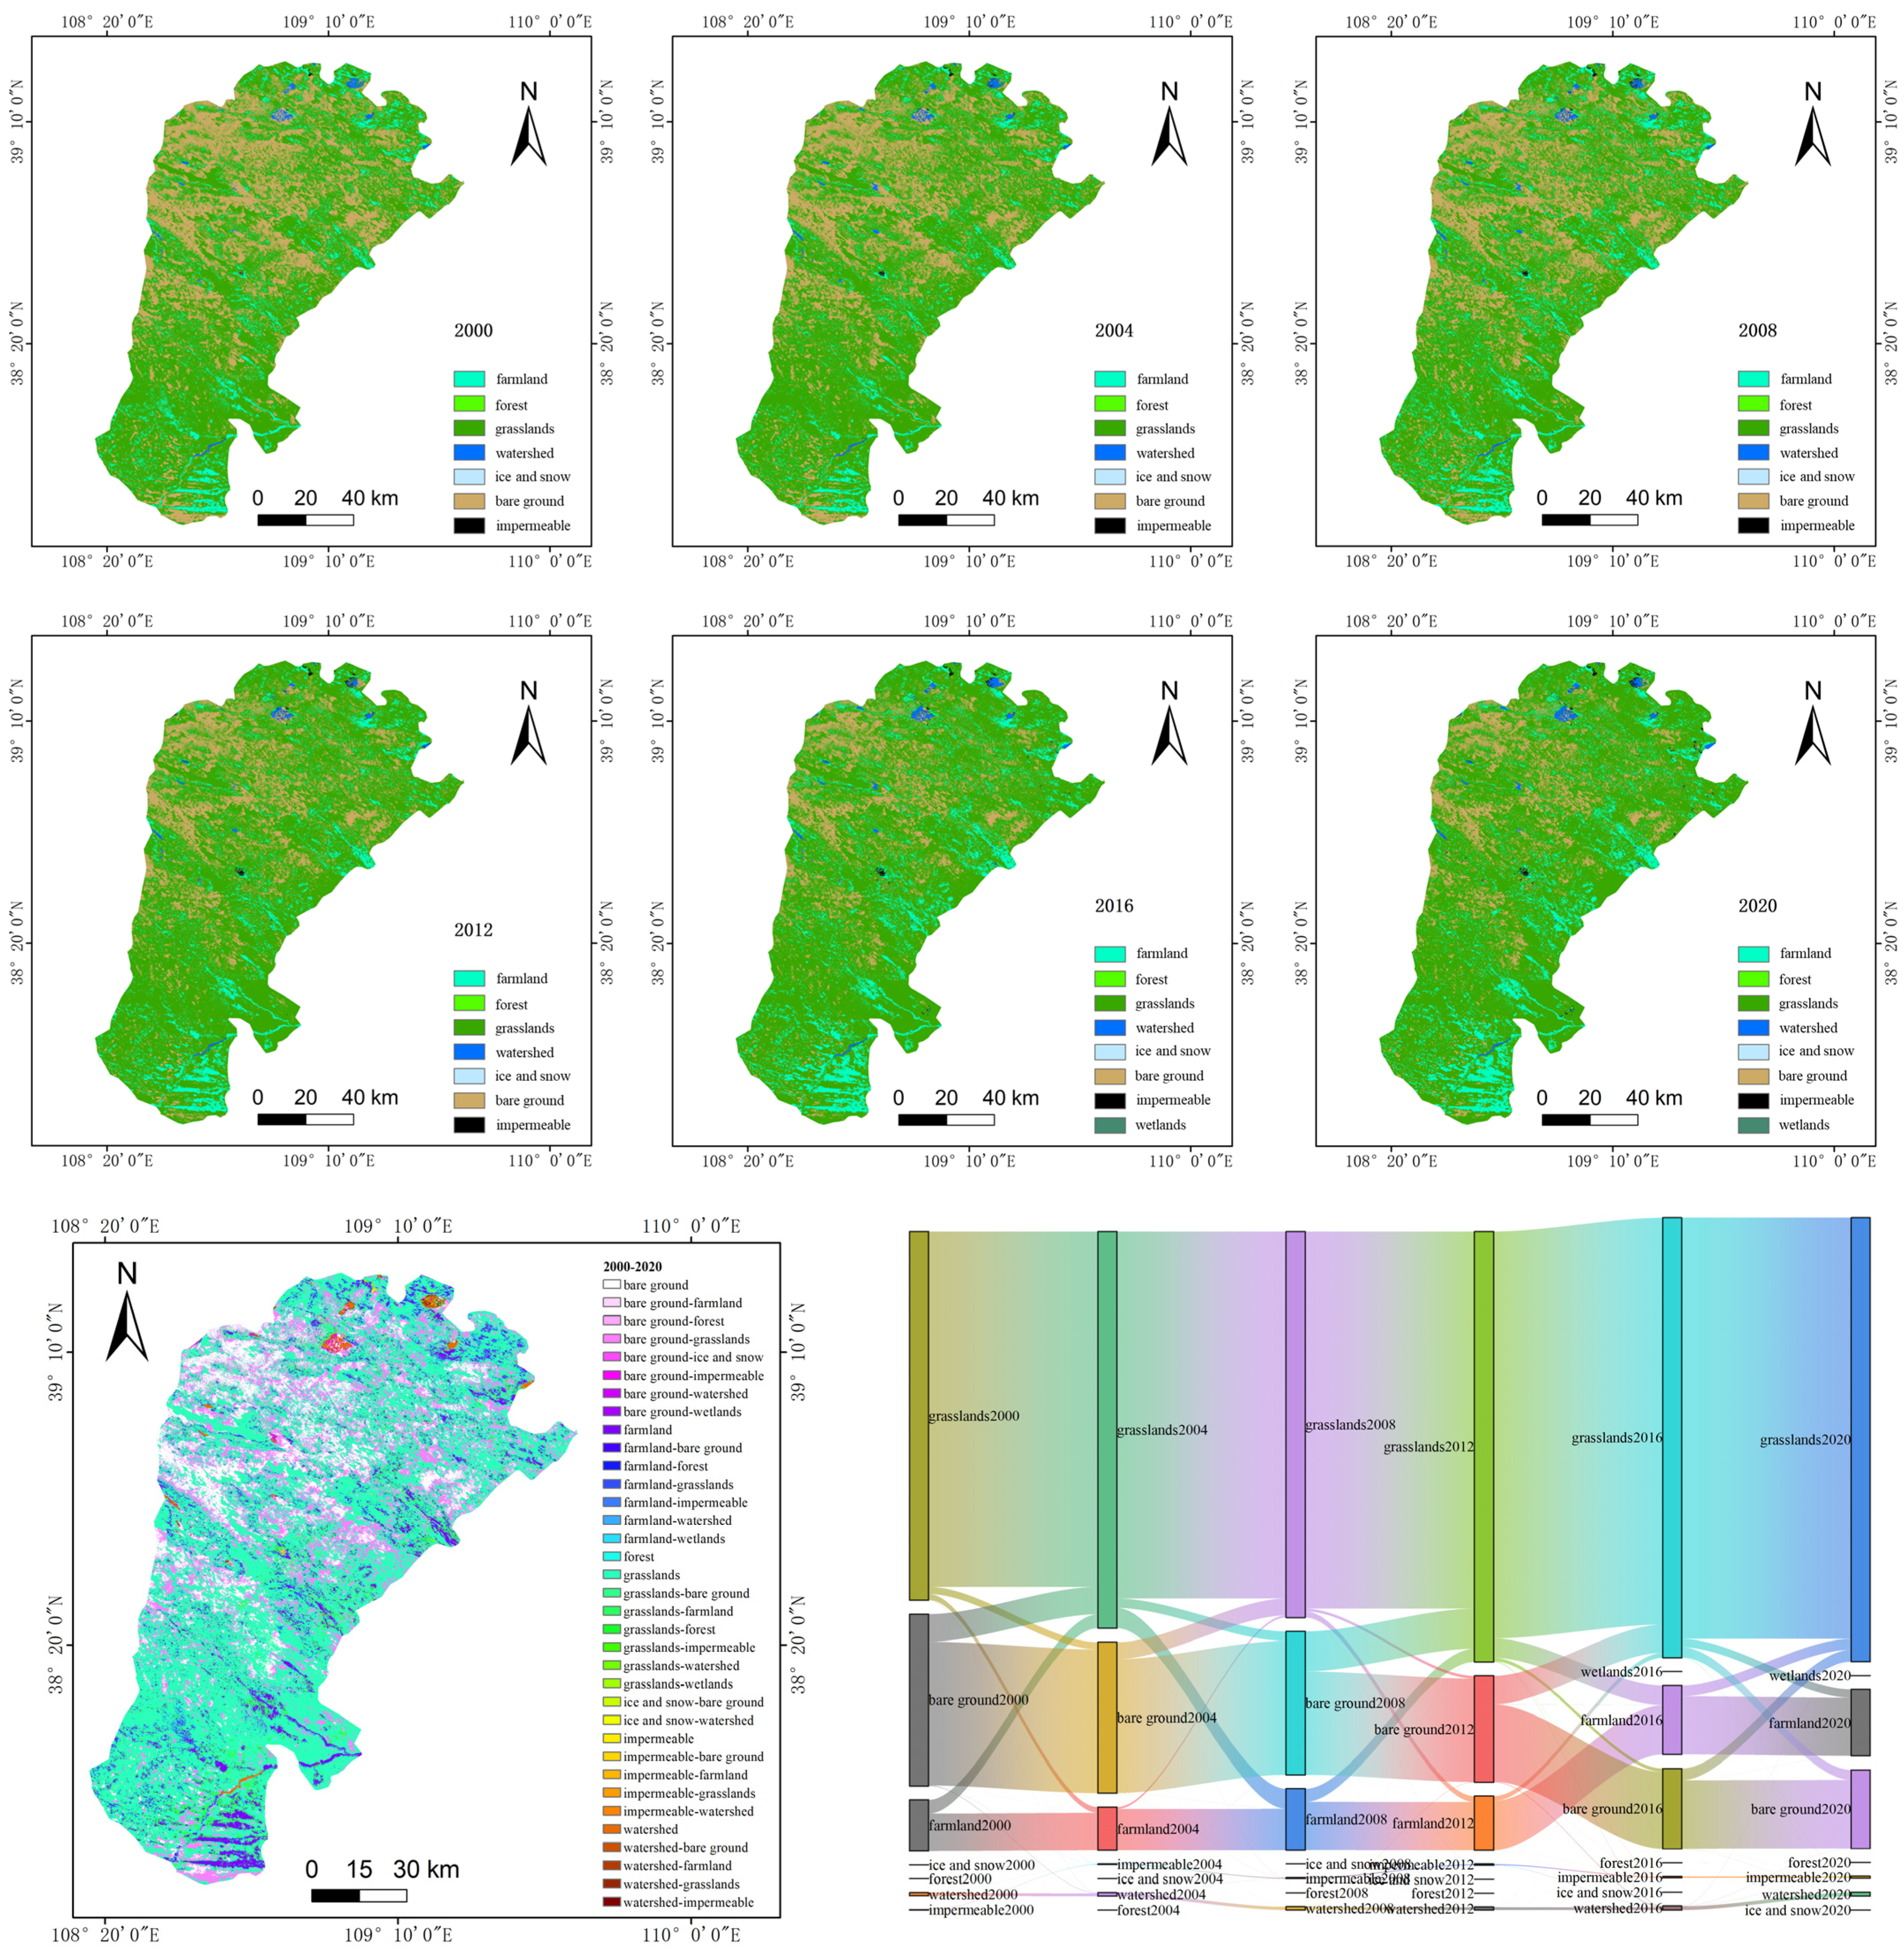
3.5. Effects of Land Use and Elevation Change on Vegetation-Driven Responses

The CLCD land cover data for the period 2000–2020 shows an increase in all land types except for the area of wasteland, which has decreased. The area of land type conversion accounts for 27.43 percent of the total area. The conversion of different land-use types is mainly manifested in the conversion of farmland to grassland, grassland to farmland, and wasteland to grassland, corresponding to 3.02%, 5.42%, and 16.73% of the area of land conversion, respectively, and the increase in grassland and the decrease in wasteland are extremely significant, having been much higher than the transformation of other land-use types. This shows that since 2000, the WuShen counties have been implementing projects such as returning ploughland to forests and protecting natural forests, which have been effective in the management of wastelands, and the ecology has been greatly restored (Figure 8).
The NDVI and residual values in the areas of the unchanged land-use type exhibited an upward trajectory, with farmland showing the most prominent increasing trend, followed by grassland; in the changed land-use type areas, except for the decreasing trend in NDVI values and residual values of vegetation in the areas of conversion of farmland to impermeable surfaces and of wasteland to snow and ice, the rest of the changed land-use type areas showed an increasing trend and had a clear consistency. The results show that human activities have the most obvious effect on the NDVI in agricultural land areas in the unchanged land type area, while human activities have the most obvious effect on NDVI in the wasteland-to-grassland areas in the changed land type area (Figure 9).
The relative contribution of climate change and human activities to the NDVI also varies in different elevation regions. The relative contribution of climate change was highest in the altitude region of 1050–1100 m, with 46.14 percent. The relative contribution decreased with increasing elevation and reached a minimum of 17.82% at 1150–1200 m, after which the relative contribution increased with increasing elevation and reached 26.40% at 1250–1300 m. Vegetation degradation occurred in the area above 1300 m, and the impact of human activities in the degraded area is significant. The findings indicate that the overall level of vegetation in the study area is degraded at elevations above 1300 m, which is mostly surrounded by a lack of surface water sources; the land-use types are mostly bare land and near the center of towns, which leads to a relatively poor environment and more frequent human activities, and, thus, causes a certain degree of vegetation degradation (Figure 10).

4. Discussion

This paper shows that a significant increase in the vegetation NDVI occurred in the WuShen counties from 2000 to 2020 and that a sudden increase in precipitation, in particular, among climatic factors, led to a sharp increase in the NDVI, whereas a sudden decrease in precipitation had a relatively small impact on the NDVI, indicating that ecological recharge projects in the region can provide the water needed for vegetation growth. The percentage of the area where significant growth has occurred is 86.83 percent, with a higher growth trend around rivers and towns than in the inland northwest catchment, and a general pattern of “low west, high east”. This finding is consistent with previous studies [43]. On the one hand, the eastern part of the WuShen counties has more precipitation, which is favorable to vegetation growth, while the western part has less precipitation, which limits vegetation growth due to water shortages; the height of the terrain and the direction of the slopes affect the distribution of precipitation and sunlight, and the lower topography of the eastern part is more conducive to water accumulation, which is favorable to vegetation growth. On the other hand, in the eastern region, due to policy support, the fallow forest and ecological restoration project have been progressing faster, while in the western region, due to historical over-cultivation and grazing, the land degradation is serious; and in the eastern region, the investment in ecological protection and management project is greater, and the effect of vegetation restoration is more significant. It can be seen that the ecological construction of the Maowusu Sandland returning farmland to forest and grassland projects implemented by the WuShen counties since 2000 under the impetus of the Western Development and National Forestry Key Projects has been remarkably effective. This conclusion is in line with the study by Wang et al. [22].
The NDVI center of gravity shows a shift from the towns to their surroundings, and its center of gravity response relationship with precipitation and potential evapotranspiration is more significant than that with temperature, which is consistent with Shammi et al.’s finding that precipitation has a greater impact on promoting plant growth in the region compared to temperature [44]. The results show that precipitation and potential evapotranspiration changes are more likely to lead to changes in the regional vegetation cover and that urbanization and expansion have inevitably caused a certain degree of damage to the vegetation in the study area. There was spatial heterogeneity in the biased correlations between climate factors and vegetation cover, with precipitation having a highly significant positive effect on vegetation cover in the eastern periphery of the river, potential evapotranspiration (PET) having a highly significant positive effect on vegetation cover in the northwestern endorheic zone, and air temperature having a low correlation with NDVI with a nonsignificant negative effect in most of the regions. On the one hand, sufficient precipitation provided the basic water conditions for vegetation growth, especially during the growing season, which was crucial for vegetation growth; and the increase in precipitation increased soil moisture, which was favorable for the absorption of water and nutrients by the plant root system, and promoted the growth of vegetation. On the other hand, high evapotranspiration in the northwestern region, usually accompanied by high temperatures, is conducive to the growth and propagation of certain drought-tolerant plants; and under high evapotranspiration conditions, limited precipitation can be effectively utilized through water conservation measures (e.g., mulching, deep-rooted plants), which can contribute to the recovery of vegetation. It is worth noting that Li and Sun et al. found that vegetation cover was positively correlated with precipitation and temperature in the Maowusu Sandland, whereas vegetation cover in the area of the WuShen counties studied in this paper was positively correlated with precipitation and negatively correlated with temperature to a certain extent, which may indicate that the change in vegetation cover in this area is special in the Maowusu Sandland [45,46].
Anthropogenic activities were the dominant factor in vegetation NDVI changes in the study area, which is consistent with the findings of Lin and Gao et al. [20,47]. The results show that 75.89% of the area is characterized by a sustained improvement in vegetation cover due to human activities, with a significantly higher impact on farmland than on other lands. This is partly due to a series of ecological restoration projects, such as the “Three North” protection forest project and the pilot project of returning farmland to forest, and partly to the abundant underground water resources in the WuShen counties. At the same time, the construction of the large water network water supply project in the WuShen counties has greatly promoted the utilization of surface water and drained water in the region, effectively ensuring the intensive and economical utilization of water resources in the region, and providing a better environment for the improvement of vegetation in the region. It is worth noting that in the area where the farmland has been transformed into impermeable surfaces, human activities have obviously damaged the improvement of vegetation, which further indicates that the construction of towns and cities has damaged the vegetation of the region to a certain extent and that it is still necessary to analyze this problem and take measures to improve it in the future. In this regard, the study concluded that eco-agriculture and sustainable animal husbandry modes should be developed, such as rotational grazing, sealing, and mixed sowing, to reduce the pressure on the land; ecological compensation policies should be implemented for the damaged areas, and local governments and enterprises should be encouraged to invest in the ecological restoration projects; sandland management and vegetation restoration projects should be vigorously pushed forward, such as artificial afforestation, fly planting afforestation, and grass squares to control the sandland and to increase the coverage of the vegetation; and remote sensing, Geographic Information Systems (GISs), and other technologies should be utilized to monitor vegetation changes and land degradation, and to provide a scientific basis and technical support for regional vegetation management, to promote the restoration and sustainable development of the ecological environment in the WuShen counties region of the Maowusu Sandland.
However, although the multiple regression residual analysis method has been widely used to isolate the effects of climate change and human activities on vegetation NDVI changes, it still has some shortcomings. This paper analyzes the relationship between changes in subsurface and vegetation changes and specific human activities, but the weights of the impacts of such specific aspects of human activities as vegetation construction, agricultural technological progress, and urban expansion cannot be quantified, and the drivers of vegetation changes should be more detailed in subsequent studies, and the accuracy of the results should be evaluated through field surveys to reduce the uncertainty of the results. Meanwhile, improving the methodology or selecting other methods to quantify the specific details of human activities is also an important direction for future research.

5. Conclusions

(1) The vegetation NDVI in the WuShen counties did not fluctuate significantly with latitude and longitude between 2000 and 2020. The NDVI varied between 0.227 and 0.375, with a regional average increase of 0.13 and a maximum increase of 0.61. Significant growth was observed in 86.83 percent of the region in the study area, and the trend of growth was higher around the rivers and around the towns than in the northwestern endorheic zone, with the overall performance of “ West low east high”. The NDVI growth trend is the strongest in the area south of the Batuwan Reservoir of the Wuding River in the southeast, where villages and communities are gathered and there is no large-scale industry and mining, and the land type is mainly farmland, which indicates that urban construction in the WuShen counties inevitably causes a certain degree of damage to the vegetation.
(2) Only 2.07% of the vegetation NDVI centers of gravity did not shift, and the response to climate factors was mainly consistent with or opposite to the centers of gravity of precipitation and potential evapotranspiration. The partial correlation analysis results suggest that the changes in precipitation and temperature in the eastern riverine region are more likely to affect the vegetation, while the influence of potential evapotranspiration on the vegetation in the northwestern instream region needs more attention to be paid to it.
(3) Human activities are the dominant factor in the vegetation NDVI change; 75.89% of the area is positively influenced by human-led activities, and human activities in the southwest inhibit the improvement of vegetation in this area. The influence of human activities in the unchanged land type area is increasing, most obviously in the farmland area; the farmland-to-impervious category in the changed land type area is weakened by human activities. The vegetation in the elevation area above 1300 m is degraded by the influence of the environment, human activities, and other factors. It can be seen that there are obvious differences in human activities in different subsurfaces of the study area.

Author Contributions

Conceptualization, Z.Z. and X.L.; methodology, Z.Z. and X.L; software, Z.Z.; validation, Z.Z., X.L. and T.L.; formal analysis, Z.Z.; investigation, Z.Z.; data curation, Y.W. and W.W.; writing—original draft preparation, Z.Z.; writing—review and editing, Z.Z. and L.F.; visualization, Z.Z.; supervision, Y.T. All authors have read and agreed to the published version of the manuscript.

Funding

This work was supported by the Inner Mongolia Science and Technology Program (2022YFHH0100) and the National Natural Science Foundation of China 51969021.

Data Availability Statement

The original contributions presented in the study are included in the article; further inquiries can be directed to the corresponding author.

Conflicts of Interest

The authors declare no conflicts of interest. Author Wenjuan Wang is employed by the Inner Mongolia Jinhuayuan Environmental Resources Engineering Consulting Limited Liability Company; his employer’s company was not involved in this study, and there is no relevance between this research and their company. The remaining authors declare that the research was conducted in the absence of any commercial or financial relationships that could be construed as a potential conflict of interest.

References

  1. Hang, X.; Li, Y.; Cao, Y.; Zhu, S.; Han, X.; Li, X.; Sun, L. Land Surface Eco-Environmental Situation Index (LSEESI) Derived from Remote Sensing. IEEE Trans. Geosci. Remote Sens. 2023, 61, 4408018. [Google Scholar] [CrossRef]
  2. van Oorschot, F.; van der Ent, R.J.; Hrachowitz, M.; Di Carlo, E.; Catalano, F.; Boussetta, S.; Balsamo, G.; Alessandri, A. Interannual land cover and vegetation variability based on remote sensing data in the HTESSEL land surface model: Implementation and effects on simulated water dynamics. Earth Syst. Dyn. 2023, 14, 1239–1259. [Google Scholar] [CrossRef]
  3. Lade, S.J.; Fetzer, I.; Cornell, S.E.; Crona, B. A prototype Earth system impact metric that accounts for cross-scale interactions. Environ. Res. Lett. 2021, 16, 115005. [Google Scholar] [CrossRef]
  4. Zhong, S.; Sun, Z.; Di, L. Characteristics of vegetation response to drought in the CONUS based on long-term remote sensing and meteorological data. Ecol. Indic. 2021, 127, 107767. [Google Scholar] [CrossRef]
  5. Bai, X.; Zhao, W. Impacts of climate change and anthropogenic stressors on runoff variations in major river basins in China since 1950. Sci. Total Environ. 2023, 898, 165349. [Google Scholar] [CrossRef] [PubMed]
  6. Pu, M.; Zhao, Y.; Ni, Z.; Huang, Z.; Peng, W.; Zhou, Y.; Liu, J.; Gong, Y. Spatial-temporal evolution and driving forces of NDVI in China’s Giant Panda National Park. Int. J. Environ. Res. Public Health 2022, 19, 6722. [Google Scholar] [CrossRef]
  7. Ma, B.X.; He, C.X.; Jing, J.L.; Wang, Y.F.; Liu, B.; He, H.C. Attribution of vegetation change in Southwest China from 1982 to 2019. Acta Geogr. Sin. 2019, 78, 714–728. [Google Scholar] [CrossRef]
  8. Jin, Y.-S.; Jin, K.; Wang, F.; Liu, C.-X.; Qin, P.; Zong, Q.-L.; Liu, P.-R.; Chen, M.-L. Effects of climate change and human activities on NDVI changes in the eastern coastal areas. Environ. Sci. 2023, 44, 3329–3342. [Google Scholar] [CrossRef]
  9. Gu, Y.; Pang, B.; Qiao, X.; Xu, D.; Li, W.; Yan, Y.; Dou, H.; Ao, W.; Wang, W.; Zou, C.; et al. Vegetation dynamics in response to climate change and human activities in the Hulun Lake basin from 1981 to 2019. Ecol. Indic. 2022, 136, 108700. [Google Scholar] [CrossRef]
  10. Zhang, X.; Jin, X. Vegetation dynamics and responses to climate change and anthropogenic activities in the Three-River Headwaters Region, China. Ecol. Indic. 2021, 131, 108223. [Google Scholar] [CrossRef]
  11. Qu, S.; Wang, L.; Lin, A.; Zhu, H.; Yuan, M. What drives the vegetation restoration in Yangtze River basin, China: Climate change or anthropogenic factors? Ecol. Indic. 2018, 90, 438–450. [Google Scholar] [CrossRef]
  12. Wang, Y.; Zhang, Z.; Chen, X. Quantifying influences of natural and anthropogenic factors on vegetation changes based on geodetector: A case study in the Poyang Lake Basin, China. Remote Sens. 2021, 13, 5081. [Google Scholar] [CrossRef]
  13. Ma, B.; Wang, S.; Mupenzi, C.; Li, H.; Ma, J.; Li, Z. Quantitative Contributions of Climate Change and Human Activities to Vegetation Changes in the Upper White Nile River. Remote Sens. 2021, 13, 3648. [Google Scholar] [CrossRef]
  14. Du, J.M.; Bao, G.; Tong, S.Q.; Huang, X.J.; Meili, W.; Bao, Y.H. Variations in vegetation cover and its relationship with climate change and human activities in Mongolia during the period 1982–2015. Acta Prataculturae Sin. 2021, 30, 1–13. [Google Scholar] [CrossRef]
  15. Xu, M.; Zhang, Z.; Wang, Y.; Liu, B. Quantifying the contributions of climatic and human factors to vegetation net primary productivity dynamics in East Africa. Front. For. Glob. Chang. 2024, 6, 1332631. [Google Scholar] [CrossRef]
  16. Zeng, Y.; Jia, L.; Menenti, M.; Jiang, M.; Zheng, C.; Bennour, A.; Lv, Y. Regional divergent evolution of vegetation greenness and climatic drivers in the Sahel-Sudan-Guinea region: Nonlinearity and explainable machine learning. Front. For. Glob. Chang. 2024, 7, 1416373. [Google Scholar] [CrossRef]
  17. Xiao, H.; Liu, J.; He, G.; Zhang, X.; Wang, H.; Long, T.; Zhang, Z.; Wang, W.; Yin, R.; Guo, Y.; et al. Data-driven forest cover change and its driving factors analysis in Africa. Front. Environ. Sci. 2022, 9, 780069. [Google Scholar] [CrossRef]
  18. Liu, Z.; Wimberly, M.C.; Dwomoh, F.K. Vegetation dynamics in the upper Guinean forest region of West Africa from 2001 to 2015. Remote Sens. 2016, 9, 5. [Google Scholar] [CrossRef]
  19. Cao, Y.P.; Pang, Y.J.; Jia, X.H. Vegetation growth in Mu Us Sandy Land from 2001 to 2016. Bull. Soil Water Conserv. 2019, 39, 29–37. [Google Scholar] [CrossRef]
  20. Gao, W.; Zheng, C.; Liu, X.; Lu, Y.; Chen, Y.; Wei, Y.; Ma, Y. NDVI-based vegetation dynamics and their responses to climate change and human activities from 1982 to 2020: A case study in the Mu Us Sandy Land, China. Ecol. Indic. 2022, 137, 108745. [Google Scholar] [CrossRef]
  21. Ye, Q.; Liu, H.; Lin, Y.; Han, R. Study of Maowusu Sandy Land Vegetation Coverage Change Based on MODIS NDVI. The International Archives of the Photogrammetry. Remote Sens. Spat. Inf. Sci. 2018, 42, 2127–2133. [Google Scholar] [CrossRef]
  22. Wang, Z.; Zhang, T.; Pei, C.; Zhao, X.; Li, Y.; Hu, S.; Bu, C.; Zhang, Q. Multisource remote sensing monitoring and analysis of the driving forces of vegetation restoration in the Mu Us sandy land. Land 2022, 11, 1553. [Google Scholar] [CrossRef]
  23. Didan, K. MODIS/Terra Vegetation Indices Monthly L3 Global 1 km SIN Grid V006. In NASA EOSDIS Land Processes DAAC; NASA: Washington, DC, USA, 2015. [Google Scholar] [CrossRef]
  24. He, Q.; Wang, M.; Liu, K.; Li, K.W.; Jiang, Z.Y. GPRChinaTemp1km: 1 km monthly mean air temperature for China from January 1951 to December 2020. Earth Syst. Sci. Data 2021, 14, 3273–3292. [Google Scholar] [CrossRef]
  25. Qu, L.; Zhu, Q.; Zhu, C.; Zhang, J. Monthly precipitation data set with 1 km resolution in China from 1960 to 2020. Sci. Data Bank. 2022, 8. [Google Scholar] [CrossRef]
  26. Peng, S.Z. 1 km Monthly Potential Evapotranspiration Data Set in China (1990–2021); National Science Data Center of the Qinghai-Tibet Plateau: Beijing, China, 2022. [Google Scholar] [CrossRef]
  27. Peng, S.Z.; Ding, Y.X.; Wen, Z.M.; Chen, Y.M.; Cao, Y.; Ren, J.Y. Spatiotemporal change and trend analysis of potential evapotranspiration over the Loess Plateau of China during 2011–2100. Agric. For. Meteorol. 2017, 233, 183–194. [Google Scholar] [CrossRef]
  28. Peng, S.Z.; Ding, Y.X.; Liu, W.Z.; Li, Z. 1 km monthly temperature and precipitation dataset for China from 1901 to 2017. Earth Syst. Sci. Data 2019, 11, 1931–1946. [Google Scholar] [CrossRef]
  29. Wu, S.; Yan, X.; Yang, B.; Yu, T.; Zhang, J. Spatial and temporal variation analysis of China’s potential evaporation. J. Surv. Mapp. 2022, 4, 1460–1464. [Google Scholar]
  30. Yang, J.; Huang, X. The 30 m annual land cover dataset and its dynamics in China from 1990 to 2019. Earth Syst. Sci. Data 2021, 13, 3907–3925. [Google Scholar] [CrossRef]
  31. Yang, J.; Huang, X. The 30 m Annual Land Cover Datasets and Its Dynamics in China from 1990 to 2021 (1.0.0) [Data Set]; Zenodo: Geneva, Switzerland, 2022. [Google Scholar] [CrossRef]
  32. Vrsalović, A.; Andrić, I.; Bonacci, O.; Kovčić, O. Climate variability and trends in Imotski, Croatia: An analysis of temperature and precipitation. Atmosphere 2023, 14, 861. [Google Scholar] [CrossRef]
  33. Zeleňáková, M.; Vido, J.; Portela, M.M.; Purcz, P.; Blištán, P.; Hlavatá, H.; Hluštík, P. Precipitation trends over Slovakia in the period 1981–2013. Water 2017, 9, 922. [Google Scholar] [CrossRef]
  34. Wang, F.; Shao, W.; Yu, H.; Kan, G.; He, X.; Zhang, D.; Ren, M.; Wang, G. Re-evaluation of the power of the Mann-Kendall test for detecting monotonic trends in hydrometeorological time series. Front. Earth Sci. 2020, 8, 14. [Google Scholar] [CrossRef]
  35. Yang, L.; Fei, S.; Jia, H.; Qi, J.; Wang, L.; Hu, X. Study on the relationship between the spatial distribution of shared bicycle travel demand and urban built environment. Sustainability 2023, 15, 13576. [Google Scholar] [CrossRef]
  36. Hu, L.; Jiang, C.Y.; Li, Z.B.; Zhang, X.; Li, P.; Wang, Q.; Zhang, W.J. Evolution path analysis of economic gravity center and air pollutants gravity center in Shaanxi province. Adv. Mater. Res. 2012, 361, 1359–1363. [Google Scholar] [CrossRef]
  37. Liu, Y.; Wang, P. Partial Correlation Analysis Based Identification of Distribution Network Topology. CSEE J. Power Energy Syst. 2023, 9, 1493–1504. [Google Scholar] [CrossRef]
  38. Keithley, R.B.; Wightman, R.M.; Heien, M.L. Multivariate concentration determineation using principal component regression with residual analysis. TrAC Trends Anal. Chem. 2009, 28, 1127–1136. [Google Scholar] [CrossRef]
  39. Yang, Y. Prediction and analysis of aero-material consumption based on multivariate linear regression model. In Proceedings of the 2018 IEEE 3rd International Conference on Cloud Computing and Big Data Analysis (ICCCBDA), Chengdu, China, 20–22 April 2018; IEEE: Piscataway, NJ, USA, 2018; pp. 628–632. [Google Scholar] [CrossRef]
  40. Torres-Signes, A.; Frías, M.P.; Ruiz-Medina, M.D. COVID-19 mortality analysis from soft-data multivariate curve regression and machine learning. Stoch. Environ. Res. Risk Assess. 2021, 35, 2659–2678. [Google Scholar] [CrossRef] [PubMed]
  41. Stow, D.; Daeschner, S.; Hope, A.; Douglas, D.; Petersen, A.; Myneni, R.; Zhou, L.; Oechel, W. Variability of the seasonally integrated normalized difference vegetation index across the north slope of Alaska in the 1990s. Int. J. Remote Sens. 2003, 24, 1111–1117. [Google Scholar] [CrossRef]
  42. Cook, R.D.; Weisberg, S. Partial one-dimensional regression models. Am. Stat. 2004, 58, 110–116. [Google Scholar] [CrossRef]
  43. Wang, Z.; Wu, Y.; Li, D.; Fu, T. The southern boundary of the Mu Us Sand Sea and its controlling factors. Geomorphology 2022, 396, 108010. [Google Scholar] [CrossRef]
  44. Shammi, S.A.; Meng, Q. Modeling crop yield using NDVI-derived VGM metrics across different climatic regions in the USA. Int. J. Biometeorol. 2023, 67, 1051–1062. [Google Scholar] [CrossRef]
  45. Sun, Z.; Mao, Z.; Yang, L.; Liu, Z.; Han, J.; Wanag, H.; He, W. Impacts of climate change and afforestation on vegetation dynamic in the Mu Us Desert, China. Ecol. Indic. 2021, 129, 108020. [Google Scholar] [CrossRef]
  46. Li, Y.; Cao, Z.; Long, H.; Liu, Y.; Li, W. Dynamic analysis of ecological environment combined with land cover and NDVI changes and implications for sustainable urban–rural development: The case of Mu Us Sandy Land, China. J. Clean. Prod. 2017, 142, 697–715. [Google Scholar] [CrossRef]
  47. Lin, M.; Hou, L.; Qi, Z.; Wan, L. Impacts of climate change and human activities on vegetation NDVI in China’s Mu Us Sandy Land during 2000–2019. Ecol. Indic. 2022, 142, 109164. [Google Scholar] [CrossRef]
Figure 1. Overview of the study area.
Forests 15 01762 g001
Figure 2. Temporal variation characteristics of NDVI and driver factors. (a). Characterization of trends with longitude. (b). Characterization of trends with latitude. (c). NDVI and interannual variability of climate factors.
Forests 15 01762 g002aForests 15 01762 g002b
Figure 3. Spatial and temporal trends of NDVI and driving factors. (a). Trends in NDVI. (b). NDVI trend test. (c). Precipitation test statistics. (d). Temperature test statistics. (e). PET test statistics.
Forests 15 01762 g003aForests 15 01762 g003b
Figure 4. NDVI and driver gravity shift characteristics. (a). NDVI center of gravity shift. (b). Shift in precipitation center of gravity. (c). Shift in the center of gravity of average temperature. (d). PET center of gravity shift.
Forests 15 01762 g004
Figure 5. Center of gravity shift responses between NDVI and driver factors. (a). NDVI and precipitation response. (b). NDVI and temperature response. (c). NDVI and PET response. (d). Precipitation and temperature response. (e). Precipitation and PET response. (f). Temperature and PET response.
Forests 15 01762 g005
Figure 6. Partial correlation analysis between NDVI and driving factors. (a). NDVI and precipitation bias. (b). NDVI and temperature bias. (c). NDVI and PET bias. (d). NDVI and precipitation t-test. (e). NDVI and temperature t-test. (f). NDVI and PET t-test.
Forests 15 01762 g006
Figure 7. Response relationship between NDVI and driver factors. (a). Residual trend analysis. (b). Relative role of climate change. (c). Relative role of human activities. (d). Dominant factors.
Forests 15 01762 g007
Figure 8. Changes in land-use types from 2000 to 2020.
Forests 15 01762 g008
Figure 9. Response of vegetation to driving factors in different land-use regions.
Forests 15 01762 g009
Figure 10. Response of vegetation at different elevations to driving factors.
Forests 15 01762 g010
Table 1. Classification of driving factors of NDVI change and calculation of contribution degree.
Slope (NDVIobs) aDriving ForceCriteria for Classifying DriversContribution of Drivers (%)
Slope (NDVICC) bSlope (NDVIHA) cClimate ChangeHuman Activity
>0CC and HA>0>0slope (NDVICC)slope (NDVIHA)
slope (NDVIobs)slope (NDVIobs)
CC>0<01000
HA<0>00100
<0CC and HA<0<0slope (NDVICC)slope (NDVIHA)
slope (NDVIobs)slope (NDVIobs)
CC<0>01000
HA>0<00100
Note: a, b, and c refer to the trend rates of the observed, predicted, and residual values of the NDVI, respectively. Among them, b and c are used to indicate the trends of the NDVI under the influence of climate change and human activities, respectively. In this paper, the factor with a contribution rate of more than 55% is defined as the dominant factor, and the contribution rate of 45% to 55% is defined as the integrated driver, with comparable contribution rates of the two, to analyze the difference in response more intuitively.
Table 2. Gravity shift ratios between NDVI and driving factors.
The Direction of the TransferNDVI and PrecipitationNDVI and TemperatureNDVI and PETPrecipitation and TemperaturePrecipitation and PETTemperature and PET
Directional consistency24.0715.7723.6517.4329.4617.84
Opposite direction25.3115.7726.5612.8623.6512.03
Other50.6268.4649.7969.7146.8970.12
Table 3. Area proportion of the relative contributions of climate change and human activities.
Relative Contribution (%)Area Proportion (%)
<−20−20~00~2020~4040~6060~80≥80
Climate change0.310.7245.7531.7110.724.346.45
Human activity6.270.046.544.3410.7231.7140.38
Disclaimer/Publisher’s Note: The statements, opinions and data contained in all publications are solely those of the individual author(s) and contributor(s) and not of MDPI and/or the editor(s). MDPI and/or the editor(s) disclaim responsibility for any injury to people or property resulting from any ideas, methods, instructions or products referred to in the content.

