Article

Study on the Constraint Effect of Vegetation on Ecosystem Services in the Yellow River Basin

1
Key Laboratory of Forest Silviculture of the State Forestry and Grassland Administration, Research Institute of Forestry, Chinese Academy of Forestry, Beijing 100091, China
2
Co-Innovation Center for Sustainable Forestry in Southern China, Nanjing Forestry University, Nanjing 210037, China
*
Author to whom correspondence should be addressed.
Forests 2024, 15(10), 1771; https://doi.org/10.3390/f15101771
Submission received: 18 September 2024 / Revised: 29 September 2024 / Accepted: 7 October 2024 / Published: 9 October 2024
(This article belongs to the Section Forest Ecology and Management)

Abstract

:
Ecosystem services (ESs) serve as the foundation for sustaining human life and development, with vegetation status playing a crucial role in influencing the supply of these services. This study focuses on the Yellow River Basin (YRB), where we quantitatively examined the main ESs indicators from 2010 to 2020. We explored the trends in fractional vegetation cover (FVC) and ESs, as well as the constraint relationship between FVC and total ecosystem services (TES). The findings are as follows. (1) From 2010 to 2020, FVC, landscape aesthetics (LA), soil conservation (SC), food production (FP), and TES in the YRB demonstrated an upward trend, whereas water yield (WY) exhibited a downward trend. (2) A constraint relationship exists between FVC and LA, SC, WY, and TES, with the constraint line taking on a hump-like shape. (3) The threshold value of the constraint line between FVC and LA, SC, WY, and TES are approximately 80%. Below this value, FVC does not impose a constraint effect on LA, SC, WY, and TES, but above 80%, a strong constraint effect emerges, leading to a reduction in LA, SC, WY, and TES. These results offer a valuable data reference for guiding future vegetation restoration and ecological engineering efforts in the region.

1. Introduction

ESs refer to the natural environment conditions and the utilities of ecosystems that sustain human existence, which are primarily categorized into four types: supporting, regulating, provisioning, and cultural services [1,2,3]. ESs form the foundation of human survival and development, acting as a bridge between natural ecosystems and social ecosystems [4,5]. Currently, two-thirds of the world’s ecosystems are experiencing decline, while the immense demand for ESs for human society development continues to grow daily; this increasing demand prompts humans to further exploit ecological resources and ecosystems, thereby accelerating ecosystem degradation. The degradation of ecosystems results from a combination of factors, including natural factors (such as temperature, precipitation, and extreme weather), human factors (like urbanization, agriculture, and vegetation cover), and social factors (including population growth and economic development), all of which have an impact on ecosystems to varying degrees [6,7]. Each ES does not exist in isolation, and a single ecosystem can provide multiple ESs due to the complexity of its structure and the diversity of its functions [8,9].
Vegetation is a crucial component of terrestrial ecosystems and is viewed as a significant driver of potential impacts on ecosystem quality and the provision of ESs [10]. In practical ecological management, vegetation restoration is essential for ecological rehabilitation and restoration, and China has successfully expanded vegetation cover through various ecological restoration initiatives. However, some regions continue to experience vegetation degradation despite these efforts [11,12]. Forestry ecological engineering enhances sustainable by expanding vegetation areas and improving vegetation quality [13,14]. Deng et al. [15] reported that forestry ecological projects on the Loess Plateau increased the FVC and reduced soil erosion. Wang et al. [16] found that vegetation restoration in Northwest China enhanced soil and water conservation services but led to a decline in water yield. These studies illustrate that the responses of ESs to vegetation change vary across different study areas and spatio-temporal scales. Moreover, the trends in multiple ESs differ, ultimately impacting the region [8,17,18].
Currently, research on ESs primarily focuses on spatio-temporal change patterns [19], trade-offs, and synergy relationships [9], as well as the supply and demand of ESs [20]. The relationships between drivers and ESs are often nonlinear due to the varying intensities of ecosystem responses to external drivers [21]. Typically, the scatter plot depicting these relationships is bounded by a “constraint line” [22]. This constraint line indicates the range or potential extreme values of the independent variable along the X-axis in relation to the dependent variable [23,24,25], thereby illustrating the limiting relationship between them [26,27]. Examples include the impact on ESs [28], the relationship between vegetation and water yield, and the constraint effects of soil conservation on carbon sequestration [29]. The YRB is the cradle of Chinese civilization and a crucial ecologically sensitive area in China, characterized by diverse ecological types and abundant energy resources. Consequently, the ecosystem status of the YRB plays a pivotal role in China’s high-quality ecological development. Therefore, a thorough understanding of the dynamic changes in FVC and the relationships between vegetation and ESs is essential for accurately assessing ES functions and implementing appropriate protection and management measures.
Considering the crucial role and complex influence of FVC on ESs, this study aims to examine the constraint effects between FVC and ESs in the YRB. It is hypothesized that changes in vegetation cover exhibit a threshold effect on ES supply, where once FVC surpasses a certain critical level, further improvements in ESs become restricted. Consequently, this research uses the YRB as the study area, assessing the spatio-temporal variations of FVC and ESs from 2010 to 2020 and exploring the threshold between FVC and ESs. The findings will provide essential data support for ecosystem management and optimization in the basin. The main research objectives of this paper are as follows: (1) to explore the change trend in FVC and ESs in the YRB from 2010 to 2020; and (2) to investigate the constraint effect and the threshold between FVC and ESs in the YRB. This study provides data support for the implementation of follow-up forestry projects in the YRB.

2. Materials and Methods
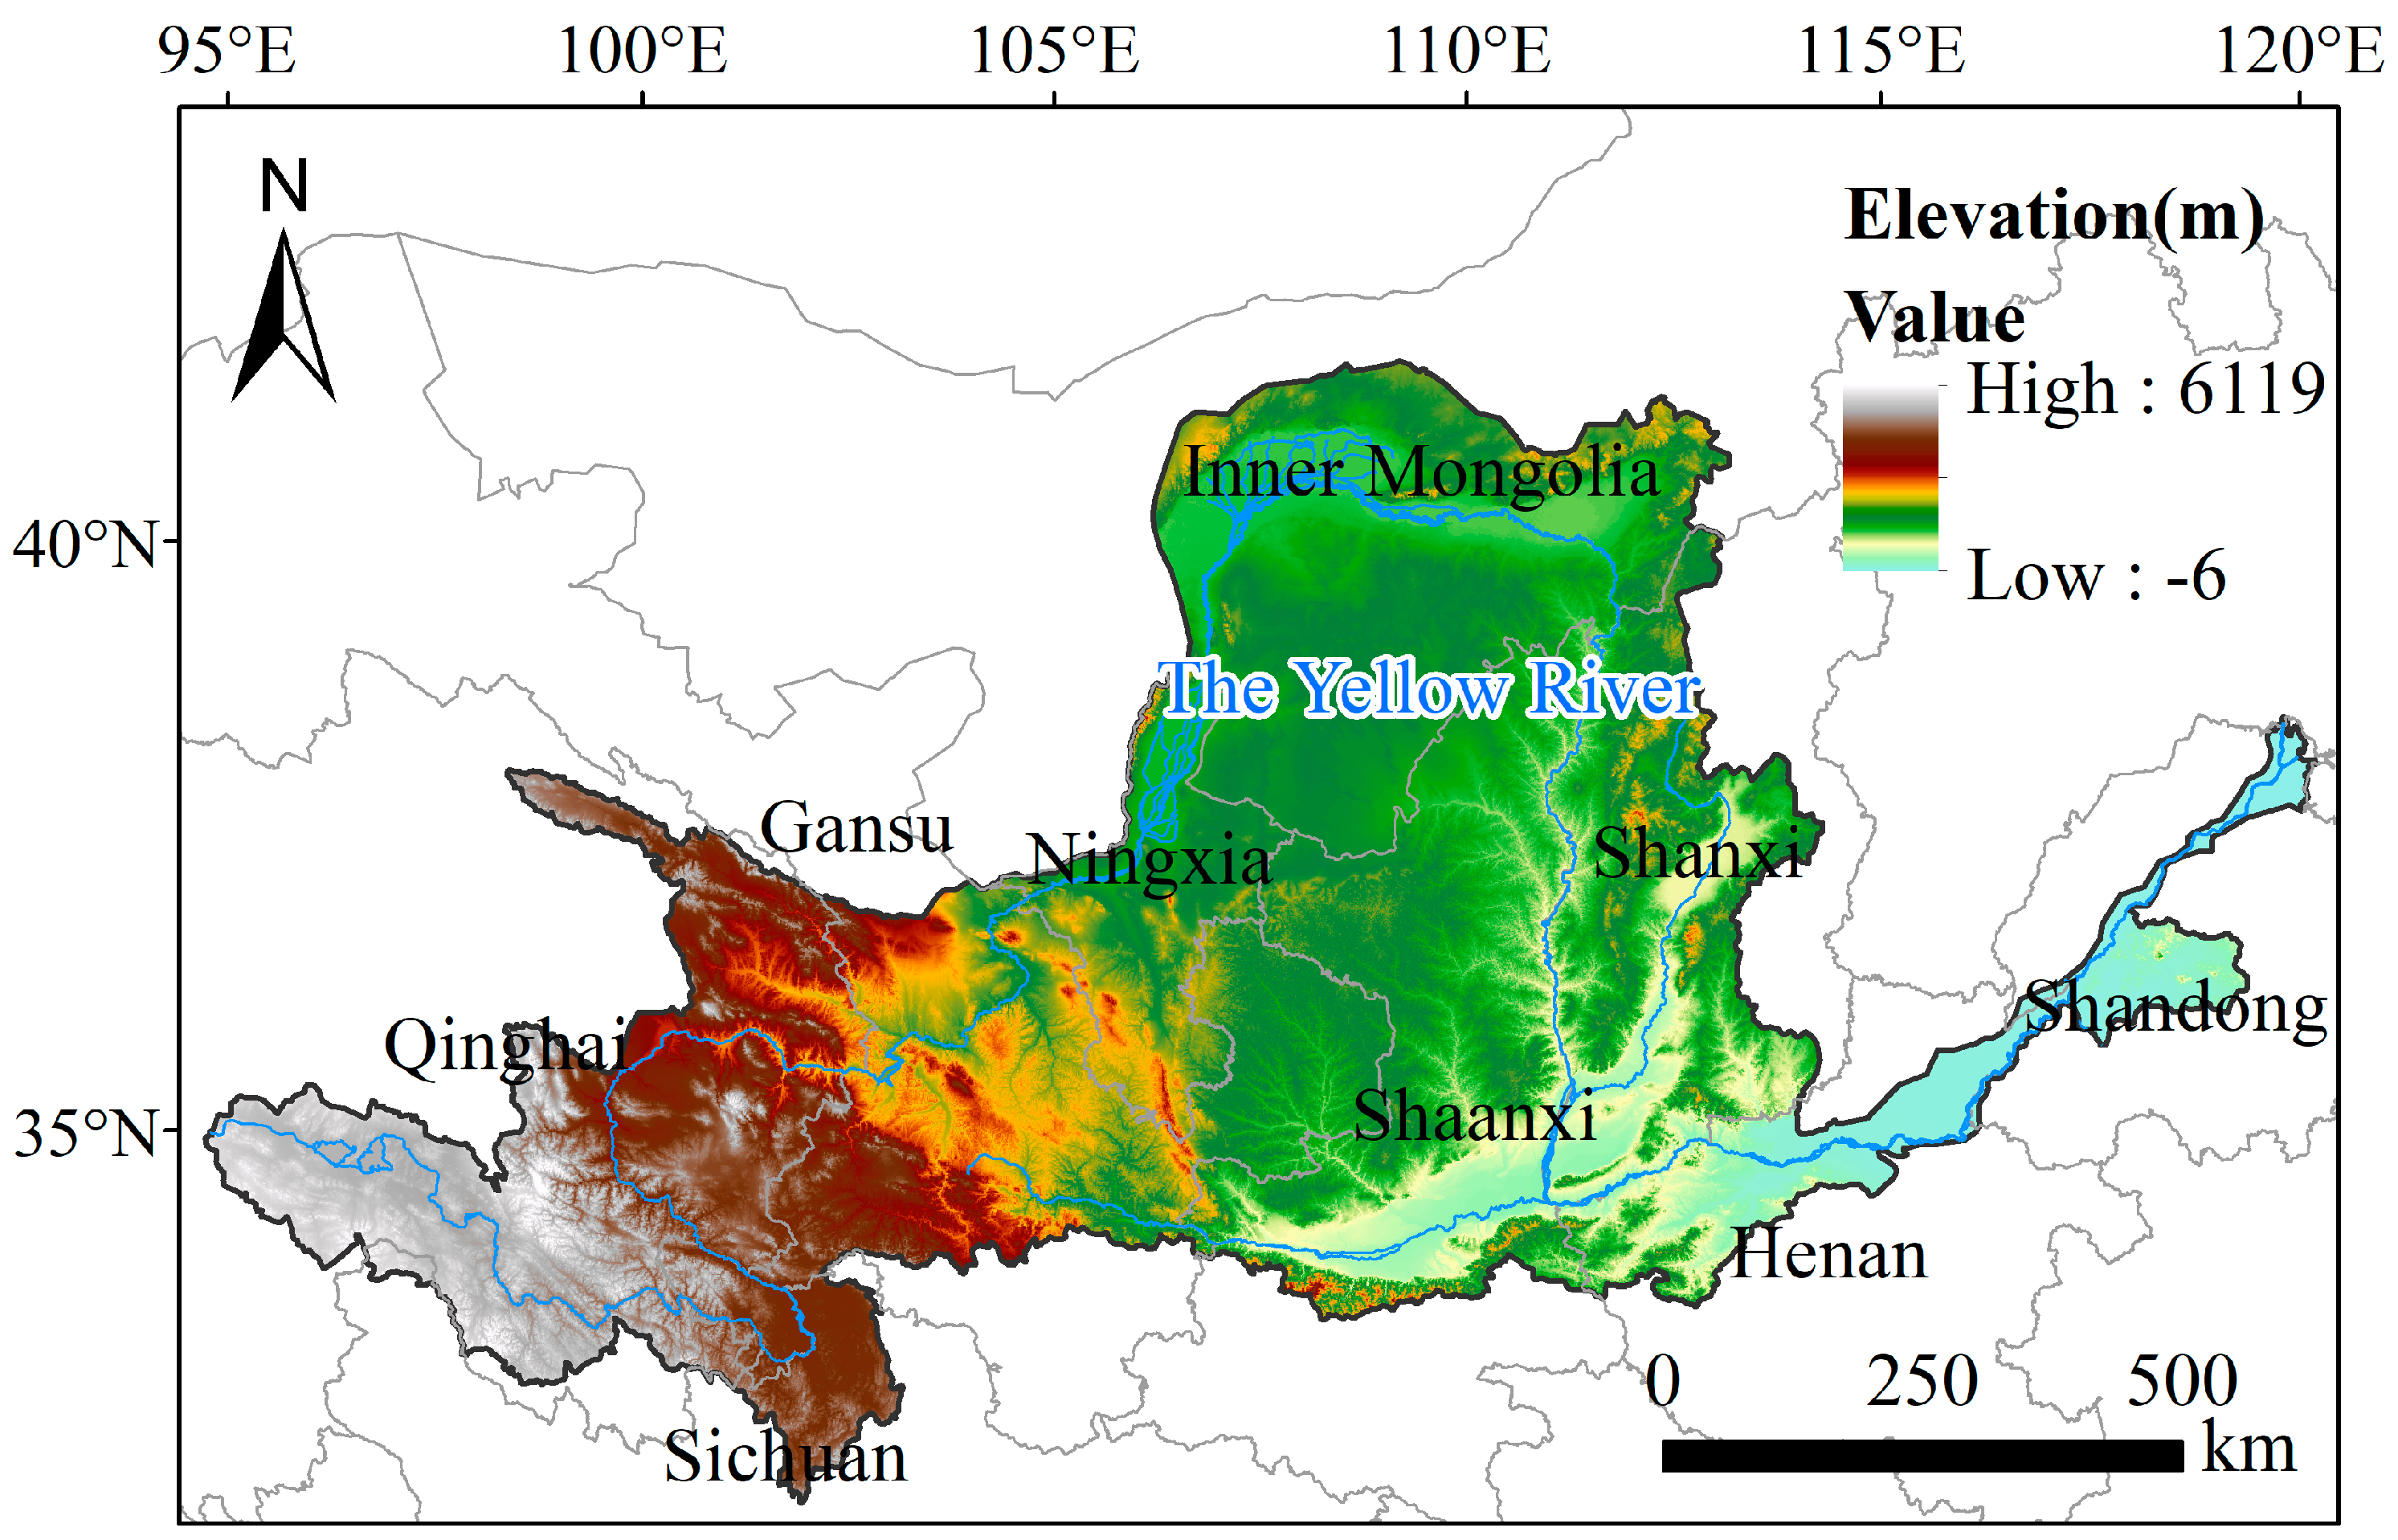
2.1. Study Region

The YRB, which begins in the Qinghai–Tibet Plateau, extends across 9 provinces, covering an area of 79.5 × 10⁴ km2 and a length of 5464 km (Figure 1). Known as the “mother river” of China, the YRB plays a pivotal role in the birth of Chinese civilization [30]. Throughout over 3000 years of Chinese history, the YRB served as the nation’s political, economic, and cultural center [31]. It remains a vital region for population activities and economic development and is a key water supply area in China. The YRB exhibits distinct topographic variations, characterized by a three-step distribution from west to east, with high elevations in the west and lower in the east. The upper reaches are dominated by mountains and grass land plateaus, all of which are situated above 3000 m. In the middle reaches, the region is filled with mountains and valleys, featuring rapid water flow and steep slopes.
To accelerate green development, enhance ecological civilization construction, and improve the nation’s environmental quality, a series of ecological restoration projects have been implemented across China. These initiatives have significantly increased forest cover and improved the ecological environment. Despite these efforts, the YRB still faces several ecological challenges, including the over-exploitation of water resources, irrational resource utilization, and the rapid pace of urbanization [32,33]. With the exacerbation of climate issues, ensuring ecological security in the YRB has become an urgent priority. The timely monitoring and understanding of the changing trends in FVC and ESs in the YRB are crucial for providing data support for integrated ecosystem management in the region.

2.2. Data Sources

2.2.1. The Original Data Source

The spatial data, vegetation data, land use data, and statistical data used by us are from the websites shown in Table 1, and the detailed methods are displayed in Supplementary Materials.

2.2.2. Calculation Method

According to the classification method of Millennium Ecosystem Assessment [3], four important ESs were selected in the YRB. We calculated the four ESs in the YRB via the methodology described in Table 2.

2.3. Analysis Methods

2.3.1. Theil–Sen Median Slope Analysis and Mann–Kendall Test

The Theil–Sen Median method is a common nonparametric statistical trend calculation method [34]. This method can calculate all data points and take the median of the calculated results as the estimate of the trends. This method is not sensitive to measurement errors and outliers, so it is often used to test linear trends [35]. Its calculation formula is as follows:
Q = m e a n x j x i j i , j > i
where x j and x i belong to the time series data, and a Q greater than 0 indicates an upward trend. If Q is less than 0, the independent variable tends to decay.
The Mann–Kendall test is applicable to data trend analysis in the fields of meteorology and water temperature, etc. By comparing the sequence relationships of all data in a long time series, we can judge whether the changes in independent variables are significant [36]. For the time series, Xi = (x1, x2, …, xn), and the Mann–Kendall test statistic S was calculated:
S = i + 1 n = 1 j = i + 1 n s g n ( x j + x i )
Z = S V a r ( S ) ( S > 0 ) 0 ( S = 0 ) S + 1 V a r ( S ) ( S < 0 )
V a r s = n n 1 2 n + 5 i = 1 m t i ( t i 1 ) ( 2 t i + 5 ) 18
where n is the length of the data sequence, sgn ( x j x i ), which is a sign function. m is the number of knots (recurring data sets) in the sequence, and t i is the width of each knot.

2.3.2. Constraint Line Extraction

The constraint line approach reflects the limiting between two causally related variables and provides new ideas for revealing the relationship between ESs and FVC. First of all, we standardized WY, LA, FP, and SC to eliminate the differences between the indicators via the following formula:
E S s = E S E S m i n E S m a x E S m i n
T E S = i = 1 n E S s i
where E S s is the standardized E S , and E S m a x and E S m i n are the maximum ES and minimum ES, respectively. TES are the total ecosystem services, E S s i are standardized ESs for class i, and n is 4.
In our paper, the quantile segmentation method was used to extract boundary points. First, the limit variables were divided according to the value size, and the 99.9% quantiles of all the points in each interval were taken as boundary points. Finally, R 4.3.1 software was used to fit all boundary points and obtain constraint lines [37].

3. Results

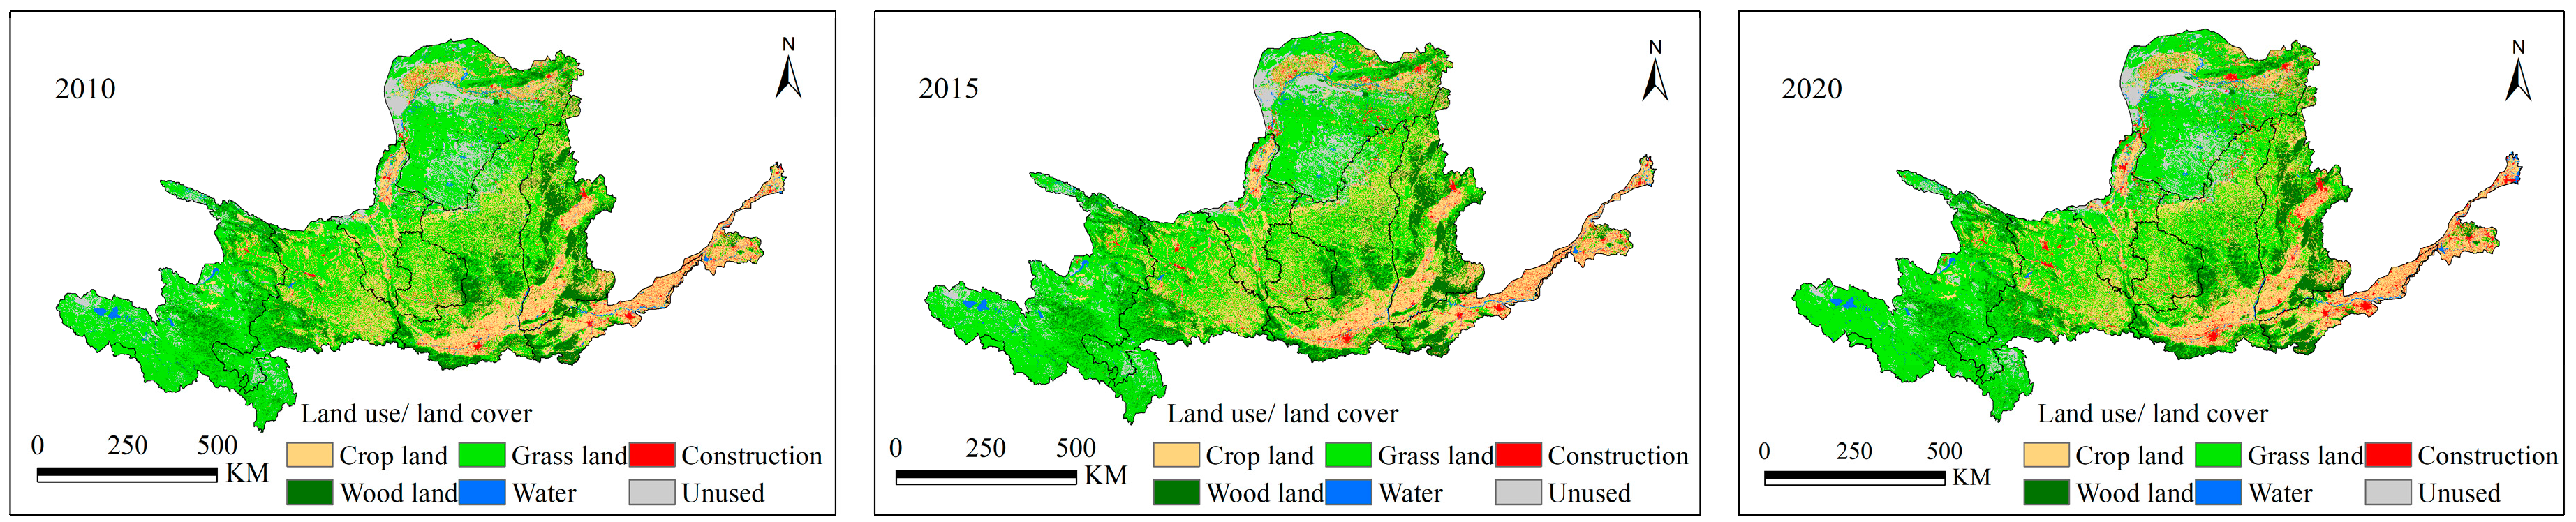
3.1. Spatio-Temporal Changes in Land Use in the YRB from 2010 to 2020

Figure 2 exhibits the changes in land use patterns in the YRB for the years 2010, 2015, and 2020. Grass land constitutes the predominant land use type, followed by crop land and forest land. Between 2010 and 2020, both crop land and unused land areas showed a decreasing trend. Specifically, the crop land area declined from 214,663 km² in 2010 to 205,744 km² in 2020, marking a loss rate of 3.47% (Table 3). Similarly, the area of unused land dropped from 73,531 km² in 2010 to 64,340 km² in 2020, resulting in a loss rate of 10.43%. Conversely, the areas of forest land, grass land, water bodies, and construction land all increased. Notably, the area of construction land saw the highest growth rate at 32.44%, followed by water bodies at 4.89% and grass land at 1.78% (Table 3). This shift in land use patterns can be attributed to China’s implementation of major forestry ecological projects, such as the natural forest protection project and the conversion of crop land to forest and grass land.

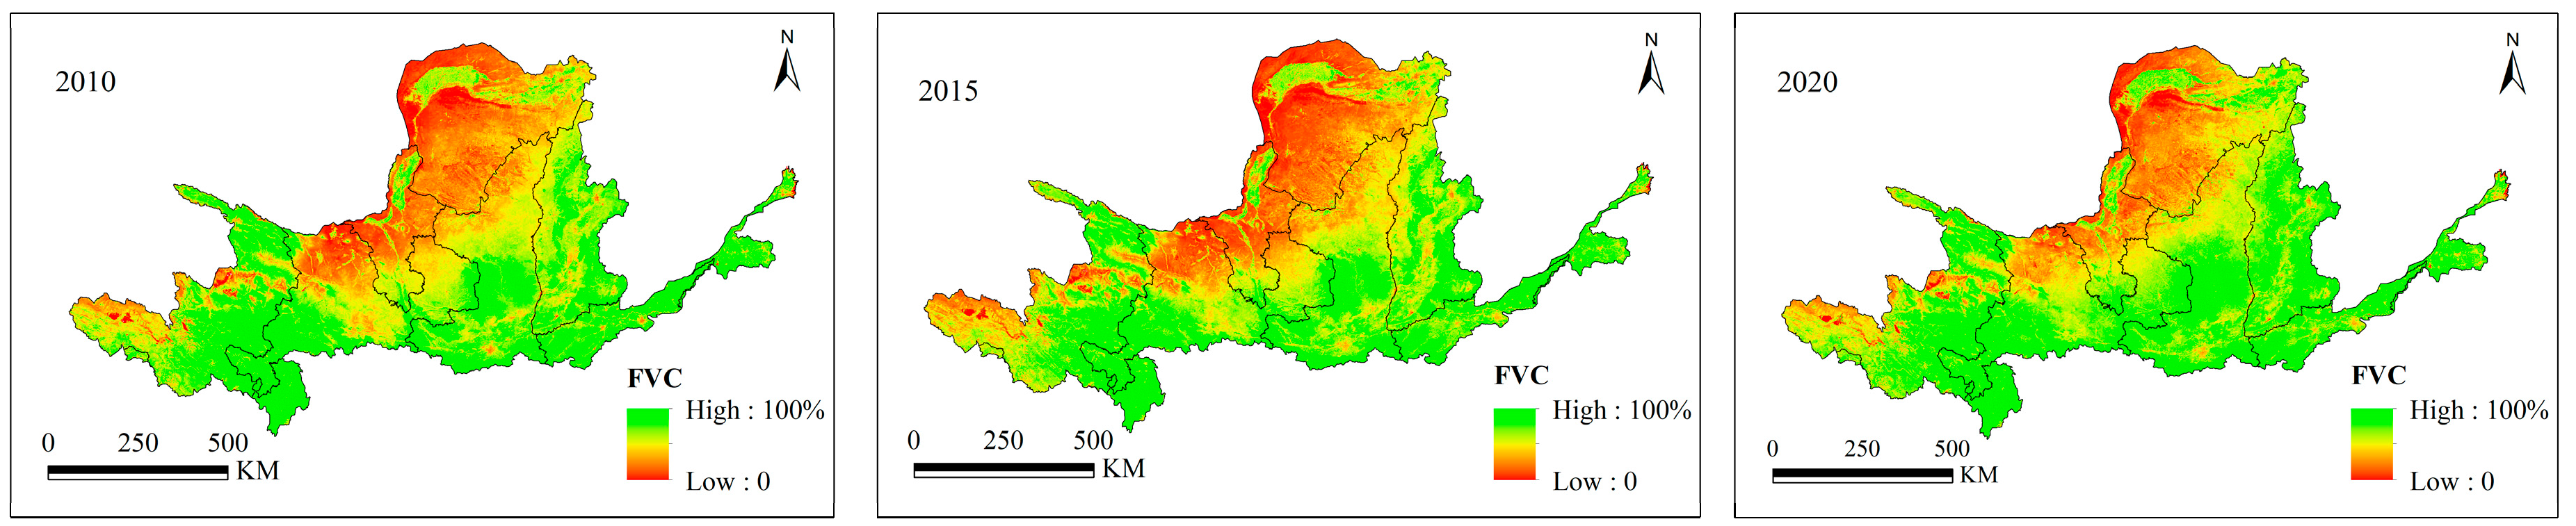
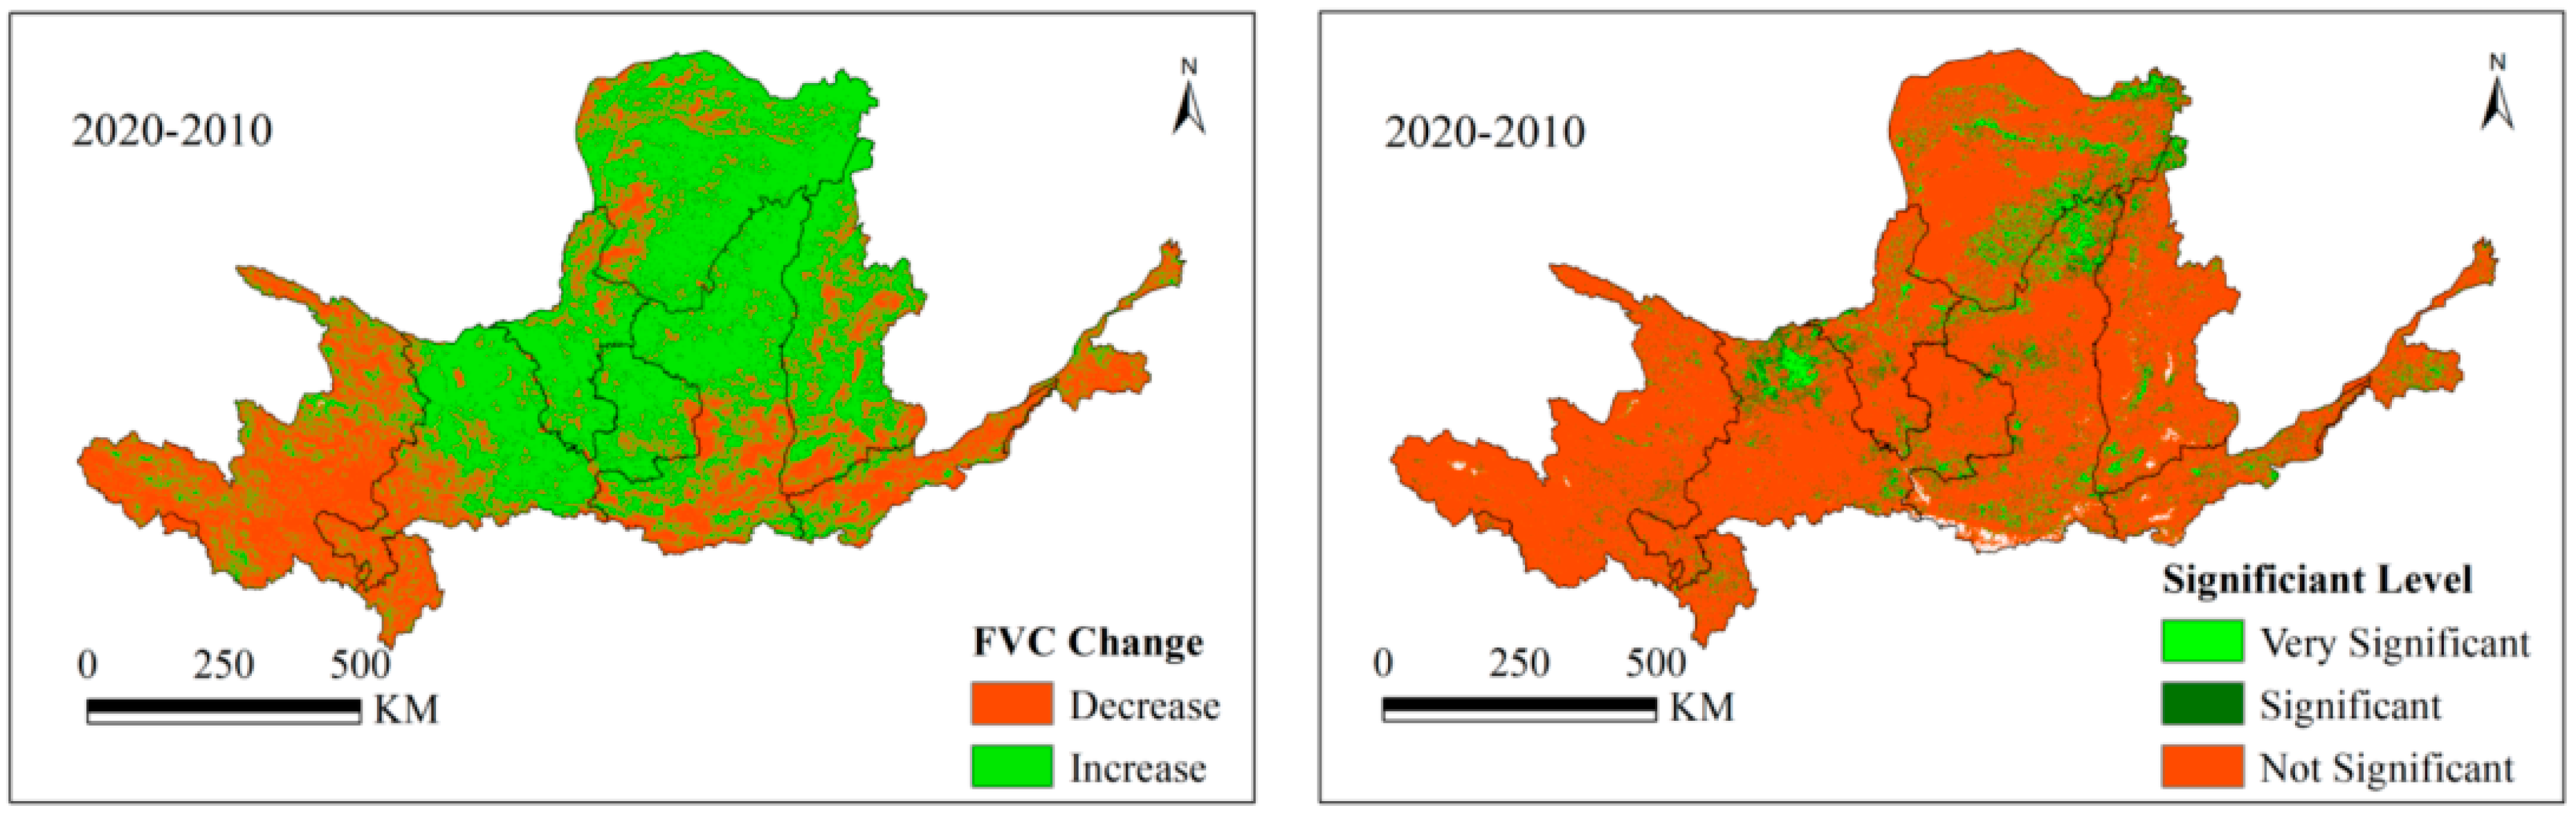
3.2. Varying Trend in the FVC in the YRB

The spatio-temporal distribution of FVC changes in the YRB is illustrated in Figure 3. From 2010 to 2020, the FVC generally exhibited an upward trend, with the average increasing from 60% in 2010 to 65% in 2020 (Figure S1). The lowest FVC was recorded in 2015 (58%), while the highest FVC occurred in 2018 (66%) (Figure S1). Across different years, FVC changes displayed a consistent spatial distribution pattern, increasing from northwest to southeast across the entire basin. Areas with relatively high values were predominantly located in the lower reaches of Shandong and Henan, which are characterized by forest land, crop land, and grass land. Trend analysis indicated a significant FVC increase from 2010 to 2020 in the Inner Mongolia Autonomous Region, Shaanxi Province, Shaanxi Province, Shanxi Province, Ningxia Province, and Gansu Province (Figure 4). Specifically, notable vegetation changes were observed in Baiyin District, Jingtai County, Jingyuan County, and Yongdeng County of Gansu Province, as well as Shenmu city and Yuyang District of Shaanxi Province, Yijinhoruo Banner and Wushen Banner of the Inner Mongolia Autonomous Region, and Youyu County of Shanxi Province (p < 0.01).

3.3. Spatio-Temporal and Spatial Distributions of ESs

In this study, we quantified four ESs in the YRB, as shown in Figure 5. The spatial distributions of these services are heterogeneous, although they are consistent across different time scales. The spatial pattern distribution of FP is characterized by low values in the northwest, with high-value areas mainly in the middle and lower reaches of Shandong and Henan. LA exhibits a decreasing trend from the southwest to the northeast. The upper reaches of the YRB, with minimal human disturbance and relatively high biodiversity, represent high-value areas, while densely populated regions such as Henan and Shandong, which have lower naturalness and habitat quality, represent low-value areas. WY in the YRB shows an increasing trend from the northwest to the southeast.
From 2010 to 2020, FP displayed an upward trend, with a growth rate of approximately 24.9%. The average FP in the basin were 55.61 t/km2, 55.55 t/km2, and 69.46 t/km2 in 2010, 2015, and 2020, respectively (Figure S3). The average WY in the basin increased from 138.94 mm in 2010 to 170.03 mm in 2020, reflecting a growth rate of 22.4%. The average SC in 2010 was 80,000 t/hm2, 79,274 t/hm2 in 2015, and 89,600 t/hm2 in 2020. SC showed an improvement trend from 2010 to 2020, with an overall increase of 11.2%. Additionally, LA increased by 1.1% over the same period, with LA values of 28.145, 28.432 and 28.443 in 2010, 2015, and 2020, respectively.

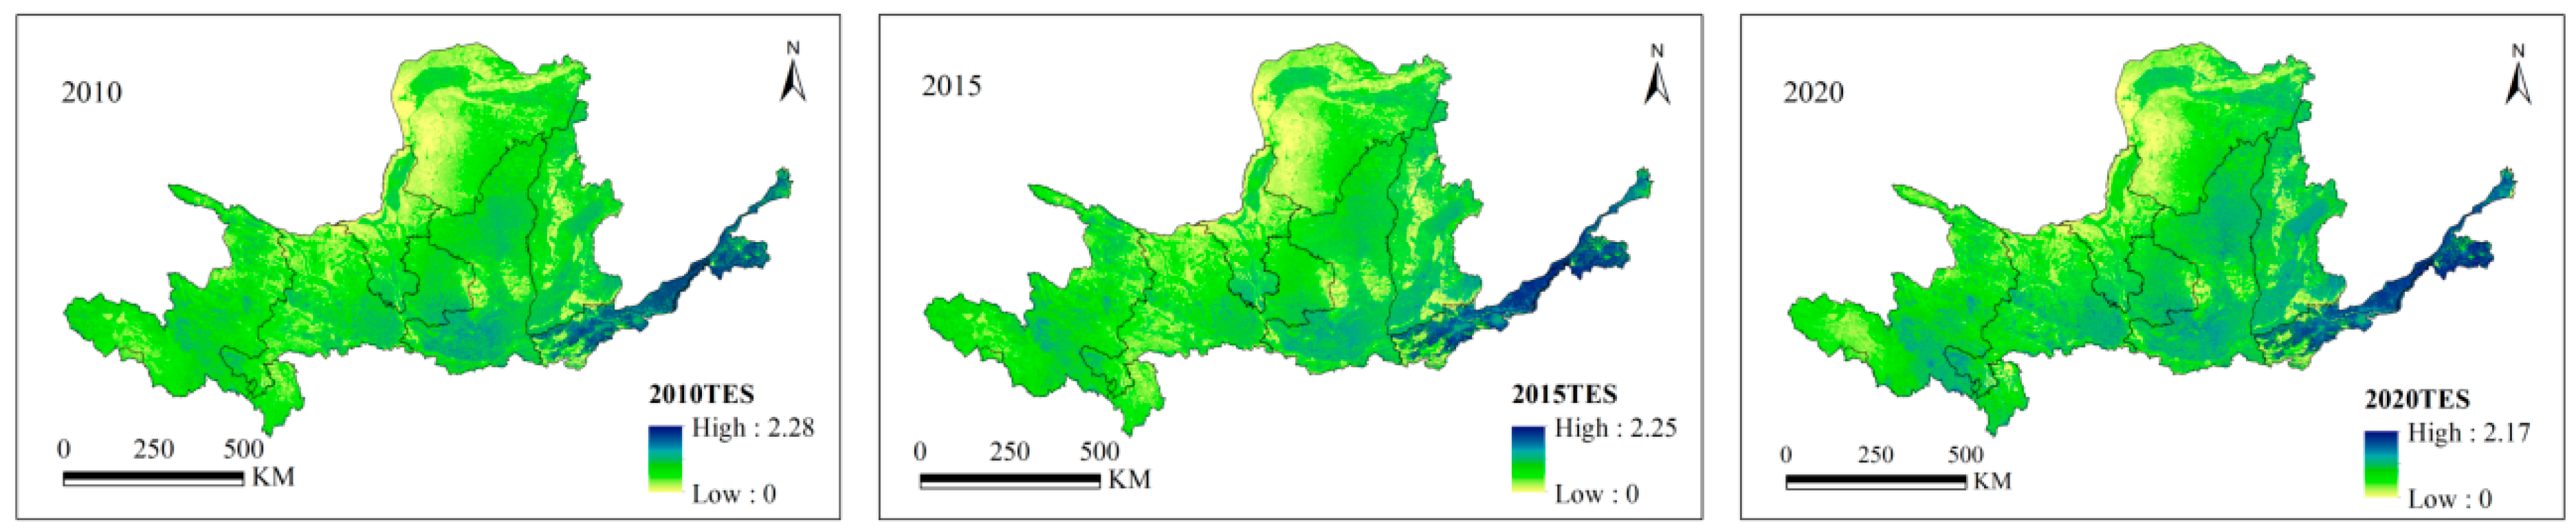
3.4. Spatio-Temporal Change Patterns of TES

TES comprehensively reflects an ecosystem’s capacity to provide services and is a priority indicator for government and management decision-making. After calculating all standardized ESs, the distribution pattern of TES is depicted in Figure 6. Across three different time scales, TES exhibits a similar spatial distribution, with values increasing from the northwest regions (Gansu and Ningxia) to the southeast regions (Shandong, Henan, and Shanxi). High-value areas are predominantly found in downstream regions such as Henan and Shandong, while low-value areas are concentrated in Ordos and its surrounding counties in the Inner Mongolia Autonomous Region. From 2010 to 2020, TES demonstrated an upward trend, rising from 0.59 to 0.61.

3.5. Relationships between FVC and ESs

A constraint line analysis was performed to examine the relationship between FVC and various ESs, with specific results illustrated in Figure 7. The constraint line between FP and FVC forms a positive convex curve, with the R2 of the fitting curve exceeding 80% in all three years, indicating a strong fit. This positive convex curve, lacking a maximum value, suggests that FP increases as FVC increases. From 2010 to 2020, both FVC and FP exhibited an upward trend. The constraint line between FVC and WY is represented by a hump-shaped curve. When FVC is around 80% in all three years, WY reaches its maximum value, indicating that WY increases with FVC up to 80% and decreases beyond that point. The maximum value of the WY and FVC constraint lines in 2020 was approximately 750 mm. The constraint line between FVC and LA is also a hump-shaped curve, with the R2 value ranging from 0.3 to 0.4 across the three years. LA reaches its peak when FVC is around 60%, increasing with FVC up to this point and decreasing thereafter. The peak values of the FVC and LA fitting curves showed minimal changes over the three years. The fitting curve for SC and FVC is another hump-shaped curve. with SC peaking when FVC is around 80%; beyond this value, SC decreases as FVC increases.

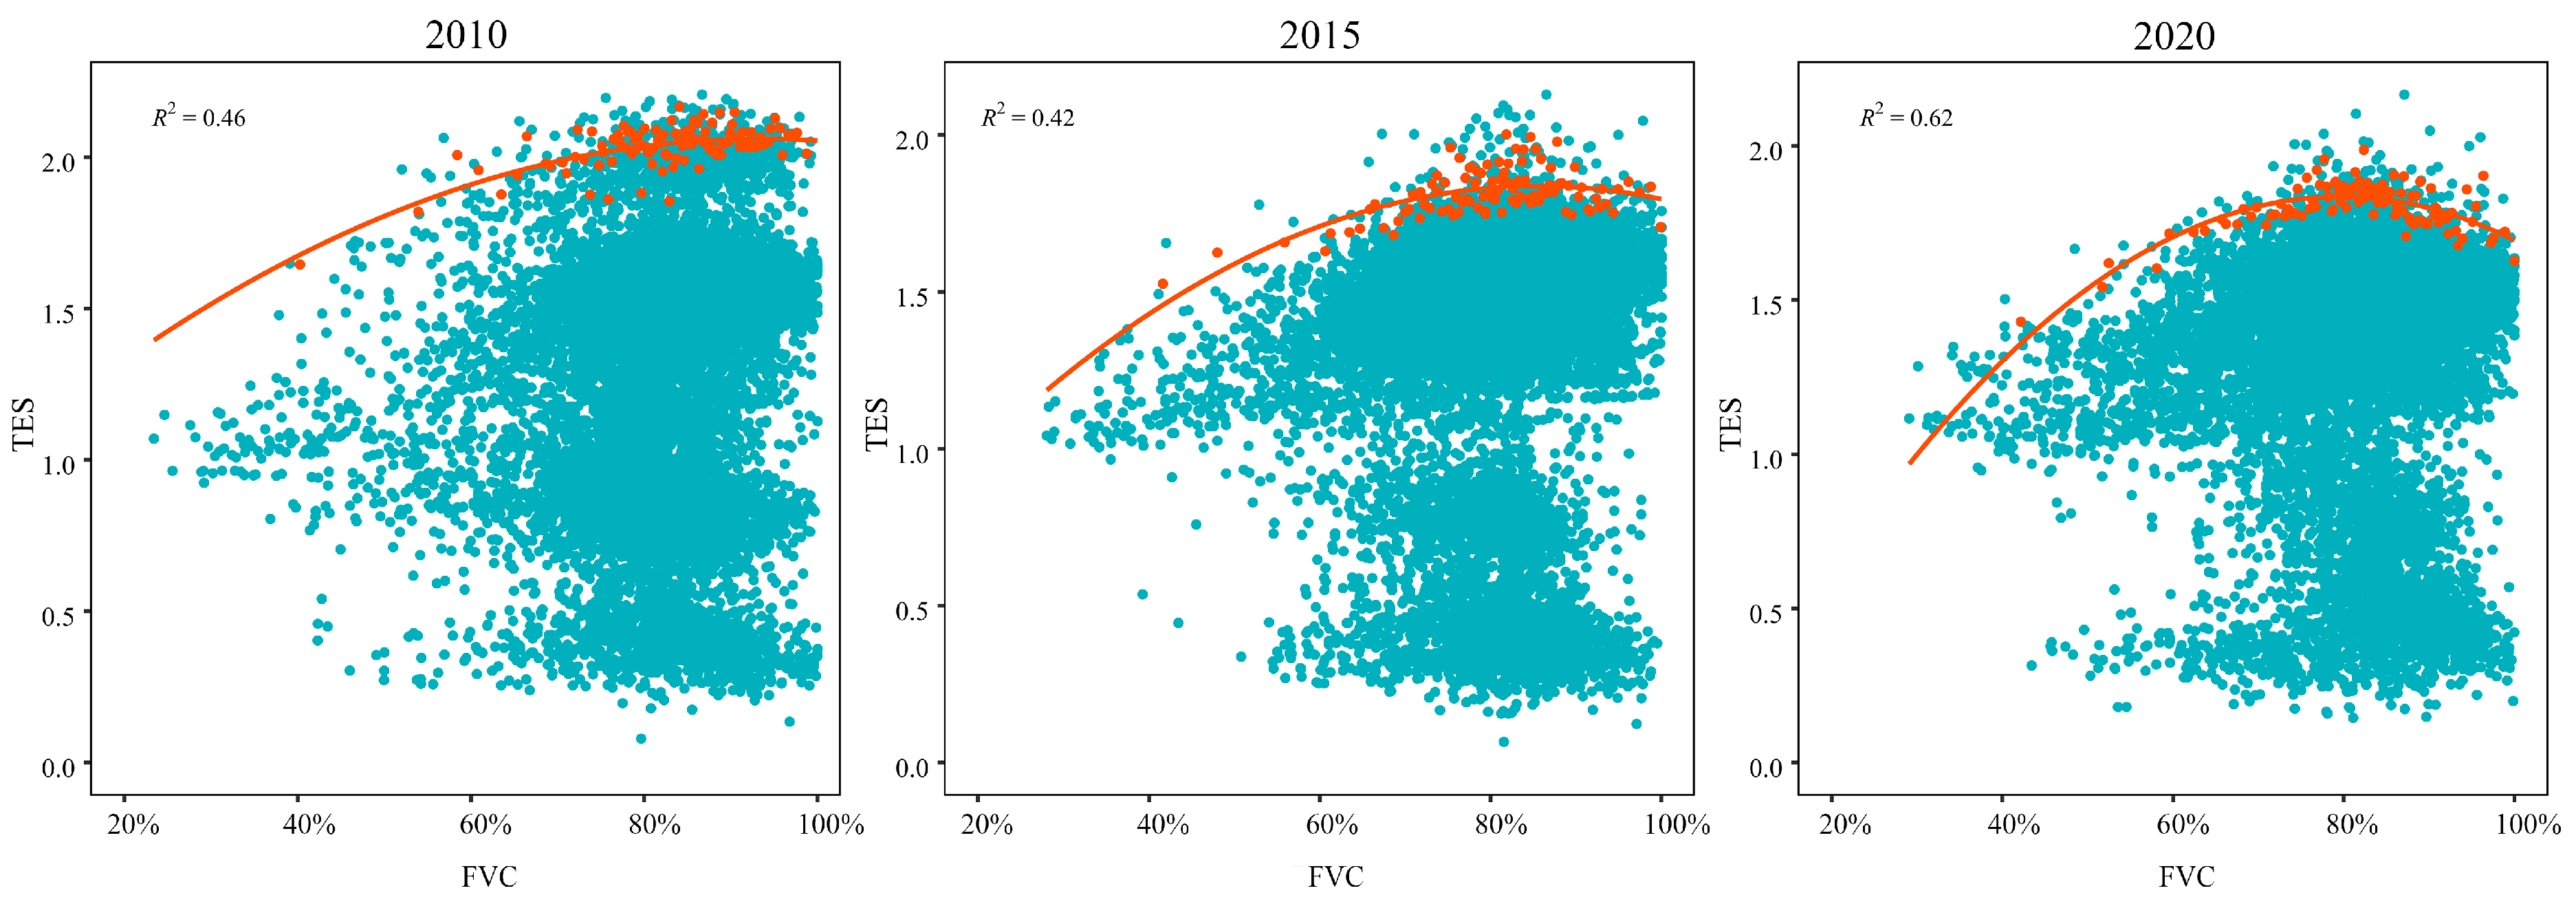
3.6. Relationship between FVC and TES

The nonlinear fitting curve between FVC and TES is illustrated in Figure 8. The fitting curves are hump-shaped, with the R2 values ranging from 0.4 to 0.6. Between 2010 and 2020, the maximum value of the constraint line was close to 2.0, occurring at an FVC of around 80%. When the FVC value is below 80%, TES increases with FVC. At an FVC of around 80%, TES reaches its peak value, after which TES gradually decreases as FVC continues to rise. This indicates that when FVC exceeds 80%, its constraint effect on TES becomes more pronounced.

4. Discussion

4.1. Vegetation Cover Change and ESs Trends

This study primarily examines the trends in FVC and ESs within the YRB and investigates the impact of FVC on ESs using data spanning the period from 2010 to 2020. Although earlier research has addressed the role of vegetation enhancement in boosting ESs, the restrictive effects of FVC on different ESs remains a subject requiring further exploration. Our findings indicate that from 2010 to 2020, FVC in most areas of the YRB exhibited an upward trend, with some regions showing highly significant increases. This is largely due to the expansion of forest and grass land areas (Table 3, Figure S2), driven by numerous large-scale ecological restoration projects in China since the 21st century, and especially between 2015 and 2020, which have increased the area covered by vegetation in China, altered land use proportions (Table S2), improved the ecological environment, and enhanced the supply capacity of certain ESs (Figure 2 and Figure 3) [34,38,39]. Jiang et al. [36] and Tian et al. [40] support these findings, indicating that global warming and increased human activities have led to the significant greening of vegetation in China.
However, an increase in FVC does not necessarily correspond to a uniform rise across all ESs. Our results indicate that while FP, LA, and SC have shown growth, WY has declined. This reduction may be due to the substantial impact of vegetation interception on WY. Vegetation can intercept precipitation through the canopy and understory litter, reducing WY. Additionally, a higher FVC results in increased regional transpiration, leading to decreased regional WY [41,42]. Moreover, extreme weather events driven by climate change and varying precipitation can cause fluctuations in WY [43]. It is also important to note that the enhancement of other ESs is not solely the result of increased FVC. For instance, improvements in germplasm resources, fertilizer application, and advancements in planting techniques significantly contribute to the increased unit yield of agricultural products, subsequently boosting FP [44].

4.2. Restraint Effect of FVC on ESs

ESs are influenced not only by vegetation cover but also by factors such as climate and human activities. Thus, the relationships between ESs and vegetation are complex and not simply linear. Our findings suggest that, with the exception of FP, there exist thresholds between FVC and other services like WY, LA, SC, and TES, indicating a constraint effect of FVC on these ESs. The fitting curves of WY, LA, and SC peak when FVC is around 80%. When FVC surpasses this point, it exerts a strong constraining impact on these ESs. Additionally, after standardizing the four ESs studied, we derived TES and examined its constraint relationship with FVC. The analysis shows an increasing trend in TES in the YRB from 2010 to 2020. Utilizing the constraint line approach, we explored how FVC limits TES. The results indicate that the constraint curve of FVC on TES in the YRB is hump-shaped, with a fit range of 0.4 to 0.6, and a maximum TES value around 2.0 corresponding to an FVC of approximately 80%. Below this threshold, TES rises with FVC, but above it, FVC constrains TES, causing a decrease. This phenomenon may be attributed to the limited capacity of vegetation to enhance ecosystem services. Vegetation, for instance, can intercept rainfall through its canopy and forest floor litter, which reduces surface runoff, promotes water infiltration, and increases water yield. However, an increase in vegetation cover also elevates regional evapotranspiration, leading to a decline in water production [41]. Between 2010 and 2020, the upper limit of the FP and FVC constraint line has risen annually, largely due to advancements in planting techniques and management practices. These human interventions have alleviated the restrictive effect of vegetation on FP, resulting in a steady increase in grain yield per mu in China. This study aligns with findings from Yu et al. [45] and Zhao et al. [28], where Yu explored the link between ESs and vegetation in the Qinling Mountains, identifying a 65.4% FVC threshold for ESs, noting a rapid growth rate of TES up to 57% FVC, after which growth slows. Zhao’s [28] research highlighted how ecological restoration increased NDVI and TES on the Tibetan Plateau, establishing that vegetation shifts influenced NDVI and TES, particularly in relation to water yield and wind erosion prevention. Unlike previous studies, our findings suggest that although FVC improved from 2010 to 2020, the TES threshold did not rise significantly and may have even declined, potentially due to expanded forest areas without corresponding improvements in vegetation quality. This suggests that, although FVC in the YRB increased from 2010 to 2020, the threshold value for TES did not show a significant rise. This phenomenon may be attributed to the fact that afforestation efforts have expanded the forested area within the basin, but have not substantially enhanced the quality of the vegetation [46,47,48].

4.3. Limitations of This Study

First of all, in terms of time, this paper only studies the changes between FVC and ESs during the decade from 2010 to 2020 and the relationship between them, but this study does not conduct a longer time scale investigation. In addition, the constraining effect of vegetation on ESs is also affected by vegetation quality, the climate, and human activities [25,49], but in this paper, the limiting effect of FVC on ESs is mainly considered. In future studies, long-term dynamic assessments of this region and more comprehensive ES indicators should be selected to evaluate the relationships between vegetation and ESs.

5. Conclusions

This paper quantified the spatio-temporal changes in four ESs and FVC from 2010 to 2020, and investigated the limiting effects between FVC and each ES. Our results are as follows. (1) From 2010 to 2020, FP, SC, LA, and TES all demonstrated an upward trend, while WY exhibited a downward trend. (2) A constraining relationship exists between FVC and WY, SC, LA, and TES in the YRB, characterized by a hump-shaped constraint line. (3) The threshold of the constraint line between FVC and WY, SC, LA, and TES is approximately 80%. Below this threshold, FVC does not exert a constraint effect on these ESs. However, when FVC exceeds 80%, a strong constraining effect is observed, causing WY, SC, LA, and TES to decrease as FVC continues to rise.

Supplementary Materials

The following supporting information can be downloaded at: https://www.mdpi.com/article/10.3390/f15101771/s1, Figure S1: Change trend in vegetation cover in the YRB from 2010 to 2020; Figure S2: Land use transfer types from 2010 to 2020; Figure S3: Average rate of change in ESs, 2010–2020; Table S1: Indicators, weights, and spatial treatment used to measure landscape aesthetics; Table S2: Land use type conversion statistics from 2010 to 2020. References [50,51,52,53,54,55,56,57,58] are cited in Supplementary.

Author Contributions

Conceptualization, J.G.; data curation, J.G., Z.M., C.H. and L.H.; formal analysis, J.G. and Z.M.; methodology, J.G. and Z.M.; software, J.G.; writing—original draft, J.G.; writing—review and editing, J.G.; visualization, J.G.; supervision, J.L.; project administration, J.L.; funding acquisition, J.L. All authors have read and agreed to the published version of the manuscript.

Funding

This study was supported by the National Key Research and Development Program of China (No. 2023YFD2200405).

Data Availability Statement

All relevant data are within the manuscript and Supplementary Materials.

Conflicts of Interest

The authors declare that they have no known competing financial interests or personal relationships that could have appeared to influence the work reported in this paper.

References

  1. Costanza, R.; d’Arge, R.; de Groot, R.; Farber, S.; Grasso, M.; Hannon, B.; Limburg, K.; Naeem, S.; O’Neill, R.V.; Paruelo, J.; et al. The value of the world’s ecosystem services and natural capital. Nature 1997, 387, 253–260. [Google Scholar] [CrossRef]
  2. Daily, G.C. Nature’s Services: Societal Dependence on Natural Ecosystems (1997). In The Future of Nature; Robin, L., Sörlin, S., Warde, P., Eds.; Yale University Press: New Haven, CT, USA, 2013; pp. 454–464. [Google Scholar] [CrossRef]
  3. Millennium Ecosystem Assessment (Program) (Ed.) Ecosystems and Human Well-Being: Synthesis; Island Press: Washington, DC, USA, 2005. [Google Scholar]
  4. Scholes, R.; Reyers, B.; Biggs, R.; Spierenburg, M.; Duriappah, A. Multi-scale and cross-scale assessments of social–ecological systems and their ecosystem services. Curr. Opin. Environ. Sustain. 2013, 5, 16–25. [Google Scholar] [CrossRef]
  5. Gomes, E.; Inácio, M.; Bogdzevič, K.; Kalinauskas, M.; Karnauskaitė, D.; Pereira, P. Future land-use changes and its impacts on terrestrial ecosystem services: A review. Sci. Total Environ. 2021, 781, 146716. [Google Scholar] [CrossRef]
  6. Nolan, C.; Overpeck, J.T.; Allen, J.R.M.; Anderson, P.M.; Betancourt, J.L.; Binney, H.A.; Brewer, S.; Bush, M.B.; Chase, B.M.; Cheddadi, R.; et al. Past and future global transformation of terrestrial ecosystems under climate change. Science 2018, 361, 920–923. [Google Scholar] [CrossRef]
  7. Gao, J.; Zuo, L. Revealing ecosystem services relationships and their driving factors for five basins of Beijing. J. Geogr. Sci. 2021, 31, 111–129. [Google Scholar] [CrossRef]
  8. Shen, J.; Li, S.; Liang, Z.; Liu, L.; Li, D.; Wu, S. Exploring the heterogeneity and nonlinearity of trade-offs and synergies among ecosystem services bundles in the Beijing-Tianjin-Hebei urban agglomeration. Ecosyst. Serv. 2020, 43, 101103. [Google Scholar] [CrossRef]
  9. Wang, L.; Zheng, H.; Wen, Z.; Liu, L.; Robinson, B.E.; Li, R.; Li, C.; Kong, L. Ecosystem service synergies/trade-offs informing the supply-demand match of ecosystem services: Framework and application. Ecosyst. Serv. 2019, 37, 100939. [Google Scholar] [CrossRef]
  10. Li, C.; Zhang, S.; Cui, M.; Wan, J.; Rao, T.; Li, W.; Wang, X. Improved Vegetation Ecological Quality of the Three-North Shelterbelt Project region of China during 2000–2020 as evidenced from multiple remotely sensed indicators. Remote Sens. 2022, 14, 5708. [Google Scholar] [CrossRef]
  11. Celentano, D.; Moraes, M.; Ferreira, J.; Nahur, A.; Coutinho, B.; Rousseau, G.X.; Martins, M.B.; Vasconcelos, L.G.T.R.; Rodrigues, F.; Freire, R.; et al. Forest restoration to promote a fair post COVID-19 recovery in the Brazilian Amazon. Land Use Policy 2022, 116, 106076. [Google Scholar] [CrossRef]
  12. Reis, B.P.; Kövendi-Jakó, A.; Csákvári, E.; Szitár, K.; Török, K.; Sáradi, N.; Llumiquinga, Y.B.; Halassy, M. Early Sowing Is More Effective in the long-term for restoring sandy grassland than six years of mowing or carbon amendment. Ecol. Eng. 2023, 186, 106824. [Google Scholar] [CrossRef]
  13. Feng, X.; Fu, B.; Piao, S.; Wang, S.; Ciais, P.; Zeng, Z.; Lü, Y.; Zeng, Y.; Li, Y.; Jiang, X.; et al. Revegetation in China’s Loess Plateau is approaching sustainable water resource limits. Nat. Clim. Chang. 2016, 6, 1019–1022. [Google Scholar] [CrossRef]
  14. Song, W.; Feng, Y.; Wang, Z. Ecological restoration programs dominate vegetation greening in China. Sci. Total Environ. 2022, 848, 157729. [Google Scholar] [CrossRef]
  15. Deng, Y.; Jia, L.; Guo, Y.; Li, H.; Yao, S.; Chu, L.; Lu, W.; Hou, M.; Mo, B.; Wang, Y.; et al. Evaluation of the ecological effects of ecological restoration programs: A case study of the sloping land conversion program on the Loess Plateau, China. Int. J. Environ. Res. Public Health 2022, 19, 7841. [Google Scholar] [CrossRef]
  16. Wang, J.; Peng, J.; Zhao, M.; Liu, Y.; Chen, Y. Significant trade-off for the impact of Grain-for-Green Programme on ecosystem services in North-Western Yunnan, China. Sci. Total Environ. 2017, 574, 57–64. [Google Scholar] [CrossRef]
  17. Pröbstl-Haider, U. Cultural ecosystem services and their effects on human health and well-being—A cross-disciplinary methodological review. J. Outdoor Recreat. Tour. 2015, 10, 1–13. [Google Scholar] [CrossRef]
  18. Quintas-Soriano, C.; Castro, A.J.; Castro, H.; García-Llorente, M. Impacts of land use change on ecosystem services and implications for human well-being in Spanish drylands. Land Use Policy 2016, 54, 534–548. [Google Scholar] [CrossRef]
  19. Núñez-Regueiro, M.M.; Fletcher, R.J.; Pienaar, E.F.; Branch, L.C.; Volante, J.N.; Rifai, S. Adding the temporal dimension to spatial patterns of payment for ecosystem services enrollment. Ecosyst. Serv. 2019, 36, 100906. [Google Scholar] [CrossRef]
  20. Wei, H.; Fan, W.; Wang, X.; Lu, N.; Dong, X.; Zhao, Y.; Ya, X.; Zhao, Y. Integrating supply and social demand in ecosystem services assessment: A review. Ecosyst. Serv. 2017, 25, 15–27. [Google Scholar] [CrossRef]
  21. Jopke, C.; Kreyling, J.; Maes, J.; Koellner, T. Interactions among ecosystem services across europe: Bagplots and cumulative correlation coefficients reveal synergies, trade-offs, and regional patterns. Ecol. Indic. 2015, 49, 46–52. [Google Scholar] [CrossRef]
  22. Horning, S.; Leung, P.; Fitzgerald, A.; Mrad, N. Operational readiness simulator: Optimizing operational availability using a virtual environment. Int. J. Aerosp. Eng. 2012, 2012, 425075. [Google Scholar] [CrossRef]
  23. Jiang, C.; Wang, X.; Zhang, H.; Labzovskii, L.; Wang, J.; Liu, T. Re-orienting ecological restoration in degraded drylands for a more sustainable soil–water relationship: Non-linear boundary of limited water resources in combating soil loss. J. Arid Environ. 2019, 167, 87–100. [Google Scholar] [CrossRef]
  24. Li, S.; Li, X.; Dou, H.; Dang, D.; Gong, J. Integrating constraint effects among ecosystem services and drivers on seasonal scales into management practices. Ecol. Indic. 2021, 125, 107425. [Google Scholar] [CrossRef]
  25. Liu, R.; Dong, X.; Wang, X.; Zhang, P.; Liu, M.; Zhang, Y. Study on the relationship among the urbanization process, ecosystem services and human well-being in an arid region in the context of carbon flow: Taking the Manas River Basin as an example. Ecol. Indic. 2021, 132, 108248. [Google Scholar] [CrossRef]
  26. Wang, N.; Jassogne, L.; van Asten, P.J.A.; Mukasa, D.; Wanyama, I.; Kagezi, G.; Giller, K.E. Evaluating coffee yield gaps and important biotic, abiotic, and management factors limiting coffee production in Uganda. Eur. J. Agron. 2015, 63, 1–11. [Google Scholar] [CrossRef]
  27. Wang, T.; Feng, L.; Mou, P.; Wu, J.; Smith, J.L.D.; Xiao, W.; Yang, H.; Dou, H.; Zhao, X.; Cheng, Y.; et al. Amur tigers and leopards returning to China: Direct evidence and a landscape conservation plan. Landsc. Ecol. 2016, 31, 491–503. [Google Scholar] [CrossRef]
  28. Zhao, Z.; Dai, E. Vegetation cover dynamics and its constraint effect on ecosystem services on the Qinghai-Tibet Plateau under ecological restoration projects. J. Environ. Manag. 2024, 356, 120535. [Google Scholar] [CrossRef]
  29. Gao, C.; Zhao, J.; Wang, Y.; Jin, G.; Wang, J.; Hu, X. Study on the constraint effect of natural vegetation on ecosystem services in the Shiyang River Basin. Acta Ecol. Sin. 2019, 40, 2851–2862. [Google Scholar]
  30. Li, J.; Sun, W.; Li, M.; Meng, L. Coupling coordination degree of production, living and ecological spaces and its influencing factors in the Yellow River Basin. J. Clean. Prod. 2021, 298, 126803. [Google Scholar] [CrossRef]
  31. Shao, Y.; Liu, Y.; Li, Y.; Yuan, X. Regional ecosystem services relationships and their potential driving factors in the Yellow River Basin, China. J. Geogr. Sci. 2023, 33, 863–884. [Google Scholar] [CrossRef]
  32. Omer, A.; Elagib, N.A.; Ma, Z.; Saleem, F.; Mohammed, A. Water scarcity in the Yellow River Basin under future climate change and human activities. Sci. Total Environ. 2020, 749, 141446. [Google Scholar] [CrossRef]
  33. Fang, L.; Wang, L.; Chen, W.; Sun, J.; Cao, Q.; Wang, S.; Wang, L. Identifying the impacts of natural and human factors on ecosystem service in the Yangtze and Yellow River Basins. J. Clean. Prod. 2021, 314, 127995. [Google Scholar] [CrossRef]
  34. Yang, L.; Jia, K.; Liang, S.; Liu, M.; Wei, X.; Yao, Y.; Zhang, X.; Liu, D. Spatio-temporal analysis and uncertainty of fractional vegetation cover change over Northern China during 2001–2012 based on multiple vegetation data sets. Remote Sens. 2018, 10, 549. [Google Scholar] [CrossRef]
  35. Fensholt, R.; Langanke, T.; Rasmussen, K.; Reenberg, A.; Prince, S.D.; Tucker, C.; Scholes, R.J.; Le, Q.B.; Bondeau, A.; Eastman, R.; et al. Greenness in Semi-Arid areas across the globe 1981–2007—An earth observing satellite based analysis of trends and drivers. Remote Sens. Environ. 2012, 121, 144–158. [Google Scholar] [CrossRef]
  36. Jiang, W.; Yuan, L.; Wang, W.; Cao, R.; Zhang, Y.; Shen, W. Spatio-temporal analysis of vegetation variation in the Yellow River Basin. Ecol. Indic. 2015, 51, 117–126. [Google Scholar] [CrossRef]
  37. Medinski, T.V.; Mills, A.J.; Esler, K.J.; Schmiedel, U.; Jürgens, N. Do soil properties constrain species richness? insights from boundary line analysis across several biomes in South Western Africa. J. Arid Environ. 2010, 74, 1052–1060. [Google Scholar] [CrossRef]
  38. Hua, W.; Chen, H.; Zhou, L.; Xie, Z.; Qin, M.; Li, X.; Ma, H.; Huang, Q.; Sun, S. Observational quantification of climatic and human influences on vegetation greening in China. Remote Sens. 2017, 9, 425. [Google Scholar] [CrossRef]
  39. Cai, Y.; Zhang, F.; Duan, P.; Yung Jim, C.; Weng Chan, N.; Shi, J.; Liu, C.; Wang, J.; Bahtebay, J.; Ma, X. Vegetation cover changes in China induced by Ecological Restoration-Protection Projects and land-use changes from 2000 to 2020. Catena 2022, 217, 106530. [Google Scholar] [CrossRef]
  40. Tian, F.; Liu, L.-Z.; Yang, J.-H.; Wu, J.-J. Vegetation greening in more than 94% of the Yellow River Basin (YRB) region in China during the 21st century caused jointly by warming and anthropogenic activities. Ecol. Indic. 2021, 125, 107479. [Google Scholar] [CrossRef]
  41. Luo, Y.; Lü, Y.; Fu, B.; Zhang, Q.; Li, T.; Hu, W.; Comber, A. Half century change of interactions among ecosystem services driven by ecological restoration: Quantification and policy implications at a watershed scale in the Chinese Loess Plateau. Sci. Total Environ. 2019, 651, 2546–2557. [Google Scholar] [CrossRef]
  42. Ma, Z.; Gong, J.; Hu, C.; Lei, J. An integrated approach to assess spatial and temporal changes in the contribution of the ecosystem to Sustainable Development Goals over 20 years in China. Sci. Total Environ. 2023, 903, 166237. [Google Scholar] [CrossRef]
  43. Wang, P.; Xu, M. Dynamics and interactions of water-related ecosystem services in the Yellow River Basin, China. J. Geogr. Sci. 2023, 33, 1681–1701. [Google Scholar] [CrossRef]
  44. Holt, A.R.; Alix, A.; Thompson, A.; Maltby, L. Food Production, Ecosystem services and biodiversity: We can’t have it all everywhere. Sci. Total Environ. 2016, 573, 1422–1429. [Google Scholar] [CrossRef]
  45. Yu, F.; Li, C.; Yuan, Z.; Luo, Y.; Yin, Q.; Wang, Q.; Hao, Z. How do mountain ecosystem services respond to changes in vegetation and climate? An evidence from the Qinling Mountains, China. Ecol. Indic. 2023, 154, 110922. [Google Scholar] [CrossRef]
  46. Wang, L.; Gao, J.; Shen, W.; Cai, M.; Chen, Y.; Xiao, T.; Zhang, X.; Tai, W. Vegetation quality and its change in the Three North Shelterbelt Forest region in China. Arid Land Res. Manag. 2024, 38, 285–298. [Google Scholar] [CrossRef]
  47. Jiang, L.; Liu, Y.; Xu, H. Variation in vegetation quality of terrestrial ecosystems in China: Coupling analysis based on remote sensing and typical stations monitoring data. Remote Sens. 2023, 15, 2276. [Google Scholar] [CrossRef]
  48. Zhou, Z.; Ding, Y.; Shi, H.; Cai, H.; Fu, Q.; Liu, S.; Li, T. Analysis and prediction of vegetation dynamic changes in China: Past, present and future. Ecol. Indic. 2020, 117, 106642. [Google Scholar] [CrossRef]
  49. Mendoza-Ponce, A.; Corona-Núñez, R.; Kraxner, F.; Leduc, S.; Patrizio, P. Identifying effects of land use Cover Changes and Climate Change on Terrestrial Ecosystems and Carbon Stocks in Mexico. Glob. Environ. Chang. 2018, 53, 12–23. [Google Scholar] [CrossRef]
  50. Dabney, S.M.; Yoder, D.C.; Vieira DA, N. The application of the revised universal soil loss equation, version 2, to evaluate the impacts of alternative climate change scenarios on runoff and sediment yield. J. Soil Water Conserv. 2012, 67, 343–353. [Google Scholar] [CrossRef]
  51. Xiao, Q.; Hu, D.; Xiao, Y. Assessing changes in soil conservation ecosystem services and causal factors in the Three Gorges Reservoir Region of China. J. Clean Prod. 2017, 163, S172–S180. [Google Scholar] [CrossRef]
  52. Xiang, H.; Wang, Z.; Mao, D.; Zhang, J.; Xi, Y.; Du, B.; Zhang, B. What did china’s national wetland conservation program achieve? Observations of changes in land cover and ecosystem services in the Sanjiang Plain. J. Environ. Manag. 2020, 267, 110623. [Google Scholar] [CrossRef]
  53. Zhang, L.; Hickel, K.; Dawes, W.R.; Chiew FH, S.; Western, A.W.; Briggs, P.R. A rational function approach for estimating mean annual evapotranspiration. Water Resour. Res. 2004, 40, W0250. [Google Scholar] [CrossRef]
  54. Lu, J.; Sun, G.; McNulty, S.G.; Amatya, D.M. A comparison of six potential evapotranspiration methods for regional use in the Southeastern united states. J. Am. Water Resour. Assoc. 2005, 41, 621–633. [Google Scholar] [CrossRef]
  55. Langemeyer, J.; Calcagni, F.; Baró, F. Mapping the intangible: Using geolocated social media data to examine landscape aesthetics. Land Use Policy 2018, 77, 542–552. [Google Scholar] [CrossRef]
  56. Frank, S.; Fürst, C.; Koschke, L.; Witt, A.; Makeschin, F. Assessment of landscape aesthetics—Validation of a landscape metrics-based assessment by visual estimation of the scenic beauty. Ecol. Indic. 2013, 32, 222–231. [Google Scholar] [CrossRef]
  57. Ode, A.; Fry, G.; Tveit, M.S.; Messager, P.; Miller, D. Indicators of perceived naturalness as drivers of landscape preference. J. Environ. Manag. 2009, 90, 375–383. [Google Scholar] [CrossRef]
  58. Lyu, R.; Clarke, K.C.; Zhang, J.; Feng, J.; Jia, X.; Li, J. Spatial correlations among ecosystem services and their socio-ecological driving factors: A case study in the city belt along the Yellow River in Ningxia, China. Appl. Geogr. 2019, 108, 64–73. [Google Scholar] [CrossRef]
Figure 1. Study area location.
Forests 15 01771 g001
Figure 2. Spatio-temporal changes in land use.
Forests 15 01771 g002
Figure 3. Spatio-temporal and spatial changes in the FVC.
Forests 15 01771 g003
Figure 4. Trend in change in FVC.
Forests 15 01771 g004
Figure 5. Spatio-temporal distributions of ESs in the YRB from 2010 to 2020.
Forests 15 01771 g005
Figure 6. Spatio-temporal variation in TES in the YRB.
Forests 15 01771 g006
Figure 7. Constraints between FVC and ESs from 2010 to 2020. Blue points represent scatter points, red points represent boundary points, and constraint lines (red) represent FVC indicators’ constraint effects on ESs.
Forests 15 01771 g007
Figure 8. Constraint line between FVC and TES. Blue points represent scatter points, red points represent boundary points, and constraint lines (red) represent FVC indicators’ constraint effects on TES.
Forests 15 01771 g008
Table 1. Data sources and resolutions.
DataYearsData SourcesResolutionRelated Website
NDVI2010, 2015, 2020Resource Environmental Science and Data Center1 kmhttp://www.resdc.cn/, accessed on 26 November 2023
Precipitation2010, 2015, 2020National Qinghai-Tibet Plateau Scientific Data Center platform1 kmhttp://data.tpdc.ac.cn/, accessed on 26 November 2023
Land Use2010, 2015, 2020Resource Environmental Science and Data Center1 kmhttp://www.resdc.cn/, accessed on 26 November 2023
Evapotranspiration2010, 2015, 2020National Qinghai-Tibet Plateau Scientific Data Center platform1 kmhttp://data.tpdc.ac.cn/, accessed on 26 November 2023
Soil Date-Resource Environmental Science and Data Center1 kmhttp://www.resdc.cn/, accessed on 26 November 2023
Food Production2010, 2015, 2020State Statistics Bureau1 kmhttps://www.stats.gov.cn, accessed on 26 November 2023
DEM-National Cryosphere Desert Data Center1 kmhttp://www.ncdc.ac.cn/portal/, accessed on 26 November 2023
Temperature2010, 2015, 2020Resource Environmental Science and Data Center1 kmhttp://www.resdc.cn/, accessed on 26 November 2023
Table 2. Ecosystem services types and calculation methods.
Service CategorySupply IndicatorsAbbreviationMethodsDescription (Units)
Provisioning ServicesFood ProductionFP(kg/km2)
Regulating ServicesWater YieldWYInVEST Model (Version 3.13.0)The required parameters mainly include precipitation, soil depth, land use, potential evapotranspiration, and available water content of vegetation. (mm)
Soil ConservationSCUniversal Soil Loss Equation ModelIt can reflect the erosion and expansion ability of the ecosystem to soil loss and the storage and retention ability of sediment. (t/ha)
Cultural servicesLandscape AestheticsLAFragstats 4.2 softwareLandscape aesthetics can be evaluated by naturalness and landscape diversity. (score)
Table 3. Land use change rate from 2020 to 2010 (km2).
Land Use2010201520202020–2010 Change (km2)
Crop land214,663213,186205,744−8919
Forest land106,009106,075107,0891080
Grass land379,777378,581385,3535576
Water14,06214,40215,0891027
Construction land20,76524,55331,28910,524
Unused73,53172,01064,340−9191
Disclaimer/Publisher’s Note: The statements, opinions and data contained in all publications are solely those of the individual author(s) and contributor(s) and not of MDPI and/or the editor(s). MDPI and/or the editor(s) disclaim responsibility for any injury to people or property resulting from any ideas, methods, instructions or products referred to in the content.

