Article

Mangroves Invaded by Spartina alterniflora Loisel: A Remote Sensing-Based Comparison for Two Protected Areas in China

1
South China Sea Institute of Planning and Environment Research, State Oceanic Administration, Guangzhou 510300, China
2
Technology Innovation Center for South China Sea Remote Sensing, Surveying and Mapping Collaborative Application, Ministry of Natural Resources, Guangzhou 510300, China
3
Key Laboratory of Marine Environmental Survey Technology and Application, Guangzhou 510300, China
*
Author to whom correspondence should be addressed.
These authors contributed equally to this work.
Forests 2024, 15(10), 1788; https://doi.org/10.3390/f15101788
Submission received: 14 September 2024 / Revised: 4 October 2024 / Accepted: 8 October 2024 / Published: 11 October 2024

Abstract

:
Mangroves are one of the world’s most productive and ecologically important ecosystems, and they are threatened by the widespread invasion of Spartina alterniflora Loisel in China. As few studies have examined the spatial pattern differences of S. alterniflora invasion and the nearby mangroves in different latitudes, we chose the Zhangjiang Estuary and the Dandou Sea, two representative mangrove–salt marsh ecotones in the north and south of the Tropic of Cancer, as the study areas for comparison. The object-based image analysis and visual interpretation methods were combined to construct fine-scale mangrove and S. alterniflora maps using high-resolution satellite imagery from 2005 to 2019. We applied spatial analysis, centroid migration, and landscape indexes to analyze the spatio–temporal distribution changes of mangroves and S. alterniflora in these two ecotones over time. We used the landscape expansion index to investigate the S. alterniflora invasion process and expansion patterns. The annual change rates of mangrove and S. alterniflora areas in the Zhangjiang Estuary showed a continuous growth trend. However, the mangrove areas in the Dandou Sea showed a fluctuating trend of increasing, decreasing, and then increasing again, while S. alterniflora areas kept rising from 2005 to 2019. Spartina alterniflora showed larger annual change rates compared with mangroves, indicating rapid S. alterniflora invasion in the intertidal zones. The opposite centroid migration directions of mangroves and S. alterniflora and the decreasing distances between the mangrove and S. alterniflora centroids indirectly revealed the fierce competition between mangroves and S. alterniflora for habitat resources. Both regions saw a decrease in mangrove patch integrality and connectivity. The integrality of mangrove patches in the Zhangjiang Estuary was always higher than those in the Dandou Sea. We observed the growth stage (2011–2014) and outbreak stage (2014–2019) of S. alterniflora expansion in the Zhangjiang Estuary and the outbreak stage (2005–2009) and plateau stage (2009–2019) of S. alterniflora expansion in the Dandou Sea. The expansion pattern of S. alterniflora varies in time and place. Since the expansion of S. alterniflora in the outbreak stage is rapid, with a large annual change rate, early warning of S. alterniflora invasion is quite important for the efficient and economical removal of the invasive plant. Continuous and accurate monitoring of S. alterniflora is highly necessary and beneficial for the scientific management and sustainable development of coastal wetlands.

1. Introduction

Mangroves are woody trees or shrubs that grow mainly along sheltered coastlines within the tropic and subtropic latitudes [1]. As one of the world’s most productive ecosystems, mangroves play crucial roles in protecting and stabilizing coastlines [1,2,3,4,5], providing feeding habitat for animals [6,7], maintaining ecological stability and biodiversity [8,9,10], mitigating global warming [11], etc. Despite having high ecological and socio-economic values, mangroves are being deforested or degraded [12] due to rapid agriculture reclamation, urban development, aquaculture encroachment, invasive plants, and other stresses caused by climate changes and human disturbances [13,14,15,16,17]. The protection and restoration of mangroves have attracted much attention [18,19,20]. Since the 1980s, significant efforts have been made to protect and manage mangroves [21,22]. The Chinese government has allocated enormous amounts of funds for mangrove restoration [23] and established many nature reserves to resist the impact of human activities on the environment for mangrove conservation [24].
Spartina alterniflora Loisel, the only coastal salt marsh species among the sixteen most serious invasive alien species listed by the State Environmental Protection Administration of China in 2003 [25], poses tremendous threats to the native biodiversity of mangrove ecosystems in China [21]. Its strong adaptability and reproductive capacity have enabled S. alterniflora to spread widely across Chinese coastal wetlands [26,27] and encroach on many nature reserves [28,29]. Researchers found that S. alterniflora invasion threatened the survival and breeding of mangroves [17], and mangroves are vulnerable to continuous S. alterniflora invasion, which results in the loss of ecological functions and services [30,31]. Prior research primarily focused on the mechanisms of how S. alterniflora invasion impacted mangroves at microscopic scales, such as the diversity and composition of sediment diazotrophic communities in different habitats and ecosystems’ physical and chemical responses [32,33]. The spatial pattern differences of S. alterniflora invasion and its nearby mangrove distributions in different latitudes have been less studied.
Mangroves [12,21,22,34,35,36,37,38,39,40,41] and S. alterniflora [26,27,42,43,44,45,46] have been monitored extensively with remote sensing due to the advantages of large geographic coverage, access to inaccessible areas, and the capability to track long-term holistic changes. For example, Giri et al. [47] created the first global mangrove map for the year 2000 with Landsat images and a hybrid classification method combining supervised and unsupervised algorithms. Chen et al. [48] mapped the mangrove distribution in China for the year 2015 with a phenology-based classification method based on Landsat 7/8 and Sentinel-1A imagery time series in Google Earth Engine. Bunting et al. [49,50] generated the first time-series database of global mangrove forests using a two-iteration mangrove mapping approach based on ALOS and Landsat images. Jia et al. [12] built a dataset of mangrove distributions in China based on Landsat imagery from 1973 to 2015, with object-based image analysis (OBIA) and classification methods. Wang et al. [51] generated annual maps of mangroves, salt marshes, and tidal flats in China with a spatial resolution of 30 m, based on Landsat images from 1984 to 2018. Using 2-m resolution Ziyuan-3 and Gaofen-1 satellite images together with field data, Zhang et al. [52] presented a mangrove map of China for 2018. Jia et al. [34] produced a global mangrove dataset at a resolution of 10 m for the year 2020, using OBIA and random forest classification based on Sentinel-2 imagery. Liu et al. [26] generated the distribution map of S. alterniflora on the basis of Landsat-8 images from 2014 to 2016 using OBIA and support vector machine methods along China’s mainland coast. Mao et al. [27] monitored S. alterniflora invasion in China from 1990 to 2015 with Landsat images. However, existing mangrove or S. alterniflora datasets were largely derived from medium spatial resolution satellite imagery, which lacked spatial details [34]. There are few studies on fine-scale, long-term, and multi-regional monitoring of mangroves and S. alterniflora simultaneously based on the same satellite datasets.
The dynamic expansion pattern research of S. alterniflora is important for the invasion mechanism study, contributing to the scientific eradication and management of S. alterniflora [53]. Previous studies mostly used multi-temporal S. alterniflora distribution maps based on remote sensing time series data to study the invasion characteristics of S. alterniflora in various regions [26,54]. Researchers used the landscape expansion index (LEI) to recognize the spatial expansion patterns of S. alterniflora [53,55,56]. To understand S. alterniflora’s invasion mechanism, Wang et al. [55] and Yan et al. [53] showed three S. alterniflora expansion patterns, which were marginal expansion, external isolated expansion, and tidal creek-leading expansion, based on patch fractal dimension and LEI in Yancheng, Jiangsu, China. Using LEI, Li [56] investigated the expansion mode of S. alterniflora in Jiuduansha, Shanghai, China. However, these studies mostly focused on one local coastal region north of Zhejiang Province, where no mangroves survive. Little research has been performed on the differences in S. alterniflora expansion modes in mangrove–salt marsh ecotones of different latitudes.
The current work aims to evaluate spatial pattern differences of S. alterniflora invasion and its nearby mangroves in different latitudes. We selected the Dandou Sea and the Zhangjiang Estuary, two representative mangrove–salt marsh ecotones in the south and north of the Tropic of Cancer, as the study area. In both regions, S. alterniflora proliferates on the tidal flats, forming monoculture or mixed communities with mangroves [57]. The rapid spread of S. alterniflora poses a significant threat to the native mangrove ecosystems [31]. Based on multi-temporal Google Earth imagery, supplemented by Landsat imagery from 2005 to 2019, we used OBIA and visual interpretation methods [28] to monitor the spatial–temporal changes of mangroves and S. alterniflora from 2005 to 2019. Then, we applied LEI to investigate the spatial expansion patterns of S. alterniflora in these two ecotones. The results of this study can illuminate the process and pattern of S. alterniflora expansion into mangroves, offering valuable references for controlling S. alterniflora expansion.

2. Materials and Methods
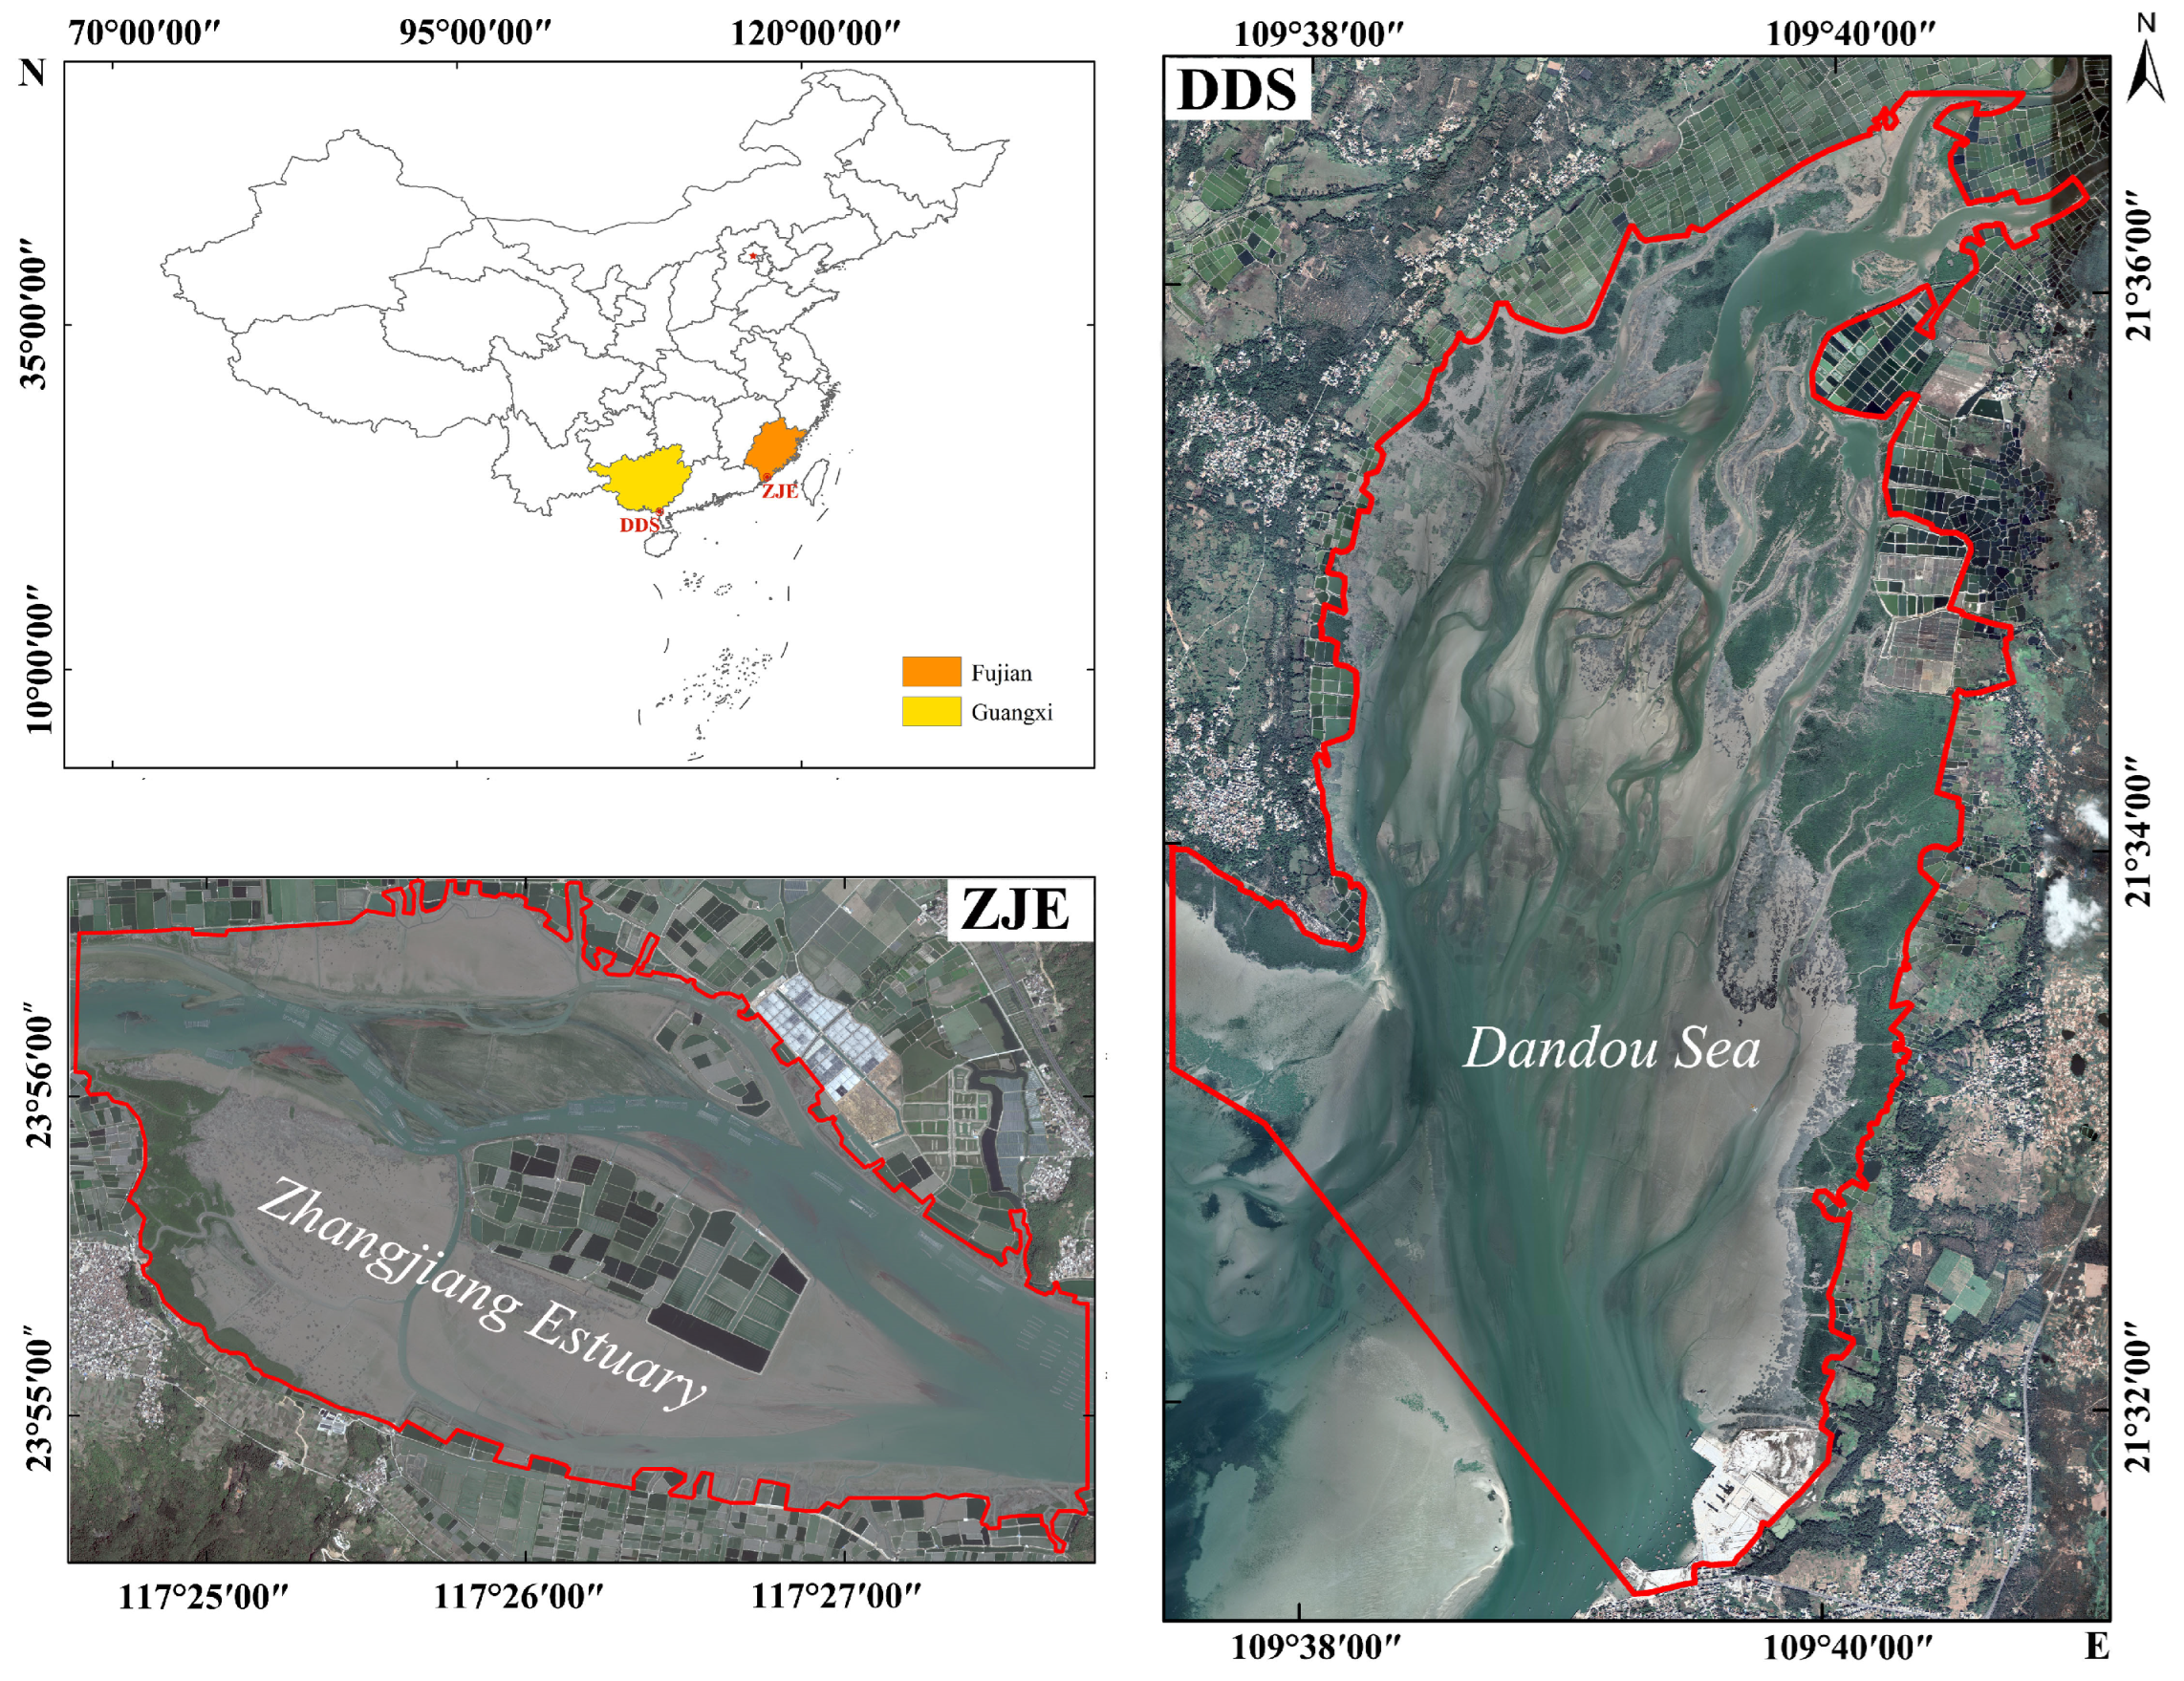
2.1. Study Area

The Zhangjiang Estuary is situated in Zhangjiangkou National Mangrove Nature Reserve (117°24′07″–117°30′00″ E, 23°53′45″–23°56′00″ N), Yunxiao County, Fujian Province (Figure 1). It owns a natural mangrove community with the most mangrove species and the best growth status in the north of the Tropic of Cancer in China. The topography shows a northwest-to-southeast descending terrain [28]. The climate is a subtropical maritime monsoon. The average annual temperature is 21.2 °C, and the average annual precipitation is 1714.5 mm [29]. Tides are irregular semi-diurnal tides, and the average tidal range is 2.32 m. Intertidal vegetation includes native mangroves (Kandelia obovate Sheue, H.Y.Liu and J.W.H.Yong, Avicennia marina (Forsk.) Vierh., Aegiceras corniculatum L. (Blanco)) and invasive S. alterniflora [58]. Spartina alterniflora has invaded and occupied the mud flats, mangrove fringes, and mangrove canopy gaps [31].
The Dandou Sea (109°38′20″ E–109°40′48″ E, 21°30′40″ N–21°36′40″ N) is home to Shankou Mangrove National Nature Reserve in Hepu County, Beihai City, Guangxi Zhuang Autonomous Region (Figure 1). Located south of the Tropic of Cancer, it has the largest patch of pure Rhizophora stylosa Griff. forest and Bruguiera gymnorrhiza (L.) Savigny forest at its climax of succession; it is an important stopover site for migratory birds and a gene pool of mangroves in China. The climate is a subtropical maritime monsoon. The average annual temperature is 22.9 °C, and the average annual precipitation is 1573.4 mm. Tides are irregular diurnal tides, and the average tidal range is 2.45 m. The dominant mangrove species are R. stylosa, B. gymnorhiza, and A. corniculatum.

2.2. Data Acquisition and Preprocessing

We collected high-resolution imagery from Google Earth 7.3.3, which offers public and free remote sensing images globally [28,59,60], from 2005 to 2019 in the two study areas (Table 1). We selected cloud-free imagery acquired during low tides in the autumn and winter seasons to ensure the accurate detection of mangroves and S. alterniflora [40]. As no cloud-free high-resolution Google Earth imagery at low tide was available in the Dandou Sea in 2005, we collected another cloud-free Landsat 5 Thematic Mapper (TM) image at low tide as a supplement. All the Google Earth images were geo-rectified, and the registration error was less than half a pixel.
Field surveys were conducted in November 2016 in the Zhangjiang Estuary and December 2019 in the Dandou Sea. Besides using a handheld GPS device (Guangzhou SOUTH Survey & Mapping Technology Co., Ltd., Guangzhou, China) to record the locations of mangroves and S. alterniflora, we mainly utilized unmanned aerial vehicles (DJI, Shenzhen, China) to collect very high spatial resolution photos to collect samples of mangroves and S. alterniflora [61]. The sample data were used to validate the accuracy of the detection results in the Zhangjiang Estuary in 2016 and the Dandou Sea in 2019.

2.3. Detection Method and Accuracy Assessment

We combined the OBIA and visual interpretation methods to detect mangroves and S. alterniflora from 2005 to 2019. Please refer to Liu et al. [28] for more details on the detection method. First, we performed the object-oriented method using eCognition 10 software. To improve the boundary detection results, we performed several pre-segmentation experiments for different segmentation scales and set the scale parameter to 100 for the Zhangjiang Estuary and the Dandou Sea. Then, we classified mangroves and S. alterniflora by visual interpretation. For the case of the Dandou Sea in 2005, we first obtained the classification results based on Google Earth imagery in 2005 and then modified the results using the Landsat-5 imagery acquired during low tide in 2005.
The classification result accuracies of the Zhangjiang Estuary in 2016, and the Dandou Sea in 2019, were assessed by ground survey samples. Owing to the lack of field survey data in other years, 800 independent points for every image were created by a random sampling method. We classified random points into S. alterniflora, mangroves, and other land cover types by consulting with experienced interpreters and local experts. We calculated confusion matrices for each year in the study areas and used the Kappa coefficient and overall accuracy to evaluate the accuracy of the mangrove and S. alterniflora detection results.

2.4. Landscape Indexes and Dynamic Metrics

Landscape indexes were used to evaluate the temporal and spatial variations of the mangrove and S. alterniflora landscape patterns [62,63]. Here, we selected patch number (NP), patch density (PD), largest patch index (LPI), patch shape index (LSI), area-weighted mean shape index (AWMSI), landscape division index (DIVISION), and aggregation index (AI) to assess the landscape characteristics, such as patch fragmentation, shape complexity, and patch connectivity for mangroves and S. alterniflora (Table 2). The landscape indexes were calculated with the FRAGSTATS v4.2.1 software. In addition, we used the annual change rate and annual expansion rate to analyze the dynamics of mangroves and S. alterniflora. The equations are listed as follows:
K = U a U b U b × 1 N × 100 %
U a = U b × ( 1 + p ) N
where K represents the annual change rate; p denotes the annual expansion rate; U a and U b represent the area at the ending year and beginning year in each stage, respectively; and N denotes the time in years [28].

2.5. Centroid Migration

Centroid migration of mangroves and S. alterniflora can reflect their spatial and temporal evolution features and relationships [40]. We calculated and analyzed the centroid migrations of mangroves and S. alterniflora here. The equation of centroid is listed as follows:
X C = i = 1 n C i X i i = 1 n C i Y C = i = 1 n C i Y i i = 1 n C i
where X c and Y c represent the centroid coordinates of one land cover type weighted by its area, X i and Y i are the latitude and longitude coordinates for the centroid of the ith patch of one land cover type, C i is the area of the ith patch, and n is the total number of patches of a certain land cover type.

2.6. Spartina alterniflora Expansion Pattern Analysis

We used LEI [64] to investigate the S. alterniflora expansion patterns at the patch level. The LEI equation is listed as follows:
LEI = A P A 0 A P + A 0
where A p represents the expansion area of the S. alterniflora patch and A 0 denotes the original area of the S. alterniflora patch. When A0 ≠ 0, and the range of LEI values is (−1, 1), the expansion mode is marginal expansion, which indicates that the S. alterniflora patches expand outward from their original locations while the newly generated patches are adjacent to older patches [53]. When the expansion area is smaller than the original area of the S. alterniflora patch, L E I < 0 , which represents the marginal expansion 1 mode. When the expansion area is equal to or larger than the original area of the S. alterniflora patch, L E I 0 , which denotes the marginal expansion 2 mode [55]. When the original area of the S. alterniflora patch is 0, A 0 = 0, LEI = 1, and the expansion mode is external expansion.

3. Results

3.1. Accuracy Assessment

Table 3 presents the accuracy assessments in the Zhangjiang Estuary and the Dandou Sea. In the Zhangjiang Estuary, the detection accuracy in 2016 was lower than that of other years, which was due to the seasonal-dependent environmental noises (algae) [61] on the mud flats (Figure 2). In the Dandou Sea, the detection accuracy in 2019 was lower than that of other years, which might be due to the tidal activities leading to turbid coastal waters [28]. The overall accuracies of all the detection results are greater than 90%, and all Kappa coefficients exceed 0.90, confirming consistency between our detection results and those from the validation data.

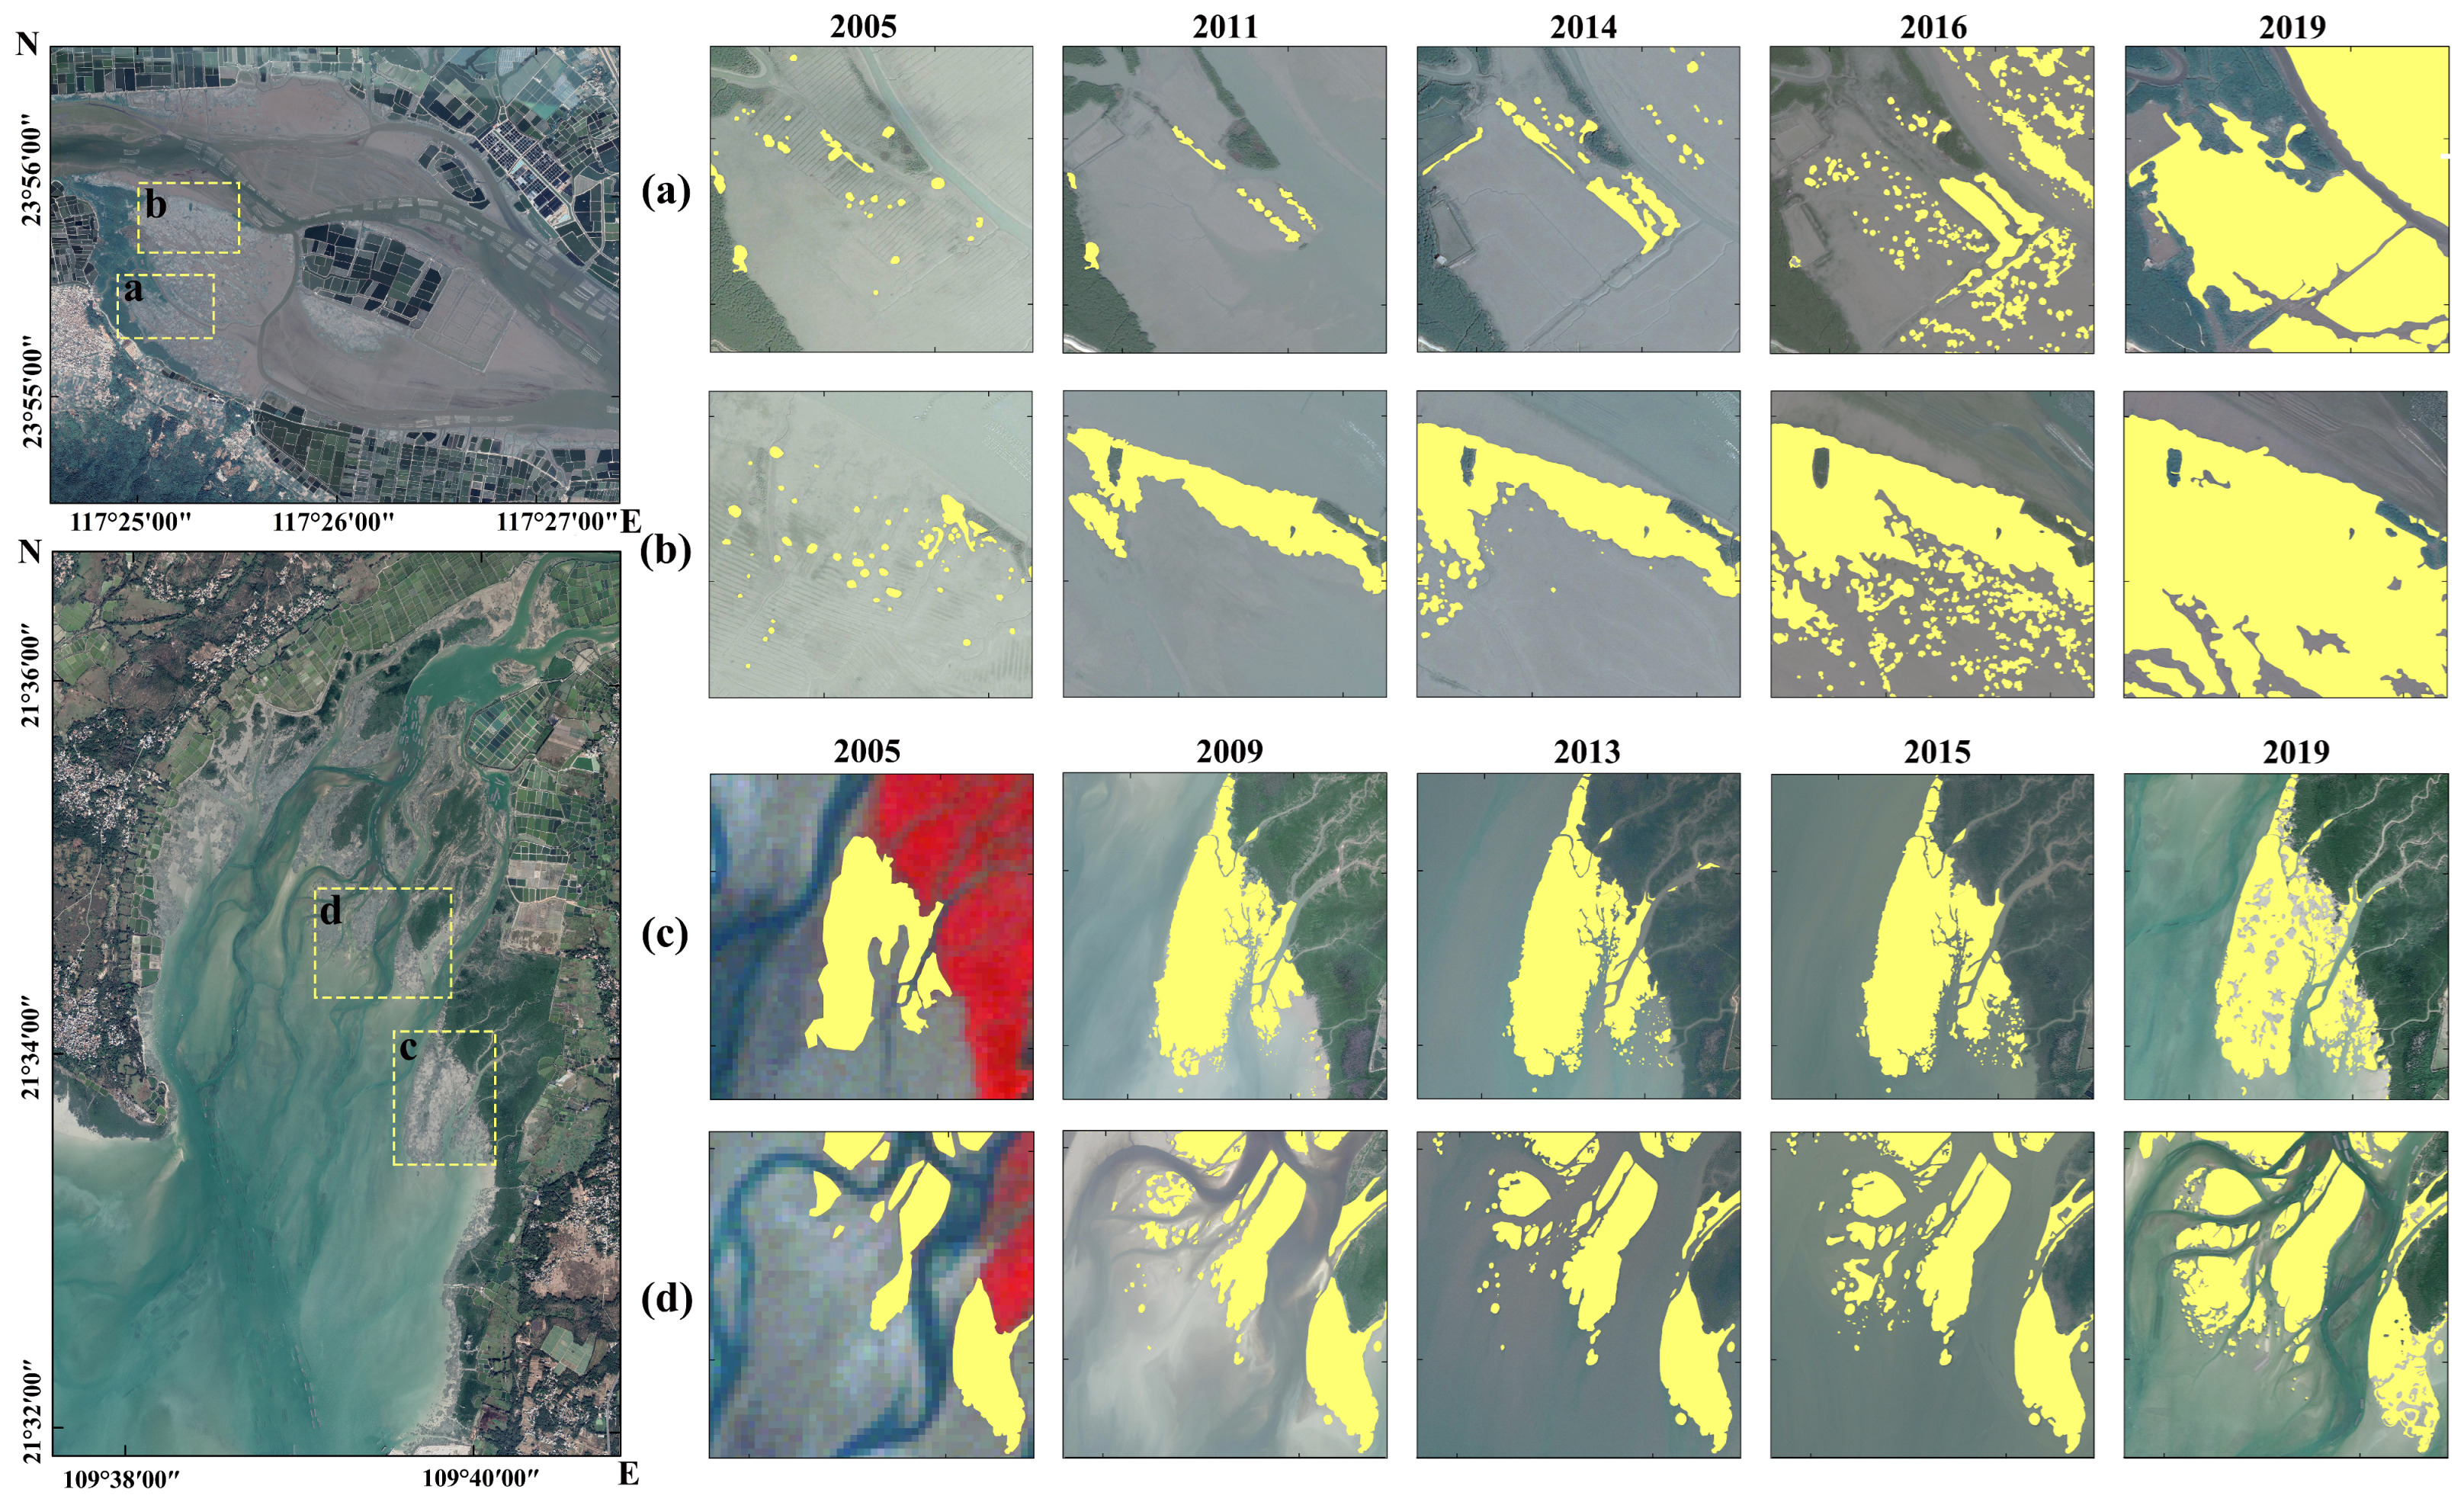
3.2. Spatial–Temporal Distribution Changes of Mangroves and S. alterniflora

Figure 2 shows the distribution maps of mangroves and S. alterniflora in the Zhangjiang Estuary from 2005 to 2019. Most mangroves in the Zhangjiang Estuary were concentrated in the west of the study area, while S. alterniflora grew on the seaward side of the mangroves or near aquaculture ponds. In the north of the study area, S. alterniflora were distributed in small patches and continued to expand on the mudflats towards the sea (Figure 2). From 2005 to 2019, the mangrove area in the Zhangjiang Estuary expanded, with a total area increase of 9.03 hm2. The annual change rates of mangroves were 0.23% from 2005 to 2011, 0.54% from 2011 to 2014, 1.27% from 2014 to 2016, and 3.28% from 2016 to 2019, respectively (Table 4). From 2005 to 2019, the S. alterniflora expanded with a total area increase of 165.09 hm2. The annual change rates of S. alterniflora were 0.42% from 2005 to 2011, 9.14% from 2011 to 2014, 18.68% from 2014 to 2016, and 30.92% from 2016 to 2019, respectively (Table 4). From 2014 to 2019, many small S. alterniflora patches on the mudflats gradually converged, forming larger S. alterniflora stands (Figure 2).
The centroid of mangroves in the Zhangjiang Estuary varied as the mangrove distributions changed. The mangrove centroid moved northeast by 0.04 km from 2005 to 2011, northwest by 0.008 km from 2011 to 2014, northeast by 0.064 km from 2014 to 2016, and southwest by 0.01 km from 2016 to 2019 (Figure 3). The centroid of S. alterniflora also shifted as S. alterniflora invaded the mudflats (Figure 2). The S. alterniflora centroid migrated southeast by 0.207 km from 2005 to 2011, westward by 0.321 km from 2011 to 2014, westward by 0.357 km from 2014 to 2016, and northwest by 0.382 km from 2016 to 2019 (Figure 3).
Figure 4 presents the distribution maps of mangroves and S. alterniflora in the Dandou Sea from 2005 to 2019. In this study area, mangroves were mainly found on the north and east sides or near the aquaculture ponds. S. alterniflora occupied the mud flats near mangroves in the north of the Dandou Sea and continuously expanded towards the sea. The mangrove area in the Dandou Sea increased from 475.78 hm2 in 2005 to 493.24 hm2 in 2009, decreased to 475.12 hm2 in 2015, and then increased to 475.41 hm2 in 2019 (Table 5). The mangrove area decreases were mainly due to anthropological activities, like land reclamations along the southern coast of the Dandou Sea (Figure 4 and Figure 5), and the encroachment of S. alterniflora into mangroves also prohibited the mangrove expansion. From 2005 to 2019, the S. alterniflora spread with an area increase of 228.28 hm2. The annual change rates of S. alterniflora were 23.25% from 2005 to 2009, 7.77% from 2009 to 2013, 0.40% from 2013 to 2015, and 0.32% from 2015 to 2019, respectively (Table 5). The S. alterniflora rapid spread was obvious along the eastern coast of the Dandou Sea from 2009 to 2013 (Figure 5).
The mangrove centroid in the Dandou Sea shifted towards the northeast by 0.128 km from 2005 to 2009, northwest by 0.242 km from 2009 to 2013, eastward by 0.014 km from 2013 to 2015, and eastward by 0.017 km from 2015 to 2019, respectively (Figure 6). The S. alterniflora centroid moved northwest by 0.223 km from 2005 to 2009, northeast by 0.278 km from 2009 to 2013, southwest by 0.062 km from 2013 to 2015, and southwest by 0.391 km from 2015 to 2019 (Figure 6).

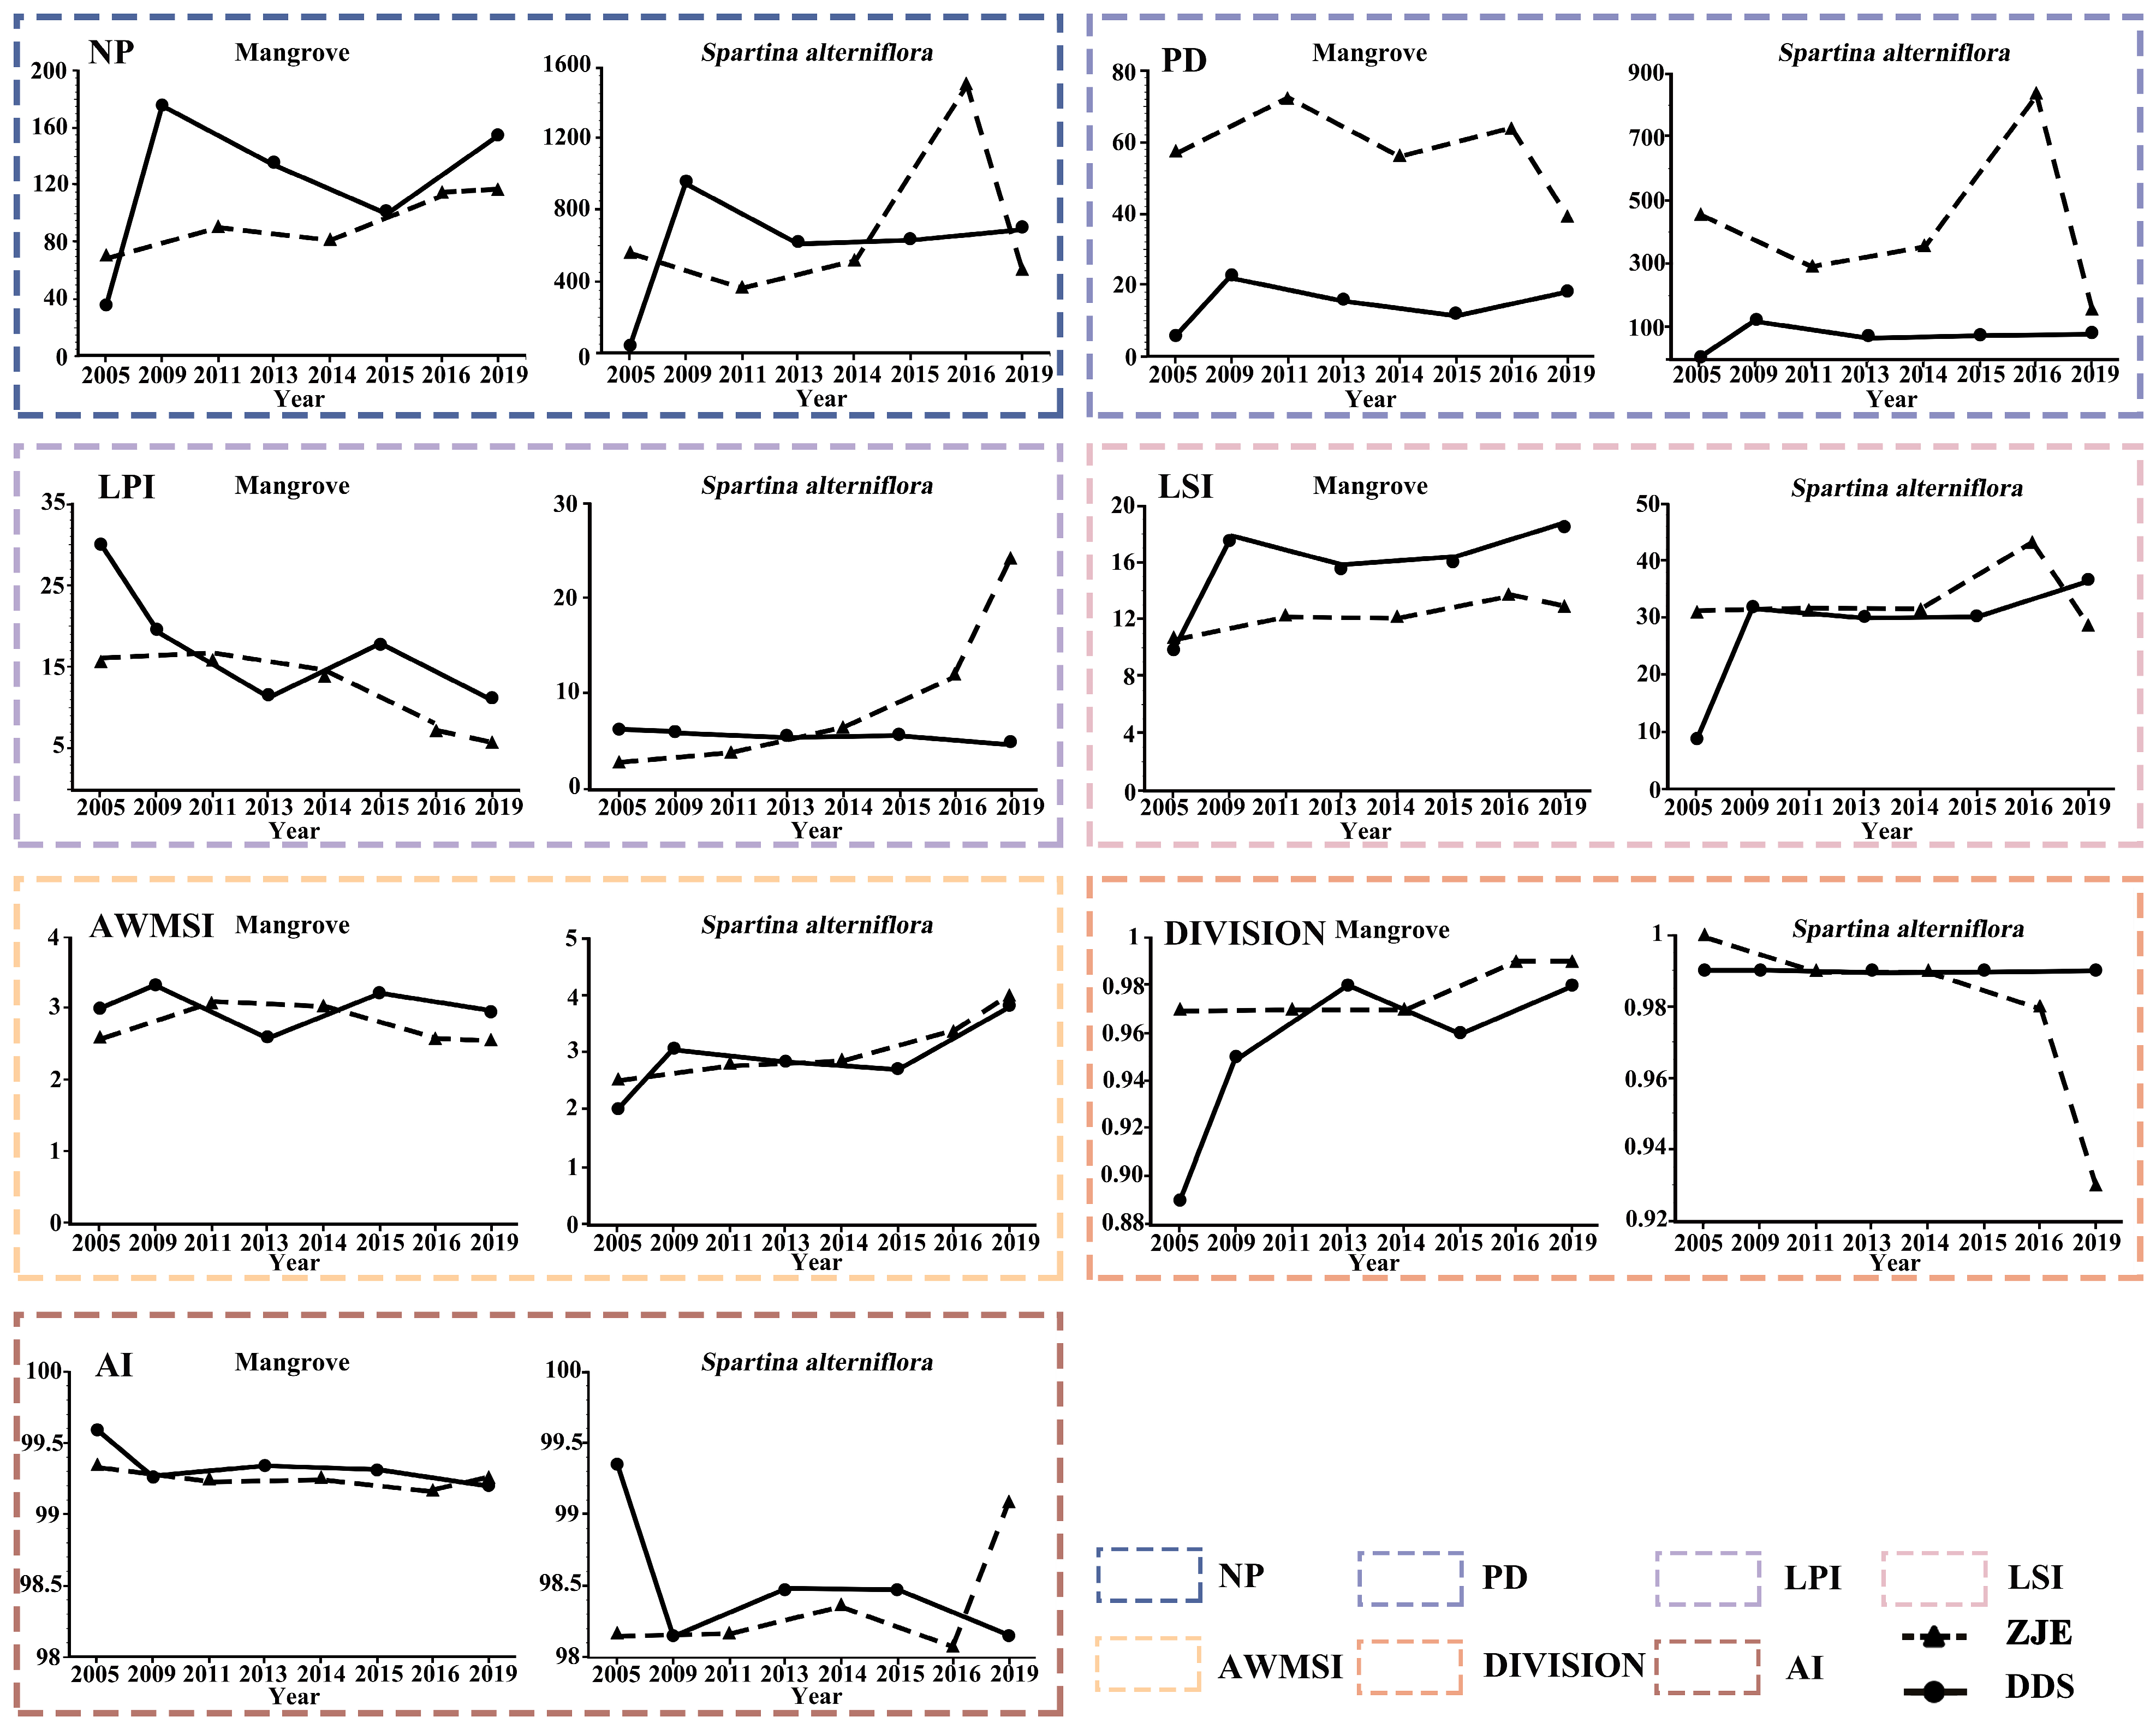
3.3. Changes of Mangrove and S. alterniflora Landscape Indexes

3.3.1. Mangroves

The landscape index results for mangroves and S. alterniflora in the Zhangjiang Estuary and the Dandou Sea are displayed in Figure 7. In the Zhangjiang Estuary, the total number of mangrove NP presented a continuous growth trend since 2014, peaking at 117 in 2019 and increasing by 46 from 2005 to 2019. This suggested that mangrove patches were increasingly fragmented in the Zhangjiang Estuary, and the patch distributions became more discrete. The mangrove PD fluctuated from 72.32 to 39.33, showing the mangrove heterogeneity. The mangrove LPI showed a trend of increasing and then decreasing, with the lowest point of 5.76 in 2019, reflecting the low concentration degree of the mangrove patches. The mangrove LSI fluctuated from 10.74 to 13.75, suggesting the scattered mangrove distributions. The mangrove AWMSI first increased and then decreased, reaching a peak at 3.08 in 2011. The mangrove DIVISION increased from 0.97 to 0.99, suggesting the complex mangrove patch composition. The mangrove AI decreased from 99.35 in 2005 to 99.26 in 2019, suggesting the decreasing mangrove connectivity in the Zhangjiang Estuary.
In the Dandou Sea, the total number of mangrove NP showed a fluctuating trend of increasing, decreasing. and then increasing again, peaking at 176 in 2009 (Figure 7). The trend of mangrove PD was similar to that of mangrove NP. The highest point of mangrove PD in the Dandou Sea was 22.81 in 2009, smaller than the mangrove PD values in the Zhangjiang Estuary. The mangrove LPI displayed a trend of decreasing, increasing, and then decreasing, which suggested the low concentration degree. The mangrove LSI displayed a trend of increasing, decreasing, and then increasing, peaking at 18.50 in 2019, which indicated that the mangrove distribution was scattered. The mangrove AWMSI fluctuated from 2.60 to 3.33, showing the mangrove heterogeneity. The mangrove DIVISION increased from 0.89 in 2005 to 0.98 in 2019, suggesting a more complex mangrove patch composition. The mangrove AI decreased from 99.59 in 2005 to 99.20 in 2019, suggesting decreasing mangrove connectivity in the Dandou Sea.
Taken together, the mangrove landscapes in both the Zhangjiang Estuary and the Dandou Sea were complex, with more fragmented patches, greater heterogeneity, and decreased connectivity. The mangrove patches in the Zhangjiang Estuary were more fragmented than those in the Dandou Sea.

3.3.2. Spartina alterniflora

In the Zhangjiang Estuary, the total number of S. alterniflora NP displayed a trend of decreasing, increasing, and then decreasing, peaking at 1508 in 2016 (Figure 7). The decline of S. alterniflora NP values from 2005 to 2011 was mainly because (1) the aquaculture pond constructions occupied the habitat areas of S. alterniflora, and (2) many small-sized S. alterniflora patches merged into larger ones. From 2014 to 2016, S. alterniflora spread rapidly, especially on the tidal mudflats west of the Zhangjiang Estuary, resulting in numerous small S. alterniflora patches scattered on the mudflats (Figure 2). From 2016 to 2019, those small patches continued to grow and then merged into larger patches, which resulted in decreased S. alterniflora NP values. This indicated that the period from 2011 to 2014 was the growth stage, and the years from 2014 to 2019 were the outbreak stage for the S. alterniflora expansion process in the Zhangjiang Estuary. The S. alterniflora PD fluctuated from 157.32 to 838.31, peaking at 838.31 in 2016, and the changing trend was consistent with that of NP. The S. alterniflora LPI continuously increased, peaking at 24.22 in 2019, indicating the increased concentration degree of the S. alterniflora patches. The S. alterniflora LSI first increased and then decreased, peaking at 43.23 in 2016, which also suggested the invasion outbreak of S. alterniflora expansion. The S. alterniflora AWMSI showed a continuous growth trend, indicating the increasing heterogeneity degree of S. alterniflora distributions in the Zhangjiang Estuary. The S. alterniflora DIVISION decreased dramatically from 1 to 0.93, suggesting the S. alterniflora patch composition was becoming simpler (Figure 2). The S. alterniflora AI dramatically increased from 98.08 in 2016 to 99.09 in 2019, suggesting improved connectivity among the S. alterniflora patches in the Zhangjiang Estuary.
In the Dandou Sea, the total number of S. alterniflora NP fluctuated from increasing to decreasing and then to increasing again, peaking at 960 in 2009 (Figure 7). The trend of S. alterniflora PD was similar to that of S. alterniflora NP. The highest point of S. alterniflora PD in the Dandou Sea was 124.42 in 2009, smaller than those in the Zhangjiang Estuary. This indicated that S. alterniflora patches in the Dandou Sea were less fragmented than those in the Zhangjiang Estuary. Also, the period from 2005 to 2009 was the outbreak stage, and the years from 2009 to 2019 were the plateau stage for the S. alterniflora expansion process in the Dandou Sea. The S. alterniflora LPI decreased from 6.22 in 2005 to 4.90 in 2019, indicating the S. alterniflora concentration degree decline in these years. The S. alterniflora LSI fluctuated from increasing to decreasing and then to increasing, peaking at 36.71 in 2019, which indicated the scattered distribution of S. alterniflora. The S. alterniflora AWMSI fluctuated from 2.01 to 3.82, showing the increased heterogeneity of S. alterniflora patches. The S. alterniflora DIVISION remained at 0.99, which indicated the severe fragmentation and complex patch composition of S. alterniflora. The S. alterniflora AI decreased from 99.35 in 2005 to 98.15 in 2019, suggesting the decreasing S. alterniflora connectivity in the Dandou Sea.
Taken together, the S. alterniflora landscapes in both the Zhangjiang Estuary and the Dandou Sea showed increasing heterogeneity. From 2005 to 2019, S. alterniflora in the Zhangjiang Estuary experienced the growth and outbreak stages and showed a higher concentration degree and improved connectivity, while those in the Dandou Sea experienced the outbreak and plateau stages and showed decreased connectivity. Comparing the landscape indexes of mangroves and S. alterniflora, we can see the differences in the landscape index trends in the two regions. In the Zhangjiang Estuary, from 2005 to 2019, the mangrove LPI showed a decreasing trend, while the S. alterniflora LPI showed an increasing trend. This indicated the possibility for S. alterniflora to be the dominant intertidal plant in the Zhangjiang Estuary in the future. In contrast, the S. alterniflora LPI in the Dandou Sea decreased over time. From 2009 onwards, the mangrove AI values of the two study areas were larger than the S. alterniflora AI values, indicating better connectivity of the mangrove patches than the S. alterniflora patches.

3.4. Expansion Mode of S. alterniflora from 2005 to 2019

As the spatial distribution changes of S. alterniflora varied in different areas from 2005 to 2019 (Figure 2 and Figure 4), we further studied the expansion dynamics and analyzed the expansion pattern here. The S. alterniflora expansion modes included external expansion, marginal expansion 1, and marginal expansion 2 (Figure 8). In the Zhangjiang Estuary, from 2005 to 2011, S. alterniflora expanded by 371 patches (Table 6). The number of external expansion patches was 190, accounting for 51.21% of the total expansion patch number, suggesting that S. alterniflora expanded mainly through external expansion. A total of 140 patches, with a proportion of 37.74% and an area of 12.76 hm2, were dominated by the marginal expansion 1 mode. From 2011 to 2014, S. alterniflora expanded by 502 patches. The number of external expansion patches was 356, accounting for 70.92% of the total expansion patches. However, the area of the marginal expansion patches was significantly higher than that of the external expansion patches. From 2014 to 2016, S. alterniflora expanded by 1476 patches. The number of S. alterniflora patches in external expansion mode accounted for 84.15% of the total. The area of marginal expansion patches was 12.14 hm2 larger than those of the external expansion patches. From 2016 to 2019, the number of external expansion patches was slightly smaller than the total number of patches in marginal expansion 1 mode and marginal expansion 2 mode. The area of patches in marginal expansion 2 mode dramatically increased, while the area of external expansion patches declined. The AWMSI values of the patches (Table 6) suggested that patches in marginal expansion 2 mode were more complex than those in marginal expansion 1 mode, and patches in marginal expansion 1 mode also showed higher heterogeneity than those in external expansion mode. SPLIT values of S. alterniflora patches in external expansion mode were larger than those in marginal expansion 1 or marginal expansion 2 modes, indicating the external expansion mode could cause severe fragmentation of the patches. As displayed in Figure 8, we can clearly see that the period from 2011 to 2016 was the time when external expansion was the main S. alterniflora expansion mode on the mudflats southwest of the study region.
In the Dandou Sea, from 2005 to 2009, S. alterniflora expanded by 1155 patches (Table 7). There were 930 external expansion patches, accounting for 80.52% of the total expansion patch number, with an area of 98.93 hm2. It suggested S. alterniflora expanded mainly through external expansion in this period. There were also 207 patches in marginal expansion 1 mode, accounting for 17.92% of the total, with an area of 36.87 hm2. From 2009 to 2013, there were 780 patches in marginal expansion 1 mode and 342 patches in marginal expansion 2 mode, accounting for 80.6% of the total, with an area of 82.17 hm2 in total. There were only 270 patches dominated by external expansion mode, accounting for 19.4% of the total, indicating that S. alterniflora expanded mainly through marginal expansion in this period. From 2005 to 2013, both the AWMSI and SPLIT indexes of the marginal expansion 1 and marginal expansion 2 modes were higher than those of external expansion, indicating that the shape of marginal expansion patches showed higher heterogeneity and dispersion degree. From 2013 to 2015, the patch number in marginal expansion 1 mode was 1572, accounting for 80.91% of the total, with an area of 82.17 hm2. The SPLIT index of external expansion was 4087.52, much larger than those in marginal expansion modes, indicating a severe fragmentation degree. From 2015 to 2019, the patch number in marginal expansion 1 mode was 970, accounting for 54.80% of the total, with an area of 36.26 hm2. Both the number and area of the patches in external expansion mode were smaller than those in marginal expansion mode. The SPLIT index of patches in external expansion mode was larger than those of marginal expansion, indicating that the patches of external expansion were more dispersed. As demonstrated in Figure 9, the period from 2005 to 2009 was the time when external expansion was the dominant S. alterniflora expansion mode, while marginal expansion was the main S. alterniflora expansion mode from 2009 to 2019 in the Dandou Sea.

4. Discussion

4.1. Mangroves and S. alterniflora Mapping

In this study, the combined OBIA and visual interpretation methods were used to map mangroves and S. alterniflora in the Zhangjiang Estuary and the Dandou Sea from 2005 to 2019. We found that the high-resolution satellite imagery could detect the mangrove and S. alterniflora patches at a finer scale and accurately monitor the S. alterniflora invasion processes [28]. The overall accuracies in both the Zhangjiang Estuary and the Dandou Sea were larger than 90%, suggesting reliable classification results. The S. alterniflora areas in the Zhangjiang Estuary in 2005 and 2014, as measured by Liu et al. [28], were 66.76 hm2 and 87.31 hm2, respectively, which were close to the 67.14 hm2 in 2005 and 87.71 hm2 in 2014, respectively, observed in this study. In addition, the mangrove detection results from Zhong [65] (50.88 hm2 in 2005 and 55.1 hm2 in 2011) were consistent with our results (56.22 hm2 in 2005 and 57.00 hm2 in 2011). As for the Dandou Sea, we compared our mangrove detection results in 2009, 2015, and 2019 with the mangrove datasets in 2010, 2015, and 2020 from Jia et al. [12] and found good spatial consistency (Figure A1). The main difference between our mangrove map in 2009 and the result from Jia et al. [12] in 2010 is shown in Figure A1, and we can see that some small mangrove patches were ignored by Jia et al. [12], which might be due to the coarse spatial resolution satellite imagery [12]. Furthermore, our mangrove map in 2019 and the mangrove detection results in 2018 from Zhang et al. [52] also demonstrated good spatial consistency (Figure A1), with the percentage of overlap greater than 95%. Pan et al. [66] monitored S. alterniflora in the Dandou Sea in 2013 and reported the area to be 372.11 hm2 and the patch number to be 623. Their results were consistent with our study (S. alterniflora area 364.87 hm2, patch number 642 in 2013). Thus, the long-term, fine-scale monitoring results of the mangrove–salt marsh ecotones in this study lay a good data basis for further landscape analysis.

4.2. Dynamic Changes of Mangroves and S. alterniflora

From 2005 to 2019, the annual change rates of mangrove and S. alterniflora in the Zhangjiang Estuary showed a continuous growth trend. Our results regarding the changes in the mangrove and S. alterniflora distribution area in the Zhangjiang Estuary are highly consistent with those of previous researchers [67,68]. In comparison, mangrove areas in the Dandou Sea first increased, then decreased, and then increased again, while S. alterniflora areas kept rising from 2005 to 2019. S. alterniflora in the two study regions showed larger annual change rates and annual expansion rates than mangroves, indicating the rapid S. alterniflora invasion in the intertidal zones.
From 2005 to 2019, in the Zhangjiang Estuary, the mangrove centroid experienced a trend of shifting seaward before 2016 and a process of migrating landward after 2016. The mangrove centroid migrated 77 m northeastward during the period. The centroid of S. alterniflora shifted southeastward before 2011 and then shifted westward after 2011. Additionally, the S. alterniflora centroid migrated 1019 m southeastward in total. As to the Dandou Sea, the mangrove centroid experienced a trend of shifting landward. The mangrove centroid migrated 358 m northeastward from 2005 to 2019. The S. alterniflora centroid shifted northward before 2013 and then shifted southward after 2013. The S. alterniflora centroid migrated 300 m northwestward from 2005 to 2019. It is noteworthy that the centroid migration directions of mangroves and S. alterniflora in the Zhangjiang Estuary were opposite, and the distance between the mangrove centroid and the S. alterniflora centroid was decreasing, changing from 2224 m in 2005 to 1159 m in 2019. In the Dandou Sea, the centroid migration directions of both mangroves and S. alterniflora shifted landward, while the mangrove centroid moved northeast and the S. alterniflora centroid shifted northwest, which was partly consistent with the opposite migration direction results in the Zhangjiang Estuary. In the Dandou Sea, the distance between the mangrove centroid and the S. alterniflora centroid was also decreasing, changing from 566 m in 2005 to 543 m in 2019. These indirectly reflect the fierce competition between mangroves and S. alterniflora for habitat resources in coastal areas. Also, the centroid distance changes between mangroves and S. alterniflora were larger in the Zhangjiang Estuary than those in the Dandou Sea, partly suggesting the more serious threat of S. alterniflora colonizing mangrove areas in the Zhangjiang Estuary.
The LSI, AWMSI, and DIVISION indexes indicate that mangrove segmentation is obvious and that the mangrove patch shapes become more complex and irregular. From 2005 to 2019, mangrove patches in the Dandou Sea exhibited higher complexity and fragmentation degrees compared with those in the Zhangjiang Estuary. The dramatic increasing trend of the S. alterniflora LPI indexes in the Zhangjiang Estuary suggested that S. alterniflora might continue to exert pressure on mangrove ecosystems in the near future.

4.3. Spartina alterniflora Invasion Process and Pattern

The S. alterniflora invasion process can be deduced from the area changes over time. A significant increase in the S. alterniflora area from 2016 to 2019 was notable in the Zhangjiang Estuary, with an annual change rate of 30.92%. Additionally, the S. alterniflora area changes revealed that S. alterniflora experienced a growth stage first and then an outbreak stage from 2014 to 2019. By comparison, the annual change rates of S. alterniflora decreased over time in the Dandou Sea, consistent with the results from Li et al. [69]. This indicated that S. alterniflora in the Dandou Sea experienced the outbreak stage from 2005 to 2009, followed by a decrease in expansion rate, and entered the plateau stage after 2009 mainly due to environmental limitations. Spartina alterniflora was reported to be first successfully planted in Fujian Province in 1981 and in Guangxi Zhuang Autonomous Region in 1979 [28]. The differences in planting time might be an important reason for the delayed S. alterniflora expansion outbreak stage in the Zhangjiang Estuary, compared with those in the Dandou Sea.
Researchers noted that the invasion of S. alterniflora in China exhibited characteristics of “point-source dispersal, multi-point outbreak” [70]. The S. alterniflora expansion processes in the Zhangjiang Estuary and the Dandou Sea also conformed to this rule. As displayed in Figure A2, S. alterniflora in the Zhangjiang Estuary first formed numerous small and irregular patches, subsequently, these scattered small patches on the mudflats rapidly expanded, coalescing into large contiguous clumps. Thus, although S. alterniflora can reproduce both asexually and sexually [71], the S. alterniflora clonal growth mainly contributed to area increase in the two study areas from 2005 to 2019. Additionally, the S. alterniflora outbreak stages were also obvious in Figure A2.
The expansion pattern of S. alterniflora varies in different regions and different periods. In terms of the patch number, the S. alterniflora expansion was dominated by external expansion from 2005 to 2016 in the Zhangjiang Estuary and from 2005 to 2009 in the Dandou Sea. In terms of the patch area, the S. alterniflora expansion was dominated by marginal expansion from 2005 to 2019 in the Zhangjiang Estuary and from 2009 to 2019 in the Dandou Sea. The shape of patches in marginal expansion mode was more complex compared to those in external expansion mode. A significant fragmentation trend of S. alterniflora patches in external expansion mode can be observed in both study areas.
Previous researchers mentioned that the S. alterniflora expansion could be divided into three stages, which were the growth stage, outbreak stage, and plateau stage [72]. However, owing to the lack of high spatial resolution satellite imagery before 2005, we did not observe the growth stage of S. alterniflora expansion in the Dandou Sea. Since the “Special Action Plan for Mangrove Protection and Restoration (2020–2025)” was implemented in 2020, we selected satellite data acquired before 2020 to prevent the impact of this large-scale action plan. So, we only observe the growth stage and outbreak stage of the S. alterniflora expansion in the Zhangjiang Estuary. However, by combining the results in the two areas, we can conclude the full S. alterniflora expansion process.

4.4. Implications for S. alterniflora Control and Management

China has implemented a series of control measures for S. alterniflora management to guarantee ecological security. The Biosecurity Law of the People’s Republic of China came into force in 2021 and proposed to “strengthen the investigation, monitoring, early warning, control, assessment, removal and ecological restoration of invasive alien species”. The “Wetland Protection Law of the People’s Republic of China”, which was officially implemented in 2022, stipulates that “the introduction and release of alien species into wetlands is prohibited”. The “Special Action Plan for Mangrove Protection and Restoration (2020–2025)” points out that “the focus is to strengthen the prevention and control of harmful biological disasters such as S. alterniflora”. By the end of 2022, the “Special Action Plan for the Prevention and Control of Spartina alterniflora (2022–2025)” was issued, marking S. alterniflora control as an important component of China’s coastal wetland management and conservation efforts [73]. Following the deployment arrangements of the Chinese government, several provinces have launched a new round of S. alterniflora control campaigns based on previous control efforts. By the end of October 2023, China has completed the clearance of approximately 300 km2, accounting for 86% of the annual target. Provinces such as Fujian, Shandong, Liaoning, and Hainan have completed the clearance of S. alterniflora in the entire region and have entered the stage of comprehensive management, protection, and ecological restoration [74].
According to our study, the expansion of S. alterniflora in the outbreak stage is rapid with a large annual change rate; the early warning of S. alterniflora invasion is highly significant for the efficient and economical removal of the invasive plant. With the national-scale implementation of S. alterniflora eradication campaigns, the S. alterniflora area will decrease or even disappear by 2025. However, the remaining roots in the soil and the seeds floating on the water make it challenging to exterminate S. alterniflora over the short term [61,75]. Continuous monitoring of S. alterniflora is essential to control secondary invasion and protect coastal wetlands [61].

5. Conclusions

As there are few studies on the spatial pattern differences of S. alterniflora invasion and the nearby mangrove distributions in different latitudes, we selected the Zhangjiang Estuary and the Dandou Sea, two representative mangrove–salt marsh ecotones in the north and south of the Tropic of Cancer, as the study areas. We combined OBIA and visual interpretation methods to map mangroves and S. alterniflora with high-resolution satellite imagery from 2005 to 2019. Based on the constructed long-term, fine-scale mangrove and S. alterniflora maps, we applied spatial analysis, centroid migration, and landscape indexes to analyze and compare the spatio–temporal distribution changes of mangroves and S. alterniflora in these two ecotones over time. The annual change rates of mangrove and S. alterniflora areas in the Zhangjiang Estuary showed a continuous growth trend. The mangrove areas in the Dandou Sea showed a fluctuating trend of increasing, decreasing, and then increasing again, while S. alterniflora areas kept rising from 2005 to 2019. Spartina alterniflora showed larger annual change rates and annual expansion rates compared with the mangroves, indicating a rapid S. alterniflora invasion in the intertidal zones. The opposite centroid migration directions of mangroves and S. alterniflora and the decreasing distances between the mangrove centroid and the S. alterniflora centroid revealed the fierce competition between mangroves and S. alterniflora for habitat resources. The LSI, AWMSI, and DIVISION landscape indexes suggest mangrove segmentation and complex patch shapes. From 2005 to 2019, mangrove patches in the Dandou Sea displayed higher complexity and fragmentation degrees compared with those in the Zhangjiang Estuary. The AI index suggested decreasing mangrove connectivity in both study areas. The impact of S. alterniflora invasion on mangroves was progressively serious as more mangrove canopy gaps were invaded and S. alterniflora patches near mangroves became larger. S. alterniflora invasion contributed to the severe fragmentation and degraded connectivity patterns of mangroves in both study regions. Thus, the control and management of S. alterniflora is urgent and imperative for scientific mangrove restoration and conservation.
The S. alterniflora invasion process and expansion mode were illuminated for the two study areas. From 2005 to 2019, we observed the growth stage and outbreak stage of S. alterniflora expansion in the Zhangjiang Estuary and the outbreak stage and plateau stage of S. alterniflora expansion in the Dandou Sea. The different planting times and latitudes might lead to the delayed S. alterniflora expansion outbreak stage in the Zhangjiang Estuary, in contrast with those in the Dandou Sea. The expansion characteristics of “point-source dispersal, multi-point outbreak” were obviously shown in these two regions. In terms of the patch number, the S. alterniflora expansion was dominated by external expansion from 2005 to 2016 in the Zhangjiang Estuary and from 2005 to 2009 in the Dandou Sea. In terms of the patch area, the S. alterniflora expansion was dominated by marginal expansion from 2005 to 2019 in the Zhangjiang Estuary and from 2009 to 2019 in the Dandou Sea. As S. alterniflora expansion in the outbreak stage is rapid, with a large annual change rate, early warning of S. alterniflora invasion is of significance for the efficient and economical removal of the invasive plant. Moreover, with the national-scale implementation of S. alterniflora eradication campaigns, continuous monitoring of S. alterniflora is essential to control secondary invasion and protect coastal wetlands. This study contributes to the understanding of the S. alterniflora invasion process and expansion mode in mangrove–salt marsh ecotones with different latitudes. These conclusions are highly beneficial for the management and sustainable development of coastal wetlands.

Author Contributions

Conceptualization, D.D. and H.H.; methodology, D.D. and Q.G.; software, Q.G.; validation, D.D., H.H. and Q.G.; formal analysis, D.D., H.H. and Q.G.; investigation, D.D. and Q.G.; resources, H.H.; data curation, Q.G.; writing—original draft preparation, D.D. and Q.G.; writing—review and editing, D.D. and H.H.; visualization, Q.G.; supervision, H.H.; project administration, H.H.; funding acquisition, H.H. All authors have read and agreed to the published version of the manuscript.

Funding

This work was supported by the Marine Economy Special Project of the Guangdong Province (GDNRC[2024]36); the Director’s Foundation of the South China Sea Bureau of Ministry of Natural Resources (230206); the Science and Technology Project of Guangdong Forestry Administration (2024): Monitoring and Ecological Value Assessment of Coastal Wetland Resources in the Guangdong Province; the Science and Technology Project of Guangdong Forestry Administration (2023): Research on Carbon Storage Verification, Potential Assessment and Carbon Sink Trading Mechanism of Typical Coastal Wetlands.

Data Availability Statement

The authors confirm that the data supporting the findings of this study are available within the article.

Acknowledgments

The authors would like to thank the USGS for providing Landsat satellite images. Thanks to the reviewers and editors for their valuable suggestions on this paper.

Conflicts of Interest

The authors declare no conflicts of interest.

Appendix A

Figure A1. Comparison of mangrove patches from our study, Jia et al. [12] and Zhang et al. [52], in Dandou Sea.
Forests 15 01788 g0a1
Figure A2. Examples of S. alterniflora expansions in Zhangjiang Estuary and Dandou Sea.
Forests 15 01788 g0a2

References

  1. Kathiresan, K.; Bingham, B.L. Biology of mangroves and mangrove ecosystems. Adv. Mar. Biol. 2001, 40, 81–251. [Google Scholar]
  2. Carlton, J.M. Land-building and stabilization by mangroves. Environ. Conserv. 1974, 1, 285–294. [Google Scholar] [CrossRef]
  3. Marois, D.E.; Mitsch, W.J. Coastal protection from tsunamis and cyclones provided by mangrove wetlands—A review. Int. J. Biodivers. Sci. Ecosyst. Serv. Manag. 2015, 11, 71–83. [Google Scholar] [CrossRef]
  4. Spalding, M.; Mcivor, A.; Tonneijck, F.; Tol, S.; Eijk, P.V. Mangroves for coastal defence. In Guidelines for Coastal Managers & Policy Makers; Wetlands International and The Nature Conservancy: Wageningen, The Netherlands, 2014. [Google Scholar]
  5. Jia, M.; Wang, Z.; Luo, L.; Zhang, R.; Zhang, H. Global status of mangrove forests in resisting cyclone and tsunami. Innov. Geo. 2023, 1, 100024. [Google Scholar] [CrossRef]
  6. Arceo-Carranza, D.; Chiappa-Carrara, X.; Chávez López, R.; Yáñez Arenas, C. Mangroves as feeding and breeding grounds. In Mangroves: Ecology, Biodiversity and Management; Rastogi, R.P., Phulwaria, M., Gupta, D.K., Eds.; Springer Singapore: Singapore, 2021; pp. 63–95. ISBN 9789811624933. [Google Scholar]
  7. Lugendo, B.R.; Nagelkerken, I.; Kruitwagen, G.; Van Der Velde, G.; Mgaya, Y.D. Relative importance of mangroves as feeding habitats for fishes: A comparison between mangrove habitats with different settings. Bull. Mar. Sci. 2007, 80, 497–512. [Google Scholar]
  8. Corte, G.N.; Checon, H.H.; Shah Esmaeili, Y.; Lefcheck, J.S.; Amaral, A.C.Z. Mangrove fragments as key coastal reservoirs of taxonomic and functional biodiversity. Biodivers. Conserv. 2021, 30, 1573–1593. [Google Scholar] [CrossRef]
  9. Rahman, M.M.; Zimmer, M.; Ahmed, I.; Donato, D.; Kanzaki, M.; Xu, M. Co-benefits of protecting mangroves for biodiversity conservation and carbon storage. Nat. Commun. 2021, 12, 3875. [Google Scholar] [CrossRef]
  10. Carugati, L.; Gatto, B.; Rastelli, E.; Lo Martire, M.; Coral, C.; Greco, S.; Danovaro, R. Impact of mangrove forests degradation on biodiversity and ecosystem functioning. Sci. Rep. 2018, 8, 13298. [Google Scholar] [CrossRef]
  11. Alongi, D.M. Global significance of mangrove blue carbon in climate change mitigation. Science 2020, 2, 67. [Google Scholar] [CrossRef]
  12. Jia, M.; Wang, Z.; Zhang, Y.; Mao, D.; Wang, C. Monitoring loss and recovery of mangrove forests during 42 years: The achievements of mangrove conservation in China. Int. J. Appl. Earth Obs. 2018, 73, 535–545. [Google Scholar] [CrossRef]
  13. Kirwan, M.L.; Megonigal, J.P. Tidal wetland stability in the face of human impacts and sea-level rise. Nature 2013, 504, 53–60. [Google Scholar] [CrossRef] [PubMed]
  14. Huber, L.C.; Sainge, M.N.; Feka, Z.N.; Kamara, R.A.; Kamara, A.; Sullivan, M.; Cuni-Sanchez, A. Human-driven degradation impacts on mangroves in southern Sierra Leone. Trees For. People. 2023, 14, 100445. [Google Scholar] [CrossRef]
  15. Gilman, E.L.; Ellison, J.; Duke, N.C.; Field, C. Threats to mangroves from climate change and adaptation options: A review. Aquat. Bot. 2008, 89, 237–250. [Google Scholar] [CrossRef]
  16. Biswas, S.R.; Choudhury, J.K.; Nishat, A.; Rahman, M.M. Do invasive plants threaten the Sundarbans mangrove forest of Bangladesh? For. Ecol. Manag. 2007, 245, 1–9. [Google Scholar] [CrossRef]
  17. Lu, C.; Li, L.; Wang, Z.; Su, Y.; Su, Y.; Huang, Y.; Jia, M.; Mao, D. The national nature reserves in China: Are they effective in conserving mangroves? Ecol. Indic. 2022, 142, 109265. [Google Scholar] [CrossRef]
  18. Romañach, S.S.; DeAngelis, D.L.; Koh, H.L.; Li, Y.; Teh, S.Y.; Barizan, R.S.R.; Zhai, L. Conservation and restoration of mangroves: Global status, perspectives, and prognosis. Ocean Coast. Manag. 2018, 154, 72–82. [Google Scholar] [CrossRef]
  19. Domínguez-Domínguez, M.; Zavala-Cruz, J.; Rincón-Ramírez, J.A.; Martínez-Zurimendi, P. Management strategies for the conservation, restoration and utilization of mangroves in Southeastern Mexico. Wetlands 2019, 39, 907–919. [Google Scholar] [CrossRef]
  20. Ngongolo, K.; Mtoka, S.; Mahulu, A. Challenges and opportunities for restoring the threatened mangroves. J. Sci. Res. Rep. 2015, 5, 352–360. [Google Scholar] [CrossRef]
  21. Zhang, R.; Jia, M.; Wang, Z.; Zhou, Y.; Mao, D.; Ren, C.; Zhao, C.; Liu, X. Tracking annual dynamics of mangrove forests in mangrove National Nature Reserves of China based on time series Sentinel-2 imagery during 2016–2020. Int. J. Appl. Earth Obs. 2022, 112, 102918. [Google Scholar] [CrossRef]
  22. Jia, M.; Liu, M.; Wang, Z.; Mao, D.; Ren, C.; Cui, H. Evaluating the effectiveness of conservation on mangroves: A remote sensing-based comparison for two adjacent protected areas in Shenzhen and Hong Kong, China. Remote Sens. 2016, 8, 627. [Google Scholar] [CrossRef]
  23. Xu, S.; Xie, J.; Chen, M. Integrated management improves emerging coastal industries and ecological restoration with the participation of social capital. Front. Mar. Sci. 2023, 9, 1015262. [Google Scholar]
  24. de Almeida, L.T.; Olímpio, J.L.S.; Pantalena, A.F.; de Almeida, B.S.; de Oliveira Soares, M. Evaluating ten years of management effectiveness in a mangrove protected area. Ocean Coast. Manag. 2016, 125, 29–37. [Google Scholar] [CrossRef]
  25. Dong, D.; Wang, C.; Yan, J.; He, Q.; Zeng, J.; Wei, Z. Combing Sentinel-1 and Sentinel-2 image time series for invasive Spartina alterniflora mapping on Google Earth Engine: A case study in Zhangjiang Estuary. J. Appl. Remote Sens. 2020, 14, 044504. [Google Scholar]
  26. Liu, M.; Mao, D.; Wang, Z.; Li, L.; Man, W.; Jia, M.; Ren, C.; Zhang, Y. Rapid invasion of Spartina alterniflora in the coastal zone of mainland China: New observations from Landsat OLI images. Remote Sens. 2018, 10, 1933. [Google Scholar] [CrossRef]
  27. Mao, D.; Liu, M.; Wang, Z.; Li, L.; Man, W.; Jia, M.; Zhang, Y. Rapid Invasion of Spartina Alterniflora in the Coastal Zone of Mainland China: Spatiotemporal Patterns and Human Prevention. Sensors 2019, 19, 2308. [Google Scholar] [CrossRef]
  28. Liu, M.; Li, H.; Li, L.; Man, W.; Jia, M.; Wang, Z.; Lu, C. Monitoring the invasion of Spartina alterniflora using multi-source high-resolution imagery in the Zhangjiang Estuary, China. Remote Sens. 2017, 9, 539. [Google Scholar] [CrossRef]
  29. Gao, X.; Wang, M.; Wu, H.; Wang, W.; Tu, Z. Effects of Spartina alterniflora Invasion on the Diet of Mangrove Crabs (Parasesarma plicata) in the Zhangjiang Estuary, China. J. Coast. Res. 2018, 34, 106–113. [Google Scholar] [CrossRef]
  30. Jackson, M.V.; Fuller, R.A.; Gan, X.; Li, J.; Mao, D.; Melville, D.S.; Murray, N.J.; Wang, Z.; Choi, C.-Y. Dual threat of tidal flat loss and invasive Spartina alterniflora endanger important shorebird habitat in coastal mainland China. J. Environ. Manag. 2021, 278, 111549. [Google Scholar] [CrossRef]
  31. Zhang, Y.; Huang, G.; Wang, W.; Chen, L.; Lin, G. Interactions between mangroves and exotic Spartina in an anthropogenically disturbed estuary in southern China. Ecology 2012, 93, 588–597. [Google Scholar] [CrossRef]
  32. Huang, X.; Feng, J.; Dong, J.; Zhang, J.; Yang, Q.; Yu, C.; Wu, M.; Zhang, W.; Ling, J. Spartina alterniflora invasion and mangrove restoration alter diversity and composition of sediment diazotrophic community. Appl. Soil Ecol. 2022, 177, 104519. [Google Scholar] [CrossRef]
  33. Xia, S.; Wang, W.; Song, Z.; Kuzyakov, Y.; Guo, L.; Van Zwieten, L.; Li, Q.; Hartley, I.P.; Yang, Y.; Wang, Y. Spartina alterniflora invasion controls organic carbon stocks in coastal marsh and mangrove soils across tropics and subtropics. Glob. Chang. Biol. 2021, 27, 1627–1644. [Google Scholar] [CrossRef] [PubMed]
  34. Jia, M.; Wang, Z.; Mao, D.; Ren, C.; Song, K.; Zhao, C.; Wang, C.; Xiao, X.; Wang, Y. Mapping global distribution of mangrove forests at 10-m resolution. Sci. Bull. 2023, 68, 1306–1316. [Google Scholar] [CrossRef] [PubMed]
  35. Jiang, Y.; Zhang, L.; Yan, M.; Qi, J.; Fu, T.; Fan, S.; Chen, B. High-resolution mangrove forests classification with machine learning using worldview and uav hyperspectral data. Remote Sens. 2021, 13, 1529. [Google Scholar] [CrossRef]
  36. Wang, L.; Jia, M.; Yin, D.; Tian, J. A review of remote sensing for mangrove forests: 1956–2018. Remote Sens. Environ. 2019, 231, 111223. [Google Scholar] [CrossRef]
  37. Kuenzer, C.; Bluemel, A.; Gebhardt, S.; Quoc, T.V.; Dech, S. Remote sensing of mangrove ecosystems: A review. Remote Sens. 2011, 3, 878–928. [Google Scholar] [CrossRef]
  38. Lu, Y.; Wang, L. The current status, potential and challenges of remote sensing for large-scale mangrove studies. Int. J. Remote Sens. 2022, 43, 6824–6855. [Google Scholar] [CrossRef]
  39. Yin, D.; Wang, L.; Lu, Y.; Shi, C. Mangrove tree height growth monitoring from multi-temporal UAV-LiDAR. Remote Sens. Environ. 2024, 303, 114002. [Google Scholar] [CrossRef]
  40. Lu, C.; Liu, J.; Jia, M.; Liu, M.; Man, W.; Fu, W.; Zhong, L.; Lin, X.; Su, Y.; Gao, Y. Dynamic analysis of mangrove forests based on an optimal segmentation scale model and multi-seasonal images in Quanzhou Bay, China. Remote Sens. 2018, 10, 2020. [Google Scholar] [CrossRef]
  41. Giri, C. Observation and Monitoring of Mangrove Forests Using Remote Sensing: Opportunities and Challenges. Remote Sens. 2016, 8, 783. [Google Scholar] [CrossRef]
  42. Tian, J.; Wang, L.; Yin, D.; Li, X.; Diao, C.; Gong, H.; Shi, C.; Menenti, M.; Ge, Y.; Nie, S.; et al. Development of spectral-phenological features for deep learning to understand Spartina alterniflora invasion. Remote Sens. Environ. 2020, 242, 111745. [Google Scholar] [CrossRef]
  43. Okoye, O.K.; Li, H.; Gong, Z. Retraction of invasive Spartina alterniflora and its effect on the habitat loss of endangered migratory bird species and their decline in YNNR using remote sensing technology. Ecol. Evol. 2020, 10, 13810–13824. [Google Scholar] [CrossRef] [PubMed]
  44. Li, N.; Li, L.; Zhang, Y.; Wu, M. Monitoring of the invasion of Spartina alterniflora from 1985 to 2015 in Zhejiang Province, China. BMC Ecol. 2020, 20, 7. [Google Scholar] [CrossRef] [PubMed]
  45. Zhang, X.; Xiao, X.; Wang, X.; Xu, X.; Chen, B.; Wang, J.; Ma, J.; Zhao, B.; Li, B. Quantifying expansion and removal of Spartina alterniflora on Chongming island, China, using time series Landsat images during 1995–2018. Remote Sens. Environ. 2020, 247, 111916. [Google Scholar] [CrossRef] [PubMed]
  46. Zhang, X.; Xiao, X.; Wang, X.; Xu, X.; Qiu, S.; Pan, L.; Ma, J.; Ju, R.; Wu, J.; Li, B. Continual expansion of Spartina alterniflora in the temperate and subtropical coastal zones of China during 1985–2020. Int. J. Appl. Earth Obs. 2023, 117, 103192. [Google Scholar] [CrossRef]
  47. Giri, C.; Ochieng, E.; Tieszen, L.L.; Zhu, Z.; Singh, A.; Loveland, T.; Masek, J.; Duke, N. Status and distribution of mangrove forests of the world using earth observation satellite data. Glob. Ecol. Biogeogr. 2011, 20, 154–159. [Google Scholar] [CrossRef]
  48. Chen, B.; Xiao, X.; Li, X.; Pan, L.; Doughty, R.; Ma, J.; Dong, J.; Qin, Y.; Zhao, B.; Wu, Z. A mangrove forest map of China in 2015: Analysis of time series Landsat 7/8 and Sentinel-1A imagery in Google Earth Engine cloud computing platform. ISPRS J. Photogramm. Remote Sens. 2017, 131, 104–120. [Google Scholar] [CrossRef]
  49. Bunting, P.; Rosenqvist, A.; Lucas, R.M.; Rebelo, L.-M.; Hilarides, L.; Thomas, N.; Hardy, A.; Itoh, T.; Shimada, M.; Finlayson, C.M. The global mangrove watch—A new 2010 global baseline of mangrove extent. Remote Sens. 2018, 10, 1669. [Google Scholar] [CrossRef]
  50. Bunting, P.; Rosenqvist, A.; Hilarides, L.; Lucas, R.M.; Thomas, N.; Tadono, T.; Worthington, T.A.; Spalding, M.; Murray, N.J.; Rebelo, L.-M. Global mangrove extent change 1996–2020: Global mangrove watch version 3.0. Remote Sens. 2022, 14, 3657. [Google Scholar] [CrossRef]
  51. Wang, X.; Xiao, X.; Xu, X.; Zou, Z.; Chen, B.; Qin, Y.; Zhang, X.; Dong, J.; Liu, D.; Pan, L. Rebound in China’s coastal wetlands following conservation and restoration. Nat. Sustain. 2021, 4, 1076–1083. [Google Scholar] [CrossRef]
  52. Zhang, T.; Hu, S.; He, Y.; You, S.; Yang, X.; Gan, Y.; Liu, A. A fine-scale mangrove map of China derived from 2-meter resolution satellite observations and field data. ISPRS Int. J. Geo Inf. 2021, 10, 92. [Google Scholar] [CrossRef]
  53. Yan, D.; Luan, Z.; Li, J.; Xie, S.; Wang, Y. Monitoring Spartina alterniflora Expansion Mode and Dieback Using Multisource High-Resolution Imagery in Yancheng Coastal Wetland, China. Remote Sens. 2023, 15, 3853. [Google Scholar] [CrossRef]
  54. Wang, J.; Lin, Z.; Ma, Y.; Ren, G.; Xu, Z.; Song, X.; Ma, Y.; Wang, A.; Zhao, Y. Distribution and invasion of Spartina alterniflora within the Jiaozhou Bay monitored by remote sensing image. Acta Oceanol. Sin. 2022, 41, 31–40. [Google Scholar] [CrossRef]
  55. Wang, J.; Liu, H.; Li, Y.; Liu, L.; Xie, F. Recognition of spatial expansion patterns of invasive Spartina alterniflora and simulation of the resulting landscape-changes. Acta Ecol. Sin. 2018, 38, 5413–5422. (In Chinese) [Google Scholar]
  56. Li, J. Study on Population Dynamics and Diffusion Model of Invasive Plant Spartina alterniflora. Master’s Thesis, North China University of Science and Technology, Tangshan, China, 2021. (In Chinese). [Google Scholar]
  57. Shen, H.-K.; Zhao, B.; Chen, M.-Y.; Huang, R.-Y.; Yu, K.-F.; Liang, W. Changes of the area of Spartina alterniflora and mangroves in Guangxi Shankou Mangrove National Nature Reserve from 1995 to 2019. J. Appl. Ecol. 2022, 33, 397–404. (In Chinese) [Google Scholar]
  58. Wang, F.; Sun, X.; Zhao, Y.; Wang, H.; Song, X.; Wei, S.; Chen, H. Does Spartina invasion affect the carbohydrate assimilation of polychaetes in mangroves? A case study in the Zhangjiang Estuary Mangrove National Nature Reserve. J. Sea Res. 2023, 195, 102435. [Google Scholar] [CrossRef]
  59. Li, W.; Dong, R.; Fu, H.; Wang, J.; Yu, L.; Gong, P. Integrating Google Earth imagery with Landsat data to improve 30-m resolution land cover mapping. Remote Sens. Environ. 2020, 237, 111563. [Google Scholar] [CrossRef]
  60. Liang, J.; Gong, J.; Li, W. Applications and impacts of Google Earth: A decadal review (2006–2016). ISPRS J. Photogramm. Remote Sens. 2018, 146, 91–107. [Google Scholar] [CrossRef]
  61. Dong, D.; Huang, H.; Gao, Q. Tracking the Dynamics of Spartina alterniflora with WorldView-2/3 and Sentinel-1/2 Imagery in Zhangjiang Estuary, China. Water 2024, 16, 1780. [Google Scholar] [CrossRef]
  62. Ahmadzadeh, R.; Dehdar Dargahi, M.; Khorasani, N.; Farsad, F.; Rahimibashar, M.R. Assessment of wetland landscape changes based on landscape metrics and trophic state index (case study: Anzali International Wetland). Environ. Monit. Assess. 2023, 195, 1206. [Google Scholar] [CrossRef]
  63. Millán-Aguilar, O.; Nettel-Hernanz, A.; Hurtado-Oliva, M.Á.; Dodd, R.S.; Flores-Cárdenas, F.; Manzano-Sarabia, M. Landscape Metrics and Conservation Status of Five Mangrove Wetlands in the Eastern Gulf of California Margin. J. Coast. Res. 2019, 36, 102–194. [Google Scholar] [CrossRef]
  64. Pengfei, W.; De-min, Z.; Huili, G. A new landscape expansion index: Definition and quantification. Acta Ecol. Sin. 2012, 32, 4270–4277. [Google Scholar] [CrossRef]
  65. Zhong, L.; Lu, C.; Wang, Z.; Liu, M.; Chen, Y.; Lin, X.; Su, Y.; Jia, M. Health assessment of mangrove swamp in Zhangjiang Estuary based on GIS and RS. Chinese J. Ecol. 2019, 38, 2553–2563. (In Chinese) [Google Scholar]
  66. Pan, L.; Shi, X.; Tao, Y.; Fan, H.; Mo, Z. Distribution and Expansion of Spartina alterniflora in Coastal Tidal Zone, Guangxi. Wetland Sci. 2016, 14, 464–470. (In Chinese) [Google Scholar]
  67. Pan, W.; Chen, J.; Wang, Y. Analysis of spatio-temporal dynamical change and landscape characteristics of mangroves and Spartina alterniflora in Fujian based on satellite imageries from 1999 to 2018. J. Ecol. Rural Environ. 2020, 36, 1428–1436. (In Chinese) [Google Scholar]
  68. Chen, G. Landscape pattern evolution and driving factors analysis of wetland in Zhangjiang Estuary Mangrove National Nature Reserve. Master’s Thesis, Fujian Agriculture and Forestry University, Fuzhou, China, 2022. (In Chinese). [Google Scholar]
  69. Li, L.; Liu, W.; Tao, Y.; Xu, X.; Fu, W.; Dong, J. Diffusion dynamics and driving forces of Spartina alterniflora in the Guangxi Shankou Mangrove Reserve. Acta Ecol. Sin. 2021, 41, 6814–6824. (In Chinese) [Google Scholar]
  70. Deng, Z.; An, S.; Zhi, Y.; Zhou, C.; Chen, L.; Zhao, C.; Fang, S.; Li, H. Preliminary studies on invasive model and outbreak mechanism of exotic species, Spartina alternilfora Loisel. Acta Ecol. Sin. 2006, 26, 2678–2686. (In Chinese) [Google Scholar]
  71. Liu, H.; Lin, Z.; Qi, X.; Zhang, M.; Yang, H. The relative importance of sexual and asexual reproduction in the spread of Spartina alterniflora using a spatially explicit individual-based model. Ecol. Res. 2014, 29, 905–915. [Google Scholar] [CrossRef]
  72. Zhu, W.; Ren, G.; Wang, J.; Wang, J.; Hu, Y.; Lin, Z.; Li, W.; Zhao, Y.; Li, S.; Wang, N. Monitoring the invasive plant Spartina alterniflora in Jiangsu coastal wetland using MRCNN and Long-Time Series Landsat Data. Remote Sens. 2022, 14, 2630. [Google Scholar] [CrossRef]
  73. Li, H.; Mao, D.; Wang, Z.; Huang, X.; Li, L.; Jia, M. Invasion of Spartina alterniflora in the coastal zone of mainland China: Control achievements from 2015 to 2020 towards the Sustainable Development Goals. J. Environ. Manag. 2022, 323, 116242. [Google Scholar] [CrossRef]
  74. Xie, B.; Han, G. Control of invasive plant Spartina alterniflora: Concept, technology and practive. Bull. Chin. Acad. Sci. 2023, 38, 1924–1938. (In Chinese) [Google Scholar]
  75. Min, Y.; Cui, L.; Li, J.; Han, Y.; Zhuo, Z.; Yin, X.; Zhou, D.; Ke, Y. Detection of large-scale Spartina alterniflora removal in coastal wetlands based on Sentinel-2 and Landsat 8 imagery on Google Earth Engine. Int. J. Appl. Earth Obs. 2023, 125, 103567. [Google Scholar] [CrossRef]
Figure 1. Map of the study area: the Zhangjiang Estuary is abbreviated as ZJE; the Dandou Sea is abbreviated as DDS.
Forests 15 01788 g001
Figure 2. Distribution maps of mangroves and S. alterniflora in Zhangjiang Estuary from 2005 to 2019. Each mangrove and S. alterniflora detection result is superimposed on Google Earth imagery.
Forests 15 01788 g002
Figure 3. Centroid migration maps of mangroves and S. alterniflora in Zhangjiang Estuary from 2005 to 2019.
Forests 15 01788 g003
Figure 4. Distribution maps of mangroves and S. alterniflora in the Dandou Sea from 2005 to 2019. Each mangrove and S. alterniflora detection result is superimposed on Landsat TM (a) or Google Earth (be) data. The TM image is a false-color composite of band 4 in the red channel, band 3 in the green channel, and band 2 in the blue channel. The Google Earth image is a true-color composite.
Forests 15 01788 g004
Figure 5. Human-induced mangrove distribution changes in the Dandou Sea.
Forests 15 01788 g005
Figure 6. Centroid migration maps of mangroves and S. alterniflora in Dandou Sea from 2005 to 2019.
Forests 15 01788 g006
Figure 7. Temporal changes of mangrove and S. alterniflora landscape indexes in Zhangjiang Estuary (ZJE) and Dandou Sea (DDS). Here, NP denotes Number of Patches, PD denotes Patch Density, LPI denotes Largest Patch Index, LSI denotes Landscape Shape Index, AWMSI denotes Area-weighted Mean Shape Index, DIVISION denotes Landscape Division Index, and AI denotes Aggregation Index.
Forests 15 01788 g007
Figure 8. Spatial expansion patterns of S. alterniflora in Zhangjiang Estuary from 2005 to 2019.
Forests 15 01788 g008
Figure 9. Spatial expansion patterns of S. alterniflora in Dandou Sea from 2005 to 2019.
Forests 15 01788 g009
Table 1. Characteristics of the selected remote sensing images in the two study areas.
Stuy AreaSourceAcquisition DateResolution (m)BandTidal LevelRemark
ZJEGoogle Earth9 August 20050.553LowClassification
Google Earth24 December 20110.553LowClassification
Google Earth31 January 20140.553LowClassification
Google Earth28 February 20160.553LowClassification
Google Earth20 October 20190.553LowClassification
DDSLandsat 521 January 2005307LowClassification
Google Earth31 December 20050.563HighClassification
Google Earth16 October 20090.563LowClassification
Google Earth22 October 20130.563LowClassification
Google Earth8 October 20150.563LowClassification
Google Earth8 December 20190.563LowClassification
Table 2. The formula for the landscape indexes and the ecological significances.
IndicatorFormulaUnitCodeEcological Significance
Class Area
i = 1 n a i
haCACA is the total area of mangrove or S. alterniflora patches, which can influence the species richness, structure, and stability of mangrove or S. alterniflora ecosystems.
Number of Patchesn#NPNP is the total number of mangrove or S. alterniflora patches, which can reflect the landscape fragmentation degree.
Patch DensityNP/A#/haPDPD represents the number of mangrove or S. alterniflora patches per unit area, reflecting the fragmentation and heterogeneity of the mangrove or S. alterniflora landscape.
Largest Patch Index
m a x ( a i j ) A × 100
%LPILPI reflects the concentration degree of patches, and indirectly describes the interference of anthropogenic activities.
Landscape Shape Index
0.25 P i j a i j
-LSILSI indicates the shape complexity of mangrove or S. alterniflora patches, and indirectly reflects the influence of human disturbance activities. The higher the value, the more scattered the patch distribution.
Area-weighted Mean Shape Index
i = 1 m [ 0.25 P i j a i j a i A ]
-AWMSIAWMSI indicates the heterogeneity of mangrove or S. alterniflora patches. The higher the value, the more complex the shape of the patches.
Landscape Division Index
[ 1 i = 1 m j = 1 n ( a i j A ) ( a i j A ) ]
-DIVISIONDIVISION represents the separation degree of mangrove or S. alterniflora patches. The value is close to 1 (0) when the patch composition is complex (simple).
Aggregation Index
[ i = 1 m g i i m a x g i i Q i ] × 100
%AIAI describes the connectivity among mangrove or S. alterniflora patches. The lower the value is, the more scattered the patches.
Splitting Index
A 2 1 m a i 2
-SPLITSPLIT represents the dispersion and aggregation degree of S. alterniflora patches. The higher the value, the more dispersed the patches.
Table 3. Detection accuracies in Zhangjiang Estuary (ZJE) and Dandou Sea (DDS).
ZJEYear20052011201420162019
Overall Accuracy95%95%96%97%92%
Kappa0.930.940.950.960.90
DDSYear20052009201320152019
Overall Accuracy95%96%92%94%97%
Kappa0.940.950.900.930.96
Table 4. Mangrove and S. alterniflora areas from 2005 to 2019, and the area changes during different stages in the Zhangjiang Estuary.
YearMangrovesS. alterniflora
Area/hm2Annual Change Rate/%Annual Expansion Rate/%Area/hm2Annual Change Rate/%Annual Expansion Rate/%
200556.22//67.14//
201157.000.230.2368.830.420.42
201457.930.540.5487.719.148.42
201659.401.271.26120.4818.6817.2
201965.253.283.18232.2330.9224.45
Table 5. Areas of mangroves and S. alterniflora from 2005 to 2019 and the area changes during different stages in the Dandou Sea.
YearMangrovesS. alterniflora
Area/hm2Annual Change Rate/%Annual Expansion Rate/%Area/hm2Annual Change Rate/%Annual Expansion Rate/%
2005475.78//144.21//
2009493.240.920.91278.3423.2517.87
2013486.20−0.36−0.36364.877.777.00
2015475.12−1.14−1.15367.760.400.40
2019475.410.020.02372.490.320.32
Table 6. Distribution statistics of LEI on different intervals in Zhangjiang Estuary.
YearExpansion
Pattern
LEI Interval DistributionNumber of PatchesProportion of Total NumberArea/hm2AWMSISPLIT
2005–2011Marginal expansion 1LEI < 014037.74%12.762.60689.4
Marginal expansion 2LEI ≥ 04111.05%18.953.7438.7
External expansionLEI = 119051.21%5.382.371010.17
2011–2014Marginal expansion 1LEI < 011422.71%8.273.041167.52
Marginal expansion 2LEI ≥ 0326.37%19.485.5532.88
External expansionLEI = 135670.92%5.761.581864.15
2014–2016Marginal expansion 1LEI < 01187.99%5.162.634909.22
Marginal expansion 2LEI ≥ 01167.86%21.634.37122.51
External expansionLEI = 1124284.15%14.651.861117.57
2016–2019Marginal expansion 1LEI < 010923.59%10.13.188556.01
Marginal expansion 2LEI ≥ 012527.06%107.2313.337.73
External expansionLEI = 122849.35%4.741.5437,135.2
Table 7. Distribution statistics of LEI on different intervals in Dandou Sea.
YearExpansion PatternLEI Interval
Distribution
Number of PatchesProportion of the Total NumberArea/hm2AWMSISPLIT
2005–2009Marginal expansion 1LEI < 020717.92%36.872.82334.78
Marginal expansion 2LEI ≥ 0181.56%18.942.57273.91
External expansionLEI = 193080.52%98.932.48128.22
2009–2013Marginal expansion 1LEI < 078056.03%34.563.31204.78
Marginal expansion 2LEI ≥ 034224.57%47.614.39191.16
External expansionLEI = 127019.40%38.261.68169.54
2013–2015Marginal expansion 1LEI < 0157280.91%29.852.52507.38
Marginal expansion 2LEI ≥ 021411.01%11.152.64400.76
External expansionLEI = 11578.08%3.841.614087.52
2015–2019Marginal expansion 1LEI < 097054.80%36.263.311000.46
Marginal expansion 2LEI ≥ 039422.26%57.915.1590.3
External expansionLEI = 140622.94%12.161.883246.62
Disclaimer/Publisher’s Note: The statements, opinions and data contained in all publications are solely those of the individual author(s) and contributor(s) and not of MDPI and/or the editor(s). MDPI and/or the editor(s) disclaim responsibility for any injury to people or property resulting from any ideas, methods, instructions or products referred to in the content.

