Abstract
(1) Background: Moso bamboo (Phyllostachys edulis (Carrière) J. Houz.) expansion has seriously altered the species composition and structure of adjacent forest ecosystems in subtropical regions. However, the shift in phosphorus (P) biogeochemical cycling has yet to be assessed, which is a critical gap considering the great variation in ecophysiological properties between invasive bamboo and the displaced native tree species. (2) Methods: We investigated and compared expansion-induced changes in P pools (plant, litter, and soil) and P fluxes (plant uptake and litterfall return) using paired sampling of the bamboo-dominated forest (BDF) and secondary evergreen broadleaved forest (EBF) at Jiangxi province’s Dagang Mountain National Forest Ecological Station. (3) Results: Both the P storage of the plants and litter were significantly greater by 31.8% and 68.2% in the BDF than in the EBF, respectively. The soil total P and available P storage were 28.9% and 40.4% lower, respectively, in the BDF than in the EBF. Plant P uptake was 15.6% higher in the BDF than in the EBF, and the annual litter P return was 26.1% lower in the BDF than in the EBF due to higher P resorption efficiency for moso bamboo compared with evergreen broadleaved tree species. The ecosystem P cycling rate was reduced by 36.1% in the BDF compared with the EBF. (4) Conclusions: Moso bamboo expansion slowed the broadleaved forest ecosystem’s P cycle rate, likely because moso bamboo has higher P-use efficiency, reserving more P in its tissues rather than returning it to the soil. The results from this study elucidate an understudied element cycle in the context of forest succession, demonstrating the ecosystem consequences related to bamboo invasion.
1. Introduction
Phosphorus (P) is a vital structural and functional component in plants. It exists in living cells as phosphate, is used in synthesizing essential biomolecules such as ATP, nucleic acids, and proteins, and directly impacts plant growth and development [1]. The P cycle is one of the most complex cycles in forest communities, and it is responsible for a series of key biogeochemical processes [2]. The pools and fluxes of the P cycle are easily affected by the community composition through various processes, including plant uptake, biomass distribution, plant P-use efficiency, and leaf litter decomposition [3,4]. Under natural conditions, the P cycle is in a dynamic equilibrium in forest ecosystems. However, biological invasion or community succession can affect the ecological processes associated with the P cycle, which in turn can disrupt the P cycle’s equilibrium in the original forest environment [5,6].
Approximately 70% of China’s bamboo forest area is made up of the native gigantic bamboo known as moso bamboo (Phyllostachys edulis (Carrière) J. Houzeau), which is extensively dispersed in subtropical climates. [7,8]. The rapid growth and aggressive clonal reproduction of this bamboo species provide it with great potential for expansion into nearby secondary forests. [9]. In recent decades, such expansion has been regularly noted in both native and imported regions (such as China and Japan), which has contributed to the global rise in the cover of bamboo forests [10]. The phenomenon of bamboo expansion has raised increasing attention from both the society community and the public due to a series of cascading effects, such as reduced biodiversity and increased soil erosion [11,12]. Evergreen broadleaved forests, the native vegetation of subtropical China, play a pivotal role in the maintenance of forest productivity, biodiversity, and ecological balance [13,14]. Currently, native evergreen broadleaved forests are suffering from serious interference from the expansion of moso bamboo, since they are secondary forests that have regenerated from previous destruction by natural disasters or human activities [10,15].
The spread of moso bamboo displaced broadleaved tree species, leading to the formation of monocultures. [16,17]. This shift in the community composition of forests may lead to changes in the pools and fluxes of the P cycle for invaded ecosystems because of the differential organ P content for moso bamboo compared to trees [18,19] but also because broadleaved trees and moso bamboo have different biomass allocations [20]. Furthermore, it has been demonstrated that moso bamboo expansion would change the quality of leaf litter, the soil microbial community’s habitat [21], and the litter’s subsequent decomposition process [22,23]. Moso bamboo’s fine roots also differ from those of broadleaved trees in that they use a flexible strategy for absorbing nutrients. [24]. Therefore, moso bamboo expansion may also lead to changes in the plant P uptake and litterfall P return to the soil in the recipient ecosystem. Wu et al. (2018) demonstrated that following the expansion of moso bamboo into nearby coniferous forests, the total soil P pool decreased and the available soil P pool increased. [25]. Yang et al. (2024) found that moso bamboo expansion into broadleaved forests decreased the soil HCl-P and CaCl2-P content but increased the total soil P pool [26]. However, these previous studies only focused on one or partial sections of the forest P cycle rather than the overall cycle. Consequently, it is necessary for us to provide an overall evaluation of the P cycle in the context of bamboo expansion.
In this paper, we selected typical moso bamboo-dominated forests (hereafter “BDF”) and secondary evergreen broadleaved forests (hereafter “EBF”) to thoroughly examine how the expansion of moso bamboo affects the P cycle in the forest ecosystem. Our specific objectives were to (1) quantify the P storage in plant tissues, litter, and soil, (2) examine plant P uptake and litter P return to the soil, and (3) determine the P-use efficiency in the BDF and EBF. Given the large amount of the root biomass for moso bamboo relative to the trees that make up the BDF, our hypothesis was that the expansion of bamboo would bring about (a) higher P uptake and P storage in plant tissues, (b) a lower P return from the leaf litter and a lower soil P pool in the recipient BDF ecosystem, and (c) a lower forest P cycling rate and higher P-use efficiency. This study not only provides important contextual information for assessing how the expansion of moso bamboo affects broadleaved evergreen forests ecologically but also has implications for evaluating the impact of vegetation alterations on the biogeochemical P cycle in the presence of plant invasion.
2. Methods
2.1. Study Site
This study was carried out at Dagangshan National Forest Ecological Station, situated in a mountainous region in Jiangxi Province, South China (27°30′–27°50′ N, 114°30′–114°45′ E). This region has a middle subtropical climate with monsoon activity. It has humid, rainy summers and cold, dry winters. The mean annual temperature ranges from 15.8 to 17.7 °C, with January and July having the lowest and highest temperatures of −8.3 °C and 39.9 °C, respectively. The annual mean precipitation is 1591 mm, with 80% of that falling between March and August. Based on the Chinese soil classification system, the soils in this region are categorized as mountain red and yellow varieties [27]. The climate and soil environments provide suitable potential habitats for bamboo growth. Moso bamboo is also widely distributed at this site, and it has aggressively expanded into areas historically occupied by diverse native EBF [20,28]. Therefore, this site is an ideal place to explore the changes in the P pools and fluxes in the context of conversion from EBF into BDF forest. We randomly selected three paired stands straddling unexpanded EBF (greater than 80% coverage with Castanopsis fargesii Franch., Castanopsis sclerophylla (Lindl.) Schottky, Symplocos theophrastifolia Siebold & Zucc, and Schima superba Gardner & Champ., making up the majority of the canopy layer), and BDF (moso bamboo predominates with some indigenous broadleaved trees, including S. theophrastifolia, C. fargesii, and C. sclerophylla) in August 2011. The moso bamboo invaded the EBF around thirty years ago, becoming the BDF [20]. Occasionally, the BDF’s dead and old (>10 a) bamboos were taken for housing or fuel. No fertilization was performed at each site. In every stand, we set up a 20 m × 20 m plot with similar terrain, soil parent material, and historical plant community structure. This design enabled us to infer that the changes in the current P biogeochemistry cycle resulted from moso bamboo expansion. The stand density, height, and basal areas for EBF observed by Song et al. [20] were 1031 stems ha−1, 13.1 m, and 22.3 m2 ha−1, respectively. Those corresponding indicators in the BDF were 5379 stems ha−1, 12.9 m, and 46.2 m2 ha−1, respectively [20].
2.2. P Pool and Flux Estimation
We sampled fresh and senescent leaves, branches, stems, and coarse roots of the main plant species (C. fargesii, C. sclerophylla, S. theophrastifolia, S. superba, Quercus chenii Nakai, and moso bamboo) to determine the P concentrations in these pools of each stand in August 2011. For every species, we gathered three mature, healthy trees from each plot. The sampled trees had a breast diameter of 5–10 cm and a height of 5–10 m. Nine samples for each tissue of each species were collected from the BDF and EBF types. As the nutrient concentration of moso bamboo organs is significantly influenced by the culm age [29], we sampled aboveground tissues from the current-year bamboo shoots and those older than 1 year separately. All the samples were oven-dried at 70 °C in the laboratory and then pulverized and ground using a ball mill (JXFSTPRP-48L, Shanghai Jingxin Industrial Development Co., Ltd., Shanghai, China). There were three root samples collected from 0–20 cm of soil in each plot to monitor the P concentration. The treatment of the fine root samples was the same as that of the plant samples. Fine root biomass was obtained in the study of Liu et al. [24], whose plots and plant sampling times were the same with this study. The molybdate-blue method was used to determine the total plant P content, which involved digesting 0.25 g of sample in 5 mL of concentrated H2SO4 with a catalyst combination (CuSO4, K2SO4). The leaf P resorption efficiency (PRE) was calculated according to Killingbeck [30].
We collected three 0–20 cm soil samples each month from 2011 to 2012 in each plot to determine the soil P content. In a ventilation room, there were 432 soil samples (3 soil samples × 3 plots × 2 stand types × 12 months × 2 years = 432) that were air-dried to a constant weight. The roots and stones were removed. The samples were then ground in a mortar and passed through a 2 mm sieve. The total P content was determined using the molybdate-blue method. The soil available P fractions were measured sequentially using a modified Hedley procedure [31,32], including the following summarized steps. (1) Resin-Pi: 0.5 g air-dried soil was added to 30 mL of deionized water plus 0.4 NaHCO3 anion exchange resin in a nylon bag; this solution was then added to a 50 mL capped plastic centrifuge tube and incubated on a shaker for 16 h at 25 °C. P was then recovered from the resin by shaking it for 1 h in 50 mL of 0.5 mol L−1 HCl. (2) NaHCO3-Pi and NaHCO3-Po: The residue from step (1) was incubated on a shaker in 30 mL of 0.5 mol L−1 NaHCO3 solution (pH = 8.5) for 16 h at 25 °C, and each mixture was centrifuged at 12,000× g for 10 min [32]. The supernatant was then filtered through a 0.45 μm Millipore filter, and the inorganic P concentration in the filtrate was colorimetrically determined using the molybdate-blue method [33]. The extracts were digested in concentrated H2SO4 and HClO4 to measure the total P content. The NaHCO3-Po content in the extracts was calculated by the total P concentration minus the NaHCO3-Pi concentration. The soil P content was the mean of the concentration of each month in each stand.
The formulas listed below were used to calculate the P pools [34]:
Plant P pool = Biomass × Tissue P content;
Litter P pool = Litter storage × Litter P content;
Soil total P (STP) pool = STP content × Bulk density × Soil depth;
Available P (AP) pool = AP content × Bulk density × Soil depth.
In these formulae, the values of the aboveground and belowground biomass for the trees and bamboo were obtained from Song et al. (2017) [20]. The values of the standing aboveground litter were obtained from Song et al. (2016) (EBF: 2.26 t ha−1; BDF: 2.87 t ha−1) [35], and Liu et al. (2013) provided those for the belowground litter (rhizome, coarse and fine roots) dry weight (EBF: 3.2 t ha−1; BDF: 13.15 t ha−1) [24].
The following formulae were used to estimate the main P fluxes [36]:
Plant P uptake = Net primary production (NPP) × P content;
Litter P return = (L+F) × P content;
P cycling rate = Litter P return/P uptake.
The data for the NPP were obtained from the reference of Song et al. (EBF: 19.8 t ha−1 yr−1; BDF: 30.0 t ha−1 yr−1) [20]. L was the annual aboveground litterfall production obtained from Song et al. (2016) (EBF: 9.09 t ha−1 yr−1; BDF: 5.82 t ha−1 yr−1) [35], and F was the annual growth of the fine root obtained from Liu et al. (2013) (EBF: 1.31 t ha−1 yr−1; BDF: 9.46 t ha−1 yr−1) [24].
The ecosystem P-use efficiency fluxes were estimated using the following equation [37]:
P-use efficiency = NPP/annual P uptake
All of these standing storage estimations for P are given in terms of the oven-dry weight per hectare. The P cycling rate is calculated annually as the weight per hectare.
2.3. Statistical Analysis
We used the analysis of variance (ANOVA) to detect differences in the pools, fluxes, and P-cycles between the EBF and BDF. Before the ANOVA, the homogeneity of variance for the data was tested using Levene’s test, and the data that failed to pass the test were converted into homogeneity by the way of logarithmic, square root, or reciprocal. The P content of the plant tissues (stems, branches, leaves, and roots) and the P resorption efficiency between the moso bamboo and other trees were compared using the least significant difference test (LSD). For all the tests, we applied a p of 0.05 to infer statistical significance. Origin 2017 was used to construct the graphics, and SPSS 24.0 was used for all the statistical analyses.
3. Results
3.1. P Content
3.1.1. P Content in Plants
The P content of bamboo shoots and trees was found in the following order: leaves > branches > stems and coarse roots. The P content of all the plant tissues (except the leaves) for moso bamboo was significantly higher between the current shoots and the old bamboo shoots (>1a; Table 1). The P content of the bamboo leaves was higher than that of the trees. The other tissues of the old bamboo shoots contained a similar P content compared to the corresponding tissues of the broadleaved trees.

Table 1.
Mean P content of various plant tissue types (g kg−1, dry matter) in bamboo and broadleaved trees.
3.1.2. P Content in Litter and P Resorption Efficiency
The litter P concentration for the BDF was significantly lower than that of the EBF. Moso bamboo had the lowest P concentration (0.36 g kg−1) among all the species in the BDF and EBF stands. The leaf litter P content of the trees, except for C. sclerophylla in the BDF, was lower in the EBF. With respect to the P resorption efficiency (PRE), there were also statistical differences among the species. The PRE of moso bamboo was 70.6%, which equated to 9.0% to 41.1% higher than the PRE of the trees, regardless of whether they were in the EBF or the BDF (Table 2).
Table 2.
Leaf litter P content and P resorption efficiency (PRE) for main species in the bamboo-dominant forest (BDF) and secondary evergreen broadleaved forest (EBF).
3.1.3. Soil P Content
Along with the conversion of EBF to BDF, the total soil P content decreased by 21.9%, with the value decreasing from 0.32 g kg−1 in the EBF to 0.25 g kg1 in the BDF. The P content of each component (Resin-P, NaHCO3-Pi, and NaHCO3-Po) was also significantly reduced. Furthermore, the total available soil P content (Resin-P + NaHCO3-Pi + NaHCO3-Po) decreased by 32.8% (Table 3).
Table 3.
Soil chemical properties for bamboo-dominant forest (BDF) and secondary evergreen broadleaved forest (EBF).
3.2. Ecosystem P Pool
3.2.1. Plant P Pool
Compared to the EBF (66 kg P ha−1), the plant P pool in the BDF (87 kg P ha−1) was 31.8% greater (F = 26.05, p = 0.027; Figure 1). The two stands showed different P spatial allocation patterns (Figure 1a). The plants of the EBF and the BDF had equally distributed P in the aboveground tissues (F = 1.09, p = 0.355); however, compared with the EBF, the underground plant P pool in the BDF was 193.5% higher than that of the EBF (F = 72.22, p = 0.001). Additionally, bamboo accounted for 72.0% P in the BDF (61 kg P ha−1), while P storage in the trees decreased by 40 kg ha−1 from the EBF to the BDF (Figure 1b).
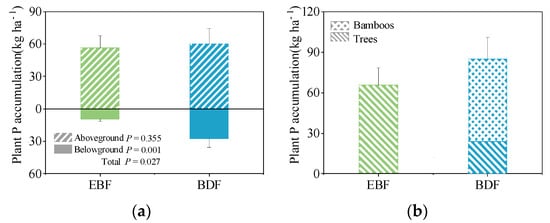
Figure 1.
The P allocation for the plant pool (kg P ha−1) of secondary evergreen broadleaved forest (EBF) and bamboo-dominant forest (BDF). (a) spatial allocation patterns of P accumulation; (b) species allocation patterns of P accumulation. The data are given as the mean ± SD, with SD representing the standard deviation (n = 3).
3.2.2. Litter P Pool
The conversion of EBF to BDF resulted in a significant rise in the total litter P pool (2.2 kg P ha−1 compared to 3.7 kg P ha−1, respectively; F = 6.83, p = 0.040). The largest contribution of belowground litter to the BDF is shown in Figure 2, where it was 127.2% greater than that of the EBF. With regard to the aboveground P component, there was no significant difference between the litter P storage pool in the BDF and EBF.
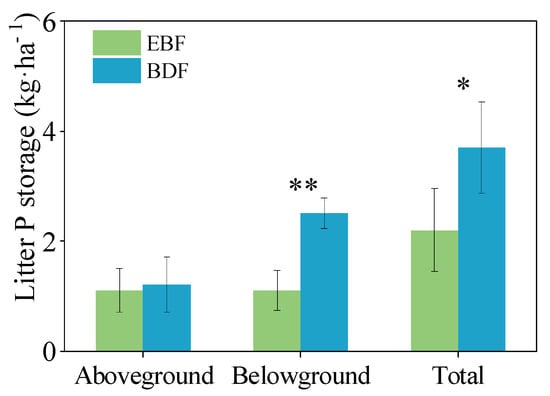
Figure 2.
P allocation of litter pool (kg P ha−1) in the secondary evergreen broadleaved forest (EBF) and bamboo-dominant forest (BDF). The data are given as the mean ± SD, with SD representing the standard deviation (n = 3; * p < 0.05; ** p < 0.01).
3.2.3. Soil P Pool
The total soil P pool and available P pool were both significantly lower in the BDF than in the EBF (F = 18.21, p = 0.045; F = 29.53, p < 0.001; respectively), with a decrease of 40.4% for the available soil P pool in the EBF (34 kg P ha−1) compared to the BDF (57 kg P ha−1) (Figure 3).
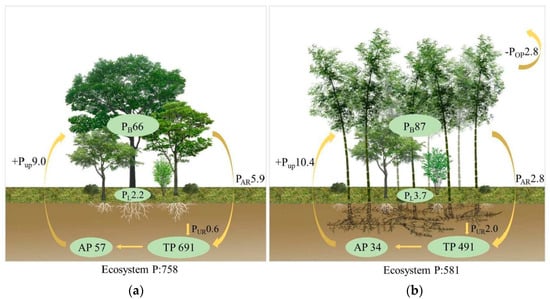
Figure 3.
The P pools (kg ha−1) and P fluxes (kg ha−1 a−1) for secondary evergreen broadleaved forest (EBF) and bamboo-dominant forest (BDF). (a) evergreen broadleaved forest, EBF, and (b) bamboo-dominant forest, BDF. P pools included plant biomass (PB), standing litter (PL), and soil total P (TP) and available P (AP) within 0–20 cm. P fluxes included annual plant P uptake (+PUP) and P return by litter (PAR is the return by aboveground litterfall, PUR is the P return from the underground fine root mortality), and POP is the logging output of BDF.
3.3. Ecosystem P Fluxes
3.3.1. Ecosystem P Cycle Rate
The annual P uptake of the belowground pool was 1.0 kg P ha−1 yr−1 in the EBF and 3.9 kg P ha−1 yr−1 in the BDF, which was 74.4% lower for the EBF (F = 266.77, p = 0.004). P uptake by the aboveground pool of the EBF was 23.2% higher than that of the BDF pool (F = 9.47, p = 0.037). In terms of the total amount, there was no significant difference in P uptake between the BDF and the EBF (F = 5.96, p = 0.061) (Figure 4).
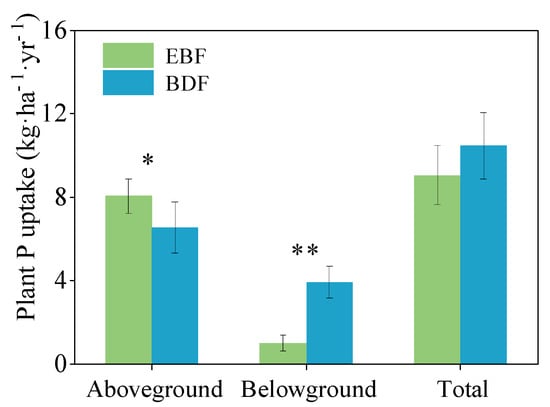
Figure 4.
Annual P uptake for secondary evergreen broadleaved forest (EBF) and bamboo-dominant forest (BDF). The data are given as the mean ± SD, with SD representing the standard deviation (n = 3; * p < 0.05; ** p < 0.01).
The pool of leaf litter P return to soil was significantly lower in the BDF (2.8 kg P ha−1 yr−1) than in the EBF (5.9 kg P ha−1 yr−1). In contrast, the belowground root return was higher in the BDF (2.0 kg P ha−1 yr−1) than in the EBF (0.6 kg P ha−1 yr−1) (F = 11.24, P = 0.041), representing a decrease of 26.2% for the BDF (Figure 3). The ecosystem P cycling rate (calculated as the ratio of P return to P uptake) was 36.1% lower in the BDF than in the EBF, with values of 0.46 and 0.72 in the BDF and EBF, respectively (Figure 5). Ultimately, about 2.8 kg P ha−1 yr−1 of P was produced by the BDF as a result of harvesting old or dead bamboo.
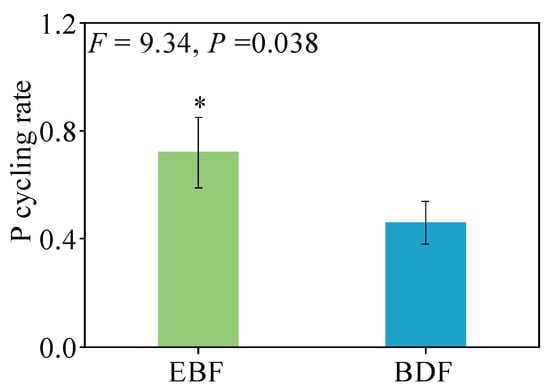
Figure 5.
The ecosystem P cycling rate for bamboo-dominant forest (BDF) and secondary evergreen broadleaved forest (EBF) in Dagang Mountain National Forest Ecological Station, Jiangxi Province, China. The data are given as the mean ± SD, with SD representing the standard deviation (n = 3; * p < 0.05).
3.3.2. Ecosystem P-Use Efficiency
The P-use efficiency (calculated as the ratio of NPP to annual P uptake) for the EBF and the BDF was 2197 and 2861, respectively. The calculation showed that the ecosystem P-use efficiency of the BDF was significantly higher than that of the EBF (Figure 6).
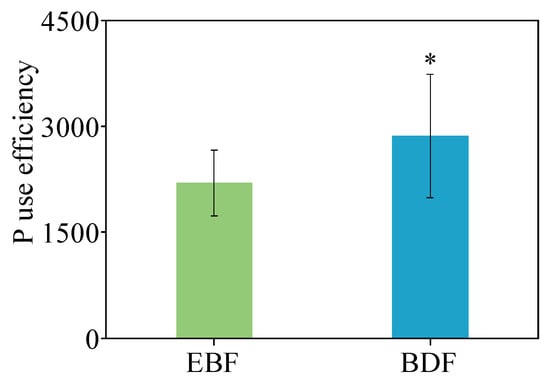
Figure 6.
P-use efficiency of bamboo-dominant forest (BDF) and secondary evergreen broadleaved forest (EBF). Data are expressed as the mean ± SD; SD is the standard deviation (n = 3; * p < 0.05).
4. Discussion
4.1. Changed Plant P Pool after Moso Bamboo Expansion
The expansion of moso bamboo into neighboring forests is one of the most serious ecological problems in subtropical China [38], which has changed the composition and diversity of plant communities [16,17,39], thus affecting the P cycle of the ecosystem. This study suggested that moso bamboo expansion caused a series of changes in the ecosystem P cycle of EBF because of differences in ecophysiological properties in moso bamboo and broadleaved trees. The plant P storage increased after moso bamboo expansion (Figure 1b). The biomass and P content of plants are the indexes responsible for P storage. A previous study showed that there was no significant difference in the biomass between the BDF and the EBF [20]; however, the results from this study indicated that the total tissue P content of moso bamboo was higher compared to broadleaved trees (Table 1). Therefore, once most of the broadleaved trees were replaced by moso bamboo after bamboo expansion, the plant P pool of the forest ecosystem increased. Furthermore, we discovered that following the transformation of EBF into BDF, the belowground component of the plant P pool significantly increased (Figure 1a). These results have two possible explanations. First, the roots of the moso bamboo had a higher P content (Table 1). Second, the BDF showed a higher percentage of belowground biomass compared to the EBF. A previous study found that the ratio of aboveground biomass to belowground biomass shifted from 4.1 in the EBF to 2.1 in the BDF after moso bamboo expansion, indicating that the belowground biomass increased significantly [20], which led to an increase in the belowground plant P pool in bamboo stands. In summary, this is consistent with our first hypothesis that the expansion of bamboo would bring about higher P uptake and P storage in plant tissues.
4.2. Decreased Leaf Litter P Return and Soil P Pool after Moso Bamboo Expansion
Numerous studies found that moso bamboo expansion significantly altered the soil P status and dynamics. Xia et al. (2022) reported that moso bamboo expansion into broadleaved forests increased the mass fraction of soil total P and available P [40]. According to Wu et al. (2018), the expansion of moso bamboo into nearby Cryptomeria japonica (Thunb. ex L. f.) D. Don stands further reduced the total P content of the soil but raised the concentration of available P. [25]. In this publication, the leaf litter P pool increased (Figure 2) and the available soil P pool decreased (Figure 2 and Figure 3) following the expansion of moso bamboo, which is consistent with our second hypothesis that the expansion of bamboo would bring about a lower soil P pool in the recipient BDF ecosystem. The soil P cycle is a sedimentary cycle, and the decomposition of leaf litter will affect the size of the available soil P pool in a short period of time [41]. The significant decrease in annual litter return combined with the increase in the litter P pool (Figure 2) suggests that the decomposition of litter in the stand is inhibited by the expansion of moso bamboo. Litter decomposition is related to litter quality. It is generally accepted that the lower the litter quality (i.e., low N and P content, high C:N and C:P ratios), the slower the decomposition rate [42]. By combining previous data [35] with the results from this paper, the litter leaf N and P content of the stand decreased by 20% and 28%, respectively, and C:N and C:P increased by 19% and 35% after the expansion of moso bamboo, respectively. This decreased litter quality may lead to slower litter decomposition, which in turn would increase the P storage in the litter layer. Furthermore, the enzymatic activity and composition of the microbial community impact the decomposition of litter material. Previous studies found that moso bamboo expansion led to a decrease in soil microbial richness and diversity [43,44] and a decrease in soil phospholipid fatty acids, soil cellulase, and xylanase activities [44,45,46,47], which may also contribute significantly to the reduced rate of litter decomposition. Thus, we hypothesize that the low quality of litter and the changes in the microbial community structure and function after moso bamboo expansion would reduce the decomposition rate of litter and reduce P input to the soil, leading to the accumulation of P in the litter pool and reduced P in the soil pool.
4.3. Reduced P Cycle Rate after Moso Bamboo Expansion
The larger the nutrient cycling flux, the faster the cycling rate. In this paper, the P cycling rate of forest ecosystems slowed down after the expansion of moso bamboo (Figure 5; 0.72 for EBF and 0.46 for BDF), which supported our third hypothesis. The P cycling rate in this paper is the ratio between P return and P uptake. It has been shown that the acquisition of P is closely related to the plant root system [48]. A previous study found that moso bamboo had a well-developed underground flagellar root system with a high fine root biomass, a long specific root size, and a fast growth rate compared to broadleaved trees [24]. It is hypothesized that after native broadleaved trees were replaced by moso bamboo, the root surface area for P uptake in the stand would increase, effectively reducing the distance of P to the root system and greatly increasing the efficiency of P uptake. Collectively, this could lead to increased P uptake in the belowground portion of the stand after moso bamboo expansion.
Nutrient return is determined by the starting nutrient content of leaf litter, which is related to the resorption efficiency of leaves [49]. In this research, the P resorption efficiency of leaves was significantly higher in moso bamboo than in broadleaved trees (i.e., 70.6% in moso bamboo and 11%~41% in trees). Therefore, we hypothesized that more P would be reabsorbed by the plant rather than returning to the soil, thus reducing the amount of P returned to the soil. In addition, the P reabsorbed by leaves may also be transferred to other plant tissues or individuals through physiological integration, and P can be recycled repeatedly within the bamboo system [50]. This not only prolongs the time that P persists in the plant P pool before it returns to the soil P pool, slowing down the ecosystem P cycling, but also reduces P consumption and improves the efficiency of P utilization by moso bamboo. The results in this study support this mechanistic interpretation (Figure 6; PUE for EBF: 2197, PUE for BDF: 2861). In conclusion, the strong nutrient uptake capacity of roots coupled with the high P resorption efficiency of leaves for the clonal moso bamboo system is responsible for decreased P cycling in forest ecosystems after moso bamboo expansion. This is consistent with our third hypothesis that the expansion of bamboo would bring about a lower forest P cycling rate and higher P-use efficiency.
5. Conclusions
This paper evaluated the biological P cycle through P pools of moso bamboo forest and invaded evergreen broadleaved forest. The obtained results demonstrated that moso bamboo expansion into broadleaved forest ecosystems leads to (1) an increase in the plant P pool, especially the belowground portion of the pool; (2) an increase in the P litter pool and a decrease in the available P in the soil pool; and (3) an increase in the forest P-use efficiency and a reduced forest P cycling rate. The reason is mainly because of the greater nutrient uptake capacity and higher nutrient use efficiency of moso bamboo compared to broadleaved trees. Moso bamboo retains more P in plant tissues rather than releasing P through leaf litter fall, resulting in the suppressed decomposition of litter and decreased soil P storage. This study is based on observations from a single site; however, factors such as the stand age and bamboo expansion intensity may bring some uncertainty to the results. Therefore, in the future, it could be possible to choose long-term monitoring and take into account those influencing factors to monitor the dynamic changes in the ecosystem P cycle coupled with moso bamboo expansion. This study not only provides an important basis for the evaluation of the ecological consequences of moso bamboo expansion and the encroachment into neighboring forests but also deepens our understanding of the important nutrient invasion mechanism of moso bamboo.
Author Contributions
S.S. conceived and designed the experiments, analyzed the data, prepared the figures and tables, and authored the initial draft of the article. L.W. took part in the data analysis and created the tables and figures. J.L. and Z.G.C. analyzed or interpreted the data, authored aspects of the manuscript, and reviewed drafts of the article. T.X., C.L., D.H., and Q.Y. assisted with the data collection and analysis. Q.S. conceived and designed the experiments, authored aspects of the manuscript, and reviewed drafts of the article. All authors have read and agreed to the published version of the manuscript.
Funding
This work was supported by the National Natural Science Foundation of China (32360801, 32060319, 42067050) and the 1000 Talents Plan award of Jiangxi province (jxsq2020101079).
Data Availability Statement
The data are available upon request.
Conflicts of Interest
The authors declare no conflicts of interest.
References
- Santoro, V.; Schiavon, M.; Celi, L. Role of Soil Abiotic Processes on Phosphorus Availability and Plant Responses with a Focus on Strigolactones in Tomato Plants. Plant Soil 2024, 494, 1–49. [Google Scholar] [CrossRef]
- Schipanski, M.E.; Bennett, E.M. The Phosphorus Cycle. In Fundamentals of Ecosystem Science, 2nd ed.; Weathers, K.C., Strayer, D.L., Likens, G.E., Eds.; Academic Press: Salt Lake City, UT, USA, 2021; Volume 9, pp. 189–213. ISBN 978-0-12-812762-9. [Google Scholar]
- Ruttenberg, K.C. The Global Phosphorus Cycle. In Treatise on Geochemistry, 2nd ed.; Holland, H.D., Turekian, K.K., Eds.; Elsevier Science Ltd.: Amsterdam, The Netherlands, 2014; Volume 10, pp. 499–558. ISBN 978-0-08-043751-4. [Google Scholar]
- Sohrt, J.; Lang, F.; Weiler, M. Quantifying Components of the Phosphorus Cycle in Temperate Forests. Wires Water 2017, 4, e1243. [Google Scholar] [CrossRef]
- Zhu, X.Y.; Fang, X.; Wang, L.F.; Xiang, W.; Alharbi, H.A.; Lei, P.F.; Kuzyakov, Y. Regulation of Soil Phosphorus Availability and Composition during Forest Succession in Subtropics. Forest Ecol. Manag. 2021, 502, 119706. [Google Scholar] [CrossRef]
- Luo, X.Z.; Liu, N.; Lambers, H.; Cai, H.Y.; Hou, E.Q.; Huang, Y.; Jian, S.G.; Kuang, Y.W.; Wen, D.Z.; Zhang, L.L. Plant Invasion Alters Soil Phosphorus Cycling on Tropical Coral Islands: Insights from Wollastonia Biflora and Chromolaena Odorata Invasions. Soil Biol. Biochem. 2024, 193, 109412. [Google Scholar] [CrossRef]
- Kuehl, Y. Resources, Yield, and Volume of Bamboos. In Bamboo: The Plant and Its Uses; Liese, W., Köhl, M., Eds.; Springer: Cham, Switzerland, 2015; Volume 4, pp. 91–111. ISBN 978-3-319-14132-9. [Google Scholar]
- Liu, K.W. Distribution of Bamboo Forest Resources and Species for Construction. In Contemporary Bamboo Architecture in China; Liu, K.W., Xu, Q.F., Wang, G., Chen, F.M., Leng, Y.B., Yang, J., Harries, K.A., Eds.; Springer: Singapore, 2022; Volume 1, pp. 1–5. ISBN 978-981-16-8309-1. [Google Scholar]
- Wang, Y.X.; Bai, S.B.; Binkley, D.; Zhou, G.M.; Fang, F.Y. The Independence of Clonal Shoot’s Growth from Light Availability Supports Moso Bamboo Invasion of Closed-Canopy Forest. Forest Ecol. Manag. 2016, 368, 105–110. [Google Scholar] [CrossRef]
- Yang, Q.P.; Yang, G.Y.; Song, Q.N.; Shi, J.M.; Fang, A. Ecological Studies on Bamboo Expansion: Process, Consequence and Mechanism. Chin. J. Plant Ecol. 2015, 39, 110–124. (In Chinese) [Google Scholar] [CrossRef]
- Xu, Q.F.; Liang, C.F.; Chen, J.H.; Li, Y.C.; Qin, H.; Fuhrmann, J.J. Rapid Bamboo Invasion (Expansion) and Its Effects on Biodiversity and Soil Processes+. Glob. Ecol. Conserv. 2020, 21, e00787. [Google Scholar] [CrossRef]
- Ling, Z. Bamboo Expansion and Forest Biodiversity. In Bamboo Expansion: Processes, Impacts, and Management; Ling, Z., Ed.; Springer: Singapore, 2023; Volume 5, pp. 41–57. ISBN 978-981-99-4113-1. [Google Scholar]
- Tang, C.Q. Evergreen Broad-Leaved Forests. In The Subtropical Vegetation of Southwestern China: Plant Distribution, Diversity and Ecology; Tang, C.Q., Ed.; Springer Netherlands: Dordrecht, The Netherlands, 2015; Volume 2, pp. 49–112. ISBN 978-94-017-9741-2. [Google Scholar]
- Wang, X.H.; Kent, M.; Fang, X.F. Evergreen Broad-Leaved Forest in Eastern China: Its Ecology and Conservation and the Importance of Resprouting in Forest Restoration. Forest Ecol. Manag. 2007, 245, 76–87. [Google Scholar] [CrossRef]
- Zheng, A.Y.; Lv, J.H. Spatial Patterns of Bamboo Expansion Across Scales: How does Moso Bamboo Interact with Competing Trees? Landsc. Ecol. 2023, 38, 3925–3943. [Google Scholar] [CrossRef]
- Ouyang, M.; Yang, Q.P.; Chen, X.; Yang, G.Y.; Shi, J.M.; Fang, X.M. Effects of the Expansion of Phyllostachys Edulis on Species Composition, Structure and Diversity of the Secondary Evergreen Broad-Leaved Forests. Biodivers. Sci 2016, 24, 649–657. (In Chinese) [Google Scholar] [CrossRef]
- Bai, S.B.; Zhou, G.M.; Wang, Y.X.; Liang, Q.Q.; Chen, J.; Chen, Y.Y.; Sheng, R. Plant Species Diversity and Dynamics in Forests Invaded by Moso Bamboo (Phyllostachys edulis) in Tianmu Mountain Nature Reserve. Biodivers. Sci. 2013, 21, 288–295. (In Chinese) [Google Scholar] [CrossRef]
- Wang, L.; Ouyang, M.; Song, S.W.; Zeng, X.X.; Song, Q.N.; Liu, J.; Fang, X.; Luan, F.G.; Yang, Q.P. Response of N and P Stoichiometric Characteristics of Evergreen Broad-Leaved Forest Plant Leaf to Phyllostachys edulis Expansion. Guihaia 2023, 43, 1737–1746. (In Chinese) [Google Scholar] [CrossRef]
- Song, S.W.; Ouyang, M.; Liu, J.; Song, Q.N.; Fang, X.; Luan, F.G.; Yang, Q.P. Effects of Phyllostachys edulis Expansion on Soil and Leaf N, P Stoichiometry in Cunninghamia lanceolata Forests. Ecol. Sci. 2024, 43, 1–7. (In Chinese) [Google Scholar] [CrossRef]
- Song, Q.N.; Lu, H.; Liu, J.; Yang, J.; Yang, G.Y.; Yang, Q.P. Accessing the Impacts of Bamboo Expansion on Npp and N Cycling in Evergreen Broadleaved Forest in Subtropical China. Sci. Rep. 2017, 7, 1–9. [Google Scholar] [CrossRef]
- Luo, W.X.; Zhang, Q.Y.; Wang, P.; Luo, J.; She, C.Y.; Guo, X.M.; Yuan, J.J.; Sun, Y.H.; Guo, R.M.; Li, Z.F.; et al. Unveiling the Impacts Moso Bamboo Invasion on Litter and Soil Properties: A Meta-Analysis. Sci. Total Environ. 2024, 909, 168532. [Google Scholar] [CrossRef] [PubMed]
- Dong, H.Y.; Shao, S.; Liang, C.F.; Xu, Q.F.; Chen, J.H.; Qin, H. Impacts of Litter Composition on the Structure and Functional Pathways of Soil Microbial Community during Phyllostachys edulis Expansion. Agronomy 2022, 12, 220. [Google Scholar] [CrossRef]
- Luan, J.W.; Li, S.Y.; Dong, W.; Liu, Y.C.; Wang, Y.; Liu, S.R. Litter Decomposition Affected by Bamboo Expansion is Modulated by Litter-Mixing and Microbial Composition. Funct. Ecol. 2021, 35, 2562–2574. [Google Scholar] [CrossRef]
- Liu, J.; Yang, Q.P.; Song, Q.N.; Yu, D.K.; Yang, G.Y.; Qi, H.Y.; Shi, J.M. Strategy of Fine Root Expansion of Phyllostachys pubescens Population into Evergreen Broad-Leaved Forest. Chin. J. Plant Ecol. 2013, 37, 230–238. (In Chinese) [Google Scholar] [CrossRef]
- Wu, C.S.; Mo, Q.F.; Wang, H.K.; Zhang, Z.J.; Huang, G.X.; Ye, Q.; Zou, Q.; Kong, F.Q.; Liu, Y.Q.; Geoff Wang, G. Moso Bamboo ( Phyllostachys Edulis (Carriere) J. Houzeau) Invasion Affects Soil Phosphorus Dynamics in Adjacent Coniferous Forests in Subtropical China. Ann. For. Sci. 2018, 75, 24–35. [Google Scholar] [CrossRef]
- Yang, D.; Shi, F.X.; Fang, X.M.; Zhang, R.L.; Shi, J.M.; Zhang, Y. Effect of the Moso Bamboo Pyllostachys edulis (Carrière) J.Houz. on Soil Phosphorus Bioavailability in a Broadleaf Forest (Jiangxi Province, China). Forests 2024, 15, 328. [Google Scholar] [CrossRef]
- Wang, B. Research on Forest Biodiversity in Dagangshan, Jiangxi; China Forestry Publishing House: Beijing, China, 2005; ISBN 7503841346. (In Chinese) [Google Scholar]
- Yang, Q.P.; Wang, B.; Guo, Q.R.; Zhao, G.D.; Fang, K.; Liu, Y.Q. Effects of Phyllostachys Edulis Expansion on Carbon Storage of Evergreen Broad-Leaved Forest in Dagangshan Mountain, Jiangxi. Acta Agric. Univ. Jiangxiensis 2011, 33, 529–536. (In Chinese) [Google Scholar] [CrossRef]
- Li, R.; Werger, M.J.A.; During, H.J.; Zhong, Z.C. Carbon and Nutrient Dynamics in Relation to Growth Rhythm in the Giant Bamboo Phyllostachys pubescens. Plant Soil 1998, 201, 113–123. [Google Scholar] [CrossRef]
- Killingbeck, K.T. Nutrients in Senesced Leaves: Keys to the Search for Potential Resorption and Resorption Proficiency. Ecology 1996, 77, 1716–1727. [Google Scholar] [CrossRef]
- Hedley, M.J.; Stewart, J.W.B.; Chauhan, B.S. Changes in Inorganic and Organic Soil Phosphorus Fractions Induced by Cultivation Practices and by Laboratory Incubations. Soil Sci. Soc. Am. J. 1982, 46, 970–976. [Google Scholar] [CrossRef]
- Li, L.; Li, S.M.; Sun, J.H.; Zhou, L.L.; Bao, X.G.; Zhang, H.G.; Zhang, F.S. Diversity Enhances Agricultural Productivity Via Rhizosphere Phosphorus Facilitation on Phosphorus-Deficient Soils. Proc. Natl. Acad. Sci. USA 2007, 104, 11192–11196. [Google Scholar] [CrossRef]
- Lu, R.K. Soil and Agro-Chemistry Analytical Methods; China Agriculture Press: Beijing, China, 2000; ISBN 7-80119-925-1. (In Chinese) [Google Scholar]
- Zhang, Y.W.; Guo, Y.; Tang, Z.; Feng, Y.; Zhu, X.; Xu, W.; Bai, Y.; Zhou, G.; Xie, Z.; Fang, J. Patterns of Nitrogen and Phosphorus Pools in Terrestrial Ecosystems in China. Earth Syst. Sci. Data 2021, 13, 5337–5351. [Google Scholar] [CrossRef]
- Song, Q.N.; Ouyang, M.; Yang, Q.P.; Lu, H.; Yang, G.Y.; Chen, F.S.; Shi, J.M. Degradation of Litter Quality and Decline of Soil Nitrogen Mineralization after Moso Bamboo (Phyllostachys pubscens) Expansion to Neighboring Broadleaved Forest in Subtropical China. Plant Soil 2016, 404, 113–124. [Google Scholar] [CrossRef]
- Tateno, R.; Takeda, H. Nitrogen Uptake and Nitrogen Use Efficiency above and below Ground along a Topographic Gradient of Soil Nitrogen Availability. Oecologia 2010, 163, 793–804. [Google Scholar] [CrossRef]
- Vitousek, P. Nutrient Cycling and Nutrient Use Efficiency. Am. Nat. 1982, 119, 553–572. [Google Scholar] [CrossRef]
- Bai, S.; Conant, R.T.; Zhou, G.; Wang, Y.; Wang, N.; Li, Y.; Zhang, K. Effects of Moso Bamboo Encroachment into Native, Broad-Leaved Forests on Soil Carbon and Nitrogen Pools. Sci. Rep. 2016, 6, 31480. [Google Scholar] [CrossRef]
- Tong, R.; Zhou, B.Z.; Jiang, L.N.; Cao, Y.H.; Xiao, G.G.; Zhen, Y.Y. Influence of Moso Bamboo Invasion on Forest Plants and Soil: A Review. Sheng Tai Xue Bao 2019, 39, 3808–3815. (In Chinese) [Google Scholar] [CrossRef]
- Xia, E.L.; Liu, G.L.; Nong, J.Q.; Wei, S.P.; Liu, X.Z. Changes in Soil Nutrient Characteristics in Moso Bamboo Forest Expanding into Broadleaved Forest. Ecol. Environ. 2022, 31, 1110–1117. [Google Scholar] [CrossRef]
- Schaap, K.J.; Fuchslueger, L.; Hoosbeek, M.R.; Hofhansl, F.; Martins, N.P.; Valverde-Barrantes, O.J.; Hartley, I.P.; Lugli, L.F.; Quesada, C.A. Litter Inputs and Phosphatase Activity Affect the Temporal Variability of Organic Phosphorus in a Tropical Forest Soil in the Central Amazon. Plant Soil 2021, 469, 423–441. [Google Scholar] [CrossRef]
- Yang, K.; Zhu, J.J.; Zhang, W.W.; Zhang, Q.; Lu, D.L.; Zhang, Y.K.; Zheng, X.; Xu, S.; Wang, G.G. Litter Decomposition and Nutrient Release from Monospecific and Mixed Litters: Comparisons of Litter Quality, Fauna and Decomposition Sites Effects. J. Ecol. 2022, 110, 1673–1686. [Google Scholar] [CrossRef]
- Xu, Q.F.; Jiang, P.K.; Wu, J.S.; Zhou, G.M.; Shen, R.F.; Fuhrmann, J.J. Bamboo Invasion of Native Broadleaf Forest Modified Soil Microbial Communities and Diversity. Biol. Invasions 2015, 17, 433–444. [Google Scholar] [CrossRef]
- Tian, X.K.; Wang, M.Y.; Meng, P.; Zhang, J.S.; Zhou, B.Z.; Ge, X.G.; Yu, F.H.; Li, M.H. Native Bamboo Invasions into Subtropical Forests Alter Microbial Communities in Litter and Soil. Forests 2020, 11, 314. [Google Scholar] [CrossRef]
- Chang, E.H.; Chiu, C.Y. Changes in Soil Microbial Community Structure and Activity in a Cedar Plantation Invaded by Moso Bamboo. Appl. Soil Ecol. 2015, 91, 1–7. [Google Scholar] [CrossRef]
- Chang, E.H.; Chen, C.P.; Tian, G.l.; Chiu, C.Y. Replacement of Natural Hardwood Forest with Planted Bamboo and Cedar in a Humid Subtropical Mountain Affects Soil Microbial Community. Appl. Soil Ecol. 2018, 124, 146–154. [Google Scholar] [CrossRef]
- Liu, X.S.; Siemann, E.; Cui, C.; Liu, Y.Q.; Guo, X.M.; Zhang, L. Moso Bamboo (Phyllostachys edulis) Invasion Effects on Litter, Soil and Microbial Plfa Characteristics Depend on Sites and Invaded Forests. Plant Soil 2019, 438, 85–99. [Google Scholar] [CrossRef]
- Wang, Y.; Wang, F.; Lu, H.; Liu, Y.; Mao, C. Phosphate Uptake and Transport in Plants: An Elaborate Regulatory System. Plant Cell Physiol. 2021, 62, 564–572. [Google Scholar] [CrossRef]
- Shah, J.A.; Liu, W.F.; Ullah, S.; Duan, H.L.; Shen, F.F.; Liao, Y.C.; Huang, G.M.; Wu, J.P. Linkages among Leaf Nutrient Concentration, Resorption Efficiency, Litter Decomposition and Their Stoichiometry to Canopy Nitrogen Addition and Understory Removal in Subtropical Plantation. Ecol. Process 2024, 13, 27. [Google Scholar] [CrossRef]
- Zhao, J.C.; Cai, C.J. Physiological Integration Improves Nitrogen Use Efficiency of Moso Bamboo: An Isotopic (15N) Assessment. Forest Ecol. Manag. 2023, 542, 121073. [Google Scholar] [CrossRef]
Disclaimer/Publisher’s Note: The statements, opinions and data contained in all publications are solely those of the individual author(s) and contributor(s) and not of MDPI and/or the editor(s). MDPI and/or the editor(s) disclaim responsibility for any injury to people or property resulting from any ideas, methods, instructions or products referred to in the content. |
© 2024 by the authors. Licensee MDPI, Basel, Switzerland. This article is an open access article distributed under the terms and conditions of the Creative Commons Attribution (CC BY) license (https://creativecommons.org/licenses/by/4.0/).