Abstract
The Bulianta Coal Mine is among the problematic coal mining areas in China that is still creating environmental damage, especially associated with soil destruction. Therefore, a scientific investigation was conducted to establish a scientific basis for evaluating the impact of planted forest on soil physical and chemical properties, as well as the ecological benefits following 15 years of vegetation restoration in the area. The soil physicochemical characteristics and distribution of organic carbon storage in the 0–80 cm layer soils of Pinus sylvestris forests, Prunus sibirica forests, and Hippophae rhamnoides forests restored after 5, 10, and 15 years were investigated. The immersion method was used to determine soil porosity and density followed by the determination of soil indicators, and a statistical ANOVA test was applied to examine the differential effects of different vegetation types and restoration years on soil properties. The results clearly demonstrated the following: (1) The recovery of vegetation was achieved after a period of 15 years, with the average bulk density of the 0–80 cm soil layer as follows: P. sylvestris forest (1.513 g·cm−3) > P. sibirica forest (1.272 g·cm−3) > H. rhamnoides forest (1.224 g·cm−3), and the differences among different forest types were statistically significant (p < 0.05). (2) In planted forests, soil nutrients were predominantly concentrated in the 0–20 cm layer, while soil carbon storage exhibited a decline with an increasing soil depth. (3) The soil carbon storage across the three forest types was as follows: P. sylvestris forest (45.42 t·hm−2) > P. sibirica forest (44.56 t·hm−2) > H. rhamnoides forest (41.87 t·hm−2). In summary, during the ecological vegetation restoration process in the Bulianta Core Mine, both P. sylvestris forest and P. sibirica forest exhibit superior carbon storage capacities compared to H. rhamnoides forest, as well as more effective soil improvement outcomes.
1. Introduction
Currently, the primary coal mining regions in China are predominantly situated in ecologically vulnerable western areas, where there are conflicts between coal extraction and water resources’ and the ecological environment’s preservation [,]. With the comprehensive promotion and application of the concept of green mine construction, mine environmental management and ecological restoration has gradually emerged as a pivotal aspect in safeguarding the ecological environment in China, which has garnered significant attention from scholars [,,]. Driven by the extraction and utilization of coal resources, coal mining inevitably leads to disturbances in the natural surface environment, resulting in frequent instances of land ecological degradation in mining areas, including diminished land productivity, loss of ecosystem functions, and ultimately reduced ecological benefits [,]. Efforts to address these instances of damage are aimed at the effective management and conservation of land resources in regions affected by coal mining subsidence, a reduction in negative impacts of mining operations on the natural environment, and the rehabilitation of ecological conditions in the core mine area. According to Shen et al. (2020), the development of plant life plays a vital role in advancing green sustainable growth and building an ecological civilization in areas impacted by mining activities [].
The implementation of scientifically based vegetation restoration measures and the careful selection of optimal species for ecological rehabilitation can be directed by the goal of achieving synergistic interaction with the local ecosystem, thereby facilitating ecological restoration in coal mining areas []. The restoration of vegetation plays a crucial role in enhancing the physical and chemical properties of soil, mitigating soil and water erosion, augmenting the water and nutrient retention capacity of soil, and bolstering vegetation coverage []. Shen et al. discovered that the growth of plants is intricately linked to the favorable physical and chemical attributes of soil, which directly influence the functional composition and productivity of the ecosystem, serving as a crucial metric for evaluating its stability and resilience []. The soil physical and chemical properties primarily encompass soil density, texture, porosity, and organic matter content, which can accurately depict the soil’s infiltration capacity, air permeability, solute migration potential, and water retention ability. Therefore, it is essential to investigate changes in soil porosity, mechanical composition of the soil, organic matter content, and vegetation type when examining alterations in soil density []. By altering the material composition and properties of soil, vegetation can facilitate the restoration of degraded soil, for instance, by enhancing surface litter and underground root activities and by increasing soil porosity and organic matter input. This process significantly reduces soil density, improves aggregate stability, and enhances the soil water-holding capacity and infiltration performance []. The study conducted by Ding et al. (2007) on reclaimed soil in the Fushun mining area elucidated the variations in soil nutrient content at varying depths. As tillage duration extended, the soil pH value exhibited a continuous decline, whereas the concentrations of available phosphorus, nitrogen, and alkali-hydrolyzed nitrogen showed an upward trend; conversely, with increasing soil depth, the levels of available phosphorus, nitrogen, and alkali-hydrolyzed nitrogen gradually diminished while the pH value increased []. After a period of reforestation, the soil’s physical and chemical properties were enhanced in terms of vegetation, ground cover, leaf litter accumulation, soil organisms, and root activity.
Furthermore, effective control of soil erosion was achieved [,]. Wang et al. (2024) investigated the variations in vegetation and soil physicochemical properties on downslopes of different ages in northwest Shanxi []. As the years of vegetation restoration increased, there was a significant enhancement in the physical, chemical, and biological diversity of forestland. Luo Haibo et al. (2003) conducted three consecutive years of positioning and semi-positioning observation in karst mountain areas, revealing that the return of farmland to forest led to a reduction in soil nutrient loss, decreased soil density, improved soil physical and chemical properties, and reduced soil erosion []. Most studies on soil physical properties are typically limited to the initial few years following the conversion of farmland to forestland, or to long-term assessments of plantation forests using spatiotemporal methods. There is a scarcity of continuous observations for forestland that has been restored for more than 10 years, particularly in terms of long-term positional monitoring at specific sites within each forested area and the investigation of the land’s ongoing changes.
The Bulianta Coal Mine now holds the title of the largest coal mine in the world, and ground collapse occurs around the mine as a result of the high volume of coal extraction []. The subsidence area caused by coal mining in Bulianta is located in the transitional region between the Mu Us Sandy Land and the Loess Plateau. The natural and geographical conditions of this region are challenging, characterized by strong winds, sand deposition, and limited precipitation. This represents an ecologically fragile area with significant agricultural and animal husbandry activities, highlighting the vulnerability of its ecosystem structure and function []. Hence, it seemed imperative to conduct an in-depth analysis and investigation into the ecological integrity of the land in this region. Accordingly, we conducted a comprehensive analysis of the soil physical and chemical properties in the P. sylvestris forest, P. sibirica forest, and H. rhamnoides forest within the coal mining area at 5, 10, and 15 years post-restoration. Our aim was to establish a scientific foundation for evaluating the impact of planted forest on soil physical and chemical properties as well as its ecological contributions following a 15-year period of vegetation restoration.
2. Materials and Methods
2.1. Study Area
The study area is located within the Bulianta Coal Mine (109°45′~110°40′ E, 38°50′~39°50′ N) in Yijin Horo Banner, Ordos City, Inner Mongolia Autonomous Region, China. Official coal mining activities began in this region in October 1997. The mining area covers 101.43 km2 and has an estimated coal extraction potential of 1.345 billion tons. The elevation ranges from 1083 to 1350 m, characterized by an arid to semi-arid temperate continental monsoon climate. The average wind speed varies between 2.5 and 3.6 m/s. The mean annual rainfall is 358.2 mm, predominantly occurring between July and September. This region represents a typical transitional zone in the geomorphological development of the Loess Plateau. The southeastern region is mainly defined by loess hills, while the northwestern part is primarily occupied by windy, sandy terrain. The landscape is generally flat. The region experiences significant soil and wind erosion, with more than 70% of the area affected by wind erosion. The coverage of ground vegetation is only between 4% and 12%, indicating that the ecological environment in the mining zone is highly vulnerable. The implementation of various ecological policies by the government has led to effective management of mining areas, resulting in a notable increase in vegetation coverage. The primary types of vegetation found in the area are Salix psammophila, Artemisia desertorum, Populus simonii, Psammochloa villosa, Amorpha fruticose, and Populus simonii. The soil is deficient in nutrients and comprises chestnut and aeolian soil varieties, with a pH level around 8.5.
2.2. Experimental Design
We employed drone technology to analyze local data and conduct surveys in the local forest and grass area surrounding the Department of Bulianta Coal Mining Area. The flight altitude of the UAV was set at 70 m, with a course overlap ratio of 70% and a side overlap ratio of 80%. Metashape software 2.0 was utilized to stitch images and assess the conditions of the sample site. We investigated the soil physical and chemical properties as well as the distribution characteristics of soil organic carbon storage under the ecological restoration of P. sylvestris forest, P. sibirica forest, and H. rhamnoides forest for 5, 10, and 15 years, where the elevation, slope, parent material, and soil type were similar. The experiment was conducted from July to August 2023, with three 20 m × 20 m quadrats arranged in distinct planted forests as study plots. Soil physical and chemical properties were determined through stratified sampling of soil layers at depths of 0~20 cm, 20~40 cm, 40~60 cm, and 60~80 cm within each sample plot. Additionally, three repeated analysis samples and ring knife samples were randomly collected from different soil layers for indoor determination of the soil pore status and soil density using the immersion method based on the soil physicochemical analysis standard []. Owing to the frequent activity of wind and sand and the harsh ecological conditions in the test area, ground litter in the sample region is minimal, which we measured at approximately 0.5 to 1.5 cm.
2.3. Determination of Soil Indicators
We transported the collected soil samples to the laboratory and employed drying and soaking methods to determine the soil bulk density [] and porosity index. In another investigation, the branches, leaves, and stones in the mixed soil sample were removed and air-dried in a cool location. After grinding and screening, the soil organic carbon (potassium bichromate–dilution heat colorimetric) [], available phosphorus (ammonium fluoride hydrochloric acid extract of molybdenum antimony resistance colorimetric method), available potassium (ammonium acetate flame photometry) [], and available nitrogen (indigo phenol blue colorimetric method) [] were determined.
The formula for calculating soil carbon storage is as follows:
SC (t·hm−2) = C1P1T1/10
In this equation, SC represents the soil organic carbon storage (t·hm−2) at depths of 0–20 cm, 20–40 cm, 40–60 cm, and 60–80 cm. Here, C1 denotes the soil organic carbon content (g·kg−1) of the first layer, P1 indicates the bulk density of the first layer (g·cm−3), and T1 refers to the thickness of the first layer (cm).
2.4. Data Analysis
The data were sorted and summarized using Excel 2023, and a two-factor analysis of variance (ANOVA) with SPSS 22.0 was employed. The variations in soil carbon, nitrogen, and phosphorus (CNP) content and storage across different forest types were analyzed, with the significance of these differences assessed using the least significant difference method (LSD) at a threshold of p < 0.05. The continuous trends in soil physical properties and organic matter content characteristics were visualized using Origin9.0 mapping software.
3. Results
3.1. Soil Physical Property Changes with Restoration Time and Depth
Soil bulk density: The variations in soil bulk density with respect to restoration time across different forest types are depicted in Figure 1. The soil bulk density of the 0–80 cm soil layer decreased over time in different forest types. As soil depth increased, the variability among different forest types also exhibited an upward trend. The soil bulk density of the 0–80 cm soil layer ranked as follows: P. sylvestris forest (1.57 g·cm−3) > P. sibirica forest (1.42 g·cm−3) > H. rhamnoides forest (1.28 g·cm−3). In comparison with 5 years of restoration, over spans of 15 and 10 years, the P. sylvestris forest and P. sibirica forest soil bulk density decreased by 0.12 g·cm−3 and 0.09 g·cm−3, respectively. Meanwhile, H. rhamnoides forest decreased by 0.13 g·cm−3 and 0.07 g·cm−3, respectively, over spans of 15 and 10 years. Overall, the results revealed that the soil bulk density of the 0–80 cm layer following 10 and 15 years of vegetation restoration exhibited a significant improvement compared to that following 5 years of vegetation restoration.
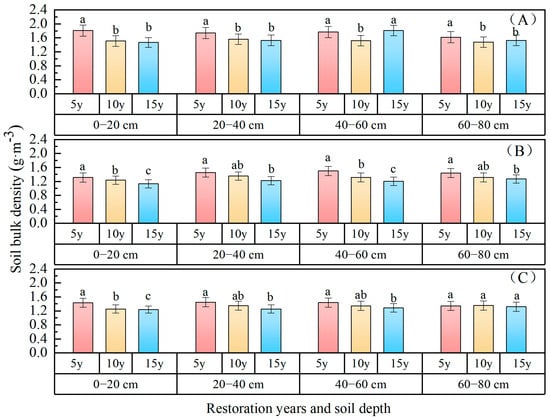
Figure 1.
Soil bulk density changes with restoration time and depth. ((A) P. sylvestris forest. (B) H. rhamnoides forest. (C) P. sibirica forest). Note: Different lowercase superscript letters within each panel indicate a significant difference between different restoration years (p < 0.05). The same applies for the figures below.
The soil bulk density was lowest in the 0–20 cm soil layer, measuring 1.53 g·cm−3 for P. sylvestris forest, 1.25 g·cm−3 for H. rhamnoides forest, and 1.27 g·cm−3 for P. sibirica forest. Analysis of variance revealed that soil depth and different forest types exerted significant effects on soil density (p < 0.05). There was no significant interaction between them, while notable differences were observed among different forest types. The soil bulk density of the 0–20 cm soil layer in mountain apricot forest exhibited a significant difference with increasing restoration years (p < 0.05).
Meanwhile, no significant difference was observed in the soil bulk density of the 60~80 cm soil layer (p > 0.05).
Total soil porosity: The variation in total porosity with soil depth for different planted forests is illustrated in Figure 2. The porosity of the 0–80 cm soil layer exhibited the following characteristics: P. sibirica forest (52.38%) > P. sylvestris forest (51.76%) > H. rhamnoides forest (44.88%). In comparison to the 5 years of restoration, the vegetation of P. sibirica forest in the 15 years’ and 10 years’ restoration sites increased by 5.62% and 4.12%, respectively. H. rhamnoides forest experienced increases of 3.29% and 0.79%, respectively. The soil pore status in the 0–80 cm layer after 15 and 10 years of vegetation restoration was notably superior to that following a period of only 5 years. The soil porosity levels in the 0–20 cm, 20–40 cm, 40–60 cm, and 60–80 cm soil layers were measured at 55.46%, 52.13%, 51.76%, and 47.69% in P. sylvestris forest; at 47.22%, 44.17%, 44.28%, and 43.86% in H. rhamnoides forest; and at 55.90%, 50.81%, 52.25%, and 50.57% in P. sibirica forest, respectively. The restoration years and vertical distribution of soil porosity in different forest types exhibited statistically significant changes (p < 0.05). The soil depth and forest type had significant effects on total soil porosity, with no interaction between them. At 5, 10, and 15 years, there were significant differences in the total soil porosity at a depth of 0~80 cm between pine and apricot forests (p < 0.05). In the 0–60 cm soil layer of H. rhamnoides forest, there was a significant difference in total porosity between 5 years and 15 years (p < 0.05). However, in the 60–80 cm soil layer, no significant difference in total porosity was observed among 5 years, 10 years, and 15 years (p > 0.05), indicating that vegetation type and soil depth are pivotal factors influencing soil porosity.
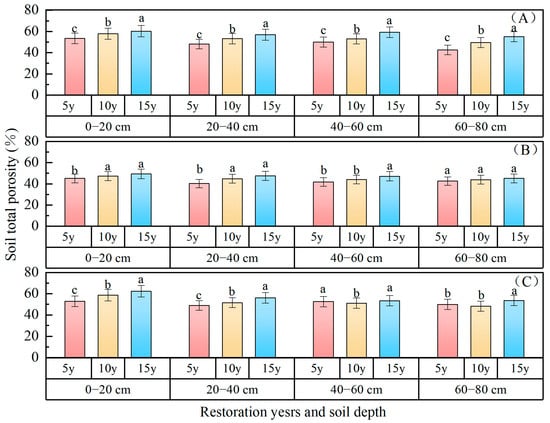
Figure 2.
Soil total porosity changes with restoration time and depth. ((A) P. sylvestris forest. (B) H. rhamnoides forest. (C) P. sibirica forest).
Soil capillary porosity: The variations in soil capillary porosity with restoration time in different planted forests are depicted in Figure 3, demonstrating an upward trend with the progression of restoration years. The capillary porosity of the 0–80 cm soil layer was as follows: P. sibirica forest (49.10%) > H. rhamnoides forest (48.95%) > P. sylvestris forest (41.94%). In comparison with 5 years of restoration, the capillary porosity of P. sylvestris forest increased by 4.03% and 2.75% after 15 and 10 years of restoration, respectively; for H. rhamnoides forest, the increases were 3.12% and 1.17%, respectively; while for P. sibirica forest, they were 3.08% and 1.47%, respectively. The capillary pore status of the 0–80 cm soil layer following 15 and 10 years of vegetation restoration surpassed that observed after 5 years of vegetation restoration. The capillary porosity gradually decreased with an increasing soil depth, with values of 55.46%, 52.13%, 51.76%, and 47.69% in the 0–20 cm, 20–40 cm, 40–60 cm, and 60–80 cm soil layers of P. sylvestris forest; 47.22%, 44.17%, 44.28%, and 43.86% in H. rhamnoides forest; and 55.90%, 50.81%, 52.25%, and 50.57% in P. sibirica forest, respectively.
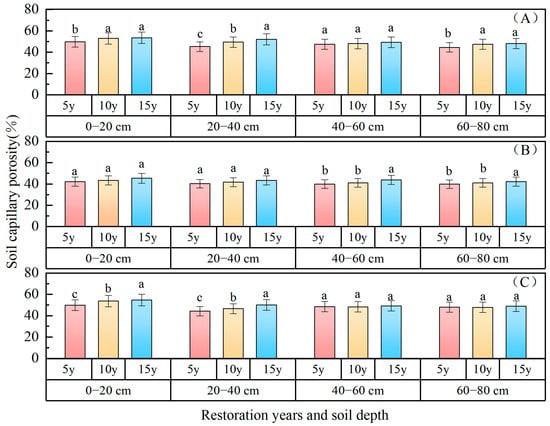
Figure 3.
Soil capillary porosity changes with restoration time and depth. ((A) P. sylvestris forest. (B) H. rhamnoides forest. (C) P. sibirica forest).
Soil non-capillary porosity: The changes in soil non-capillary porosity with restoration time in different planted forests are illustrated in Figure 4, indicating a consistent upward trend over the course of restoration years. The capillary porosity of the 0–80 cm soil layer ranked as follows: P. sylvestris forest (7.78%) > P. sibirica forest (6.46%) > H. rhamnoides forest (5.79%). In comparison with 5 years of restoration, the capillary porosity of P. sylvestris forest increased by 0.36% and 0.63% after 15 and 10 years of restoration, respectively; for H. rhamnoides forest, the increases were 0.62% and 0.07%, respectively; while for P. sibirica forest, they were 3.48% and 4.97%, respectively. The non-capillary porosity status of the 0–80 cm soil layer following 15 and 10 years of vegetation restoration surpassed that observed after 5 years of vegetation restoration. The non-capillary porosity gradually decreased with an increasing soil depth, with values of 8.03%, 7.31%, 7.61%, and 8.17% in the 0–20 cm, 20–40 cm, 40–60 cm, and 60–80 cm soil layers of P. sylvestris forest; 6.47%, 5.55%, 5.63%, and 5.50% in H. rhamnoides forest; and 7.37%, 6.88%, 6.13%, and 5.45% in P. sibirica forest, respectively. The non-capillary porosity of the 0~20 cm soil layer was highest in H. rhamnoides forest and P. sibirica forest, while that of P. sylvestris forest was highest in the 60~80 cm soil layer.
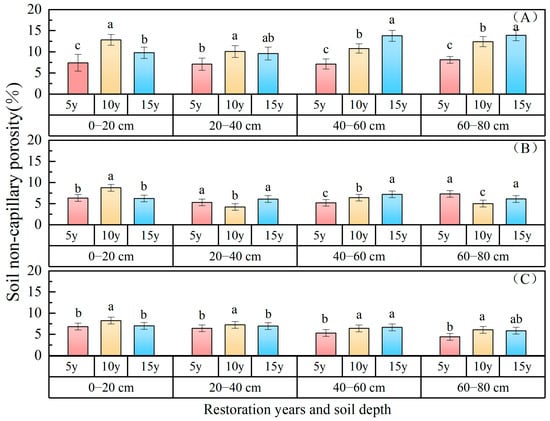
Figure 4.
Soil non-capillary porosity changes with restoration time and depth. ((A) P. sylvestris forest. (B) H. rhamnoides forest. (C) P. sibirica forest).
3.2. Soil Chemical Property Changes with Restoration Time and Depth
Soil available nitrogen: The variations in soil available nitrogen content with the duration of vegetation restoration are depicted in Figure 5, indicating a consistent upward trend over the course of restoration years. The available nitrogen content of the 0–80 cm soil layer ranked as follows: P. sibirica forest (19.80 mg·kg−1) > P. sylvestris forest (19.42 mg·kg−1) > H. rhamnoides forest (14.48 mg·kg−1). In comparison with 5 years of restoration, the available nitrogen of P. sibirica forest increased by 15.48 mg·kg−1 and 2.42 mg·kg−1 after 15 and 10 years of restoration, respectively; for P. sylvestris forest, the increases were 5.60 mg·kg−1 and 2.42 mg·kg−1, respectively; while for H. rhamnoides forest, they were 18.39 mg·kg−1 and 7.33 mg·kg−1, respectively. The available nitrogen status of the 0–80 cm soil layer following 15 and 10 years of vegetation restoration surpassed that observed after 5 years of vegetation restoration. The available nitrogen gradually decreased with an increasing soil depth, with values of 28.45 mg·kg−1, 19.55 mg·kg−1, 16.99 mg·kg−1, and 12.70 mg·kg−1 in the 0–20 cm, 20–40 cm, 40–60 cm, and 60–80 cm soil layers of P. sylvestris forest; 20.16 mg·kg−1, 16.57 mg·kg−1,11.36 mg·kg−1, and 10.72 mg·kg−1 in H. rhamnoides forest; and 23.12 mg·kg−1, 20.70 mg·kg−1, 20.64 mg·kg−1, and 14.73 mg·kg−1 in P. sibirica forest, respectively. The surface layer exhibited a higher content of available nitrogen in the soil compared to the bottom layer, suggesting a spatial aggregation of available nitrogen within the forests.
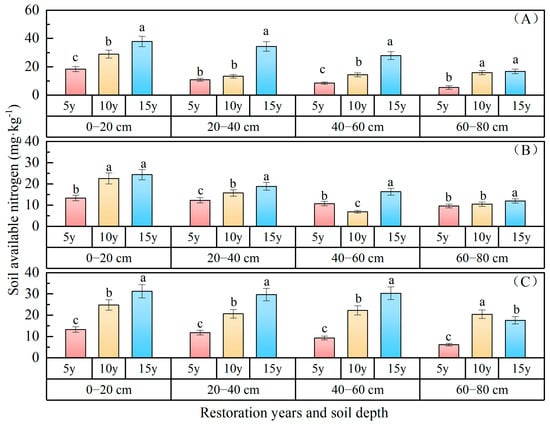
Figure 5.
Soil available nitrogen changes with restoration time and depth. ((A) P. sylvestris forest. (B) H. rhamnoides forest. (C) P. sibirica forest).
Soil available phosphorus: The variations in soil available phosphorus content with the duration of vegetation restoration are depicted in Figure 6, indicating a consistent upward trend over the course of restoration years. The available phosphorus content of the 0–80 cm soil layer ranked as follows: P. sylvestris forest (2.87 mg·kg−1) > P. sibirica forest (2.61 mg·kg−1) > H. rhamnoides forest (2.48 mg·kg−1). In comparison with 5 years of restoration, the available phosphorus of P. sibirica forest increased by 0.57 mg·kg−1 and 0.44 mg·kg−1 after 15 and 10 years of restoration, respectively; for P. sylvestris forest, the increases were 0.28 mg·kg−1 and 0.23 mg·kg−1, respectively; while for H. rhamnoides forest, it was 0.11 mg·kg−1. The available phosphorus status of the 0–80 cm soil layer following 15 and 10 years of vegetation restoration surpassed that observed after 5 years of vegetation restoration. The available phosphorus gradually decreased with an increasing soil depth, with values of 3.37 mg·kg−1, 2.64 mg·kg−1, 2.47 mg·kg−1, and 2.83 mg·kg−1 in the 0–20 cm, 20–40 cm, 40–60 cm, and 60–80 cm soil layers of P. sylvestris forest; 2.85 mg·kg−1, 2.71 mg·kg−1,2.58 mg·kg−1, and 2.45 mg·kg−1 in P. sibirica forest; and 2.67 mg·kg−1, 2.37 mg·kg−1, 2.42 mg·kg−1, and 2.45 mg·kg−1 in H. rhamnoides forest, respectively. The surface layer exhibited a higher content of available phosphorus in the soil compared to the bottom layer, suggesting a spatial aggregation of available phosphorus within the forests.
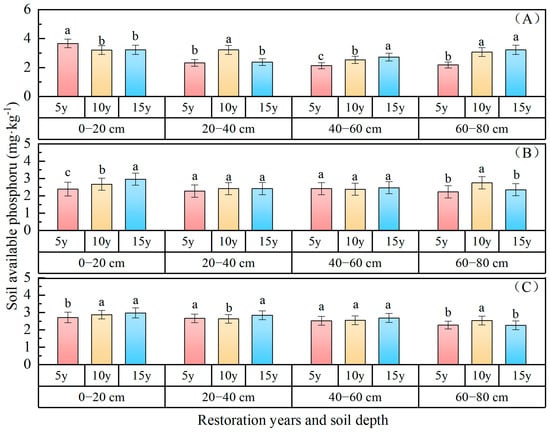
Figure 6.
Soil available phosphorus changes with restoration time and depth. ((A) P. sylvestris forest. (B) H. rhamnoides forest. (C) P. sibirica forest).
Soil available potassium: The variations in soil available potassium content with the duration of vegetation restoration are depicted in Figure 7, indicating a consistent downward trend over the course of restoration years. The available potassium content of the 0–80 cm soil layer ranked as follows: P. sylvestris forest (67.36 mg·kg−1) > H. rhamnoides forest (38.94 mg·kg−1) > P. sibirica forest (38.75 mg·kg−1). In comparison with 5 years of restoration, the available potassium of P. sylvestris forest increased by 36.59 mg·kg−1 and 69.07 mg·kg−1 after 15 and 10 years of restoration, respectively; for H. rhamnoides forest, the decreases were 6.04 mg·kg−1 and 32.87 mg·kg−1, respectively; while for P. sibirica forest, they were 7.43 mg·kg−1 and 9.83 mg·kg−1, respectively. The available potassium status of the 0–80 cm soil layer following 15 and 10 years of vegetation restoration surpassed that observed after 5 years of vegetation restoration. The available potassium gradually decreased with an increasing soil depth, with values of 84.55 mg·kg−1, 66.41 mg·kg−1, 58.35 mg·kg−1, and 60.13 mg·kg−1 in the 0–20 cm, 20–40 cm, 40–60 cm, and 60–80 cm soil layers of P. sylvestris forest; 59.82 mg·kg−1, 36.74 mg·kg−1,29.85 mg·kg−1, and 29.36 mg·kg−1 in H. rhamnoides forest; and 48.04 mg·kg−1, 38.13 mg·kg−1, 35.71 mg·kg−1, and 33.12 mg·kg−1 in P. sibirica forest, respectively. In the 0–60 cm soil layer of H. rhamnoides forest, the concentration of available potassium in the soil exhibited a “V”-shaped pattern as vegetation restoration years increased. The concentration of available potassium in the 60~80 cm soil layer (29.36 mg·kg−1) exhibited a decrease of 36.47 mg·kg−1 compared to that in the 0~20 cm soil layer (59.82 mg·kg−1), representing a reduction in available potassium by 60.95%. The surface layer demonstrated higher levels of available potassium than the lower layer, suggesting spatial aggregation of available potassium within the forest. In each soil layer within the 0–80 cm soil layer, with the increase in vegetation restoration years, its content initially decreased and then gradually increased. Overall, the content of available potassium in soil demonstrated a “V”-shaped trend as the vegetation restoration years increased.
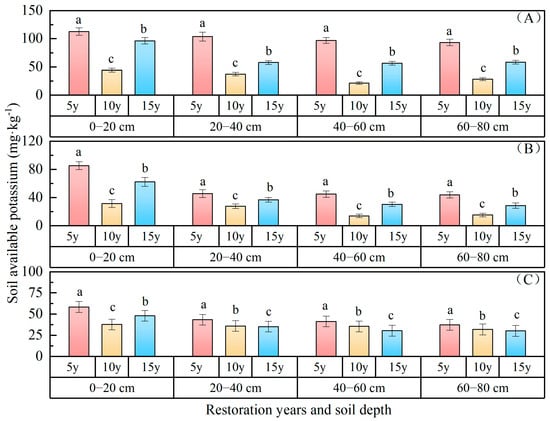
Figure 7.
Soil available potassium changes with restoration time and depth. ((A) P. sylvestris forest. (B) H. rhamnoides forest. (C) P. sibirica forest).
Soil organic carbon: The variations in soil organic carbon content with the duration of vegetation restoration are depicted in Figure 8, indicating a consistent upward trend over the course of the restoration years. The organic carbon content of the 0–80 cm soil layer ranked as follows: P. sibirica forest (12.69 g·kg−1) > P. sylvestris forest (10.53 g·kg−1) > H. rhamnoides forest (8.66 g·kg−1). In comparison with 5 years of restoration, the organic carbon of P. sibirica forest decreased by 4.91 g·kg−1 and 0.57 g·kg−1 after 15 and 10 years of restoration respectively; for H. rhamnoides forest, the increases were 7.61 g·kg−1 and 1.32 g·kg−1, respectively; while for P. sylvestris forest, they were 3.30 g·kg−1 and 0.78 g·kg−1, respectively. The organic carbon status of the 0–80 cm soil layer following 15 and 10 years of vegetation restoration surpassed that observed after 5 years of vegetation restoration. The organic carbon gradually increased with an increasing soil depth, with values of 15.59 g·kg−1, 13.21 g·kg−1, 11.38 g·kg−1, and 10.58 g·kg−1 in the 0–20 cm, 20–40 cm, 40–60 cm, and 60–80 cm soil layers of P. sibirica forest; 12.49 g·kg−1, 10.62 g·kg−1, 9.88 g·kg−1, and 9.13 g·kg−1 in H. rhamnoides forest; and 11.69 g·kg−1, 9.49 g·kg−1, 7.59 g·kg−1, and 5.86 g·kg−1 in P. sylvestris forest, respectively. With an increasing soil depth, the organic carbon contents in different forests exhibited a declining trend. Specifically, the organic carbon contents in the 60–80 cm soil layer (5.86 g·kg−1, 9.13 g·kg−1, 10.58 g·kg−1) decreased by 5.82 g·kg−1 and 3.35 g·kg−1, respectively, compared to those in the 0–20 cm soil layer (11.68 g·kg−1, 12.48 g·kg−1, 15.59 g·kg−1), representing a reduction of approximately 32.13%. The surface layer exhibited a higher content of organic carbon in the soil compared to the bottom layer, suggesting a spatial aggregation of organic carbon within the forests.
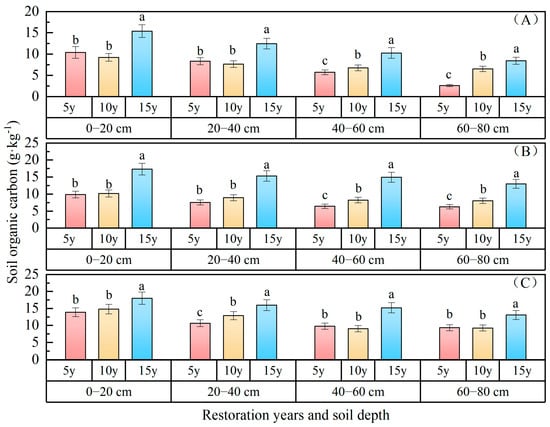
Figure 8.
Soil organic carbon changes with restoration time and depth. ((A) P. sylvestris forest. (B) H. rhamnoides forest. (C) P. sibirica forest).
Analysis of variance revealed that the soil depth and forest type exerted significant effects on the soil’s available nitrogen, available phosphorus, available potassium, and organic carbon (p < 0.05). There was no interaction between them, but there were significant differences among forest types (p < 0.05). The levels of organic carbon, available potassium, and available nitrogen decreased with an increasing soil depth in different forest types. This indicates a certain degree of concentrated distribution for these parameters, consistent with the common law of change. As vegetation restoration years increase, soil nutrients in different planted forests exhibit ongoing dynamic changes. Overall, an increase in vegetation restoration years can enhance soil fertility and contribute to a certain level of soil improvement, particularly for the surface 0–20 cm soil layer.
3.3. Variation of Soil Carbon Storage Distribution
As illustrated in Table 1, soil carbon storage across different planted forests exhibited a positive correlation with the number of restoration years, particularly between 10 and 15 years, ultimately reaching its peak after 15 years. There was a significant difference in soil carbon storage within the same soil layer between forest types (p < 0.05). The total soil carbon storage across different planted forests was as follows: P. sibirica forest (158.36 t·hm−2) > H. rhamnoides forest (148.34 t·hm−2) > P. sylvestris forest (140.72 t·hm−2), suggesting that the P. sibirica forest exhibits a superior carbon sequestration capacity. Based on the soil carbon distribution patterns observed in different planted forests, it was found that the soil carbon reserves across different forest types were predominantly concentrated within the 0–20 cm soil layer, with notably higher levels of soil carbon reserves. Specifically, the ranking of these reserves was as follows: P. sylvestris forest (45.42 t·hm−2) > P. sibirica forest (44.56 t·hm−2) > H. rhamnoides forest (41.87 t·hm−2), indicating that the P. sylvestris forest exhibits superior capabilities of carbon fixation within the 0–20 cm soil layer. The comprehensive analysis of total soil carbon storage and the carbon storage in the 0–20 cm surface layer revealed that soils beneath P. sylvestris forest and P. sibirica forest exhibit a higher capacity for carbon sequestration and enhanced soil quality. Although the carbon storage potential of H. rhamnoides forest is lower than those of both P. sylvestris forest and P. sibirica forest, it still contributes positively to soil improvement in mining areas.

Table 1.
Soil carbon storage changes in different forest types.
4. Discussion
4.1. Soil Physical Property Changes with Restoration Years and Depths
Forest soil serves as the primary reservoir and regulator of water within forest ecosystems []. Due to variations in tree species composition, growth status, and soil biological activities, the physical and chemical properties of soil differ among stands. Zhu et al. (2022) conducted a study on the gully regions of the Loess Plateau and observed that the physical properties of the soil are influenced by varying tree types and their spatial arrangement []. The findings of the study conducted by Zhang et al. align with those of the current research, indicating that soil bulk density across various forest types and soil strata generally exhibits a declining trend []. Over the course of 5, 10, and 15 years of vegetation restoration, distinct stands exhibited significant impacts on soil physicochemical properties (p < 0.05). Furthermore, the forests demonstrated notable disparities across different soil layers. The reason lies in the initial slight increase and subsequent decrease in soil density during different restoration years, while conversely, total soil porosity decreases. When excluding any human influence during afforestation, the plantation plays a crucial role in reducing soil density, increasing soil porosity, enhancing soil permeability and infiltration, as well as augmenting soil water retention and capacity during 10 to 15 years of vegetation restoration. These findings are consistent with those of other researchers [,].
The physical properties of soil are closely associated with the regional hydrological regulation process, and soil porosity is intricately linked to its water conservation capacity. Zhang et al. (2005) investigated the hydrophysical properties of soil water in a Pinus tabuliformis plantation on the Loess Plateau and demonstrated that soil density exhibited a decreasing trend with an increasing tree age []. Based on the research findings by Wang et al., the soil physical properties in eucalyptus forest exhibited favorable conditions following 13 years of farmland reversion []. Through a comparison of the changes in surface soil physical properties in the loess areas of Ansai County, Shaanxi Province over different years, Peng et al. (2005) observed that the soil physical properties of Robinia pseudoacacia forest were favorable after 13 years of farmland reversion, and remained relatively stable with no significant changes even after 30 years []. The soil bulk density gradually increases with depth, while the total porosity, capillary porosity, and non-capillary porosity decrease within the same depth range. These findings are in line with the research results of Li et al. (2022) []. This may be attributed to the accumulation of a substantial amount of organic debris on the forest floor, creating an optimal habitat for soil microorganisms. A comprehensive analysis revealed that as the years of vegetation restoration increased, soil physical properties gradually improved, albeit at a decelerating rate.
4.2. Soil Chemical Property Changes with Restoration Years and Depths
Soil organic carbon and other nutrients are crucial constituents of soil and primary sources of essential nutrients for plants. They directly influence the development and growth of vegetation, playing a pivotal role in enhancing the physiological activity of plants and microorganisms, improving soil’s water retention capacity, as well as promoting the formation of the optimal soil structure []. The enhancement of soil nutrients in woodland is believed to be the primary factor contributing to the amelioration of soil physical properties through vegetation-based interventions [,]. Distinct variations in soil chemical properties were observed across different woodlands, and over time, there were continuous dynamic changes in these properties as vegetation restoration progressed. The levels of soil organic matter, available phosphorus, and available potassium in different soil layers of Haloxylon ammodendron forest increased with a prolonged vegetation recovery time and peaked after 16 years []. In comparison with H. rhamnoides and P. sibirica forests, P. sylvestris forest exhibits the highest soil available phosphorus content, suggesting its superior capacity for phosphorus fixation. The concentration of available potassium in different forest types was significantly higher than that of available phosphorus, which may be attributed to the abundant potassium content in the original soil minerals. There was no discernible pattern in the variation in available phosphorus across different soil depths. The concentration of available phosphorus was notably lower than those of other nutrients; thus, it is advisable to judiciously apply phosphorus fertilizer during the initial stage of vegetation recovery to sustain the requisite phosphorus levels for vegetation growth.
The soil nutrient conditions improved with the increase in years of vegetation restoration, and available nitrogen, organic carbon, and available potassium all exhibited surface aggregation effects, primarily concentrated in the 0–20 cm soil layer. These findings are consistent with those reported by Wang et al. (2023) []. The phenomenon may be attributed to the decomposition of litter scattered on the soil surface. Initially, organic carbon and nitrogen accumulate in the surface layer of the soil before migrating to lower layers with water or other media, resulting in a gradient of decreasing concentration of soil organic carbon and nitrogen from the surface layer to the bottom layer []. Organic materials can also adsorb potassium ions, leading to an increased surface potassium ion content. Over the course of restoration years, there was an increase in soil organic matter and total nitrogen, while the available potassium content decreased. Other nutrient factors exhibited fluctuating changes, consistent with the findings of Dang et al. (2014) []. Soil organic carbon plays a crucial role in shaping sustainable soil fertility and productivity, exerting a significant influence on soil physical and chemical properties []. With the increase in forest age, there are changes in understory vegetation, which impact the balance between soil nutrient supply and plant growth demand. Simultaneously, plant residues and root secretions are introduced into the soil, fundamentally impacting soil properties []. Rehabilitation measures for vegetation primarily enhance the topsoil layer, and over time, the ameliorative effects extend gradually to deeper layers. This phenomenon may be attributed to the accumulation of forest litter on the surface and the predominant distribution of plant roots in proximity to the surface. Soil organic carbon content increased with time, especially in the 60–80 cm soil layer range. With the elapse of vegetation recovery time, the roots of understory vegetation in various woodlands kept growing continuously and extended to deeper soil layers. During the growth process, roots would secrete organic substances, such as organic acids and polysaccharides, which would enhance the content of organic carbon upon entering the soil. The roots of different forests could penetrate into the soil layer of 60–80 cm or even deeper, and a considerable number of root residues contributed to the accumulation of organic carbon in deep soil. At the same time, this also suggests that the ameliorative impact of vegetation restoration on the pore characteristics of surface soil surpasses that of subsoil. This may be attributed to the progressive enhancement of root systems in forest trees over years of vegetation restoration, leading to an expanded and deepened distribution range of roots, thereby causing a gradient change in soil pore improvement with an increasing depth. The changes in soil nutrients over the course of restoration are continuous and dynamic, necessitating further discussion based on location monitoring and a large number of field experiments.
4.3. Distribution Characteristics of Soil Carbon Storage
Within the same planted forest, the content of soil organic carbon exhibited a gradual decline with an increasing soil depth, and the distribution patterns of carbon storage across the three distinct forest types were comparable, predominantly concentrated in the 0–20 cm soil layer. The soil carbon storage levels were as follows: P. sylvestris forest (45.42 t·hm−2) > P. sibirica forest (44.56 t·hm−2) > H. rhamnoides forest (41.87 t·hm−2), with an average carbon storage of 193.55 t·hm−2 for the surface soil across all forests studied []. It was observed that the soil carbon storage in the Bulianta coal mining area is significantly lower than the national average. The primary reason may be that the three planted forests selected for this study are situated in the transition zone between the Mu Us Sandy Land and the Loess Plateau. In addition to mining activities, soil nutrient background values are diminished due to severe wind erosion, limited precipitation, unfavorable natural geographical conditions, and low temperature and moisture levels. As the years of vegetation restoration increase, the effects of such restoration lead to a certain degree of land productivity, which facilitates the accumulation of vegetation biomass. A higher soil respiration rate can enhance the decomposition rate of litter; coupled with the substantial amounts of soil carbon and nutrients absorbed by plants, this results in relatively low carbon storage []. Concurrently, an elevated soil respiration rate contributes to greater carbon release into the atmosphere in the form of CO2, thereby reducing soil carbon accumulation [].
The soil organic carbon in forest soil primarily originates from litter and root exudates present on the forest floor. Different forest types of vegetation influence the quantity, quality, and cycling of organic carbon in forest soils; additionally, the differences in litter composition among distinct tree species can significantly impact both the content and storage of soil organic carbon []. Our study demonstrated that the total soil carbon storage was ranked as follows: P. sibirica forest (158.36 t·hm−2) > H. rhamnoides forest (148.34 t·hm−2) > P. sylvestris forest (140.72 t·hm−2), indicating that P. sibirica forest exhibited the highest capacity for carbon sequestration. The observed differences may be attributed to variations in the quantity, composition, and decomposition rates of litter across different forest types—factors such as tree species, stand density, age of the stand, tree height, and diameter at breast height—which subsequently influence the nutrient content at the soil surface [,]. The primary factor contributing to this phenomenon is the distinct characteristics of different forest types’ tree species. Different species exert varying influences on soil enhancement and carbon sequestration capacity. Tree species with elevated carbon storage potential demonstrate superior effects on the maintenance of soil fertility. Among the three types of forest soils, both the total carbon storage and the 0–20 cm surface soil carbon storage in P. sylvestris forest and P. sibirica forest were comparatively higher. This suggests that the soils beneath these forests possess a greater capacity for carbon storage in mining areas, thereby demonstrating a superior potential for soil enhancement. Conversely, while the soil carbon storage capacity of H. rhamnoides forest is relatively limited, it still contributes positively to improving the soil quality in the Bulianta mining area. These findings offer valuable data references and practical guidance for enhancing soil nutrient retention during ecological restoration efforts in the Bulianta coal mining area.
5. Conclusions
Based on our study, several conclusions can be stated as follows:
- (1)
- Soil physical and chemical properties of different planted forests exhibit significant changes within 5 to 10 years following vegetation restoration. Soil nutrients in different soil layers demonstrate surface aggregation effects, with the most pronounced improvement observed in the surface soil (0–20 cm). This improvement gradually diminishes with an increasing soil depth.
- (2)
- With the increase in years of vegetation restoration, the average organic carbon content in the 0–80 cm soil layer of P. sibirica forests exhibited a “V”-shaped trend, while that of H. rhamnoides forests showed an “N”-shaped trend.
- (3)
- The soil carbon reserves concentrated within the 0–20 cm layer. The comparative analysis of soil carbon and nitrogen reserves among the three forest types revealed the following hierarchy: P. sylvestris forest (45.42 t·hm−2) > P. sibirica forest (44.56 t·hm−2) > H. rhamnoides forest (41.87 t·hm−2).
- (4)
- In the context of ecological vegetation restoration in the Bulianta mining area, soils beneath P. sylvestris forest and P. sibirica forest exhibit a greater capacity for carbon storage and demonstrate superior soil enhancement effects.
Author Contributions
Writing—original draft, R.W.; writing—review and editing, Y.H. and Z.W.; supervision, Y.G.; experimental design, Z.M. All authors have read and agreed to the published version of the manuscript.
Funding
The research was supported by the “High level/excellent doctoral talents to introduce scientific research initiation project (NDYB2022-24)”, Research and Innovation Project of the Inner Mongolia Department of Education: “Research on Sand Dune Movement and Morphological Characteristics in Desert Region Utilizing Consumer Drones (NJZZ20038)”, and “Science, technology and innovation in Inner Mongolia” Action Key Project (2022EEDSKJXM005-04).
Data Availability Statement
The original contributions presented in this study are included in the article, and further inquiries can be directed to the corresponding author.
Conflicts of Interest
The authors declare no conflicts of interest.
References
- Hu, Z.Q.; Li, Y.Y.; Li, G.S.; Han, J.Z.; Liu, S.G. Opportunities and challenges of land reclamation and ecological restoration in mining areas under carbon neutral target. Int. J. Coal Sci. Technol. 2023, 51, 474–483. [Google Scholar] [CrossRef]
- Zhao, P.; Shi, X.; Shang, Q.; Tan, J.; Wang, X.; Huang, Z. The research progress on soil amelioration in mine reclamation land. J. Agric. Resour. Environ. 2023, 40, 1–14. [Google Scholar] [CrossRef]
- Li, Y.X.; Lv, G.; Wang, D.H.; Wang, S.; Liu, S.; Zhu, S. Effects of ground fissure characteristics on soil physical properties in the dump. Agric. Res. Arid Areas 2022, 40, 214–222. [Google Scholar]
- Mao, J.H.; Zhao, H.Q.; Jin, Q.; Wang, X.F.; Miao, Q.F.; Wang, P.; Li, M.Y. Comparative study on the hyperspectral inversion methods for soil heavy metal contents in Hebei lead-zinc tailings reservoir areas. Trans. Chin. Soc. Agric. Eng. 2023, 39, 144–156. [Google Scholar]
- Li, J.; Zhao, Q.; Zhao, Y.; Fu, H.; Li, X.; Huang, J.; Li, Y.; Hu, X.; Tian, S. Remediation of heavy metal contaminated mine soils using smoldering combustion technology. Environ. Technol. Innov. 2023, 32, 103333. [Google Scholar] [CrossRef]
- Hu, Z.Q.; Long, J.H.; Wang, X.J. Selfhealing, natural restoration and artificial restoration of ecological environment forcoal mining. J. China Coal Soc. 2014, 39, 1751–1757. [Google Scholar]
- Wu, Z.Z.Y.; Cui, F.; Nie, J.L. Relationship between soil water content and vegetation distribution in a small area before and after coal seam mining: A case study of coal mining subsidence area in Northwest China. Environ. Earth Sci. 2023, 82, 33–39. [Google Scholar] [CrossRef]
- Shen, X.Z. Research on Land Reclamation Forest and Grass Vegetation Restoration Technology in Coal Mining Subsidence Area—Taking Changcun Coal Mine as an Example; Shanxi Forestry Science and Technology: Taiyuan, China, 2020; pp. 36–37. [Google Scholar]
- Wang, X.L. Existing problems and countermeasures of ecological environment restoration and management in modern mines. Resour. Conserv. Environ. Prot. 2022, 8, 25–28. [Google Scholar] [CrossRef]
- Wang, X.H.; Wang, Y.Q. Study on physical properties of several main soils in Loess Plateau. J. Soil Water Conserv. 2000, 14, 99–103. [Google Scholar] [CrossRef]
- Shen, Y.T.; Zhang, W.; He, X.J. Vertical distribution characteristics of soil organic matter and its response to short-term vegetation succession. China Environ. Sci. 2024, 3, 4520–4529. [Google Scholar] [CrossRef]
- Li, M.Y.; Zhang, J.J.; Wang, C.X. Effects of land use types on soil physical properties in Loess Plateau of western Shanxi. J. Soil Water Conserv. 2013, 27, 125–130. [Google Scholar] [CrossRef]
- Zhang, S.Q.; Wang, G.D.; Shi, X.L.; Liu, Y.P. Soil water physical properties of Pinus tabulaeformis plantation in Loess Plateau. Agric. Res. Arid Areas 2005, 23, 60–64. [Google Scholar]
- Ding, Q.P.; Wang, Q.B.; Wei, Z.Y.; Han, C.L.; Wang, H.L.; Wang, X.F. Soil Nutrients and Organic Carbon Contents with Different Reclamation Years in the Colliery Areas of Fushun City. Chin. J. Soil Sci. 2007, 38, 262–267. [Google Scholar] [CrossRef]
- Peng, S.; Chen, A.; Fang, H.; Wu, J.; Liu, G. Effects of vegetation restoration types on soil quality in Yuanmou Dry-Hot Valley, China. Soil Sci. Plant Nutr. 2013, 59, 347–360. [Google Scholar] [CrossRef]
- Li, D.; Yang, X.; Deng, Y.; Li, Y. Soil physical properties under effects of Eucalyptus understory vegetation and litter. Chin. J. Ecol. 2006, 25, 607–611. [Google Scholar]
- Wang, G.H.; Wang, J.Q.; Liu, J. Characteristics of vegetation and soil in Caragana korshinskii plantations in the hilly and sandy areas of northwestern Shanxi Province, China. Chin. J. Appl. Ecol. 2024, 35, 62–72. [Google Scholar]
- Luo, H.B.; Qian, X.G.; Liu, F.; He, T.B.; Song, G.Y. Ecological benefit of soil and water conservation in hilly areas by defarming and reafforestation. J. Soil Water Conserv. 2003, 17, 31–34, 41. [Google Scholar]
- Guo, Q.L.; Ma, Z.H.; Su, N. Effects of cracks in coal mining subsidence area on soil moisture content in Shenfu-Dongsheng coalfiel. Sci. Soil Water Conserv. 2019, 17, 109–116. [Google Scholar] [CrossRef]
- Liu, Z.X. Study on Geological Environment Reconstruction of Drought Glassland Region in Bulianta Coal Mine. Saf. Coal Mines 2017, 48, 90–93+98. [Google Scholar] [CrossRef]
- Institute of Soil Science. Chinese Academy of Sciences. Soil Physicochemical Analysis; Shanghai Scientific and Technical Publishers: Shanghai, China, 1978. [Google Scholar]
- Bao, S.D. Soil Agrochemical Analysis, 3rd ed.; China Agricultural Press: Beijing, China, 2000; pp. 25–114. [Google Scholar]
- Xie, X.X. Determination of organic matter in soil with the method of potassium bichromate-dilution heat colorimetric. J. Anhui Agric. Sci. 2005, 33, 998–999. [Google Scholar] [CrossRef]
- Li, X.D.; Wen, Y.L.; Wang, Y.; Chen, S.Z.; Liu, L.S.; Zhang, X.C. Effects of planting and breeding combination recycle mode implementation on nutrient contents of soil. J. Southwest Univ. Natl. Nat. Sci. Ed. 2010, 36, 57–62. [Google Scholar] [CrossRef]
- Zhang, G.L.; Gong, Z.T. Soil Survey Laboratory Methods; Science Press: Beijing, China, 2012. [Google Scholar]
- Ma, X.H.; Jiao, J.Y.; Wen, Z.M.; Bai, W.J.; Jiao, F. The changes of soil physical properties in abandoned lands during vegetation restoration in hilly and gully regions on the Loess Plateau. Res. Soil Water Conserv. 2005, 12, 17–21. [Google Scholar] [CrossRef]
- Zhu, M.Y.; Yan, X.Y.; Guo, T.Q.; Huang, M.B. A Comparative Study on Soil Physical Properties of Steep Slopes in the Gully Region of the Loess Plateau with Different Restoration Years of Typical Vegetation—A Case Study of Wangdonggou in Changwu, Shannxi Province. Bull. Mineral. Petrol. Geochem. 2022, 41, 1033–1040. [Google Scholar] [CrossRef]
- Zhang, Y. Investigation of the impacts of various afforestation techniques on soil properties in forest areas designated for soil and water conservation. Guangdong Canye 2023, 57, 50–52. [Google Scholar]
- Guo, Y.H. Effective Monitoring and Evaluation of the Land Conversion Program Chinese Northwest Region. Ph.D. Dissertation, Beijing Forestry University, Beijing, China, 2009. [Google Scholar]
- Yang, G.; Ding, G.D.; Chang, G.L.; Yang, L. Study on improving soil properties of forest vegetation in different land where returning farmland to forests in Loess Plateau. Res. Soil Water Conserv. 2006, 13, 204–207, 210. [Google Scholar] [CrossRef]
- Wang, Y.L.; Xu, H.; An, Y.; Han, X.S.; Wan, H.X.; Dong, L.G. Relationship Between Fractal Characteristics of Soil Particle Size Distribution and Soil Nutrients Under Typical Plantations in Loess Region of Southern Ningxia. N. Hortic. 2023, 81–88. [Google Scholar]
- Peng, W.Y.; Zhang, K.L.; Chen, Y.; Yang, Q.K. Research on Soil Quality Change after Returning Farmlandto Forest on the Loess Sloping Croplands. J. Nat. Resour. 2005, 20, 272–278. [Google Scholar] [CrossRef]
- Jia, L.Z.; Zhang, J.H.; Wang, Y.; Zhang, H.Z.; Wei, Y.H. Effects of tillage erosion on the two dimensional distribution of soil bulk density and organic matter on a steep hillslope. Chin. J. Soil Sci. 2016, 47, 1461–1467. [Google Scholar] [CrossRef]
- Li, X.-G.; Li, F.-M.; Zed, R.; Zhan, Z.-Y.; Singh, B. Soil physical properties and their relations to organic carbon pools as affected by land use in an alpine pastureland. Geoderma 2007, 139, 98–105. [Google Scholar] [CrossRef]
- Zhao, H.-L.; Guo, Y.-R.; Zhou, R.-L.; Drake, S. The effects of plantation development on biological soil crust and topsoil properties in a desert in northern China. Geoderma 2011, 160, 367–372. [Google Scholar] [CrossRef]
- Wei, Y.J.; Wang, J.; Dang, X.H.; Shi, T.; Wang, R.D.; Shen, J.L.; Zhang, Y. Soil Improvement in Artificial Haloxylon ammodendron of Different Stand Age. J. Northeast For. Univ. 2019, 47, 42–46+63. [Google Scholar] [CrossRef]
- Wang, H.L.; Wu, Q.Z.; Lan, W.M.; Chen, X.L.; KE, Q.; Wang, Z.Y.; Wei, Z.M.; Chen, L.J.; Wu, L.C.; Cao, J.Z. Dynamics of understory vegetation and soil physical properties in Eucalyptus plantations of different generations. J. Cent. South Univ. For. Technol. 2023, 43, 1–9. [Google Scholar] [CrossRef]
- Wei, Q.; Ling, L.; Chai, C.S.; Zhang, G.Z.; Yan, P.B.; Tao, J.X.; Xue, R. Soil physical and chemical properties in forest succession process in Xinglong Mountain of Gansu. Acta Eclolgica Sin. 2012, 32, 4700–4713. [Google Scholar] [CrossRef]
- Dang, P.; Wang, N.J.; Wang, J.T.; Zhang, W.J.; Huang, Y. Changes of soil physicalchemical properties of Pinus tabuliformis plantations at different developmental stages in Ziwuling region of Loess plateau. J. Northwest AF Univ. 2014, 42, 115–121. [Google Scholar] [CrossRef]
- Hossain, M.S.; Hossain, A.; Sarkar, M.A.R.; Jahiruddin, M.; da Silva, J.A.T.; Hossain, M.I. Productivity and soil fertility of the rice-wheat system in the High Ganges River Floodplain of Bangladesh is influenced by the inclusion of legumes and manure. Agric. Ecosyst. Environ. 2016, 218, 40–52. [Google Scholar] [CrossRef]
- Perim, P.L.; Gargaglione, V.; Pastur, G.M. Dynamics of above-and below-ground biomass and nutrient accumulation in an age sequence of Nothofagus antarctica forest of Southern Patagonia. For. Ecol. Manag. 2006, 233, 85–99. [Google Scholar] [CrossRef]
- Dong, X.; Xin, Z.M.; Huang, Y.R.; Li, X.L.; Hao, Y.G.; Liu, F.; Liu, M.; Li, W. Soil stoichiometry in typical shrub communities in the Ulan Buh Desert. Acta Ecol. Sin. 2019, 39, 6247–6256. [Google Scholar] [CrossRef]
- Schulp, C.J.E.; Nabuurs, G.J.; Verburg, P.H.; Waal, R.W.D. Effect of tree species on carbon stocks in forest floor and mineral soil and implications for soil carbon inventories. For. Ecol. Manag. 2008, 256, 482–490. [Google Scholar] [CrossRef]
- Ostonen, I.; Lõhmus, K.; Pajuste, K. Fine root biomass, production and its proportion of npp in a fertile middle-aged Norway spruce forest: Comparison of soil core and ingrowth core methods. For. Ecol. Manag. 2005, 212, 264–277. [Google Scholar] [CrossRef]
- Peng, S.Q.; Liu, Y.L.; Liu, Y.Q.; Fan, Y.X.; Zhou, Y.S.; Yang, Q.; Zou, W.W. The Effects of Soil Organic Carbon and Nitrogen Contents after the Coniferous Forest was Thinned and Replanted of Broad-leaved Trees. J. Gannan Norm. Univ. 2022, 43, 97–102. [Google Scholar] [CrossRef]
- Elser, J.J.; Sterner, R.W.; Gorokhova, E.A.; Fagan, W.F.; Markow, T.A.; Cotner, J.B.; Harrison, J.F.; Hobbie, S.E.; Odell, G.M.; Weider, L.W. Biological stoichiometry from genes to ecosystems. Ecol. Lett. 2000, 3, 540–550. [Google Scholar] [CrossRef]
- Zhang, D.T.; Wang, C.K.; Zhang, Q.Z. Vertical variation in stoichiometric relationships of soil carbon, nitrogen and phosphorus in five forest types in the Maoershan region, Northeast China. Chin. J. Appl. Ecol. 2017, 28, 3134–3143. [Google Scholar] [CrossRef]
Disclaimer/Publisher’s Note: The statements, opinions and data contained in all publications are solely those of the individual author(s) and contributor(s) and not of MDPI and/or the editor(s). MDPI and/or the editor(s) disclaim responsibility for any injury to people or property resulting from any ideas, methods, instructions or products referred to in the content. |
© 2024 by the authors. Licensee MDPI, Basel, Switzerland. This article is an open access article distributed under the terms and conditions of the Creative Commons Attribution (CC BY) license (https://creativecommons.org/licenses/by/4.0/).