Article

The Response of Vegetation Dynamics to Climate in Xinjiang from 1991 to 2018

1
Key Laboratory of Ecological Safety and Sustainable Development in Arid Lands, Northwest Institute of Eco-Environment and Resources, Chinese Academy of Sciences, Lanzhou 730000, China
2
University of Chinese Academy of Sciences, Beijing 100049, China
*
Authors to whom correspondence should be addressed.
Forests 2024, 15(12), 2065; https://doi.org/10.3390/f15122065
Submission received: 28 October 2024 / Revised: 16 November 2024 / Accepted: 20 November 2024 / Published: 22 November 2024
(This article belongs to the Special Issue Hydrological Modelling of Forested Ecosystems)

Abstract

:
Vegetation change is one of the most prominent features of terrestrial ecosystems responding to climate change. Further exploration of vegetation characteristics in this context is essential for accurately understanding and predicting ecosystem processes. Xinjiang, an arid region, is highly sensitive to slight climate changes, which can significantly affect vegetation dynamics. Therefore, determining the relationship between climate and vegetation is of paramount importance. Based on this, this study focused on Xinjiang, selecting remote sensing data (including NDVI, LAI, and GPP) as evaluating indices, and the spatiotemporal characteristics of vegetation response to climate from 1991 to 2018 were analyzed using synchronized meteorological data, examining the relationship between vegetation and climate. The results indicated that NDVI, LAI, and GPP all increased during the period, with slopes of 0.52, 0.14 m2/m2, and 1.19 g C m−2 yr−1, showing significant spatial heterogeneity in distribution. The net vegetation area increased by more than 20,000 km2, with cropland experiencing the largest increase. Vegetation in northern Xinjiang showed a more significant positive response to increased precipitation and temperature, while vegetation in southern Xinjiang responded more complexly and exhibited negative correlations with climatic factors. The results emphasized the varied responses of vegetation to climate variables, with temperature having a more complex effect on vegetation change, while precipitation showed more distinct differences between the various vegetation indices. These findings provide important insights into the ecological sustainability of Xinjiang under warming and humidification.

1. Introduction

Vegetation, as a vital component of biodiversity and ecosystems on the Earth, plays a crucial role in water conservation, soil water retention, windbreak, and sand fixation, as well as biodiversity protection [1,2,3,4]. Climate significantly influences vegetation growth, particularly in terms of precipitation and temperature [5,6,7,8,9]. Firstly, increasing temperatures may advance and prolong the growth season of the region [10], which contributes to biomass accumulation. More humid environments will promote photosynthesis and the growth of vegetation [11]. Under the context of global warming, vegetation has become increasingly sensitive to climate change. In addition, human activities exert both positive and negative impacts on vegetation [12,13]. Under the combined influence of both factors, once the vegetation in a region is damaged, it not only loses ability to regulate the local climate and maintain ecological balance but may also lead to desertification, becoming a source of dust storms. Therefore, in the context of climate change, analyzing the spatiotemporal characteristics of vegetation and understanding its response mechanisms to both climate change and human activities are crucial for providing a scientific basis for vegetation protection and restoration and essential for assessing the ecological health of vegetation.
In recent years, vegetation dynamics monitoring has primarily relied on remote sensing techniques. Typical indicators of plant growth include the Normalized Difference Vegetation Index (NDVI), Leaf Area Index (LAI), Net Primary Productivity (NPP), and Gross Primary Productivity (GPP) [12,14,15,16]. Many researchers have utilized long-term remote sensing data to thoroughly examine the spatial and temporal patterns of these indicators, exploring the underlying driving mechanisms. Analytical techniques such as residual analysis, Pearson correlation, Theil-Sen trend analysis, and Mann-Kendall tests have been commonly applied [17,18,19,20]. Piao et al. [21], for instance, demonstrated that the partial correlation coefficient (RNDVI-GT) between the year-to-year variability of NDVI during the growing season and temperature in regions above 30° N latitude notably decreased between 1982 and 2011. Similarly, Shi et al. [22] determined that from 2000 to 2016, 45.78% of NDVI changes in China’s Loess Plateau were attributed to climate change, with the effect of climate on NDVI becoming more pronounced over longer timescales. Using the Empirical Orthogonal Function (EOF) method, Zhang et al. [23] analyzed vegetation changes in Xinjiang from 1982 to 2021, identifying five climatic factors, including temperature and precipitation, that positively influenced vegetation growth. Research by Mekonnen et al. [24] simulated GPP and indicated that rising temperatures and lower precipitation contributed to decreased GPP across much of the southwestern northern United States due to water stress. Collectively, these findings emphasize that climate, particularly temperature and precipitation, plays a critical role in influencing the growth and distribution of vegetation. Diverse regional features lead to pronounced spatial and temporal variations in how different vegetation types respond to climate factors [25,26,27,28]. For instance, in arid and semi-arid zones, various plant types, from desert shrubs to mountain forests, illustrate the differing impacts of climate on vegetation, which is essential for understanding ecosystem responses to climate change. Furthermore, ecosystems show marked sensitivity to climate fluctuations, especially regarding temperature and precipitation, making these areas ideal for studying how climate change influences vegetation dynamics. This context underscores the importance of grasping vegetation responses within specific environmental setting.
Xinjiang is located in the northwest region of China, with significant climate differences between the north and south and a fragile ecosystem. Studies had indicated that northwest China is experiencing warming and humidification under climate change [29,30], and Xinjiang, the largest arid area in this region, is also facing climate transition [31,32]. This trend has led to significant vegetation changes in Xinjiang, drawing increasing attention from scholars [33,34,35,36,37]. Currently, research on vegetation change in Xinjiang primarily focuses on analyzing the spatiotemporal variations of a single vegetation index (NDVI or LAI) and its relationships with climate factors, including air temperature, precipitation, soil moisture, and evapotranspiration. Duan et al. [38] used partial correlation analysis to examine the relationship between the NDVI of grasslands and climate factors, indicating that precipitation during the growing season and summer had the most significant impact on grassland changes. Zhang et al. [39] compared NDVI datasets of typical arid lands, Xinjiang and Arizona, which have similar landscapes, to study the response of arid ecosystems to climatic factors. The results showed that Xinjiang had a higher NDVI anomaly growth rate, and similar types of natural vegetation exhibited responses to climate change that were controlled by temperature and humidity. Hao et al. [40] analyzed the impact of climate change on Xinjiang’s vegetation using NPP data, suggesting that NPP increased for most vegetation types, with precipitation and soil moisture being the most influential climate factors.
Although these studies all indicate that vegetation cover in Xinjiang is increasing, discrepancies exist in the relationships derived between vegetation and climate factors. For example, Zhao et al. [41] argued that NDVI variation was unrelated to temperature, suggesting that precipitation may be the key factor for vegetation growth in the arid regions of northwest China. In contrast, Jiapaer et al. [32] obtained results from analyzing NDVI data in Xinjiang that were inconsistent with Zhao et al.’s findings. Furthermore, most studies primarily focus on the spatiotemporal changes of a single vegetation index. Differences between various vegetation indices and their relationships with climate factors can lead to uncertainty in vegetation driving mechanisms. Therefore, this study used NDVI, LAI, and GPP as vegetation indices to analyze the characteristics of vegetation changes in Xinjiang from 1991 to 2018, and to compare the differences in spatial distribution among these indices. Additionally, the response of vegetation in Xinjiang to climate change was explored by integrating the spatiotemporal variations of temperature and precipitation during the study period. The correlation distributions between different vegetation growth indices and climate factors were also compared. The spatiotemporal distributions of different vegetation growth indices in Xinjiang and their correlations with temperature and precipitation were also compared to understand the spatiotemporal differences in vegetation change (Figure 1), thus providing a more realistic reflection of vegetation dynamics and potential driving mechanisms under warming and humidification, offering support for land use management, optimizing land use planning, and reducing ecological impacts.

2. Materials and Methods
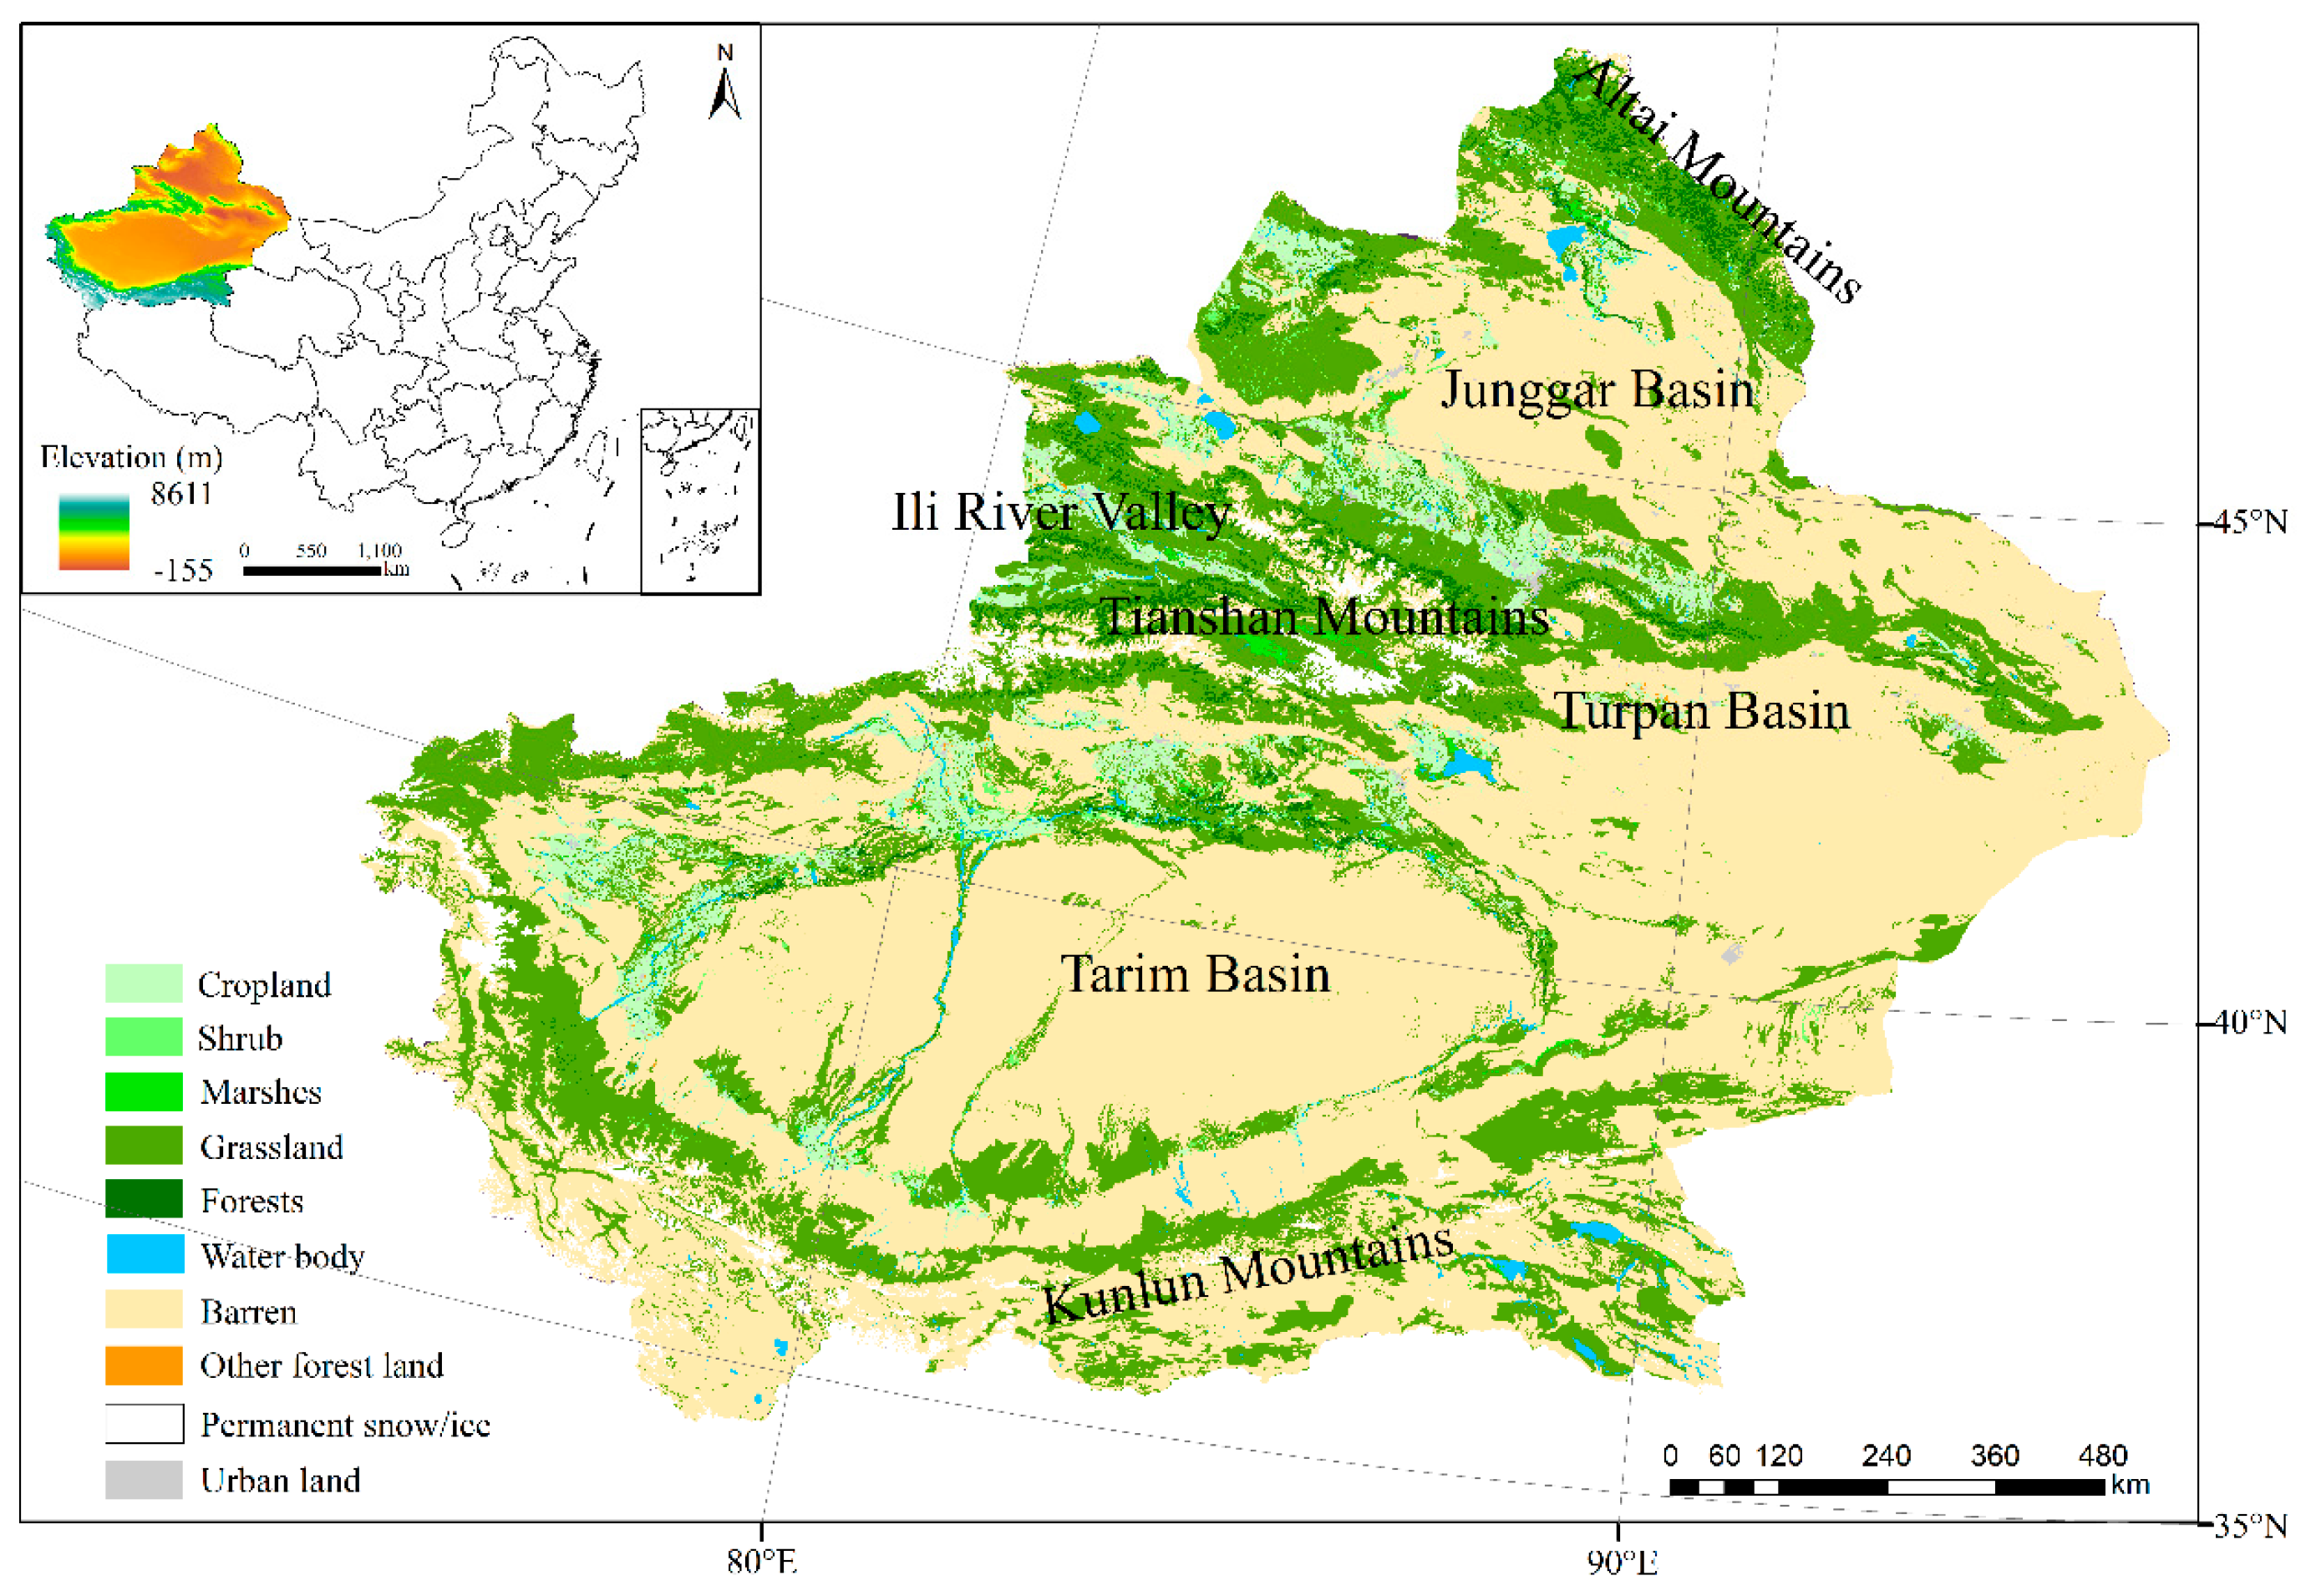
2.1. Study Area

Xinjiang is located in northwest China, covering an area of 1.66 million km2 (34°25′ N–48°10′ N, 73°40′E–96°18′ E) (Figure 2). The region features unique topography, with three major mountain ranges (Altai Mountains, Tianshan Mountains, and Kunlun Mountains), two major basins (Junggar Basin and Tarim Basin), and numerous oases arranged from north to south, forming an alternating pattern of mountains, basins, and oases.
Xinjiang has a temperate continental climate, characterized by arid conditions and large temperature differences between day and night. From 1991 to 2018, the average annual temperature was 11.6 °C, and the average annual precipitation was 147.0 mm. The unique natural geographic environment results in significant spatiotemporal differences in water and heat distribution. The north of the Tianshan mountains has higher precipitation and lower temperatures, while the south experiences less precipitation and higher temperatures. The vegetation in Xinjiang is diverse, with significant regional differences, and is characterized by low coverage and fragile habitats under the influence of these climatic and topographic conditions. Vegetation in Xinjiang is highly susceptible to climate change and drought stress.

2.2. Data Sources and Preprocessing

2.2.1. Meteorological Data

Near-surface air temperature (Ta) and precipitation (P) series were used to characterize the influence of climatic factors on vegetation. Daily–scale near–surface air temperature data were derived from a reconstruction model based on in situ observations and reanalysis data (https://zenodo.org/records/5502275; accessed on 6 September 2024) [42]. Monthly precipitation data were derived by combining monthly anomaly surfaces with baseline climatology surfaces (ChinaClim-baseline) using Climate-Assisted Interpolation (CAI) (https://zenodo.org/records/5919442; accessed on 6 September 2024) [43]. All meteorological data have a spatial resolution of 5 km and have been post-processed for direct use.

2.2.2. Vegetation Data

The characteristics of vegetation growth in the study area were analyzed using three remote sensing vegetation products, including GPP, LAI, and NDVI. Considering that Xinjiang is an arid to semi–arid region with a complex soil background, these three indices were more suitable, which could help reflect changes in vegetation cover, biomass accumulation, and leaf area, aligning well with the objectives. The monthly-scale GPP data were simulated from NIRv (Normalized Difference Vegetation Index and near-infrared reflectance), with a spatial resolution of 5 km and units of 0.0001 g C/m2 d. The data are sourced from the Big Data Platform for Spatiotemporal Environmental Studies in the Three Poles (https://figshare.com/articles/dataset/Longterm_1982-2018_global_gross_primary_production_dataset_based_on_NIRv/12981977/2; accessed on 2 September 2024) [44]. The LAI data were generated by combining AVHRR and MOD09A1 C6 datasets (https://zenodo.org/records/4700264; accessed on 2 September 2024) [45], with an 8day temporal resolution, a spatial resolution of 5 km, and units of 0.01 m2/m2.
NDVI data were derived from the 16day composite product from the Advanced Very High Resolution Radiometer (AVHRR) (https://daac.ornl.gov/cgi-bin/dsviewer.pl?ds_id=2187; accessed on 2 September 2024) [46], with a spatial resolution of 5 km.
All climate and vegetation data were reprojected using the Albers Equal Area Conic Projection. For further analysis and calculations, all data were processed to monthly averages at the pixel scale, and spatial matching was achieved through resampling. The processed climate and vegetation data have a spatial resolution of 5 km and a temporal monthly scale, covering the period from 1991 to 2018.

2.2.3. Land Use Data
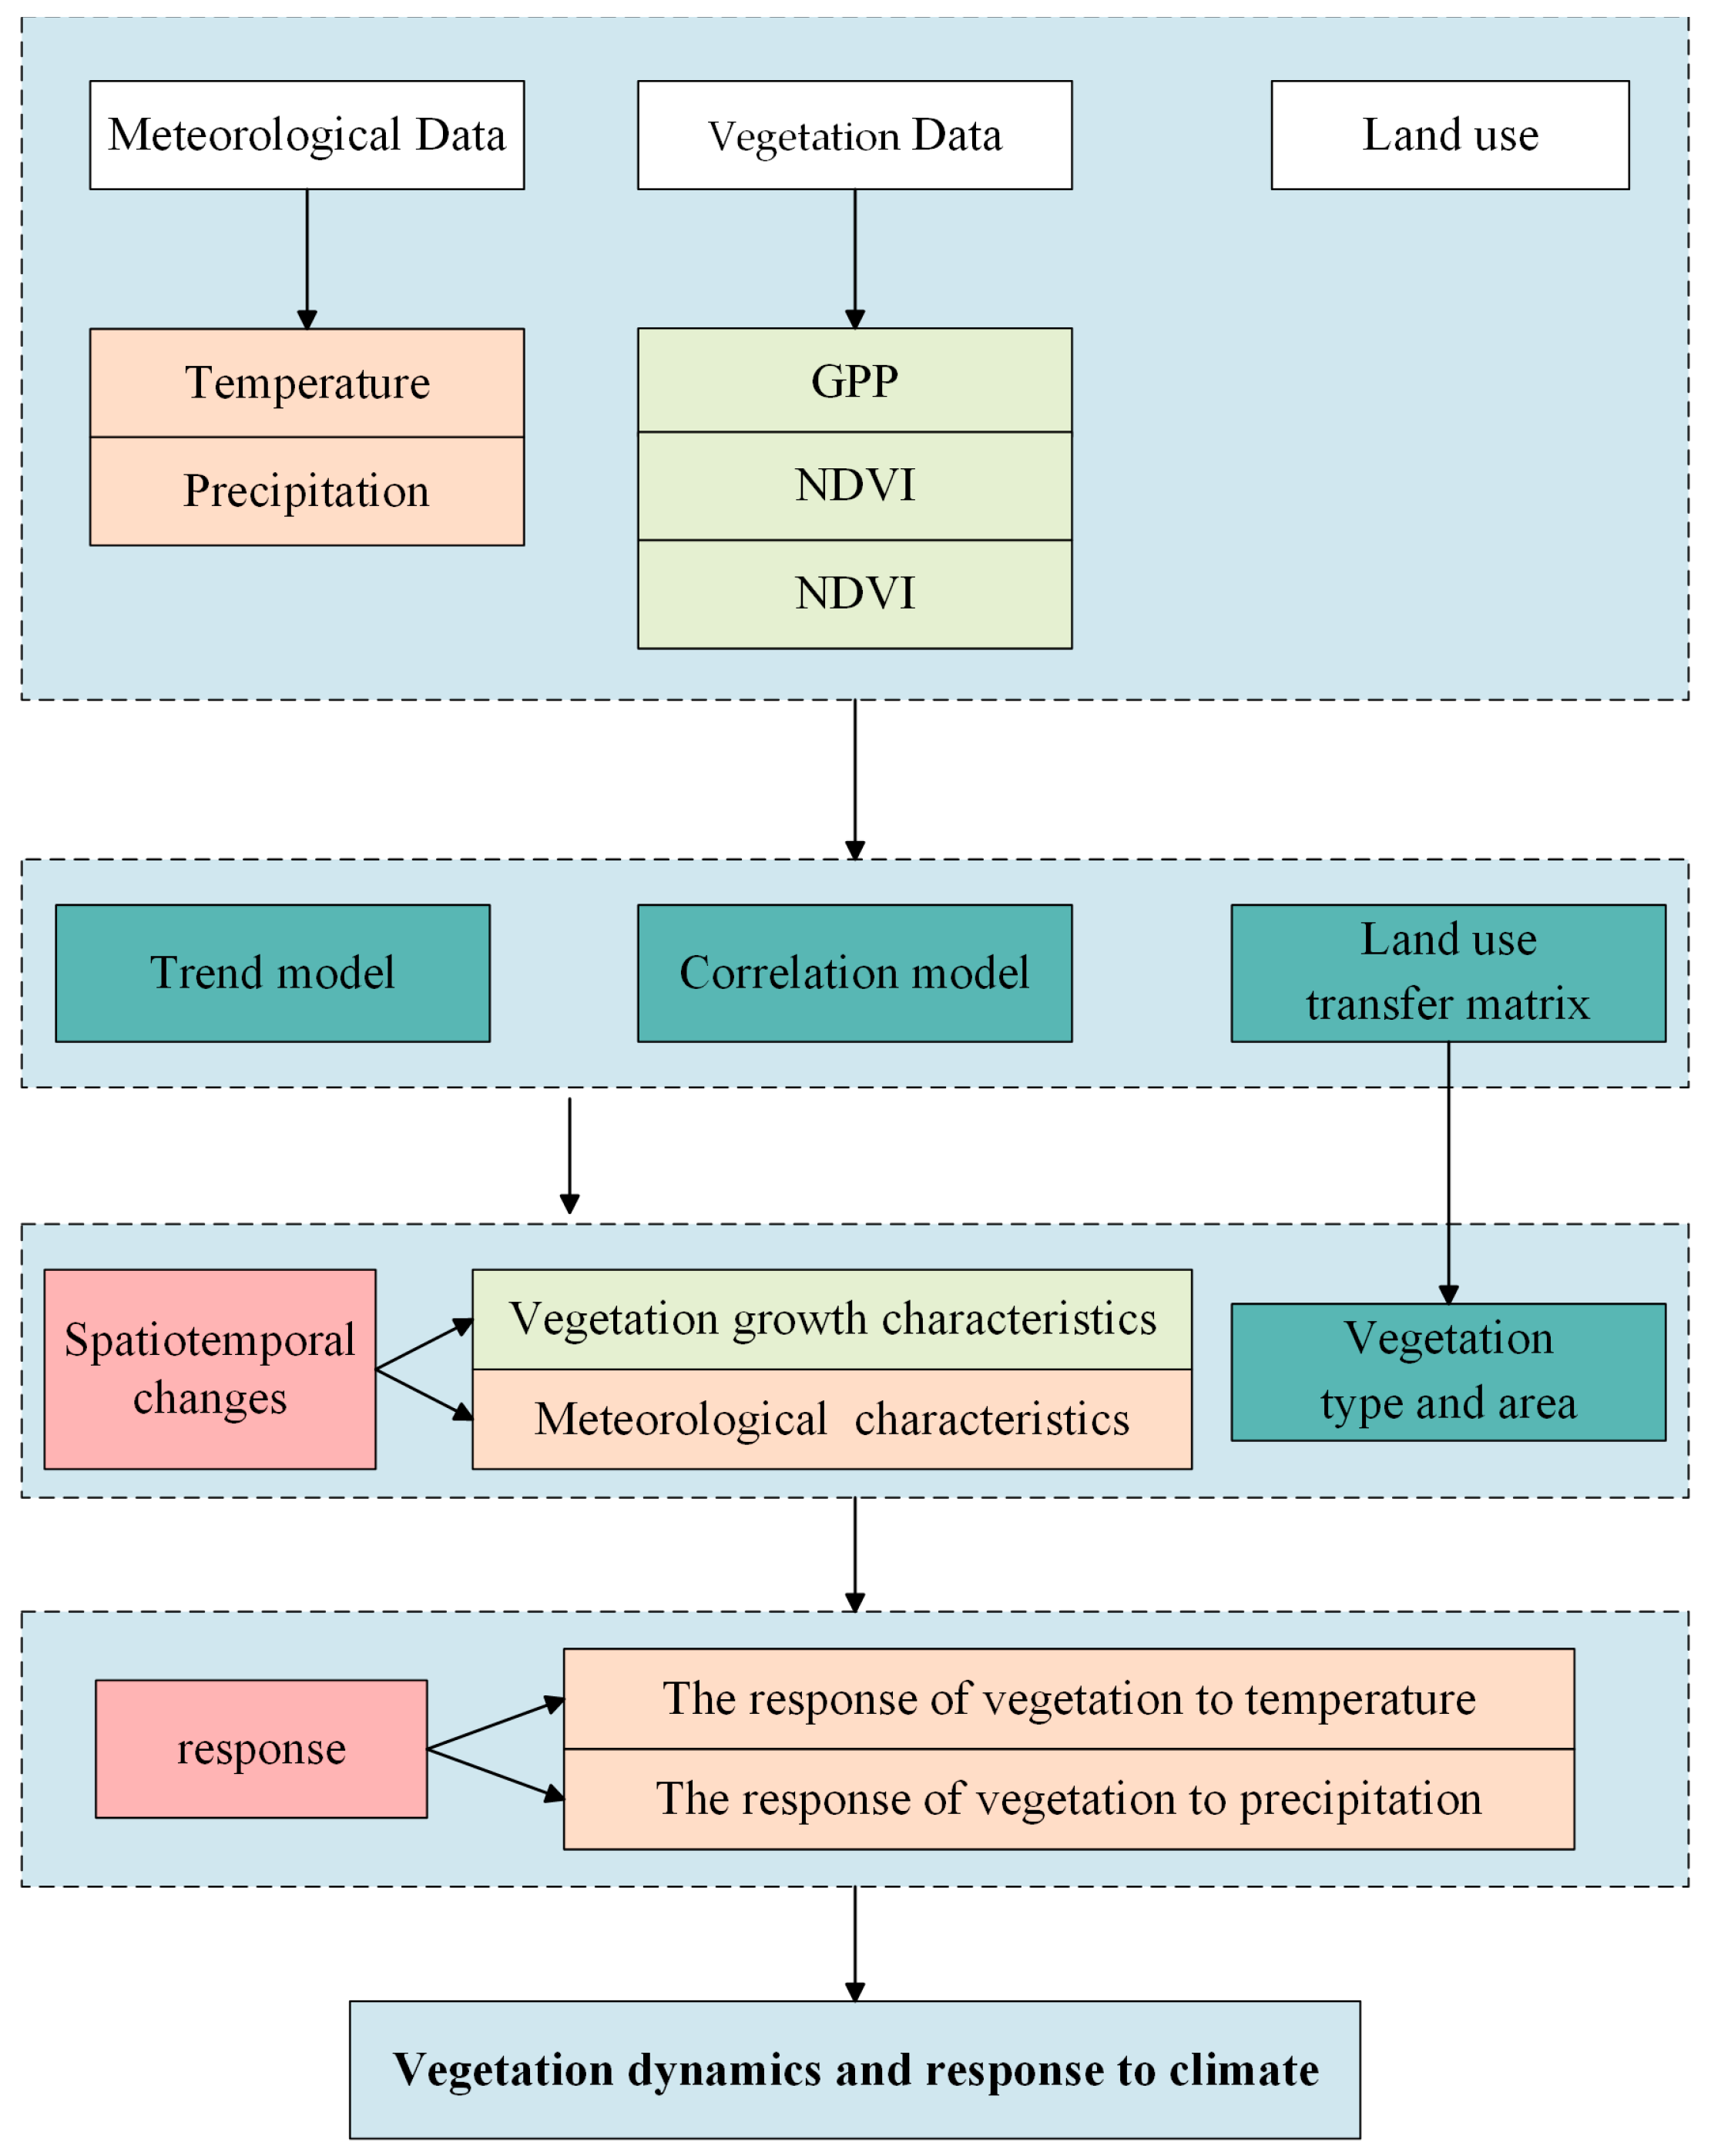
Land use data spanning 1991 to 2018 were obtained primarily through Landsat imagery, supplemented with visually interpreted samples from satellite time-series data, Google Earth, and Google Maps. Temporal metrics from all accessible Landsat images served as inputs for a random forest classifier to produce classification outputs. To improve the spatial-temporal coherence of the CLCD, a post-processing approach incorporating spatial-temporal filtering and logical analysis was applied (https://zenodo.org/records/8176941; accessed on 22 September 2024). The data have a spatial resolution of 1 km × 1 km, using the Albers Conic Equal Area projection parameters. The spatial resolution of all data used in the study is 5 km × 5 km using resampling.

2.3. Method

2.3.1. Trend Analysis

A univariate linear regression analysis was applied to per-pixel vegetation (NDVI, LAI, and GPP) and meteorological data (P and Ta) from 1991 to 2018. The regression yielded the slopes of NDVI, LAI, GPP, P, and Ta over multiple years using MATLAB 2018b (MathWorks, Natick, MA, USA), representing the vegetation change trends in Xinjiang during the study period. The calculation formula is as follows:
θ Slope = n × i = 1 n i × X i i = 1 n i i = 1 n X i n × i = 1 n i 2 ( i = 1 n i ) 2
where i is the year, and Xi is the value of NDVI, LAI, GPP, P, or Ta for the year i. The slope calculated for each pixel represents the overall trend of NDVI, LAI, GPP, P, or Ta over multiple years for that pixel. θSlope > 0 represents an increasing trend for NDVI, LAI, GPP, P, or Ta, while the negative value indicates a decreasing trend.

2.3.2. Land Use Transfer Matrix

The land use transfer matrix describes the spatial and temporal evolution of land use in the region by calculating the direction and quantity of transitions between different land use types over a specific period. The land use transfer matrix in the study was calculated based on data from 1991 and 2018. This study used ArcGIS 10.2 (Esri, Redlands, CA, USA) to analyze the land use transfer matrix. The calculation formula is as follows:
S ij = S 11 S 1 n S 21 S 2 n S n 1 S nn
where S represents the total land area of the study region, n is the number of land use types, and i and j represent the initial and final land use types during the study period, respectively.

2.3.3. Correlation Analysis

The Pearson correlation coefficient is widely used to measure the degree of linear correlation between two variables. In this study, the Pearson correlation coefficient was used to evaluate the correlation between vegetation and meteorological data and to conduct a quantitative analysis of the relationship through MATLAB 2018b (MathWorks, USA MA). The calculation formula for the correlation coefficient is as follows:
R x y = i = 1 n [ ( x i X ¯ ) ( y i Y ¯ ) ] i = 1 n ( x i X ¯ ) 2 i = 1 n ( y i Y ¯ ) 2
where X ¯ and Y ¯ represent the mean values of vegetation data (NDVI, LAI, or GPP) and climate data (P or Ta). Rxy is the correlation coefficient, indicating the degree of correlation between vegetation indices and climatic factors. A larger correlation coefficient indicates a stronger correlation between the two factors at that pixel.

3. Results

3.1. Temporal and Spatial Variations of Vegetation Characteristics

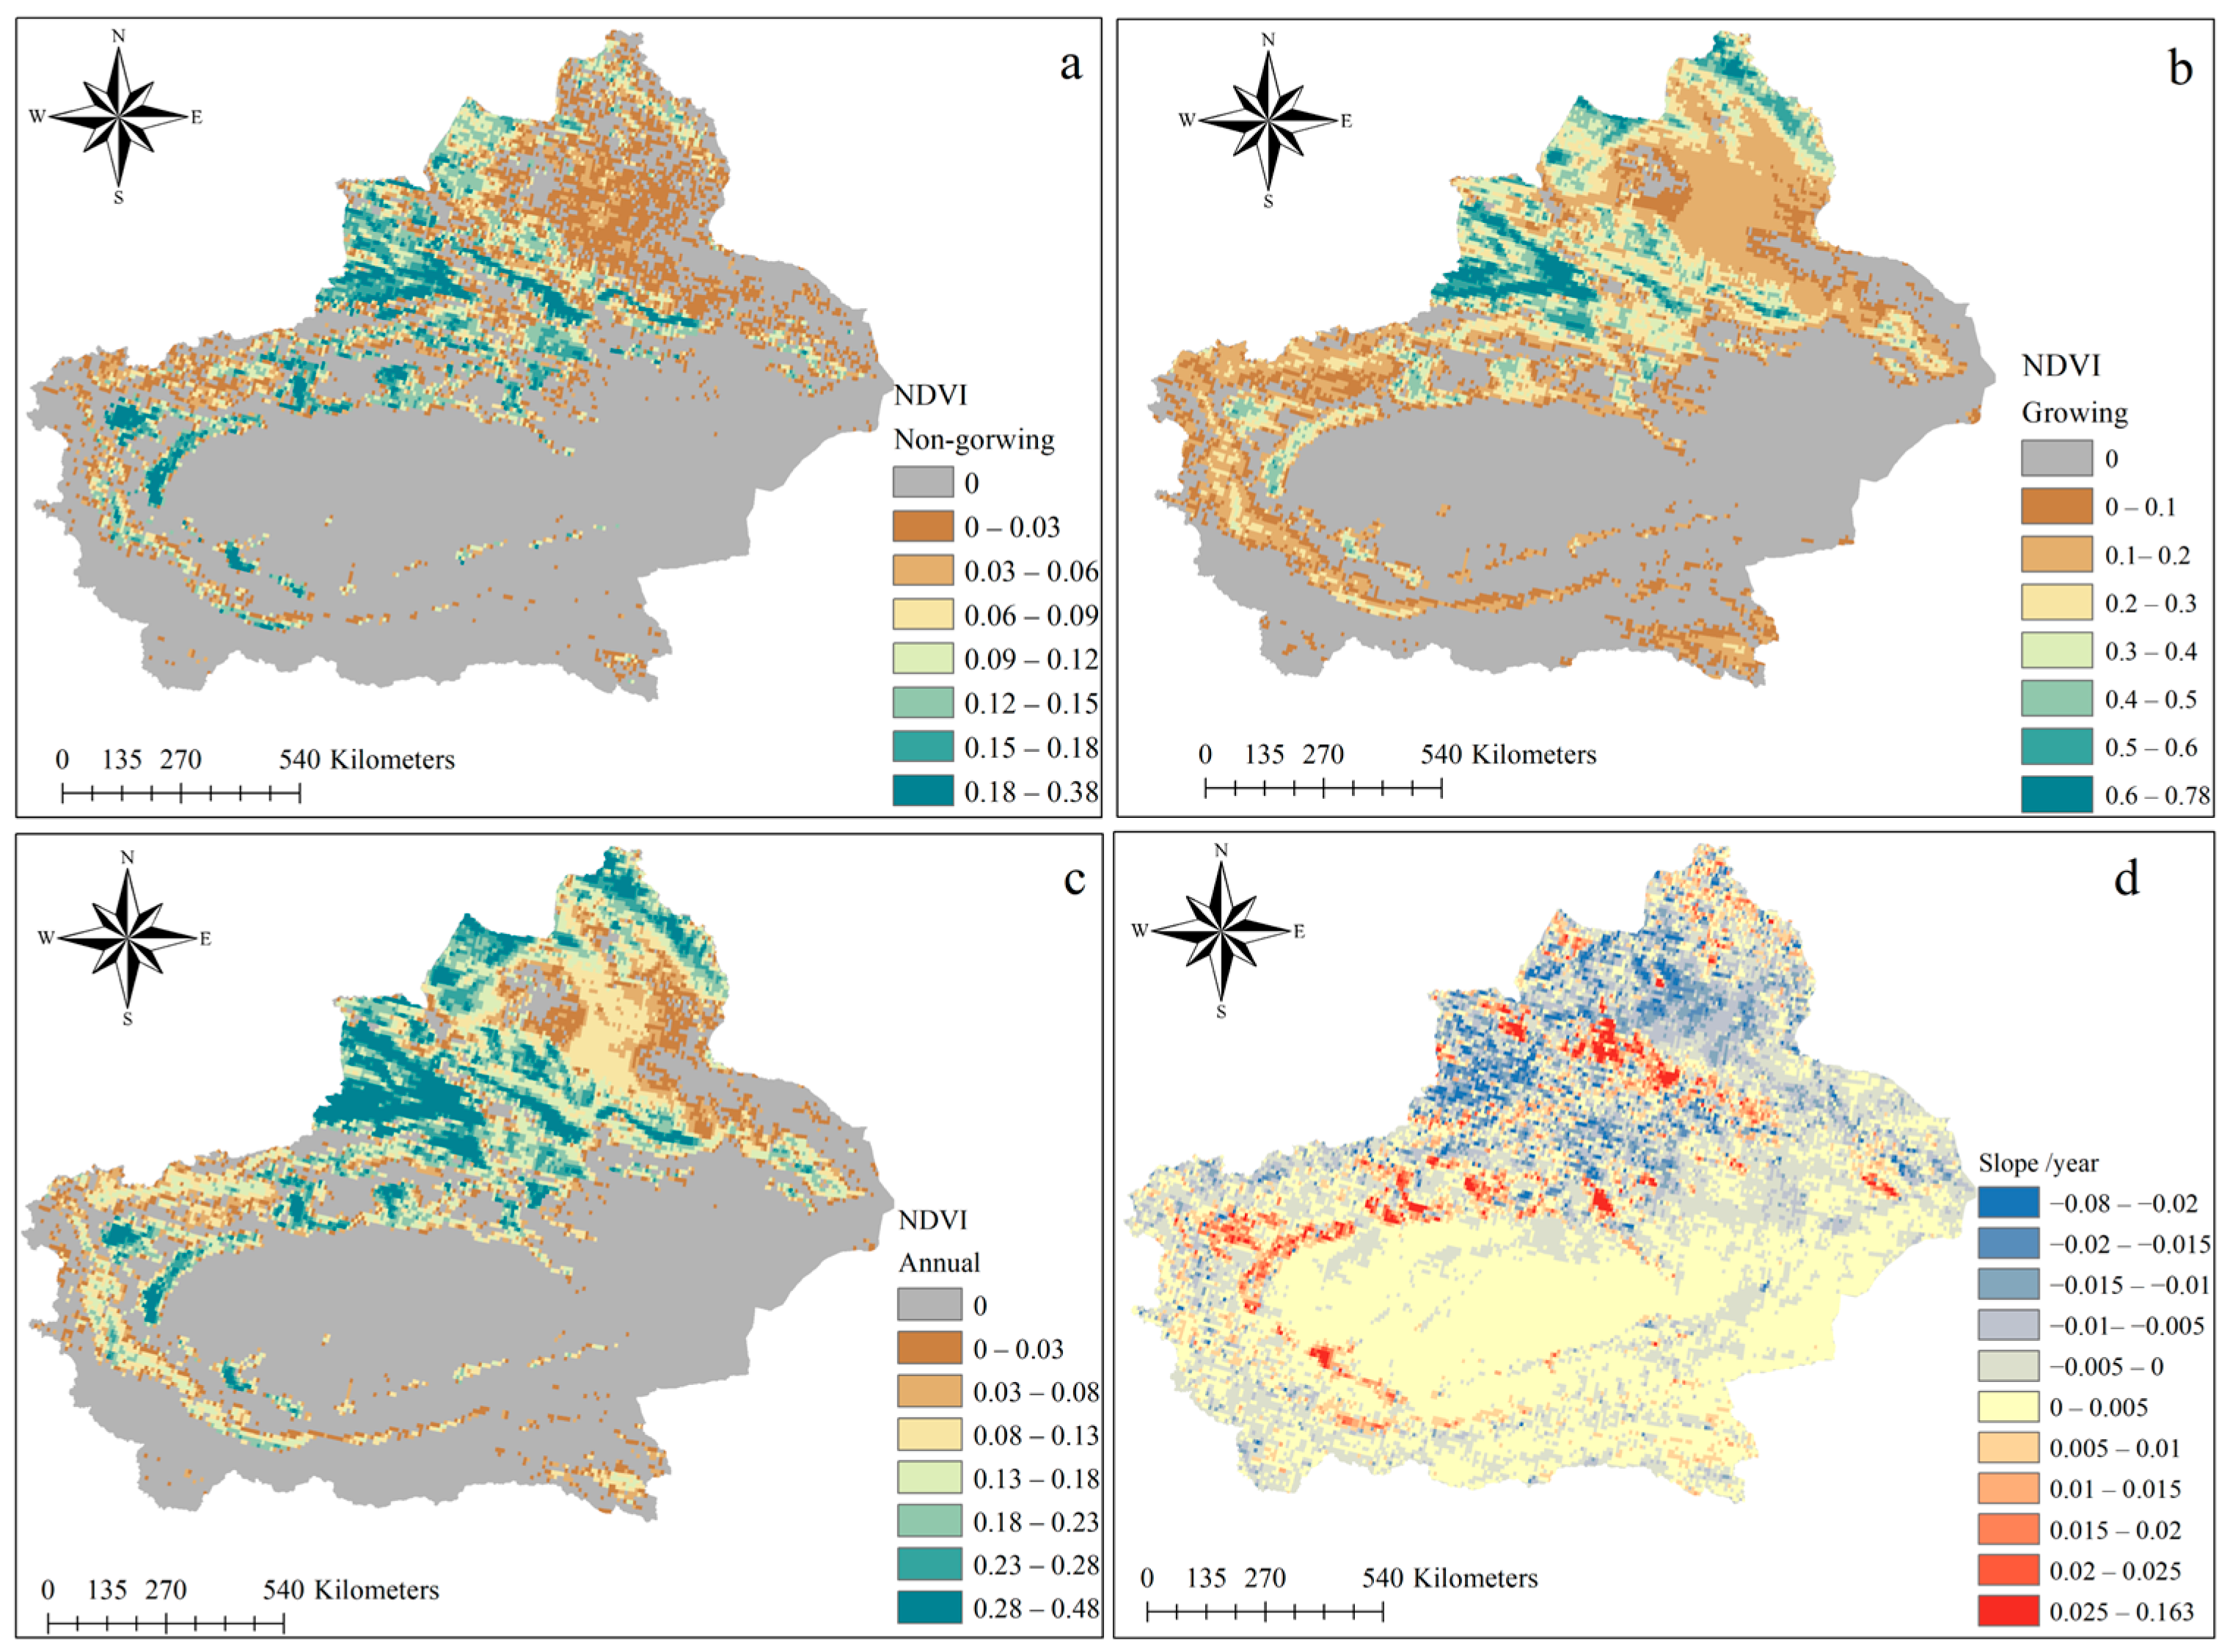
3.1.1. NDVI Change Trend

The annual average NDVI value of vegetation in Xinjiang generally indicated a characteristic of being higher in the north and lower in the south, ranging from 0 to 0.48 (Figure 3). The high-value areas of annual NDVI (>0.23) were primarily located in the western and northern Tianshan Mountains, Altai Mountains, Ili River Valley, mountainous areas around the Junggar Basin, and regions surrounding the Tarim Basin. The distribution and variation of the annual NDVI values were mainly influenced by vegetation conditions during the growing season (May to October). The maximum NDVI value reached 0.78, mainly distributed in the western Tianshan Mountains and Ili River Valley during the growing season. The high-value NDVI (>0.12) areas during the non-growing season were similar to those of the growing season, mainly distributed in the western and northern Tianshan Mountains and areas surrounding the Tarim Basin. Influenced by topography and meteorological factors, vegetation in the arid southern Xinjiang region was primarily distributed around the Tarim Basin and in high-altitude mountainous areas during different seasons. The agricultural areas in southern Xinjiang were concentrated in areas with high NDVI values.
Overall, the multi-year average NDVI value was 0.28, ranging from 0.04 to 0.78. Vegetation showed a gradually increasing trend during the study period (slope = 0.52, R2 = 0.58), indicating an improvement of ecological conditions. In terms of NDVI trend distribution, the NDVI values of desert vegetation mostly showed a decreasing trend (>−0.05). Areas with a significant declining trend (<−0.2) were mainly located in the central Tianshan Mountains, Ili River Valley, and Junggar Basin. Regions with an increasing NDVI trend greater than 0.2 were mainly distributed in the northern Tianshan Mountains and areas around the Tarim Basin. These regions were mainly dominated by grasslands and croplands.

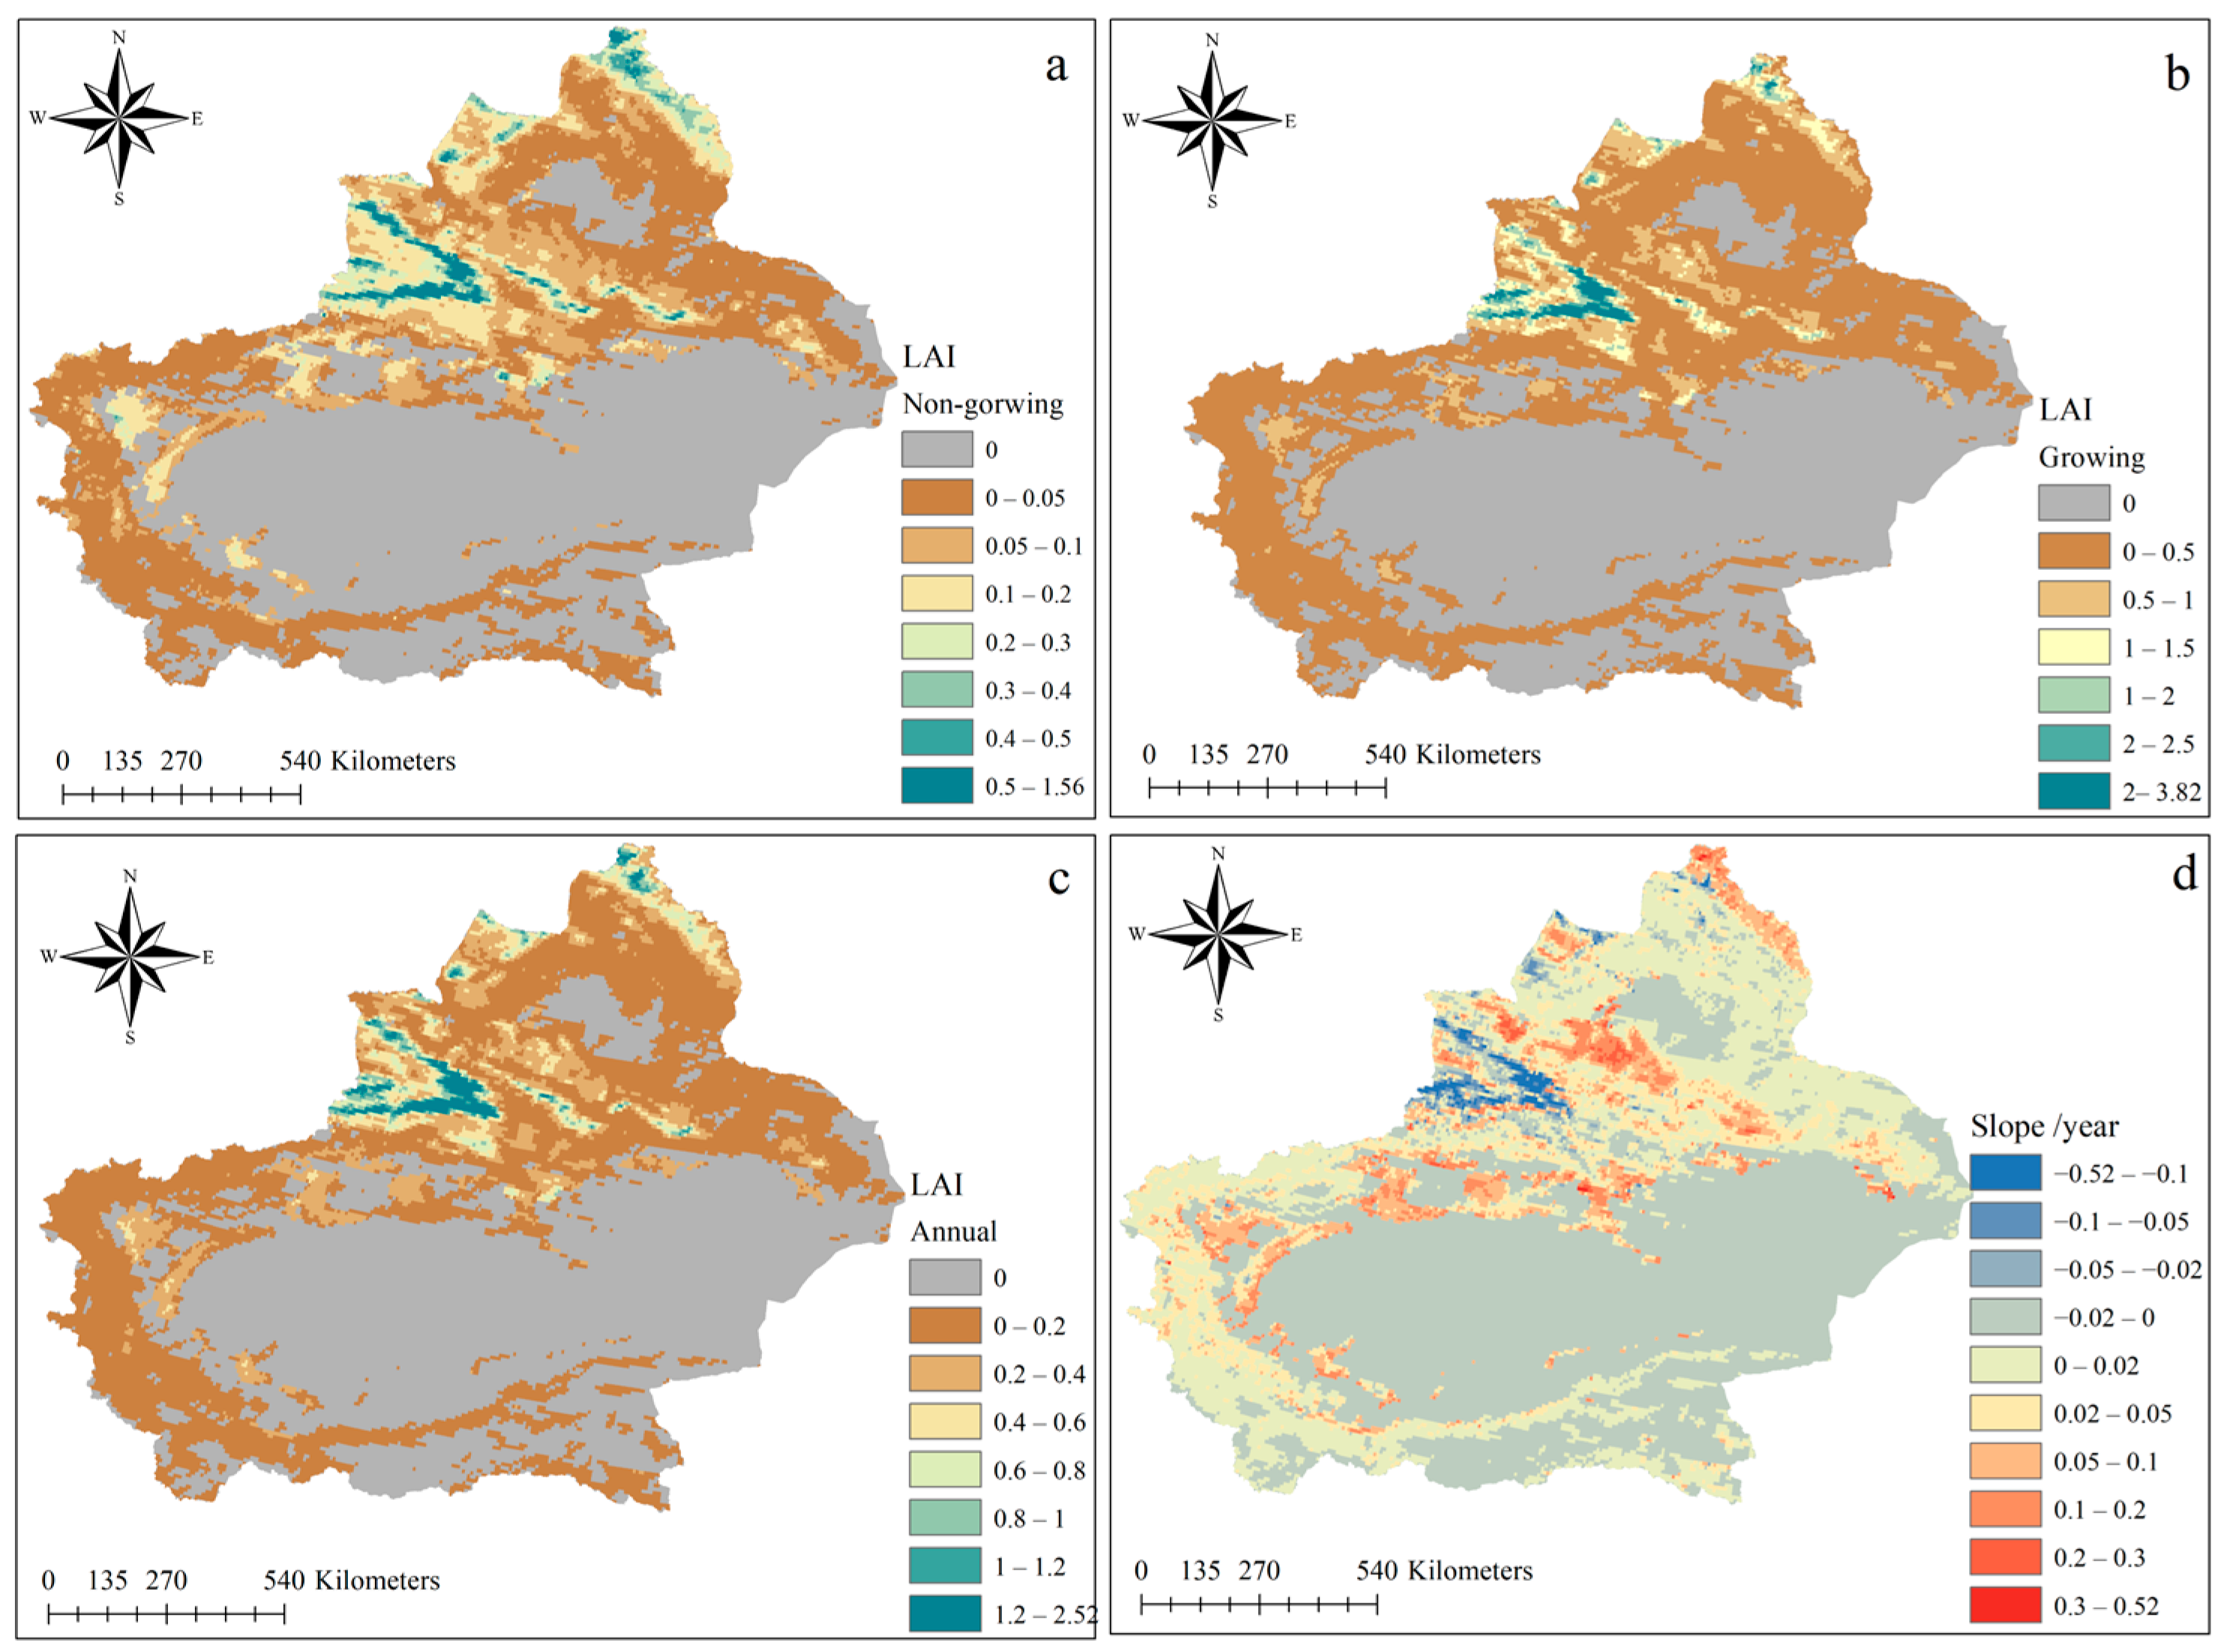
3.1.2. LAI Change Trend

In different seasons, the overall distribution of LAI was similar to NDVI, showing significantly higher values in northern Xinjiang compared to southern Xinjiang (Figure 4). The annual average LAI ranged from 0 to 2.52, with high-value areas (>1.0) primarily located in the western Tianshan Mountains and the northwestern part of the Altai Mountains. The highest LAI values during the growing and non-growing seasons reached 3.82 and 1.56, respectively. Due to the alternating distribution of mountains and basins, as well as the influence of climatic factors such as temperature and precipitation, vegetation predominantly grew in the more humid mountainous areas. As a result, some mountainous areas experienced active vegetation growth even during the non-growing season. In southern Xinjiang, the annual average LAI did not exceed 0.4. LAI values between 0 and 0.2 were mainly distributed in the Kunlun Mountains and Pamir Plateau, where alpine meadows and tundra dominated.
The multi-year average LAI in Xinjiang was 0.34, ranging from 0.06 to 3.8. During the study period, the annual average LAI showed an increasing trend (slope = 0.14, R2 = 0.82), indicating healthy vegetation growth in Xinjiang. However, in the high LAI areas of western Tianshan and some scattered regions in northwestern Xinjiang, the annual LAI trend showed a decline (Figure 3d). Areas where the annual LAI trend value decreased by more than −1.0 were mainly grassland regions. Areas with an annual LAI trend value greater than 1.0 were mainly distributed in the Altai Mountains, parts of northern Tianshan, and the areas surrounding the Tarim Basin. Areas with increasing trend values were mainly grasslands and croplands. The overall trend distribution of LAI in Xinjiang was similar to NDVI, but there were slight variations in the Junggar Basin and its northwest region.

3.1.3. GPP Change Trend

As an effective indicator of ecosystem productivity, GPP also showed significant spatial and temporal distribution characteristics in Xinjiang. Figure 5 indicates the distribution of GPP during the growing season, non-growing season, and annual average. It can be seen that the spatial distribution of GPP in Xinjiang vegetation varied greatly, with higher values in northern Xinjiang and lower values in southern Xinjiang. The annual average GPP ranges from 0 to 1285 g C m−2 yr−1, with the highest GPP values during the growing and non-growing seasons reaching 392 g C m−2 yr−1 and 179 g C m−2 yr−1.
The high-value areas were mainly distributed in northern Xinjiang, specifically in the western and northern Tianshan Mountains, Altai Mountains, and the northwestern Junggar Basin. The distribution of annual average GPP was primarily influenced by growing-season GPP values, particularly in the higher-latitude Altai Mountain region. In contrast to northern Xinjiang, the annual average GPP in southern Xinjiang did not exceed 500 g C m−2 yr−1. Agricultural areas surrounding the Tarim Basin were the main regions with relatively high GPP values in southern Xinjiang.
Overall, the multi-year average GPP of Xinjiang vegetation was 274.0 g C m−2 yr−1, with values ranging between 236.9 g C m−2 yr−1 and 316.1 g C m−2 yr−1 from 1990 to 2018. There was an overall increased trend (slope = 1.19, R2 = 0.52), indicating a continuous improvement in ecosystem status. However, areas where the GPP trend decreased by more than 15 were mainly found in the Tianshan Mountains, Altai Mountains, and the northwestern part of the Junggar Basin in northern Xinjiang. In contrast, agricultural areas around the basins and low-altitude areas in the mountains were the main regions of GPP increase. Compared to the trend distribution of NDVI and LAI, GPP trend values suggested a decline in the Altai Mountains, the area around the Junggar Basin, the southern Tianshan Mountains, and high-altitude regions in the mountains. Regions showing an increasing GPP trend were similar to the distribution of the other two indicators.

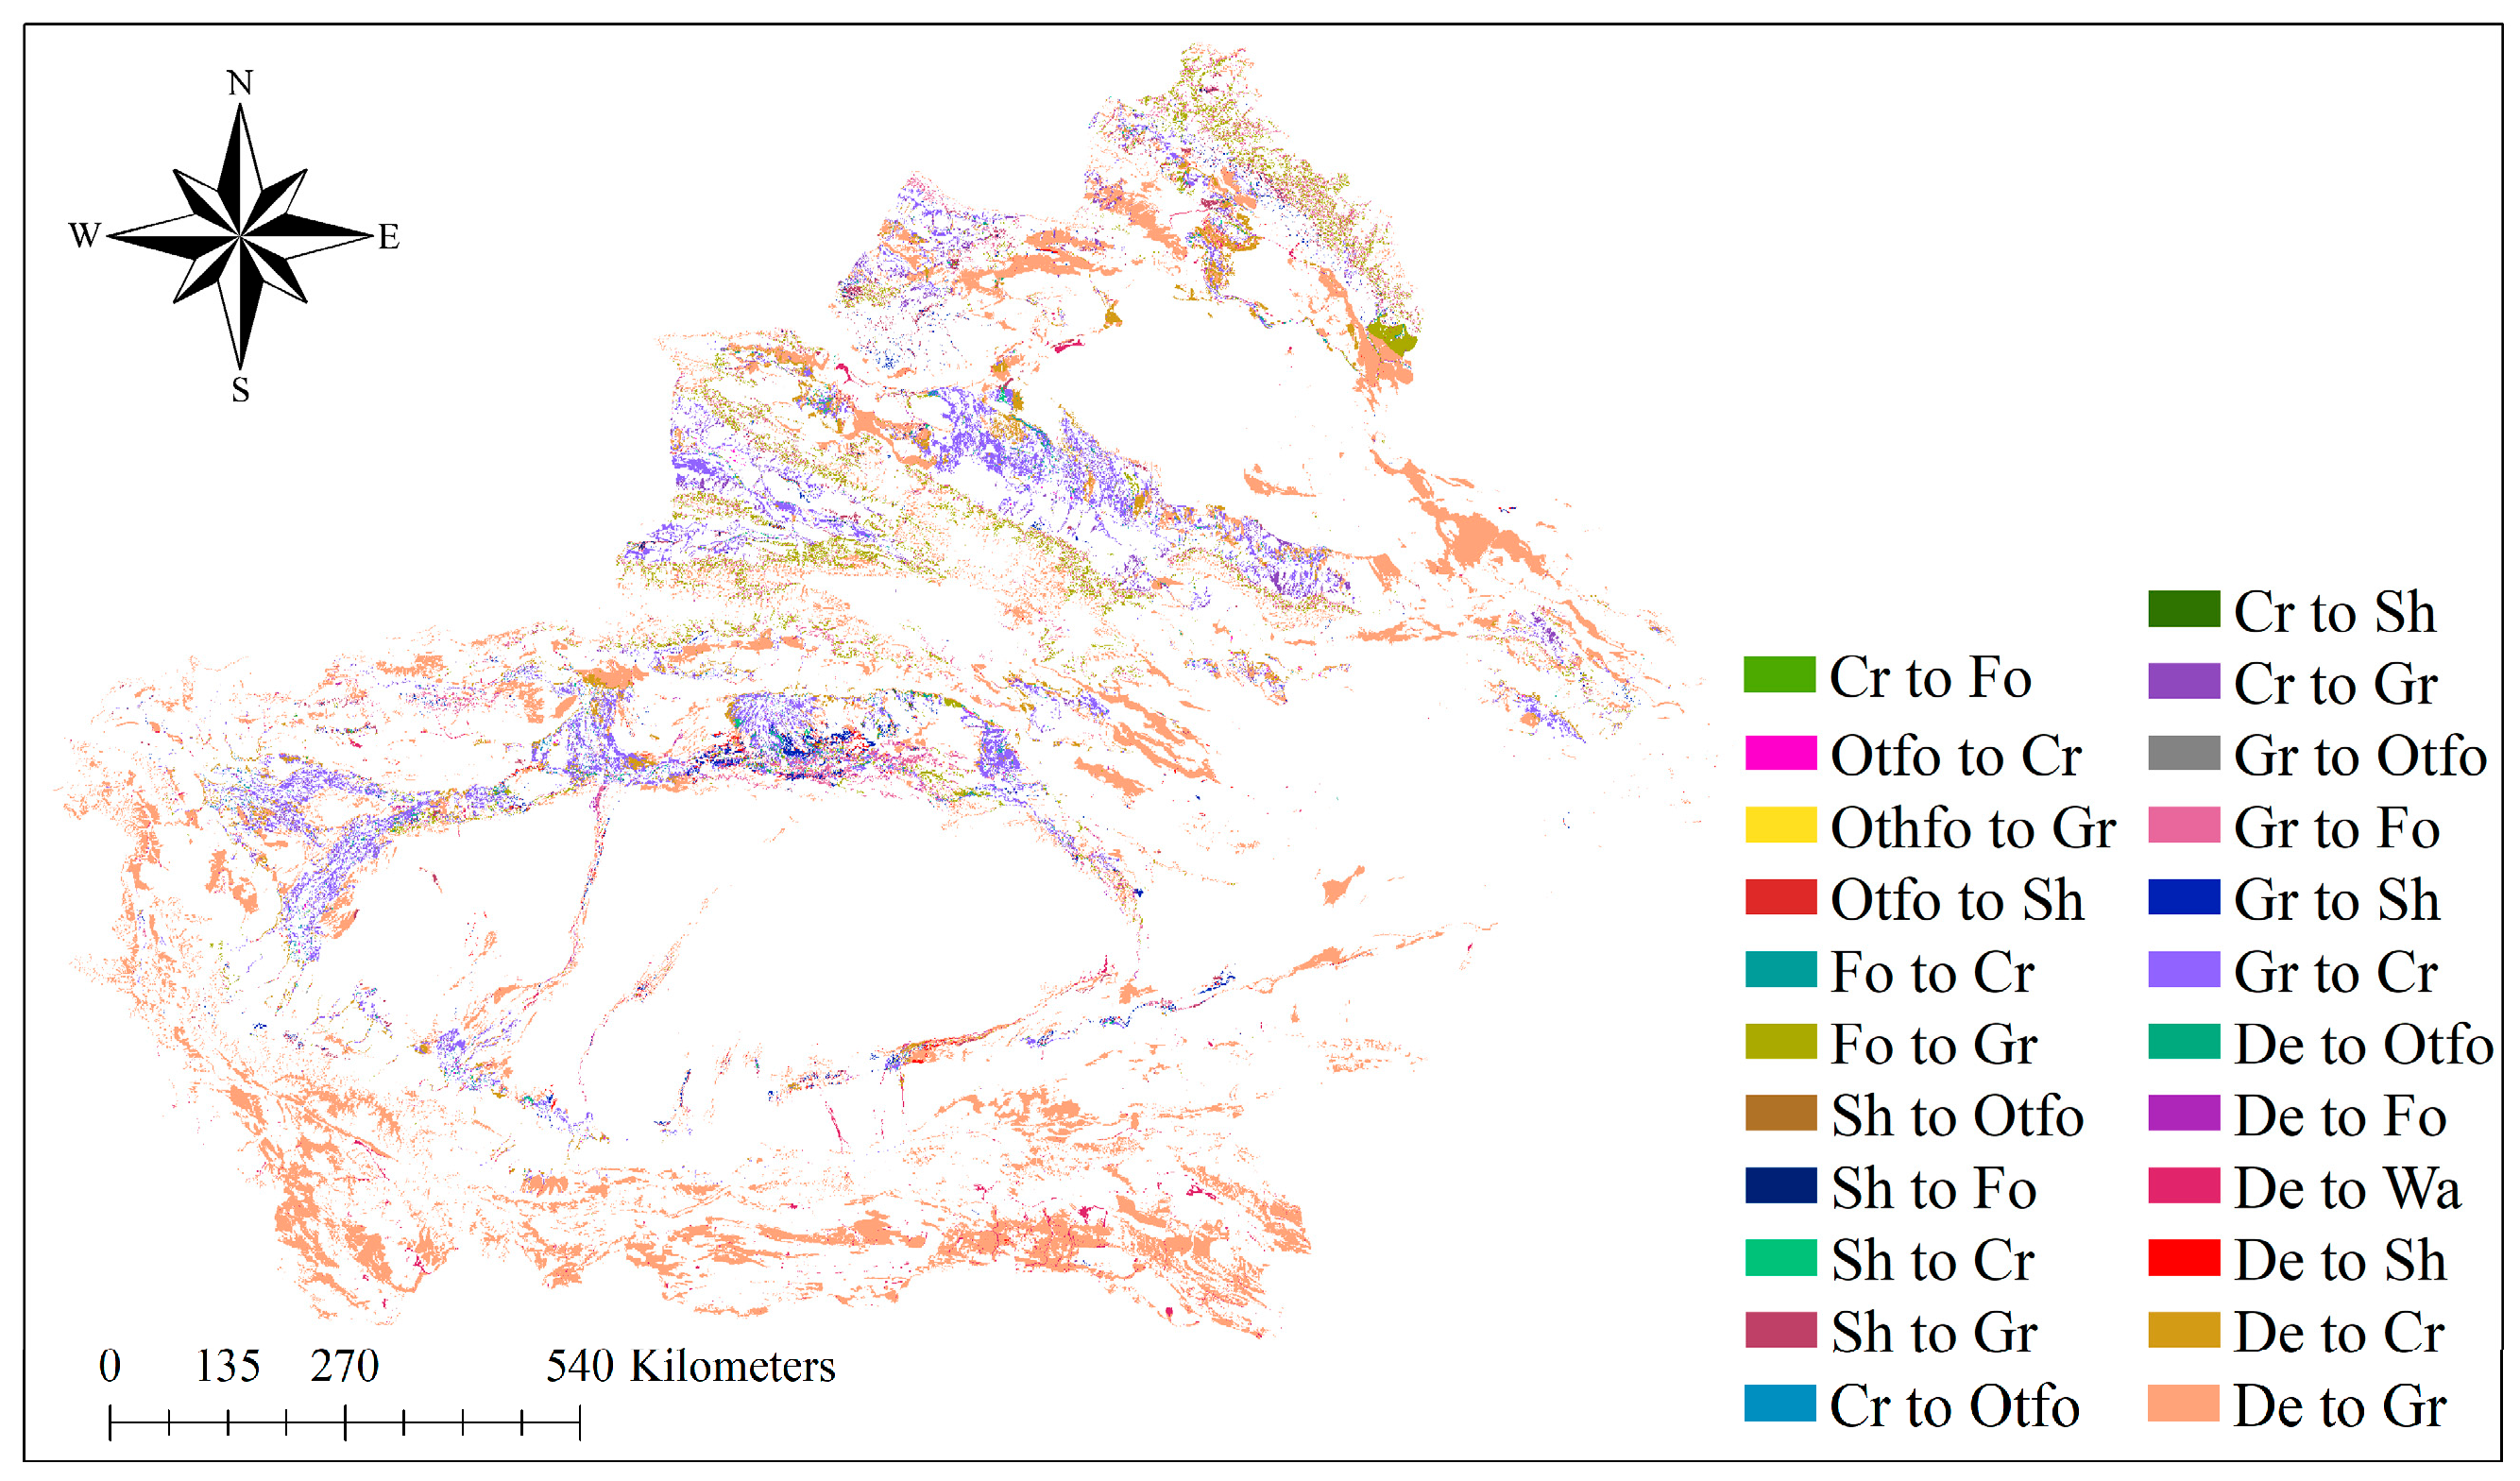
3.2. Temporal and Spatial Variations of Vegetation Types and Areas

From 1991 to 2018, the vegetation area in Xinjiang increased by 165,669.8 km2, with grassland accounting for the largest share of this enhancement (88.7%), followed by cropland (9.7%). Grassland also represented the largest portion of vegetation loss at 92.9%, followed by cropland, which decreased by 4.2%. During the study period, the net increase in vegetation cover was 24,345.8 km2. Except for cropland, the areas of forest and shrub land decreased, while the grassland area remained relatively stable. In southern Xinjiang, the main region of grassland expansion was in the Kunlun Mountains, while in northern Xinjiang, it primarily occurred at higher elevation around the Junggar Basin (Figure 6 and Figure S1). The increase in natural forest mainly occurred in the Altai and Tianshan Mountains of northern Xinjiang, while other vegetation types like orchard and tea plantation expanded around the Tarim Basin in southern Xinjiang. In both southern and northern Xinjiang, the expansion of cropland mainly occurred around the basin edges. Many areas of cropland expansion overlapped with regions of grassland decline. Human demand for food and cash crops led to the conversion of more natural vegetation into cropland.
The land use transfer matrix indicated a net increase of 33,062.8 km2 in cropland, mainly from the conversion of grassland (61.2%) and bare/desert (26.0%). The net reduction in natural forest area was 7993.0 km2, with grassland conversion accounting for 87.4% of this reduction, followed by bare/desert for 6.6%. Shrubland saw a net decrease of 1540.9 km2, with 66.6% of this area converted to grassland, 20.5% from bare/desert, and 7.8% from natural forest. The net change in grassland area was −246.1 km2, with 76.7% of new grassland coming from bare/desert and 9.6% from natural forest. It was evident that between 1991 and 2018, the increase in natural vegetation mainly resulted from the conversion of bare/desert, predominantly converted into grassland, which was distributed in mountainous areas. The expansion of natural forests was mainly concentrated in mountainous areas, extending into lower elevations. Cropland expansion was mainly concentrated in the plains and largely resulted from the conversion of grassland.

3.3. The Response of Vegetation to Climate Change

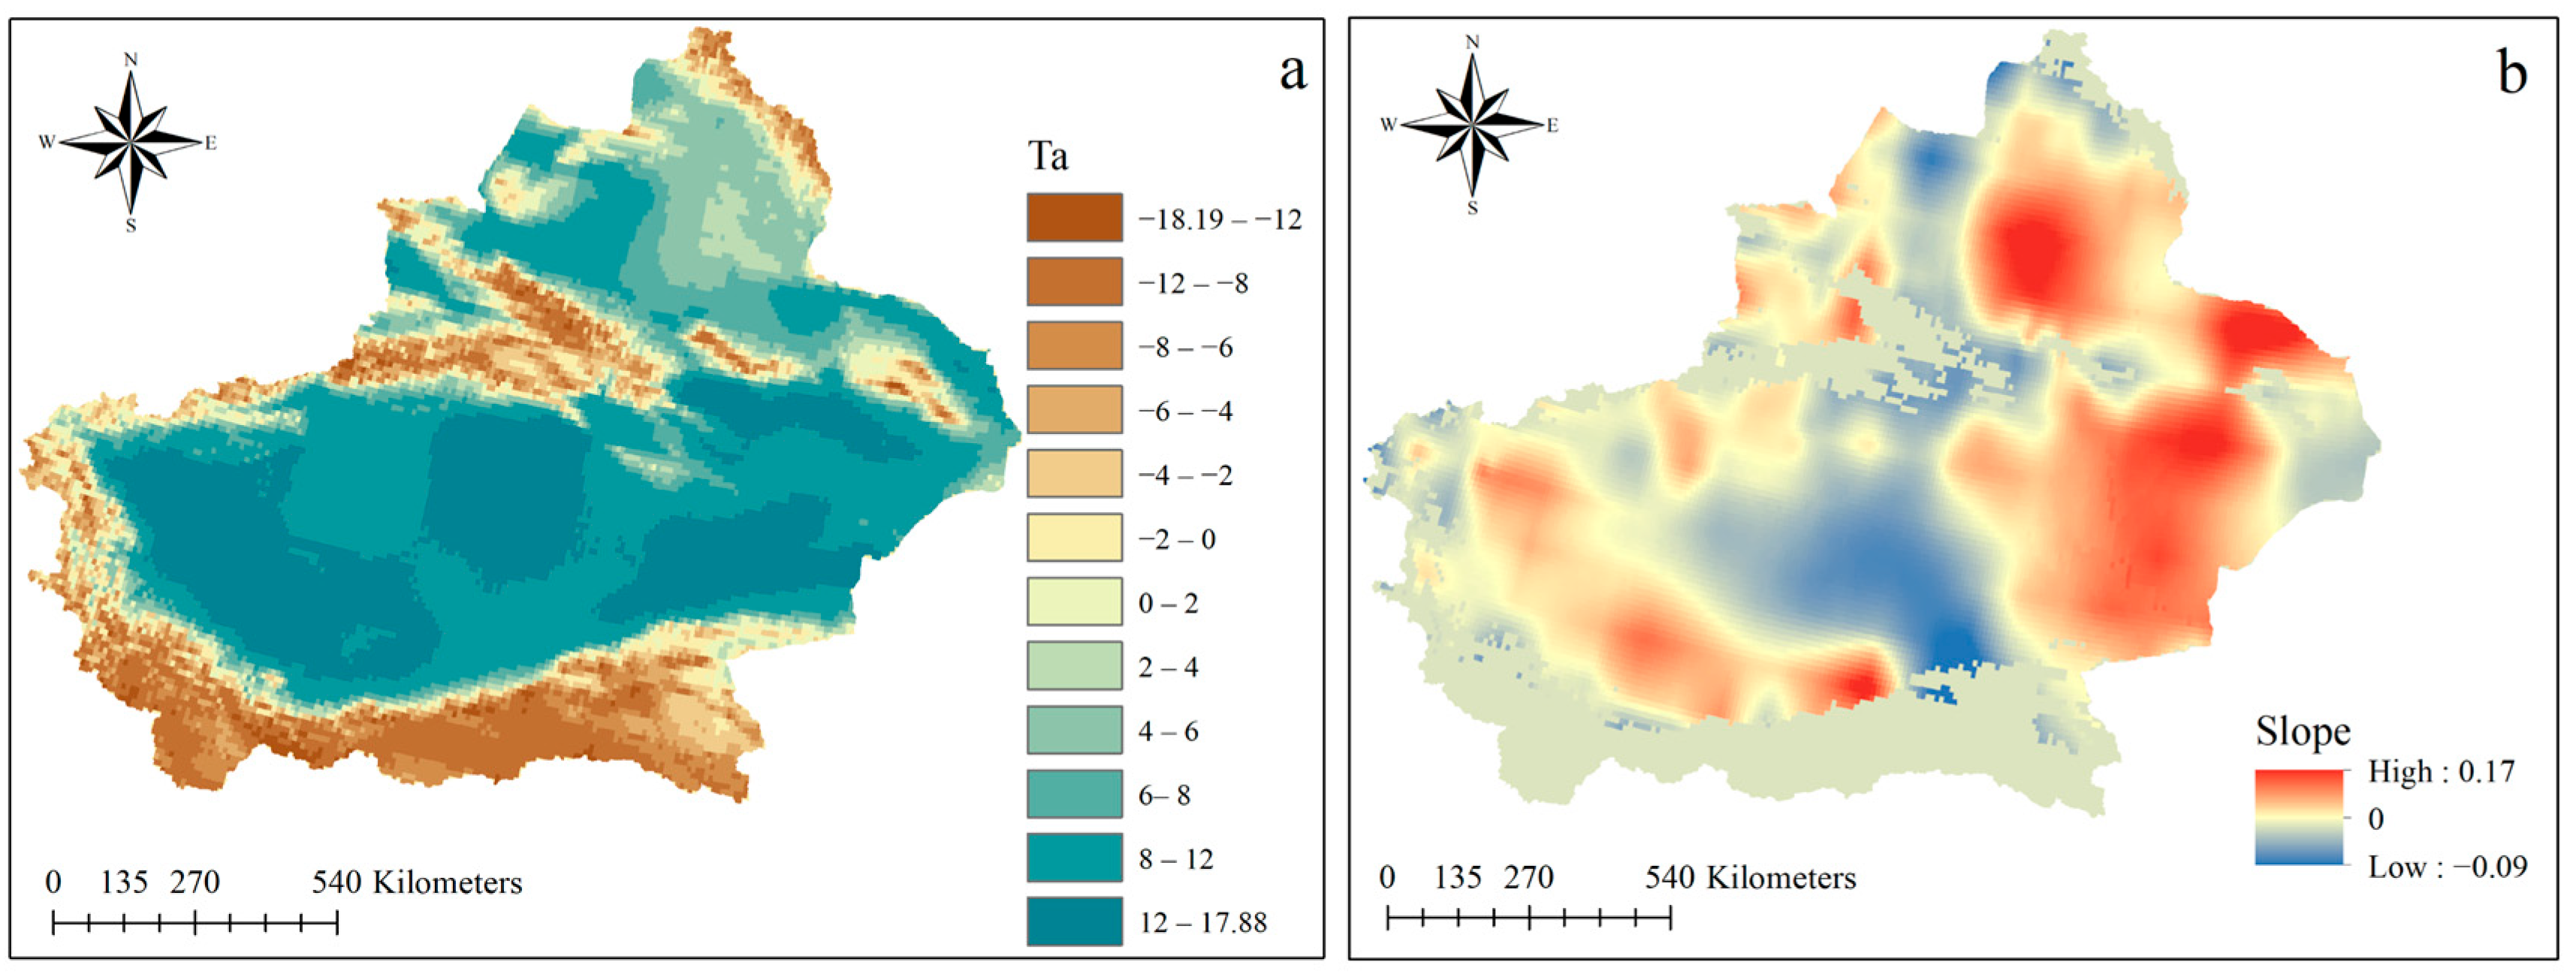
3.3.1. The Changing Trend of Climate Factors

The unique topography led to great regional differences in the distribution of temperature and precipitation in the study region. The long-term annual average temperature in the region ranged from −18.2 °C to 17.9 °C, with an average of 11.6 °C. The temperature distribution showed a pattern of higher temperatures in basins and lower temperatures in mountainous areas (Figure 7). The areas with high temperature were mainly located in the Tarim Basin, Hami Basin, and other areas, with the highest temperatures found in the Turpan Basin in eastern Xinjiang. Low-temperature areas were primarily distributed in the Altai, Tianshan, and Kunlun Mountain ranges. Areas in Xinjiang with increasing temperatures were mainly located in lower-elevation basins and valleys, with significant warming observed in the Junggar Basin, Hami Basin, and the northern Tianshan region (p < 0.05). Regions with decreasing temperatures were mainly distributed in higher-altitude mountainous areas and the central part of the Tarim Basin. Although the central Tarim Basin showed a cooling trend, its annual average temperature remained relatively high.
During the study period, the long-term average annual precipitation ranged from 108.3 mm to 183.4 mm, with an average of 147.0 mm. The spatial distribution of precipitation showed a pattern of more precipitation in the north and less in the south (Figure 8). In northern Xinjiang, the Altai and Tianshan Mountains were the main areas with high precipitation values (>450 mm). In southern Xinjiang, areas with higher precipitation values (>15 mm) were mainly distributed in the southern Tianshan and eastern Kunlun Mountains. Precipitation in the Altai Mountains, Turpan Basin, eastern Tarim Basin, and the eastern Kunlun Mountains showed a decreasing trend, while other areas experienced increasing precipitation. Regions with the most significant decrease in annual precipitation were concentrated in the Altai Mountains, where the decline was statistically significant (p < 0.05). Annual precipitation in the western and southern Tianshan Mountains increased by more than 1.2 mm/year.
Overall, from 1991 to 2018, both temperature and precipitation in Xinjiang showed an upward trend, with slopes of 0.02 and 0.21, respectively. These findings confirmed that, in recent decades, Xinjiang had been gradually shifting towards a warmer and wetter climate, which was expected to have a significant impact on variations in vegetation in study area.

3.3.2. The Correlation Between Vegetation and Precipitation

Figure 9 illustrated the correlations between NDVI, LAI, GPP, and precipitation, revealing significant spatial heterogeneity in the relationships between these indices and precipitation. The proportions of positive and negative correlations varied significantly across the different indices. The proportions of positive and negative correlations between NDVI and precipitation were nearly equal, at 50.3% and 49.8%, respectively. However, regions with positive correlations were mainly located in northern Xinjiang, particularly in the southern Altai Mountains, the northwestern Junggar Basin, the Ili River Valley, and parts of northern Tianshan, with correlation coefficients greater than 0.4. In southern Xinjiang, negative correlation areas dominated, mostly located in basins and high-altitude regions of the Kunlun Mountains. Precipitation in high-altitude mountainous areas mainly fell as snow, which was unfavorable for vegetation growth; thus, regions with correlation coefficients below −0.4 were concentrated in the Kunlun Mountains. Positive correlation areas in southern Xinjiang were mainly concentrated around the Tarim Basin and the southern Tianshan, where land types were predominantly cropland and grassland. These regions received ample sunlight, and increased precipitation promoted the growth of crops and herbaceous plants.
Compared to NDVI, LAI had a higher proportion of positive correlations with precipitation, reaching 85.5%. Of this, 17.5% of the correlations had a coefficient greater than 0.4. Positive correlation areas were mainly distributed in mountainous regions and around basins, especially in the northwestern Junggar Basin and Ili River Valley, where the correlation coefficient exceeded 0.6. The predominant land type in these regions was grassland. Negative correlation areas were mainly located in regions where precipitation was decreasing, whereas in most areas with increasing precipitation, the correlation was positive. The areas where correlation between LAI and precipitation exceeded 0.4 were similar to the regions where NDVI presented a positive correlation in northern Xinjiang. However, the proportion for NDVI exceeding 0.4 in this region was only 5.3%. While both indices led to the same conclusion, that precipitation promoted vegetation growth, the specific correlation coefficients and distribution of correlations differed notably.
The correlation between GPP and precipitation was also primarily positive, accounting for 74.3%. Among them, 4.2% of the correlations had a coefficient greater than 0.4. Compared to NDVI and LAI, GPP showed a weaker correlation with precipitation, with most regions having correlation coefficients between −0.4 and 0.4, accounting for 95.5%. The spatial distribution of correlations was less distinct for GPP compared to the other two indices, showing an interwoven pattern of positive and negative correlations. There was a negative correlation in areas with high precipitation, which may be due to cloud cover blocking sunlight during rainfall and lowering environmental temperatures at that time, which hindered plants from photosynthesis. However, this should be analyzed in conjunction with temperature variations. Compared to the other two vegetation indices, the impact of precipitation on GPP was smaller than its effect on NDVI and LAI.
Using NDVI, LAI, and GPP as reference indices, the vegetation in the study area exhibited significant spatial heterogeneity, with the greening trend in northern Xinjiang being stronger than in southern Xinjiang. This spatial pattern may be attributed to differences in precipitation availability, as northern Xinjiang received more water resources, particularly in mountainous areas like the Tianshan and Altai ranges, which enhanced vegetation productivity. In contrast, southern Xinjiang was characterized by arid deserts and lower precipitation, resulting in less vegetation improvement, highlighting the importance of water availability in controlling vegetation growth. Our study hypothesized that increased precipitation due to climate change enhanced water supply, favoring plant growth. However, in southern Xinjiang, variations in vegetation responded less to precipitation, suggesting that even with additional precipitation, water availability remained a limiting factor due to high evapotranspiration rates and the arid climate.

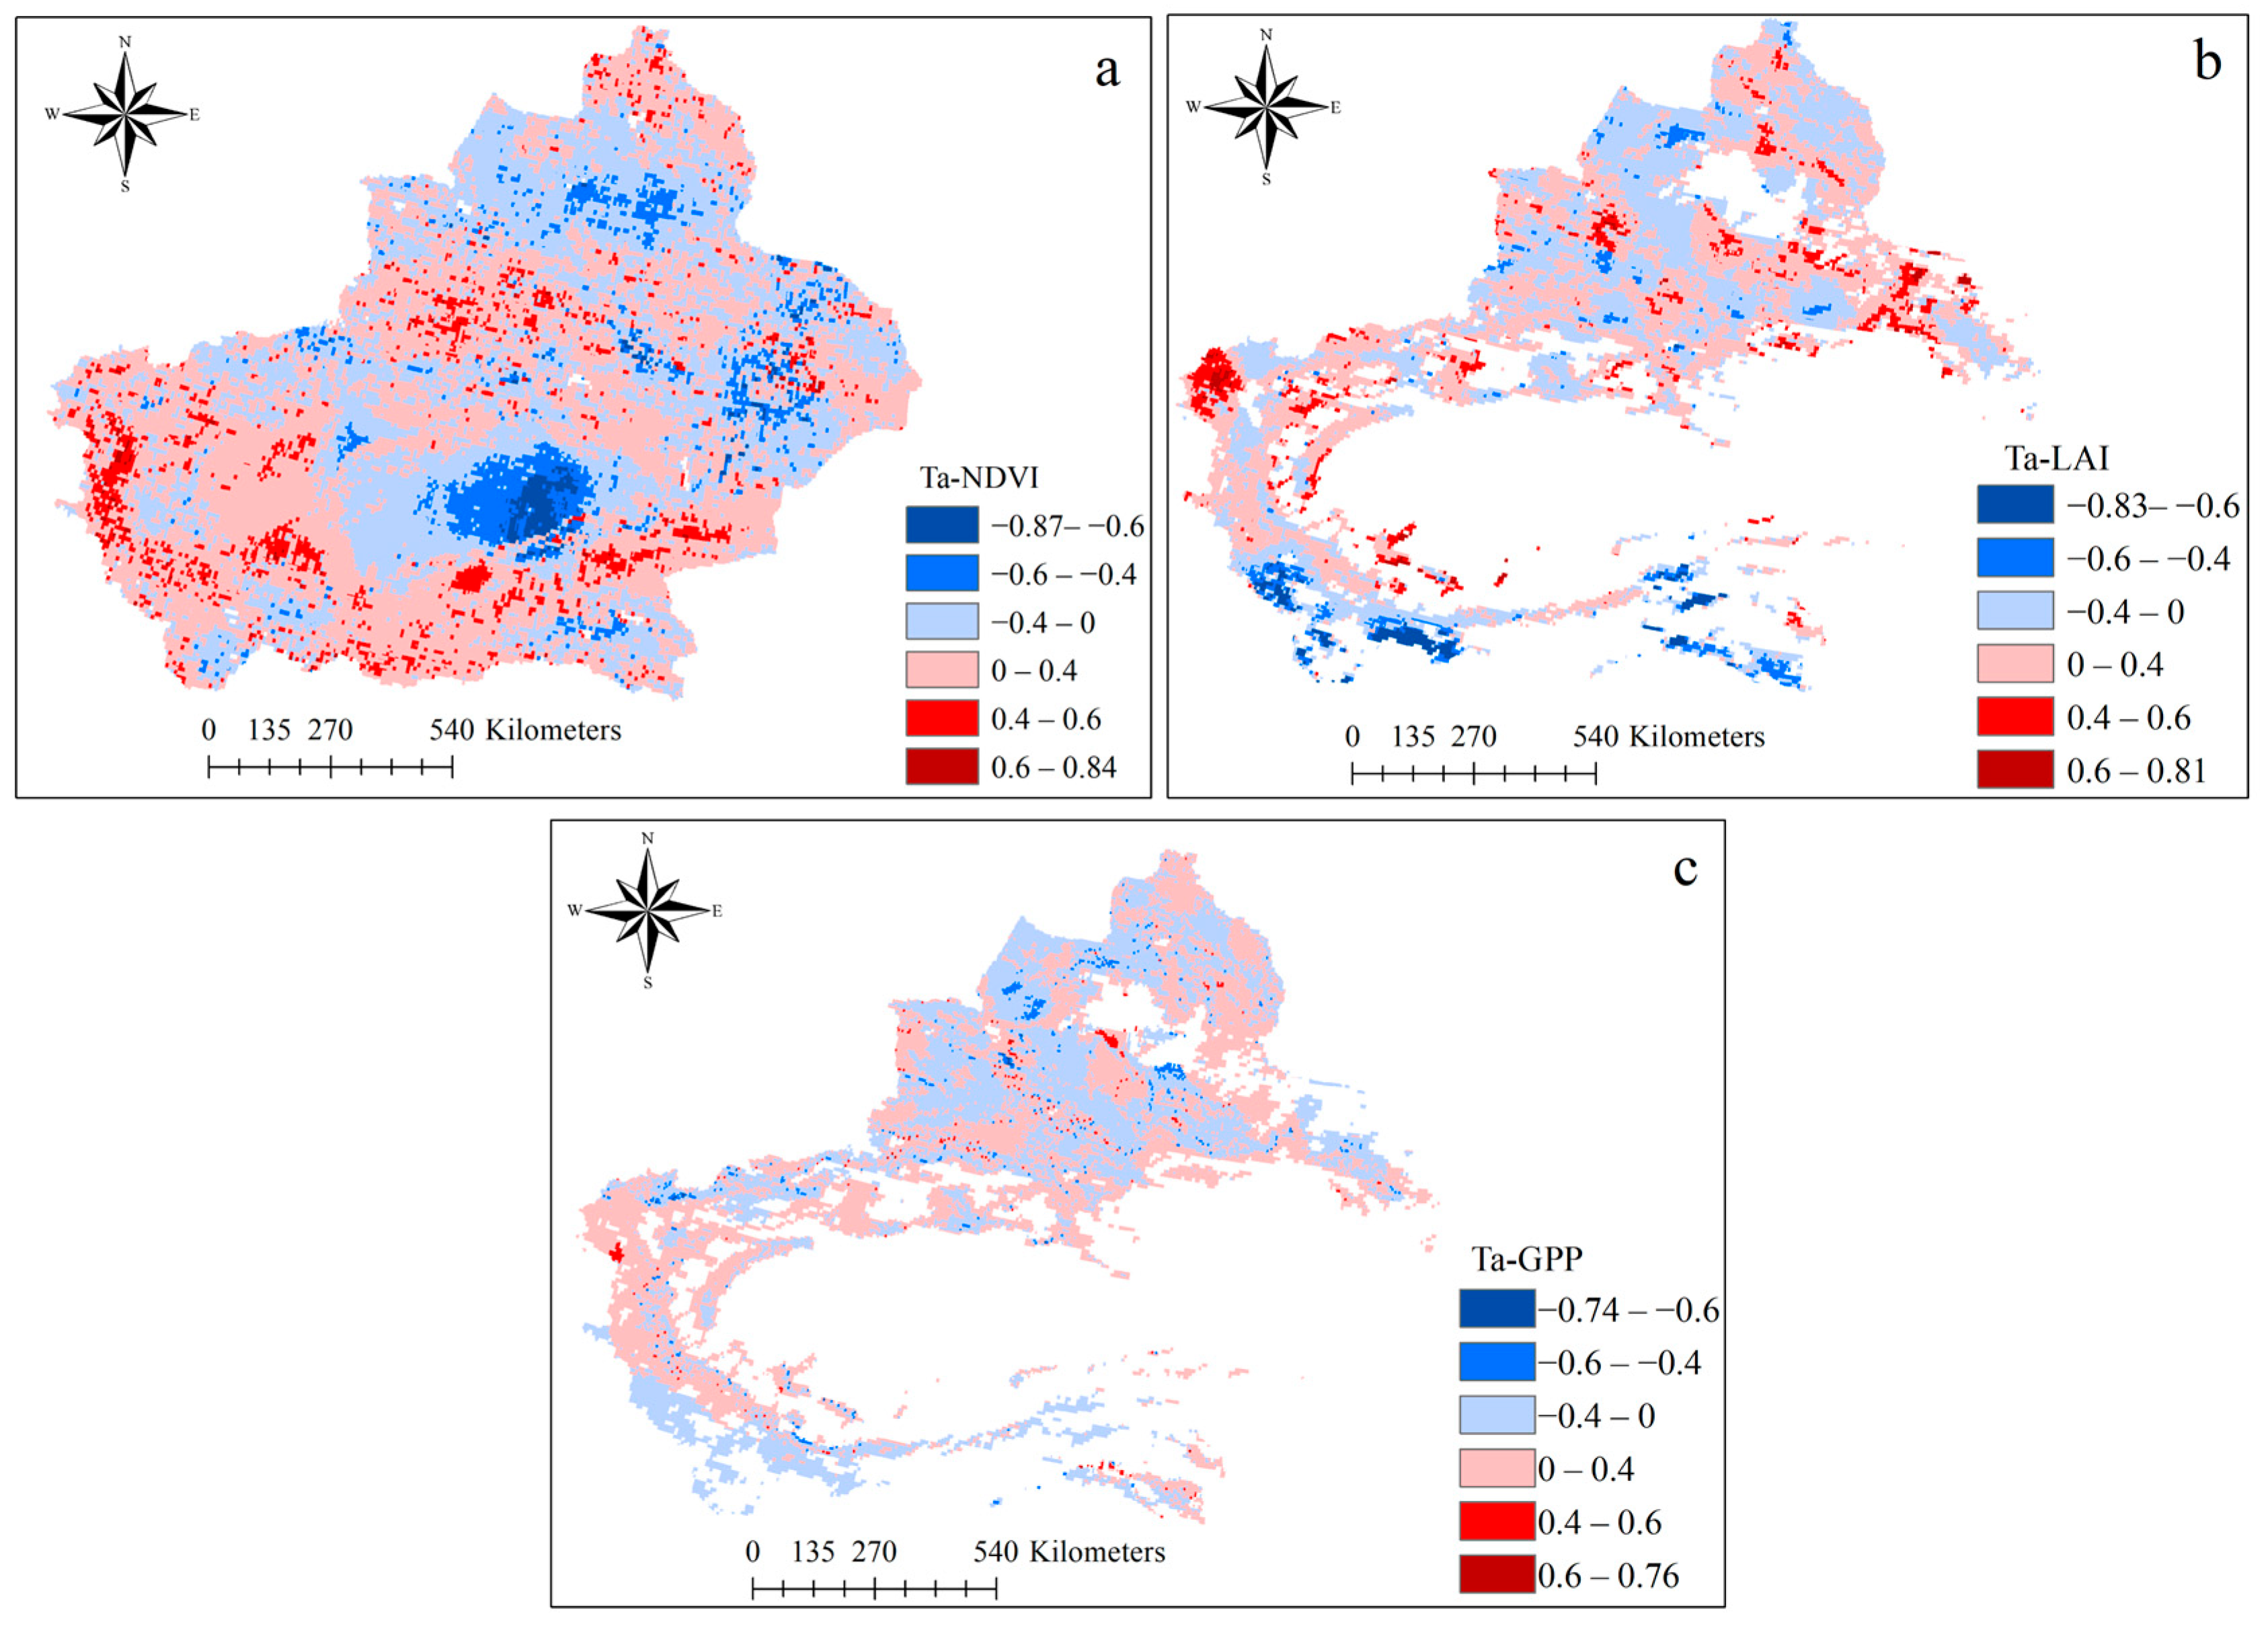
3.3.3. The Correlation Between Vegetation and Temperature

The proportion of positive and negative correlations between temperature and the three indices showed little variation. The positive correlation proportions for NDVI, LAI, and GPP were 55.5%, 54.6%, and 51.2%, respectively. However, the spatial distribution of correlations for each index exhibited remarkable heterogeneity (Figure 10). Regions with negative correlations between NDVI and temperature were mainly located in basin areas, including the Junggar Basin and its surroundings (the Turpan Basin, the Hami Basin, and the Tarim Basin). The dominant vegetation type in these regions was desert vegetation. In the eastern Tarim Basin and parts of the central areas of other basins, the correlation coefficient was less than −0.4. As temperatures increased, plants enhanced transpiration to minimize water loss. However, excessively high temperatures could easily cause plants to die due to water stress. Therefore, these regions exhibited moderate to strong negative correlations. In high-altitude areas, rising temperatures made conditions more suitable for vegetation growth, leading to positive correlations. Areas with correlation coefficients greater than 0.6 were all distributed in high-altitude mountainous regions. In contrast, the cultivated areas around basins, which had sufficient water and sunlight, presented weak positive correlations.
The correlation between temperature and LAI showed an interactive distribution of positive and negative correlations. Areas with positive correlations were mainly in regions with increasing temperature, while negative correlation areas were primarily located in high-altitude mountainous regions and regions with decreasing temperature. Regions with correlation coefficients greater than 0.4 accounted for 10.5%, mainly distributed in grasslands and parts of cropland. Regions with correlation coefficients less than −0.4 accounted for 7.4%, primarily distributed in the Kunlun Mountains.
The spatial distribution of the correlation between GPP and temperature was similar to that between LAI and temperature; however, it showed a weaker correlation on the whole. Areas with correlation coefficients between −0.4 and 0.4 accounted for 95.8%. Regions with rising temperatures were still the main areas with positive correlations. Compared to the correlation with precipitation, the spatial distribution of the correlation between temperature and GPP in the Kunlun Mountains was reversed. Different types of vegetation responded differently to changes in temperature and precipitation, particularly alpine vegetation, which was more sensitive to climate change. Therefore, in high-altitude areas, opposite correlations between GPP and climate indicators may occur. In the Ili River Valley, negative correlations dominated, as rising temperatures were unfavorable for vegetation growth. Positive correlation areas around the Tarim Basin and southern Junggar Basin were mainly regions where crops and economic plants were grown. These areas were more severely affected by human activities.
The response of vegetation to rising temperatures was more complex. In high-altitude regions like the Tianshan and Altai Mountains, higher temperatures prolonged the growing season, promoting vegetation growth. However, in desert regions like the Tarim Basin, higher temperatures may exacerbate water stress, leading to negative correlations between temperature and vegetation indices. These findings indicated that while rising temperatures may benefit vegetation activity, they could also pose challenges for arid regions where water resources were already limited.

4. Discussion

From 1991 to 2018, vegetation in Xinjiang exhibited significant dynamic changes characterized by large differences in distribution between the north and south Xinjiang and temporal variations. The study findings revealed that northern Xinjiang had experienced a noticeable greening trend, which aligned with the overall warming and humidification in arid regions, as previously reported by Zhang et al. [6]. The spatial distribution of high NDVI and LAI values concentrated in the Tianshan and Altai Mountain ranges indicated that these regions, with relatively higher precipitation and suitable temperatures, were conducive to vegetation growth and demonstrate greater resilience to climate variations. The findings emphasized how regional climate change, manifested in increasing temperature and precipitation, had positively influenced vegetation. Similar to other arid regions, the relationship between climate variables and vegetation characteristics displayed a consistent pattern [22], with climate explaining significant changes in vegetation in arid regions [6]. Contrastingly, southern Xinjiang, dominated by arid desert landscapes, showed lower values and limited improvements in vegetation growth over the study period. Vegetation growth here remains constrained by the region’s high evapotranspiration rates, which hinder the effectiveness of any increase in precipitation. Similar findings were reported by Zhao et al. [41], who noted that desert vegetation often exhibited a reduced response to climatic fluctuations due to inherent water limitations [47]. The results further illustrated the uneven spatial distribution of vegetation dynamics within Xinjiang, where mountainous regions benefit more from climate-induced greening [32,48], while desert and basin areas remain sensitive to drought and water scarcity. Additionally, the multiple indices (NDVI, LAI, and GPP) highlighted that different metrics capture unique aspects of vegetation health and productivity [49]. For instance, the NDVI and LAI trends displayed ongoing vegetation growth in northern Xinjiang, while GPP, though showing an increase, indicated more moderate gains, suggesting that factors beyond photosynthetic activity played critical roles in vegetation productivity [50], which corresponded with findings from Hao et al. [40]. The results documented similar spatial patterns of vegetation productivity linked to water accessibility in arid regions.
The drivers of vegetation change in Xinjiang are multi-faceted, with both climate variability and anthropogenic influences contributing to observed patterns. Previous studies identified precipitation as a limiting factor that directly enhanced vegetation growth in arid and semi-arid regions [6,38,51]. Increased precipitation benefited areas with existing vegetation cover, such as grassland and forest in the mountainous regions, where additional water inputs could alleviate drought stress and support growth. In southern Xinjiang, however, temperature has shown complex effects on vegetation, particularly in low-elevation desert areas. Rising temperature exacerbated water stress in these areas, leading to a negative correlation between temperature and vegetation, which aligned with another study [52]. In arid ecosystems, elevating temperatures increased evapotranspiration rates, surpassing any benefits of sporadic precipitation gains [53,54]. Thus, while warming trends may benefit vegetation in cooler, higher-elevation zones, they pose a challenge to vegetation survival and productivity in already arid desert environments.
Moreover, the drought index offers a useful framework for understanding these differential responses to climate drivers. Wang et al. [5] emphasized that regions with high drought indices often exhibited constrained vegetation responses due to limited soil moisture, further supporting the finding that aridity remains a key barrier to vegetation expansion in southern Xinjiang. Although precipitation had increased in recent years, a high drought index continued to restrict moisture accumulation, resulting in weaker vegetation responses to rainfall [55]. Additionally, the relationship between drought index and GPP varied across regions. In southern Xinjiang, prolonged water scarcity significantly suppresses GPP growth. In contrast, northern Xinjiang’s mountainous areas and surrounding basins, with lower drought indices and more stable water supplies, show higher GPP values. This highlighted the essential role of adequate water availability in supporting vegetation growth in arid regions [40].

5. Conclusions

This study investigated the spatiotemporal changes in vegetation in Xinjiang from 1991 to 2018 and the vegetation’s response to climate. Using multiple vegetation datasets (NDVI, LAI, and GPP), the spatial distribution and trends of vegetation during the study period were analyzed, and the variations in vegetation reflected by each index were compared. Additionally, land use data from 1991 to 2018 were used to analyze changes in vegetation types and areas in Xinjiang. Furthermore, temperature and precipitation data were combined to study the vegetation response to climate change.
From 1991 to 2018, NDVI, LAI, and GPP values in Xinjiang showed a distribution pattern of being higher in the north and lower in the south, with long-term averages of 0.28, 0.34, and 274.0 g C m−2 yr−1, respectively. The annual average distributions of NDVI, LAI, and GPP were mainly influenced by vegetation patterns during the growing season. The high annual average values for all indices were distributed similarly. In northern Xinjiang, high values were concentrated in the Tianshan Mountains, Altai Mountains, and the northwest of the Junggar Basin, while in southern Xinjiang, they were mainly distributed around the Tarim Basin. During the study period, the annual averages of NDVI, LAI, and GPP all showed increasing trends, with slopes of 0.52, 0.14 and 1.19; however, the spatial distributions of these trends differed slightly. Areas with consistent upward trends for all three indices were primarily located in the southern and northwestern parts of the Junggar Basin and around the Tarim Basin, while areas with consistent downward trends were mainly in central Tianshan. Overall, vegetation in Xinjiang had gradually improved. The net increase in vegetation area was 24,345.8 km2. Grassland has the largest area increase, accounting for 88.7% of the total area increase. The increase in grassland mainly resulted from the conversion of bare/desert.
During the study period, both precipitation and temperature in Xinjiang showed upward trends, but the correlations between these climate factors and the different vegetation indices varied significantly. The proportions of positive correlations between NDVI, LAI, GPP, and temperature were all around 50%, with a less than 5% difference in the positive correlation proportions among the three indices. In contrast, the proportions of positive correlations with precipitation varied greatly, with 50.3% for NDVI, 85.5% for LAI, and 74.3% for GPP in detail. Due to the distribution characteristics of vegetation data, the data in areas without vegetation caused this variation. Especially in desert areas, there was a negative correlation between NDVI and climate factors. Increased precipitation favored vegetation growth. The areas where each index had positive correlations with precipitation were largely consistent with the regions of high annual averages for these indices. In contrast, the effect of temperature on vegetation was less pronounced. Among the three indices, GPP indicated weak correlations with both precipitation and temperature, while NDVI and LAI generally showed positive correlations with climate factors, though these correlations were influenced by factors such as vegetation type and elevation. Although all three indices could represent vegetation conditions, they showed great differences when analyzing the impact of climate on vegetation, leading to varying results. Therefore, careful selection of vegetation data was essential when conducting attribution analysis for vegetation changes in a given region.

Supplementary Materials

The following supporting information can be downloaded at: https://www.mdpi.com/article/10.3390/f15122065/s1, Figure S1. Characteristics of land use change during the study period. (a) represents increased areas from 1991 to 2018, (b) represents decreased areas from 1991 to 2018.

Author Contributions

Y.L., methodology validation, data curation, writing—original draft preparation; Y.Z., formal analysis, investigation, resources, writing—review and editing; W.W. and X.A., visualization and supervision; R.C., project administration. All authors have read and agreed to the published version of the manuscript.

Funding

This research received no external funding.

Data Availability Statement

The data presented in this study are available in Section 2.2: Data sources and preprocessing.

Conflicts of Interest

The authors declare no conflicts of interest.

References

  1. Gong, G.; Liu, J.; Shao, Q.; Zhai, J. Sand-fixing Function under the Change of Vegetation Coverage in a Wind Erosion Area in Northern China. J. Resour. Ecol. 2014, 5, 105–114. [Google Scholar] [CrossRef]
  2. Hanusová, H.; Juřenová, K.; Hurajová, E.; Vaverková, M.; Winkler, J. Vegetation structure of bio-belts as agro-environmentally-climatic measures to support biodiversity on arable land: A case study. AIMS Agric. Food 2022, 7, 883–896. [Google Scholar] [CrossRef]
  3. Zhang, X.; Li, X.; Nian, L.; Samuel, A.; Liu, X.; Liu, X.; Hui, C.; Zhang, M. Topographic and Climatic Factors Effect Spatiotemporal Coupling Relationship of Soil Water Conservation Function with Vegetation in Source of the Yellow River. Sustainability 2024, 16, 6039. [Google Scholar] [CrossRef]
  4. Artini, G.; Francalanci, S.; Solari, L.; Aberle, J. Effects of leafy flexible vegetation on bed-load transport and dune geometry. Water Resour. Res. 2024, 60, e2023WR036588. [Google Scholar] [CrossRef]
  5. Wang, Y.; Fu, B.; Liu, Y.; Li, Y.; Feng, X.; Wang, S. Response of vegetation to drought in the Tibetan Plateau: Elevation differentiation and the dominant factors. Agric. For. Meteorol. 2021, 306, 108468. [Google Scholar] [CrossRef]
  6. Zhang, Q.; Yang, J.; Wang, W.; Ma, P.; Lu, G.; Liu, X.; Yu, H.; Fang, F. Climatic warming and humidification in the arid region of Northwest China: Multi-scale characteristics and impacts on ecological vegetation. J. Meteor. Res. 2021, 35, 113–127. [Google Scholar] [CrossRef]
  7. Jiang, H.; Xu, X.; Zhang, T.; Xia, H.; Huang, Y.; Qiao, S. The Relative Roles of Climate Variation and Human Activities in Vegetation Dynamics in Coastal China from 2000 to 2019. Remote Sens. 2022, 14, 2485. [Google Scholar] [CrossRef]
  8. Gao, X.; Zhuo, W.; Gonsamo, A. Humid, warm and treed ecosystems show longer time-lag of vegetation response to climate. Geophys. Res. Lett. 2024, 51, e2024GL111737. [Google Scholar] [CrossRef]
  9. Liu, Y.; Zhang, X.; Du, X.; Du, Z.; Sun, M. Alpine grassland greening on the Northern Tibetan Plateau driven by climate change and human activities considering extreme temperature and soil moisture. Sci. Total Environ. 2024, 916, 169995. [Google Scholar] [CrossRef]
  10. Ma, Q.; Hänninen, H.; Berninger, F.; Li, X.; Huang, J. Climate warming leads to advanced fruit development period of temperate woody species but divergent changes in its length. Glob. Change Biol. 2022, 28, 6021–6032. [Google Scholar] [CrossRef]
  11. Ma, Z.; Peng, C.; Zhu, Q.; Chen, H.; Yu, G.; Li, W.; Zhou, X.; Wang, W.; Zhang, W. Regional drought-induced reduction in the biomass carbon sink of Canada’s boreal forests. Proc. Natl. Acad. Sci. USA 2012, 109, 2423–2427. [Google Scholar] [CrossRef]
  12. Ge, W.; Deng, L.; Wang, F.; Han, J. Quantifying the contributions of human activities and climate change to vegetation net primary productivity dynamics in China from 2001 to 2016. Sci. Total Environ. 2021, 773, 145648. [Google Scholar] [CrossRef] [PubMed]
  13. Gao, B.; Liu, E.; Yang, Y.; Yang, M.; Yao, Y.; Guan, L.; Feng, Y. Quantitative contributions of climate change and human activities to vegetation dynamics in the Zoige Plateau from 2001 to 2020. J. Mt. Sci. 2024, 21, 3031–3046. [Google Scholar] [CrossRef]
  14. Wang, B.; Chen, W.; Tian, D.; Li, Z.; Wang, J.; Fu, Z.; Luo, Y.; Piao, S.; Yu, G.; Niu, S. Dryness limits vegetation pace to cope with temperature change in warm regions. Glob. Chang. Biol. 2023, 29, 4750–4757. [Google Scholar] [CrossRef] [PubMed]
  15. Yang, Y.; Wang, X.; Wang, T. Permafrost degradation induces the abrupt changes of vegetation NDVI in the Northern Hemisphere. Earth’s Future 2024, 12, e2023EF004309. [Google Scholar] [CrossRef]
  16. Zafarmomen, N.; Alizadeh, H.; Bayat, M.; Ehtiat, M.; Moradkhani, H. Assimilation of sentinel-based leaf area index for modeling surface-ground water interactions in irrigation districts. Water Resour. Res. 2024, 60, e2023WR036080. [Google Scholar] [CrossRef]
  17. Fu, B.; Yang, W.; Yao, H.; He, H.; Lan, G.; Gao, E.; Qin, J.; Fan, D.; Chen, Z. Evaluation of spatio-temporal variations of FVC and its relationship with climate change using GEE and Landsat images in Ganjiang River Basin. Geocarto Int. 2022, 37, 13658–13688. [Google Scholar] [CrossRef]
  18. Gu, Y.; Pang, B.; Qiao, X.; Xu, D.; Li, W.; Yan, Y.; Dou, H.; Ao, W.; Wang, W.; Zou, C.; et al. Vegetation dynamics in response to climate change and human activities in the Hulun Lake basin from 1981 to 2019. Ecol. Indic. 2022, 136, 108700. [Google Scholar] [CrossRef]
  19. Guo, R.; Cai, A.; Chen, X. The quantitative effects of climate change and human activity on the vegetation growth in the Yangtze River Basin. Front. Earth Sci. 2023, 11, 1168384. [Google Scholar] [CrossRef]
  20. da Silva, J.L.P.; da Silva Junior, F.B.; de Souza Santos, J.P.A.; dos Santos Almeida, A.C.; da Silva, T.G.F.; Oliveira-Júnior, J.F.d.; Araújo Júnior, G.d.N.; Scheibel, C.H.; da Silva, J.L.B.; de Lima, J.L.M.P.; et al. Semi-Arid to Arid Scenario Shift: Is the Cabrobó Desertification Nucleus Becoming Arid? Remote Sens. 2024, 16, 2834. [Google Scholar] [CrossRef]
  21. Piao, S.; Nan, H.; Huntingford, C.; Ciais, P.; Friedlingstein, P.; Sitch, S.; Peng, S.; Ahlström, A.; Canadell, J.; Cong, N.; et al. Evidence for a weakening relationship between interannual temperature variability and northern vegetation activity. Nat. commun. 2014, 5, 5018. [Google Scholar] [CrossRef] [PubMed]
  22. Shi, S.; Yu, J.; Wang, F.; Wang, P.; Zhang, Y.; Jin, K. Quantitative contributions of climate change and human activities to vegetation changes over multiple time scales on the Loess Plateau. Sci. Total Environ. 2021, 755, 142419. [Google Scholar] [CrossRef] [PubMed]
  23. Zhang, H.; Hu, Z.; Zhang, Z.; Li, Y.; Song, S.; Chen, X. How does vegetation change under the warm–wet tendency across Xinjiang, China? Int. J. Appl. Earth Obs. 2024, 127, 1569–8432. [Google Scholar] [CrossRef]
  24. Mekonnen, Z.; Grant, R.; Schwalm, C. Contrasting changes in gross primary productivity of different regions of North America as affected by warming in recent decades. Agric. Forest Meteorol. 2016, 218–219, 50–64. [Google Scholar] [CrossRef]
  25. Yan, J.; Zhang, G.; Deng, X.; Ling, H.; Xu, H.; Guo, B. Does Climate Change or Human Activity Lead to the Degradation in the Grassland Ecosystem in a Mountain-Basin System in an Arid Region of China? Sustainability 2019, 11, 2618. [Google Scholar] [CrossRef]
  26. Liu, H.; Wei, W.; Zhu, G.; Ding, Y.; Peng, X. The different vegetation types responses to potential evapotranspiration and precipitation in China. Front. Environ. Sci. 2024, 12, 1406621. [Google Scholar] [CrossRef]
  27. Lu, Q.; Kang, H.; Zhang, F.; Xia, Y.; Yan, B. Impact of climate and human activity on NDVI of different vegetation types in the Three-River Source Region, China. J. Arid Land 2024, 16, 1080–1097. [Google Scholar] [CrossRef]
  28. Zhang, X.; Xu, X.; Li, X.; Cui, P.; Zheng, D. A new scheme of climate-vegetation regionalization in the Hengduan Mountains Region. Sci. China-Earth Sci. 2024, 67, 751–768. [Google Scholar] [CrossRef]
  29. Shi, Y.; Shen, Y.; Li, D.; Zhang, G.; Ding, Y.; Hu, R.; Kang, E. Discussion on the present climate change from warm-dry to warm-wet in northwest China. Quatern. Sci. 2003, 23, 152–164. (In Chinese) [Google Scholar]
  30. Zhang, Q.; Yang, J.; Duan, X.; Ma, P.; Lu, G.; Zhu, B.; Liu, X.; Yue, P.; Wang, Y.; Liu, W. The eastward expansion of the climate humidification trend in northwest China and the synergistic influences on the circulation mechanism. Clim. Dyn. 2022, 59, 2481–2497. [Google Scholar] [CrossRef]
  31. Yao, J.; Mao, W.; Chen, J.; Dilinuer, T. Signal and impact of wet-to-dry shift over Xinjiang, China. Acta. Geogr. Sin. 2021, 76, 57–72. [Google Scholar] [CrossRef]
  32. Jiapaer, G.; Liang, S.; Yi, Q.; Liu, J. Vegetation dynamics and responses to recent climate change in Xinjiang using leaf area index as an indicator. Ecol. Indic. 2015, 58, 64–76. [Google Scholar] [CrossRef]
  33. Peng, D.; Huang, J.; Cai, C.; Deng, R.; Xu, J. Assessing the Response of Seasonal Variation of Net Primary Productivity to Climate Using Remote Sensing Data and Geographic Information System Techniques in Xinjiang. J. Integr. Plant Biol. 2008, 50, 1580–1588. [Google Scholar] [CrossRef] [PubMed]
  34. Fang, S.; Yan, J.; Che, M.; Zhu, Y.; Liu, Z.; Pei, H.; Zhang, H.; Xu, G.; Lin, X. Climate change and the ecological responses in Xinjiang, China: Model simulations and data analyses. Quat. Int. 2013, 311, 108–116. [Google Scholar] [CrossRef]
  35. Yu, H.; Bian, Z.; Mu, S.; Yuan, J.; Chen, F. Effects of Climate Change on Land Cover Change and Vegetation Dynamics in Xinjiang, China. Int. J. Environ. Res. Public Health 2020, 17, 4865. [Google Scholar] [CrossRef] [PubMed]
  36. Zhou, Y.; Li, Y.; Li, W.; Li, F.; Xin, Q. Ecological Responses to Climate Change and Human Activities in the Arid and Semi-Arid Regions of Xinjiang in China. Remote Sens. 2022, 14, 3911. [Google Scholar] [CrossRef]
  37. Li, G.; Liang, J.; Wang, S.; Zhou, M.; Sun, Y.; Wang, J.; Fan, J. Characteristics and Drivers of Vegetation Change in Xinjiang, 2000–2020. Forests 2024, 15, 231. [Google Scholar] [CrossRef]
  38. Duan, H.; Zhao, H.; Jiang, Y.; Li, Y. Analysis of Seasonal Grassland Change and Its Drivers During 1982−2006 in Xinjiang. Rangel. Ecol. Manag. 2017, 70, 422–429. [Google Scholar] [CrossRef]
  39. Zhang, F.; Wang, C.; Wang, Z.-H. Response of Natural Vegetation to Climate in Dryland Ecosystems: A Comparative Study between Xinjiang and Arizona. Remote Sens. 2020, 12, 3567. [Google Scholar] [CrossRef]
  40. Hao, H.; Yao, J.; Xhen, Y.; Xu, J.; Li, Z.; Duan, W.; Ismail, S.; Wang, G. Ecological transitions in Xinjiang, China: Unraveling the impact of climate change on vegetation dynamics (1990–2020). J. Geogr. Sci. 2024, 36, 1039–1064. [Google Scholar] [CrossRef]
  41. Zhao, X.; Tan, K.; Zhao, S.; Fang, J. Changing climate affects vegetation growth in the arid region of the northwestern China. J. Arid. Environ. 2011, 75, 946–952. [Google Scholar] [CrossRef]
  42. Fang, S.; Mao, K.; Xia, X.; Wang, P.; Shi, J.; Bateni, S.; Xu, T.; Cao, M.; Heggy, E. A Daily near-surface Air Temperature Dataset for China from 1979–2018. Earth Syst. Sci. Data 2022, 14, 1413–1432. [Google Scholar] [CrossRef]
  43. Peng, S.; Ding, Y.; Liu, W.; Li, Z. 1 km monthly temperature and precipitation dataset for China from 1901 to 2017. Earth Syst. Sci. Data 2019, 11, 1931–1946. [Google Scholar] [CrossRef]
  44. Wang, S.; Zhang, Y.; Ju, W.; Qiu, B.; Zhang, Z. Tracking the seasonal and inter-annual variations of global gross primary production during last four decades using satellite near-infrared reflectance data. Sci. Total Environ. 2021, 755, 142569. [Google Scholar] [CrossRef]
  45. Liu, Y.; Liu, R.; Chen, M. Retrospective retrieval of long-term consistent global leaf area index (1981–2011) from combined AVHRR and MODIS data. J. Geophys. Res. 2012, 117, G04003. [Google Scholar] [CrossRef]
  46. Pinzon, J.; Pak, E.; Tucker, C.; Bhatt, U.; Frost, G.; Macander, M. Global Vegetation Greenness (NDVI) from AVHRR GIMMS-3G+, 1981–2022; ORNL DAAC: Oak Ridge, TN, USA, 2023. [Google Scholar] [CrossRef]
  47. Ogle, K.; Reynolds, J. Plant responses to precipitation in desert ecosystems: Integrating functional types, pulses, thresholds, and delays. Oecologia 2004, 141, 282–294. [Google Scholar] [CrossRef]
  48. Yi, K.; Zhao, X.; Zheng, Z.; Zhao, D.; Zeng, Y. Trends of greening and browning in terrestrial vegetation in China from 2000 to 2020. Ecol. Indic. 2023, 154, 110587. [Google Scholar] [CrossRef]
  49. Vélez, S.; Martínez-Peña, R.; Castrillo, D. Beyond Vegetation: A Review Unveiling Additional Insights into Agriculture and Forestry through the Application of Vegetation Indices. J. Multidiscip. Sci. J. 2023, 6, 421–436. [Google Scholar] [CrossRef]
  50. Polis, G. Why Are Parts of the World Green? Multiple Factors Control Productivity and the Distribution of Biomass. OIKOS 1939, 89, 3–15. [Google Scholar] [CrossRef]
  51. Snyder, K.; Tartowski, S. Multi-scale temporal variation in water availability: Implications for vegetation dynamics in arid and semi-arid ecosystems. J. Arid. Environ. 2006, 65, 219–234. [Google Scholar] [CrossRef]
  52. Peguero-Pina, J.; Vilagrosa, A.; Alonso-Forn, D.; Ferrio, J.; Sancho-Knapik, D.; Gil-Pelegrín, E. Living in Drylands: Functional Adaptations of Trees and Shrubs to Cope with High Temperatures and Water Scarcity. Forests 2020, 11, 1028. [Google Scholar] [CrossRef]
  53. Dimitriadou, S.; Nikolakopoulos, K. Evapotranspiration Trends and Interactions in Light of the Anthropogenic Footprint and the Climate Crisis: A Review. Hydrology 2021, 8, 163. [Google Scholar] [CrossRef]
  54. Kefi, S.; Rietkerk, M.; Katul, G. Vegetation pattern shift as a result of rising atmospheric CO2 in arid ecosystems. Theor. Popul Biol. 2008, 74, 332–344. [Google Scholar] [CrossRef] [PubMed]
  55. Maman, S.; Orlovsky, L.; Blumberg, D.; Berliner, P.; Mamedov, B. A landcover change study of takyr surfaces in Turkmenistan. J. Arid. Environ. 2011, 75, 842–850. [Google Scholar] [CrossRef]
Figure 1. Flowchart of research for vegetation dynamics and its climate response.
Forests 15 02065 g001
Figure 2. Location and land use of the research area.
Forests 15 02065 g002
Figure 3. The spatial distribution characteristics for (a) non-growing season, (b) growing season, and (c) annual value and changing trends (d) of NDVI.
Forests 15 02065 g003
Figure 4. The spatial distribution characteristics for (a) non-growing season, (b) growing season, and (c) annual value and changing trends (d) of LAI.
Forests 15 02065 g004
Figure 5. The spatial distribution characteristics for (a) non-growing season, (b) growing season, and (c) annual value and changing trends (d) of GPP.
Forests 15 02065 g005
Figure 6. Result of land use transfer matrix. Cr is crop land, Gr is grassland, Fo is forest, Sh is shrub, Otfo is other forest, De is desert, and Wa is water.
Forests 15 02065 g006
Figure 7. Annual characteristics of spatial distribution (a) and trend (b) of air temperature from 1991 to 2018.
Forests 15 02065 g007
Figure 8. Annual characteristics of spatial distribution (a) and trend (b) of precipitation from 1991 to 2018.
Forests 15 02065 g008
Figure 9. The correlation between precipitation and different vegetation indicators (a) for NDVI, (b) for LAI, and (c) for GPP.
Forests 15 02065 g009
Figure 10. The correlation between air temperature and different vegetation indicators (a) for NDVI, (b) for LAI, and (c) for GPP.
Forests 15 02065 g010
Disclaimer/Publisher’s Note: The statements, opinions and data contained in all publications are solely those of the individual author(s) and contributor(s) and not of MDPI and/or the editor(s). MDPI and/or the editor(s) disclaim responsibility for any injury to people or property resulting from any ideas, methods, instructions or products referred to in the content.

