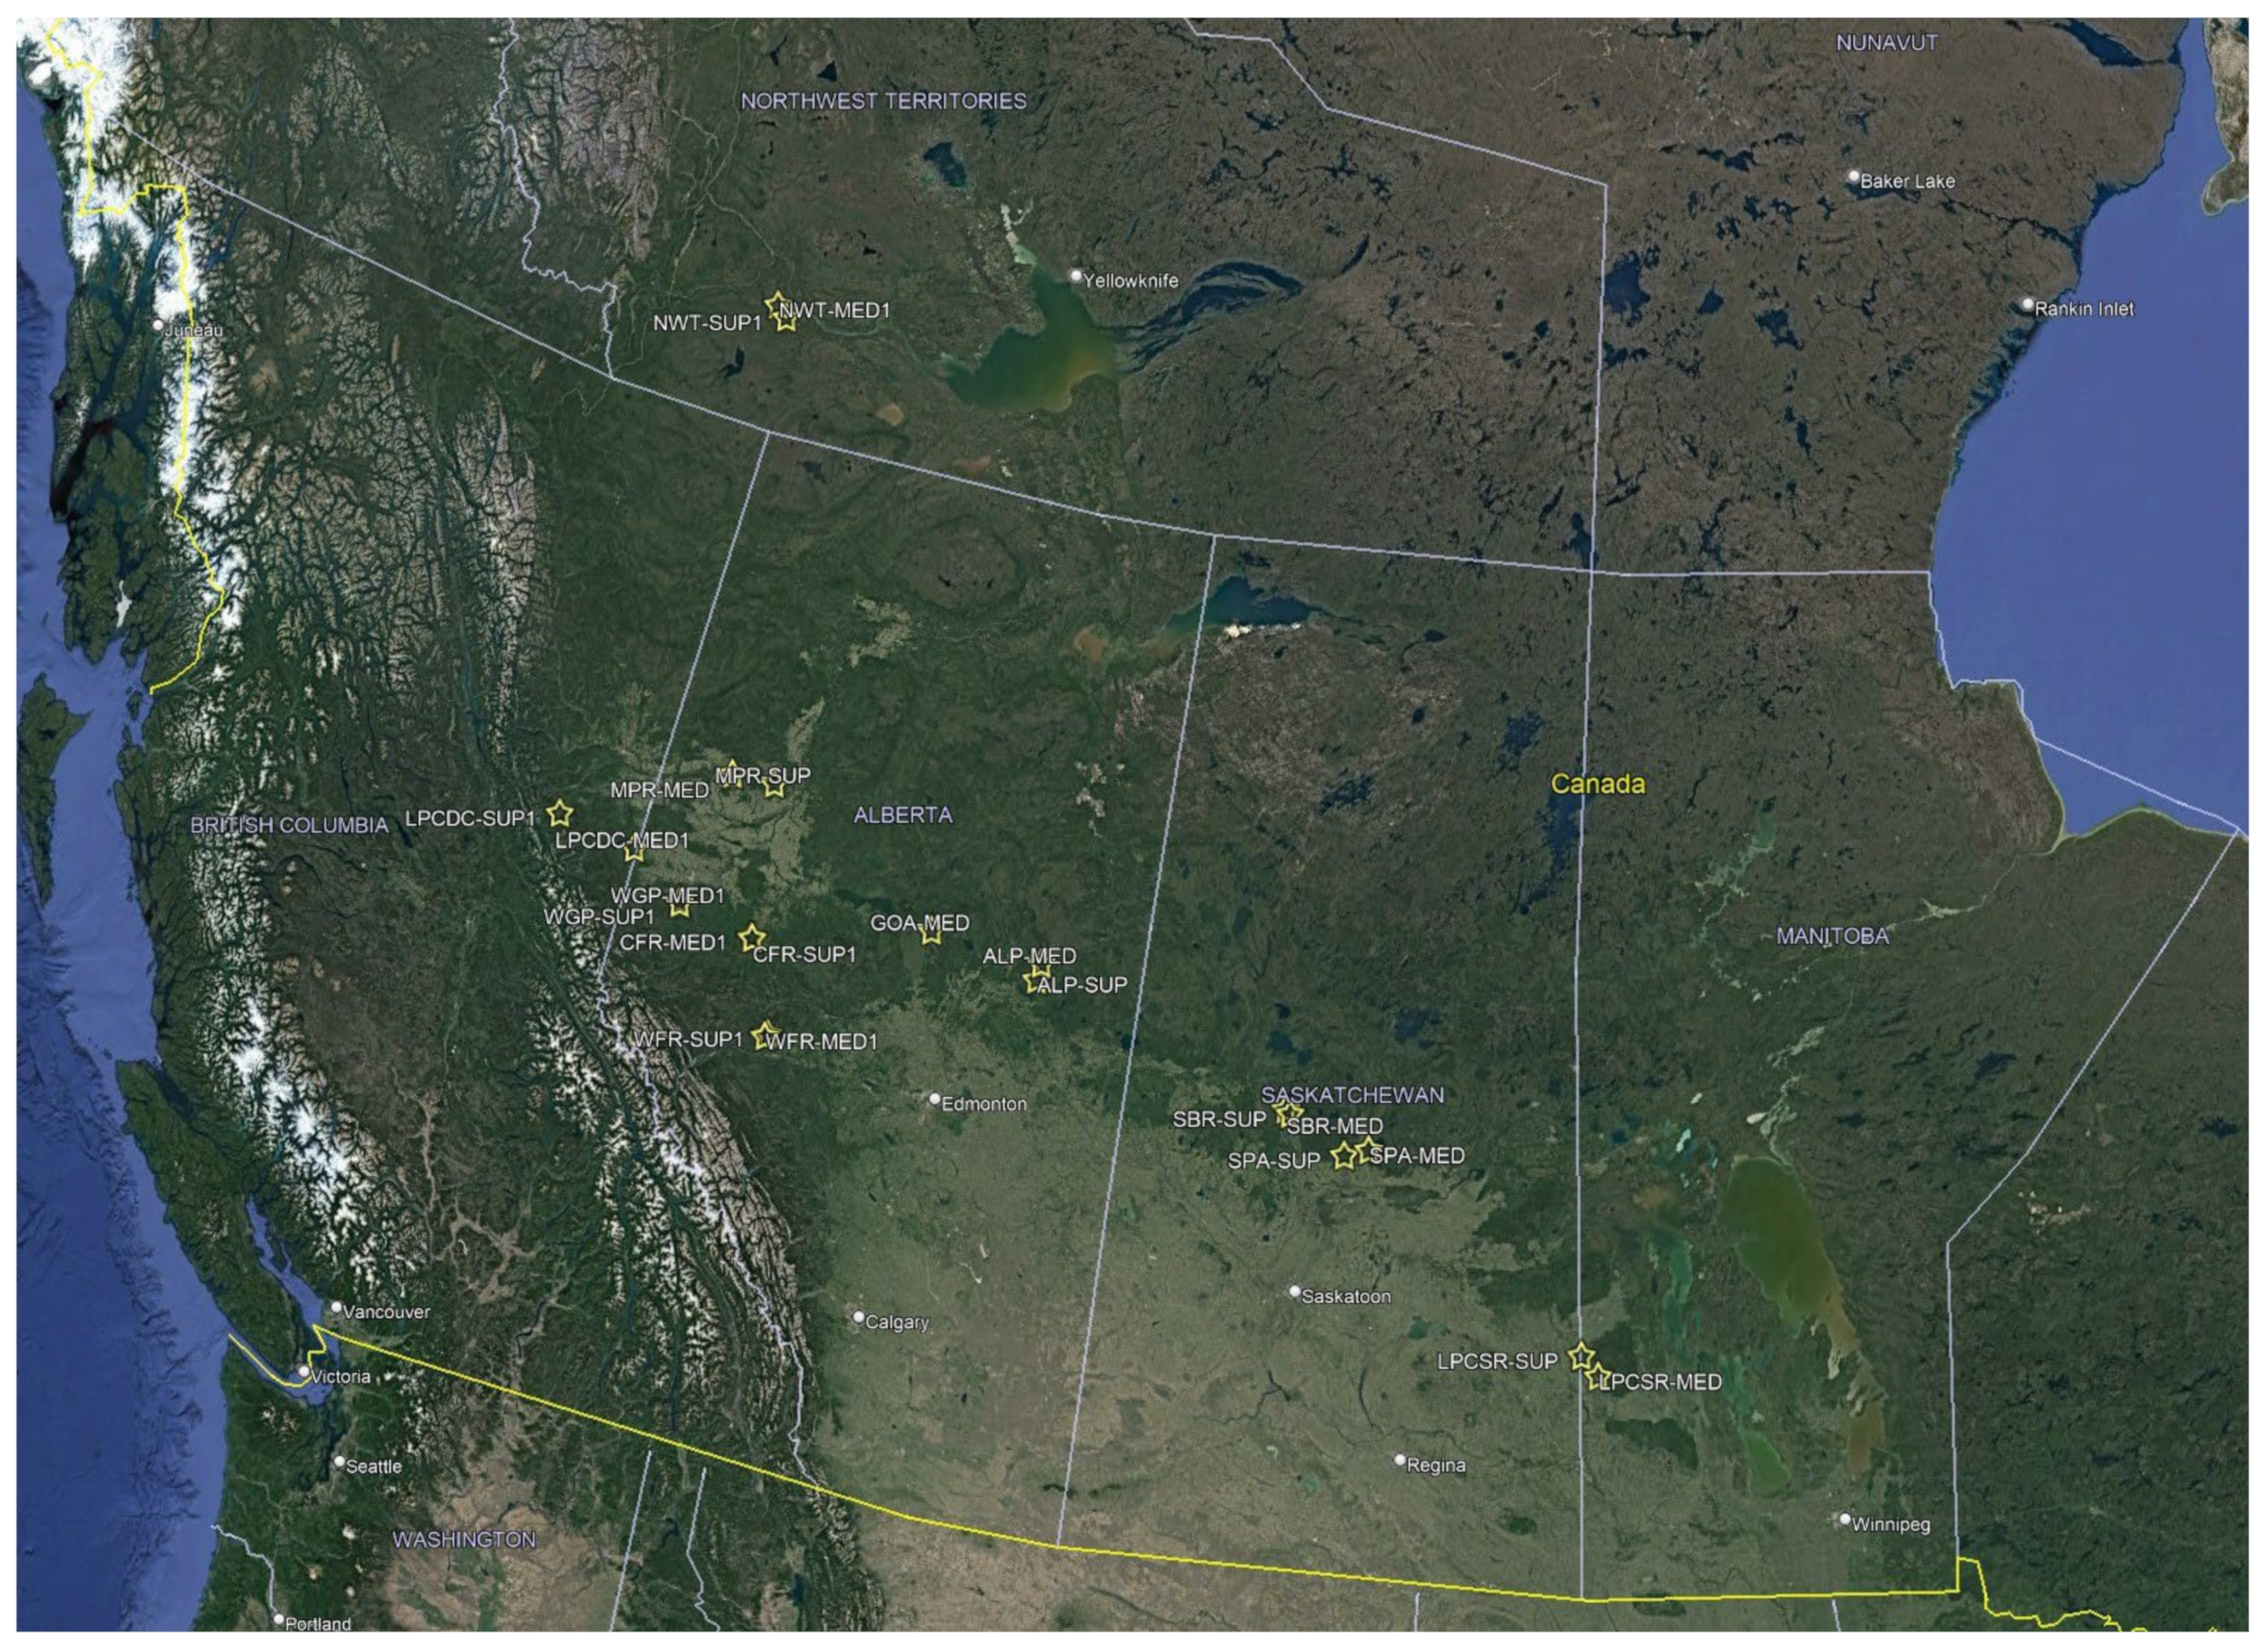
Figure 1.
Locations of the 21 WESBOGY Long-Term Study Installations (indicated by the stars) in Western Canada (generated using Google Earth).
Figure 1.
Locations of the 21 WESBOGY Long-Term Study Installations (indicated by the stars) in Western Canada (generated using Google Earth).
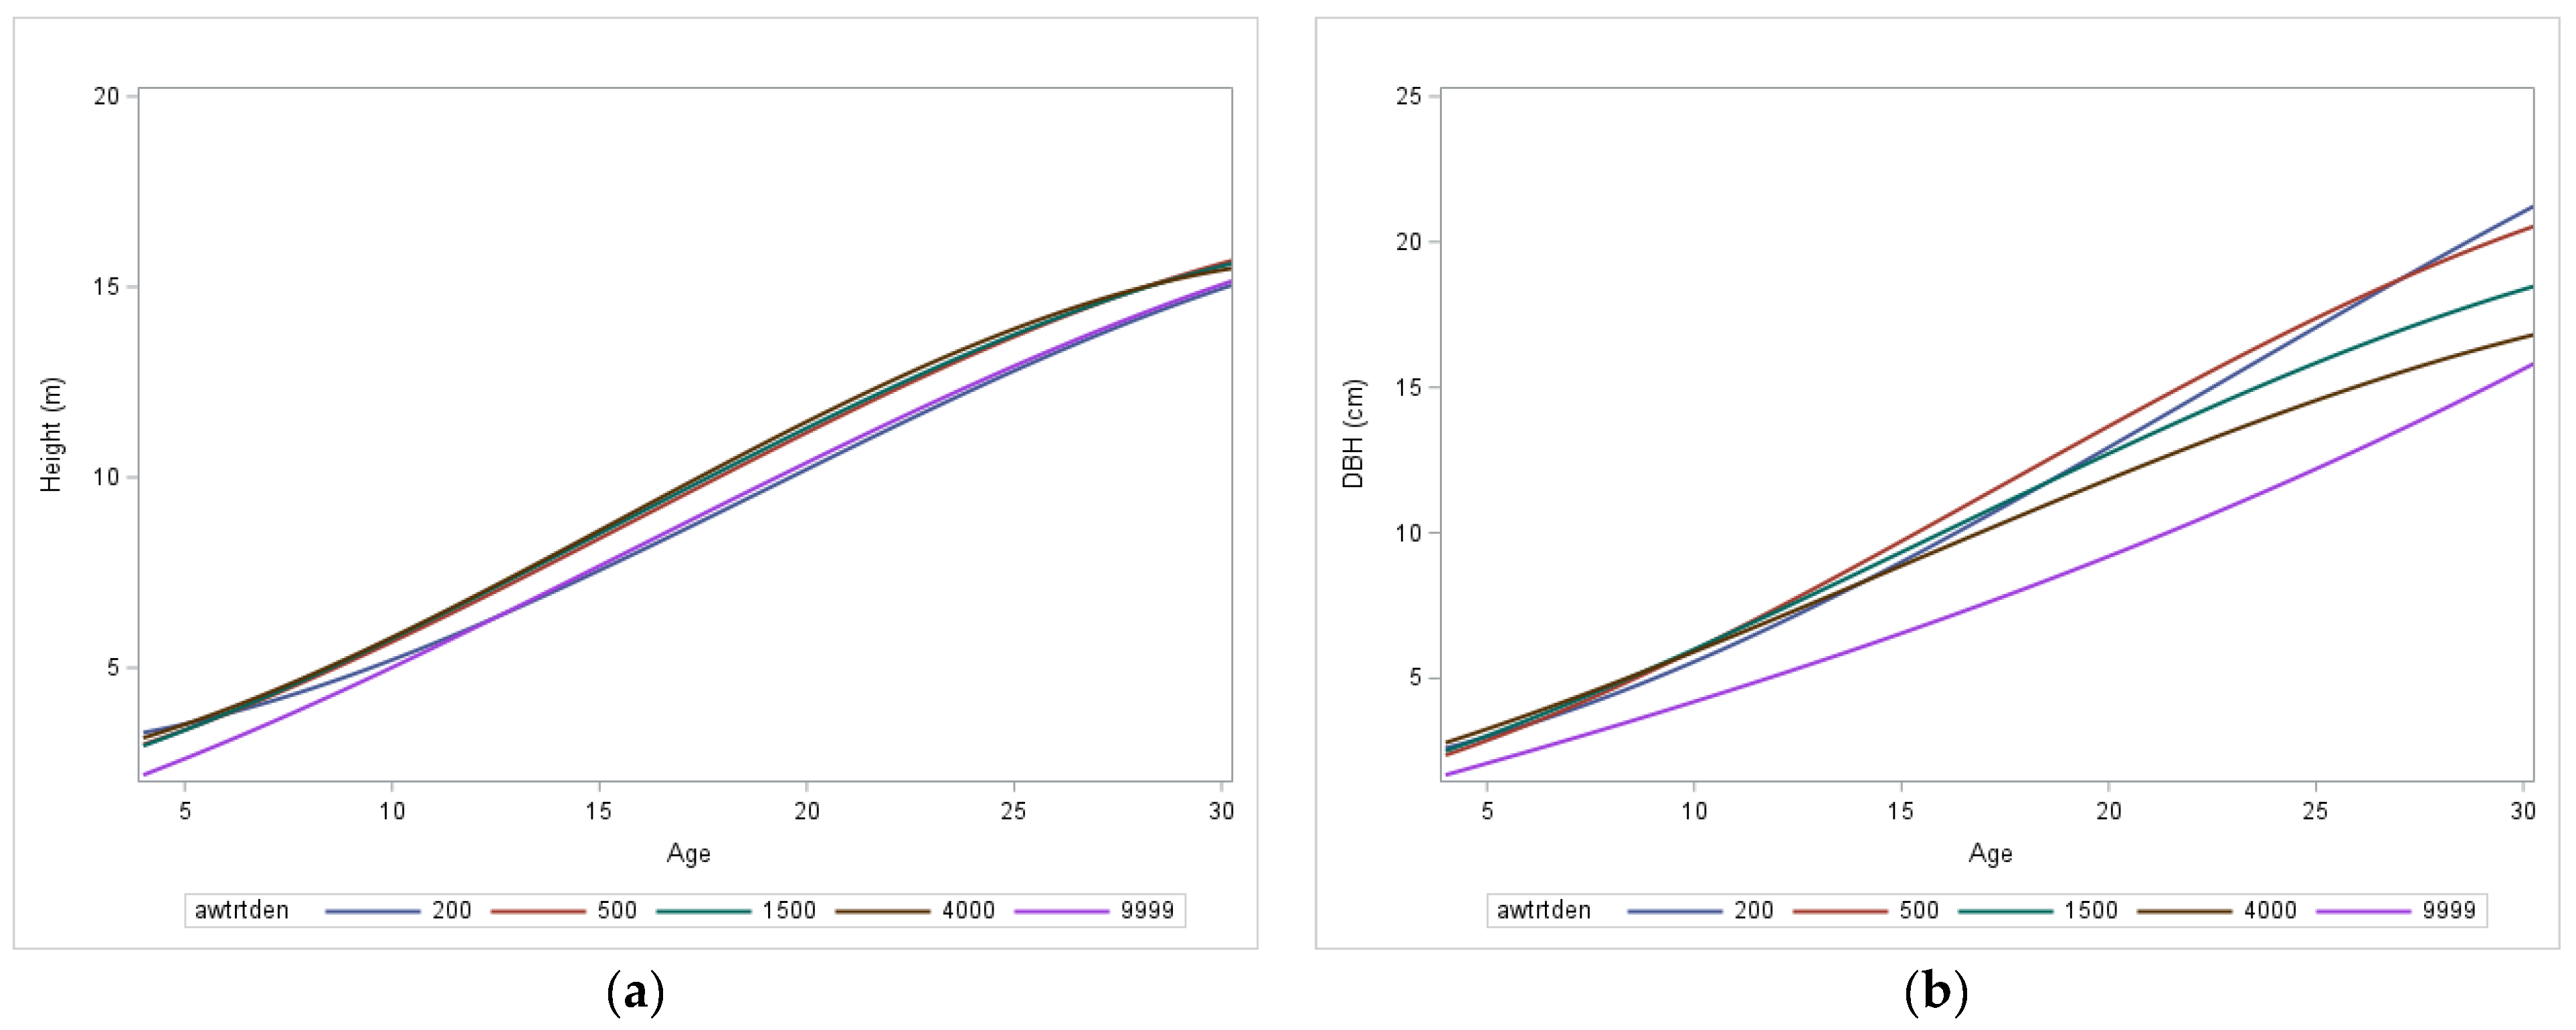
Figure 2.
Results from third-degree polynomial models summarizing trends for aspen (top 200 trees per ha): (a) height, and (b) DBH for the five aspen treatment densities (awtrtden). Aspen treatment density (awtrtden) of 9999 represents the unthinned.
Figure 2.
Results from third-degree polynomial models summarizing trends for aspen (top 200 trees per ha): (a) height, and (b) DBH for the five aspen treatment densities (awtrtden). Aspen treatment density (awtrtden) of 9999 represents the unthinned.
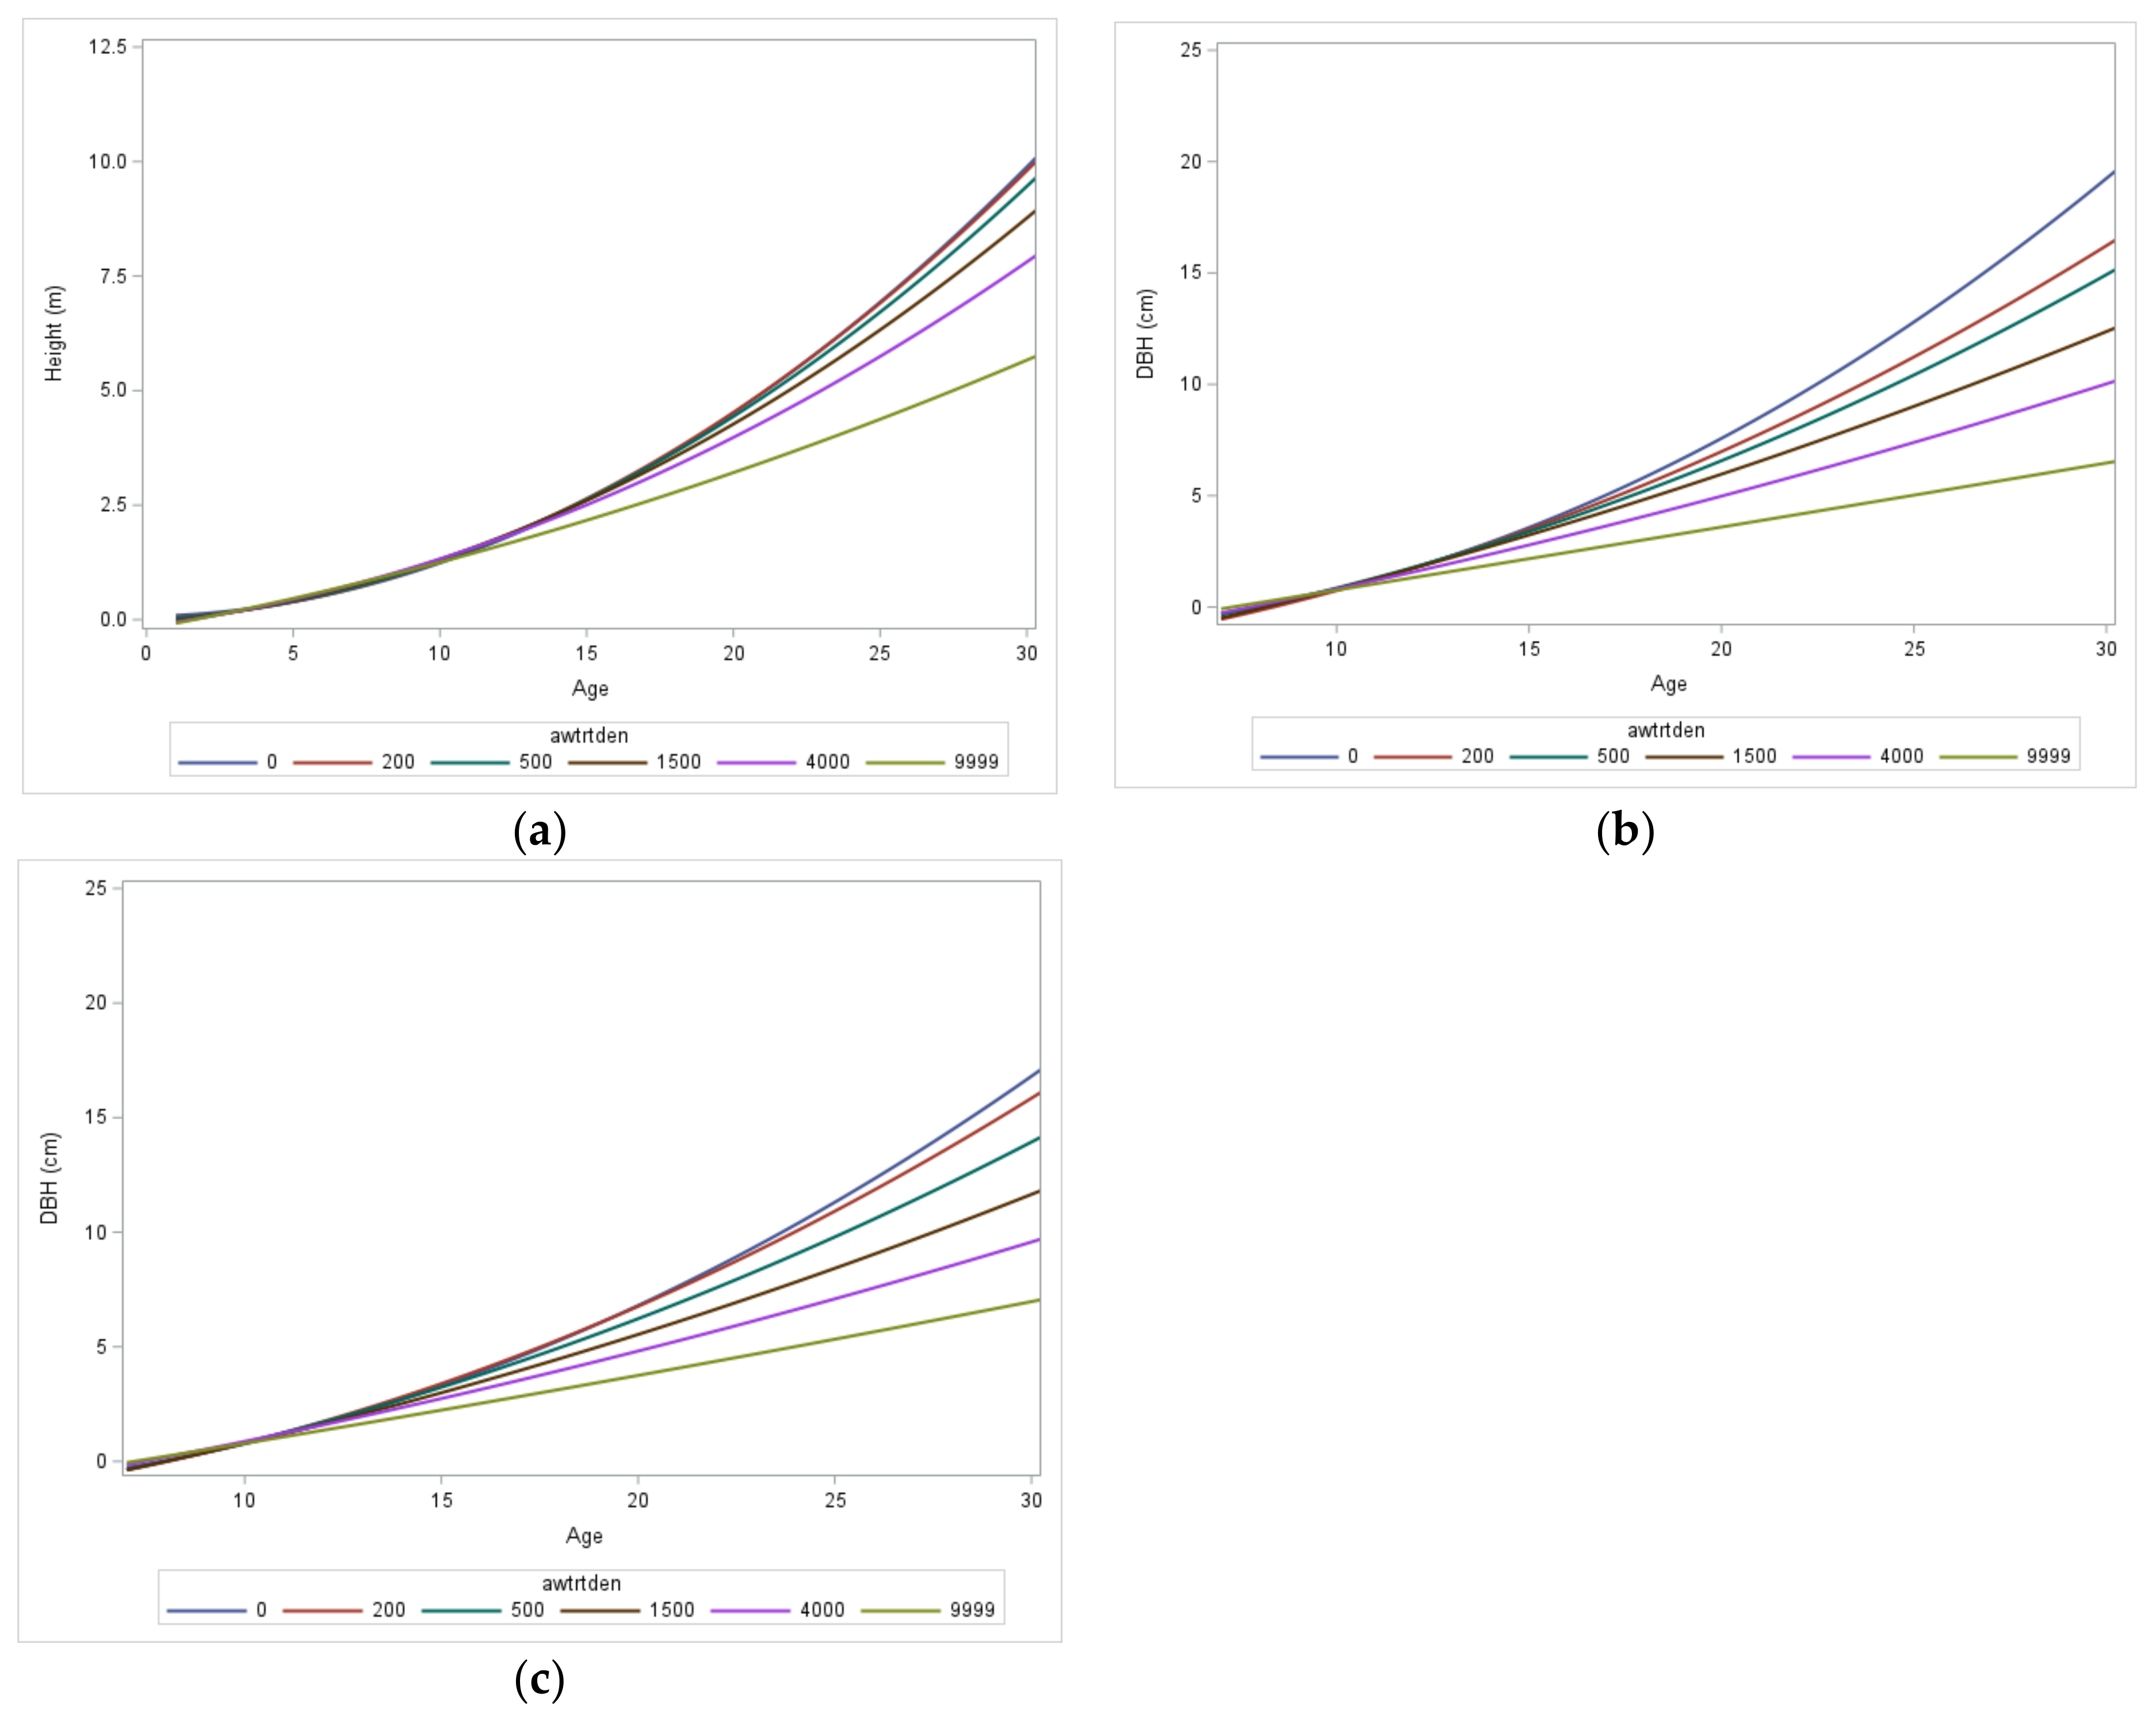
Figure 3.
Results from second-degree polynomial models for the five aspen treatment densities (awtrtden) summarizing trends for (a) spruce height, (b) DBH for spruce density of 500 stems·ha−1, and (c) DBH for spruce density of 1000 stems·ha−1. Aspen treatment density (awtrtden) of 9999 represents the unthinned.
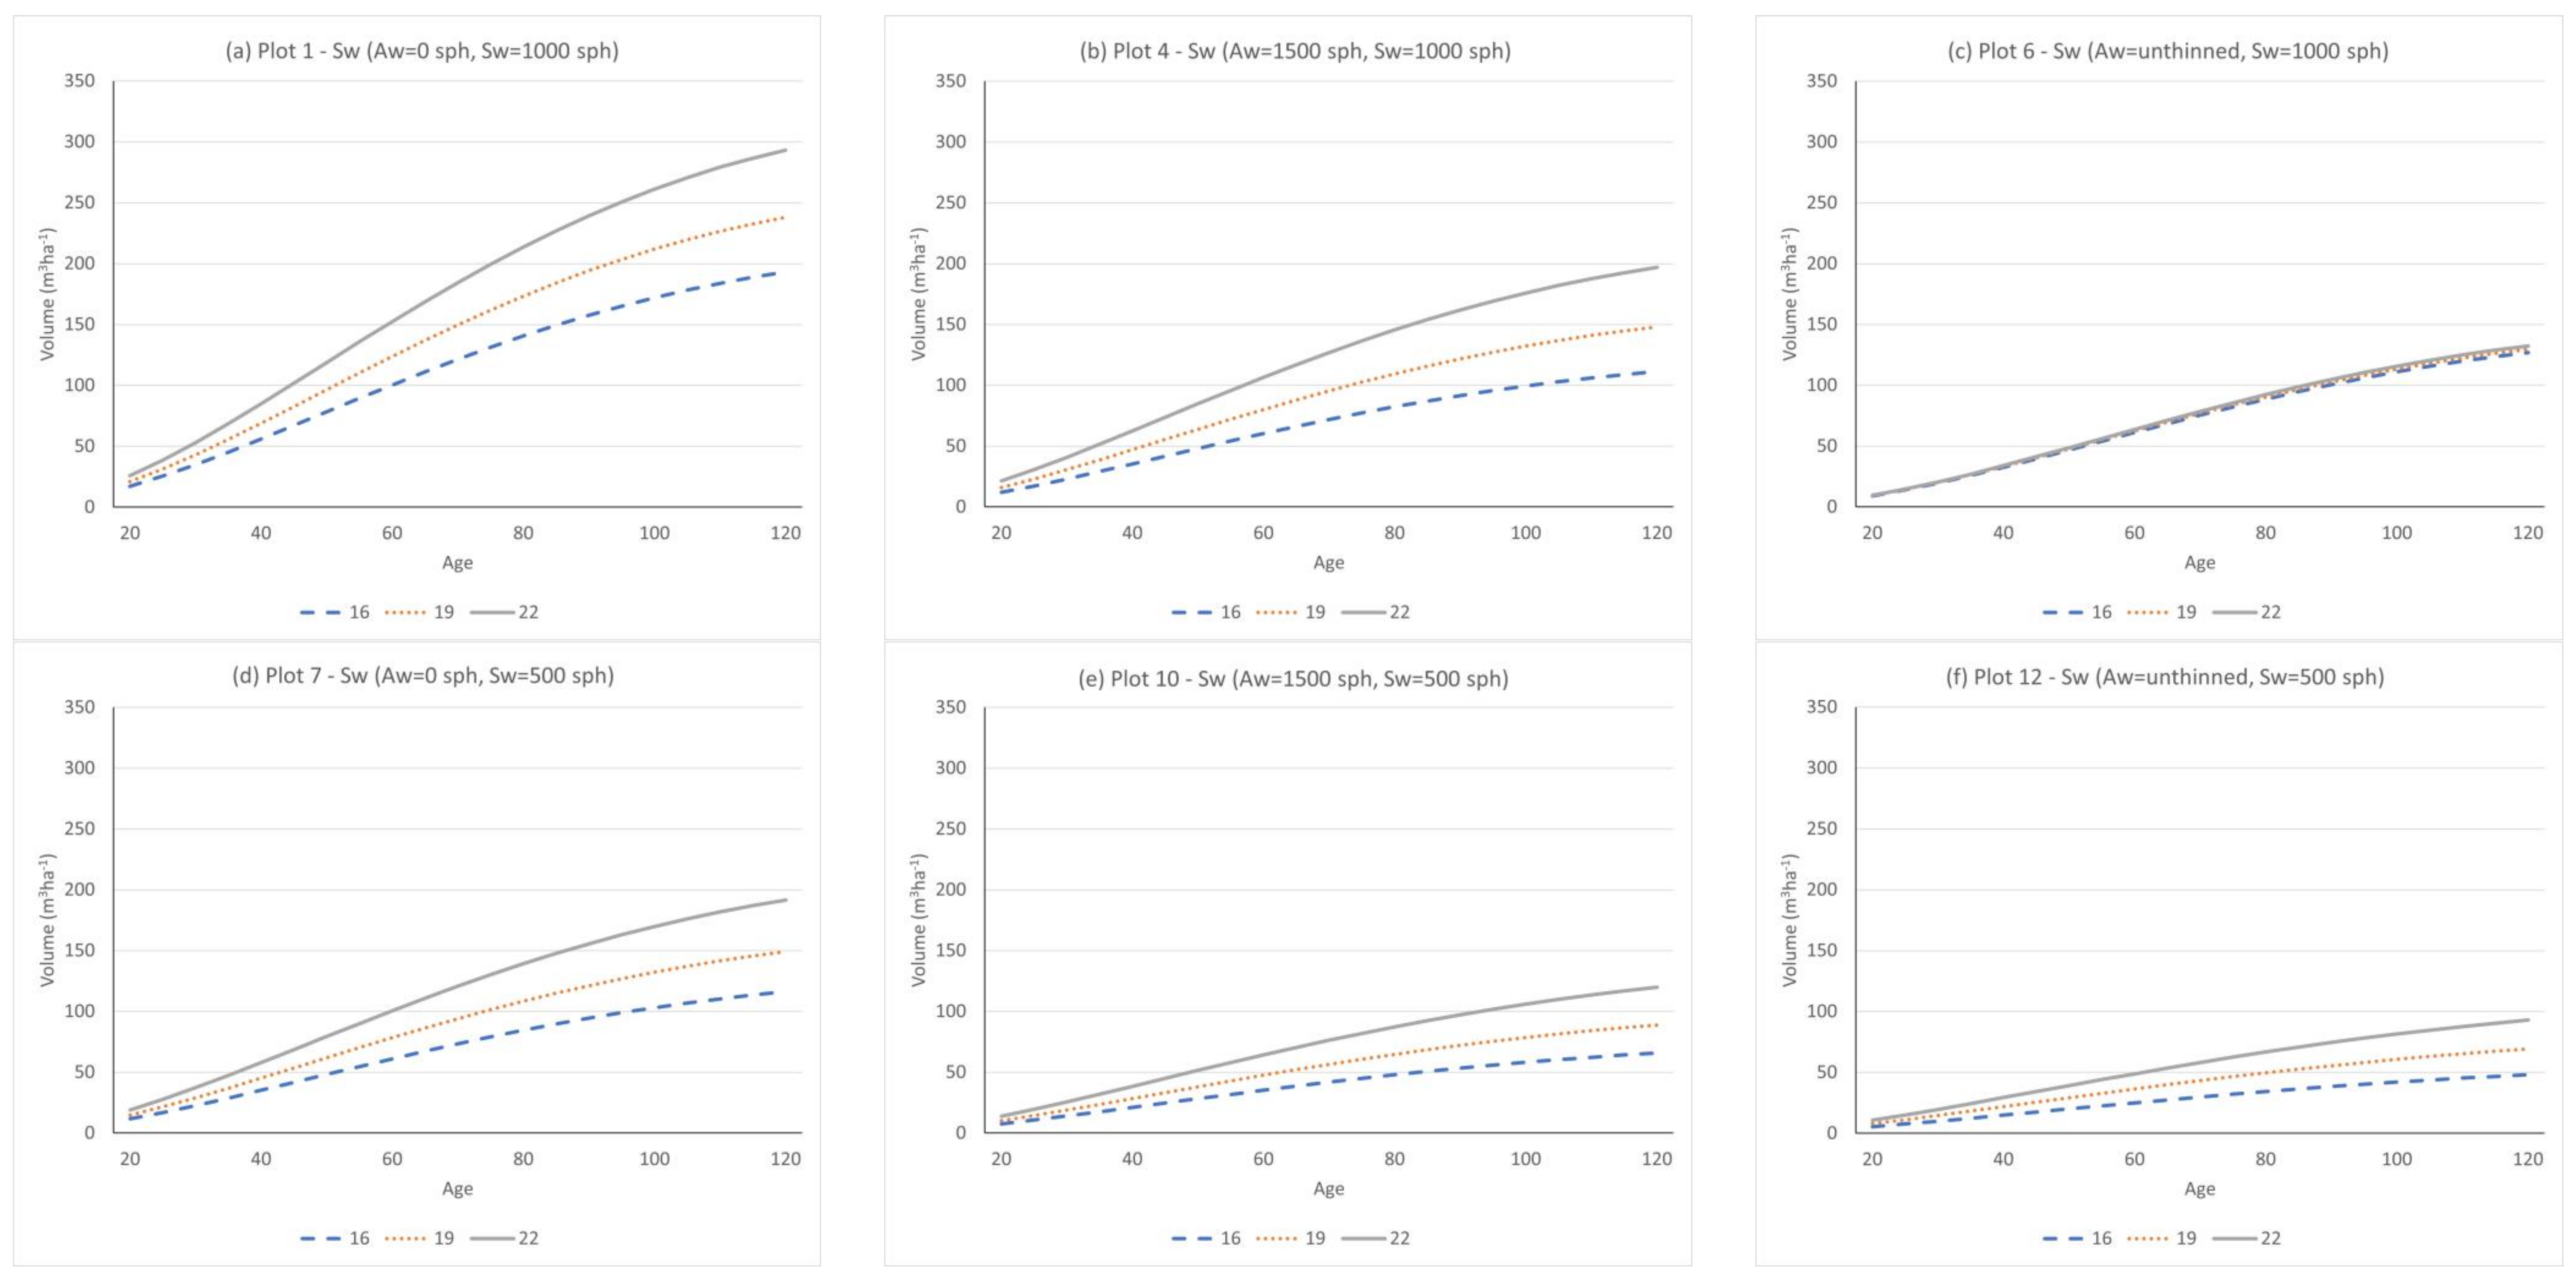
Figure 4.
Yield curves showing volume-age trends for spruce in plots 1 (a), 4 (b), 6 (c), 7 (d), 10 (e), and 12 (f) for spruce site index values of 16, 19, and 22 m. sph = stems·ha−1.
Figure 4.
Yield curves showing volume-age trends for spruce in plots 1 (a), 4 (b), 6 (c), 7 (d), 10 (e), and 12 (f) for spruce site index values of 16, 19, and 22 m. sph = stems·ha−1.
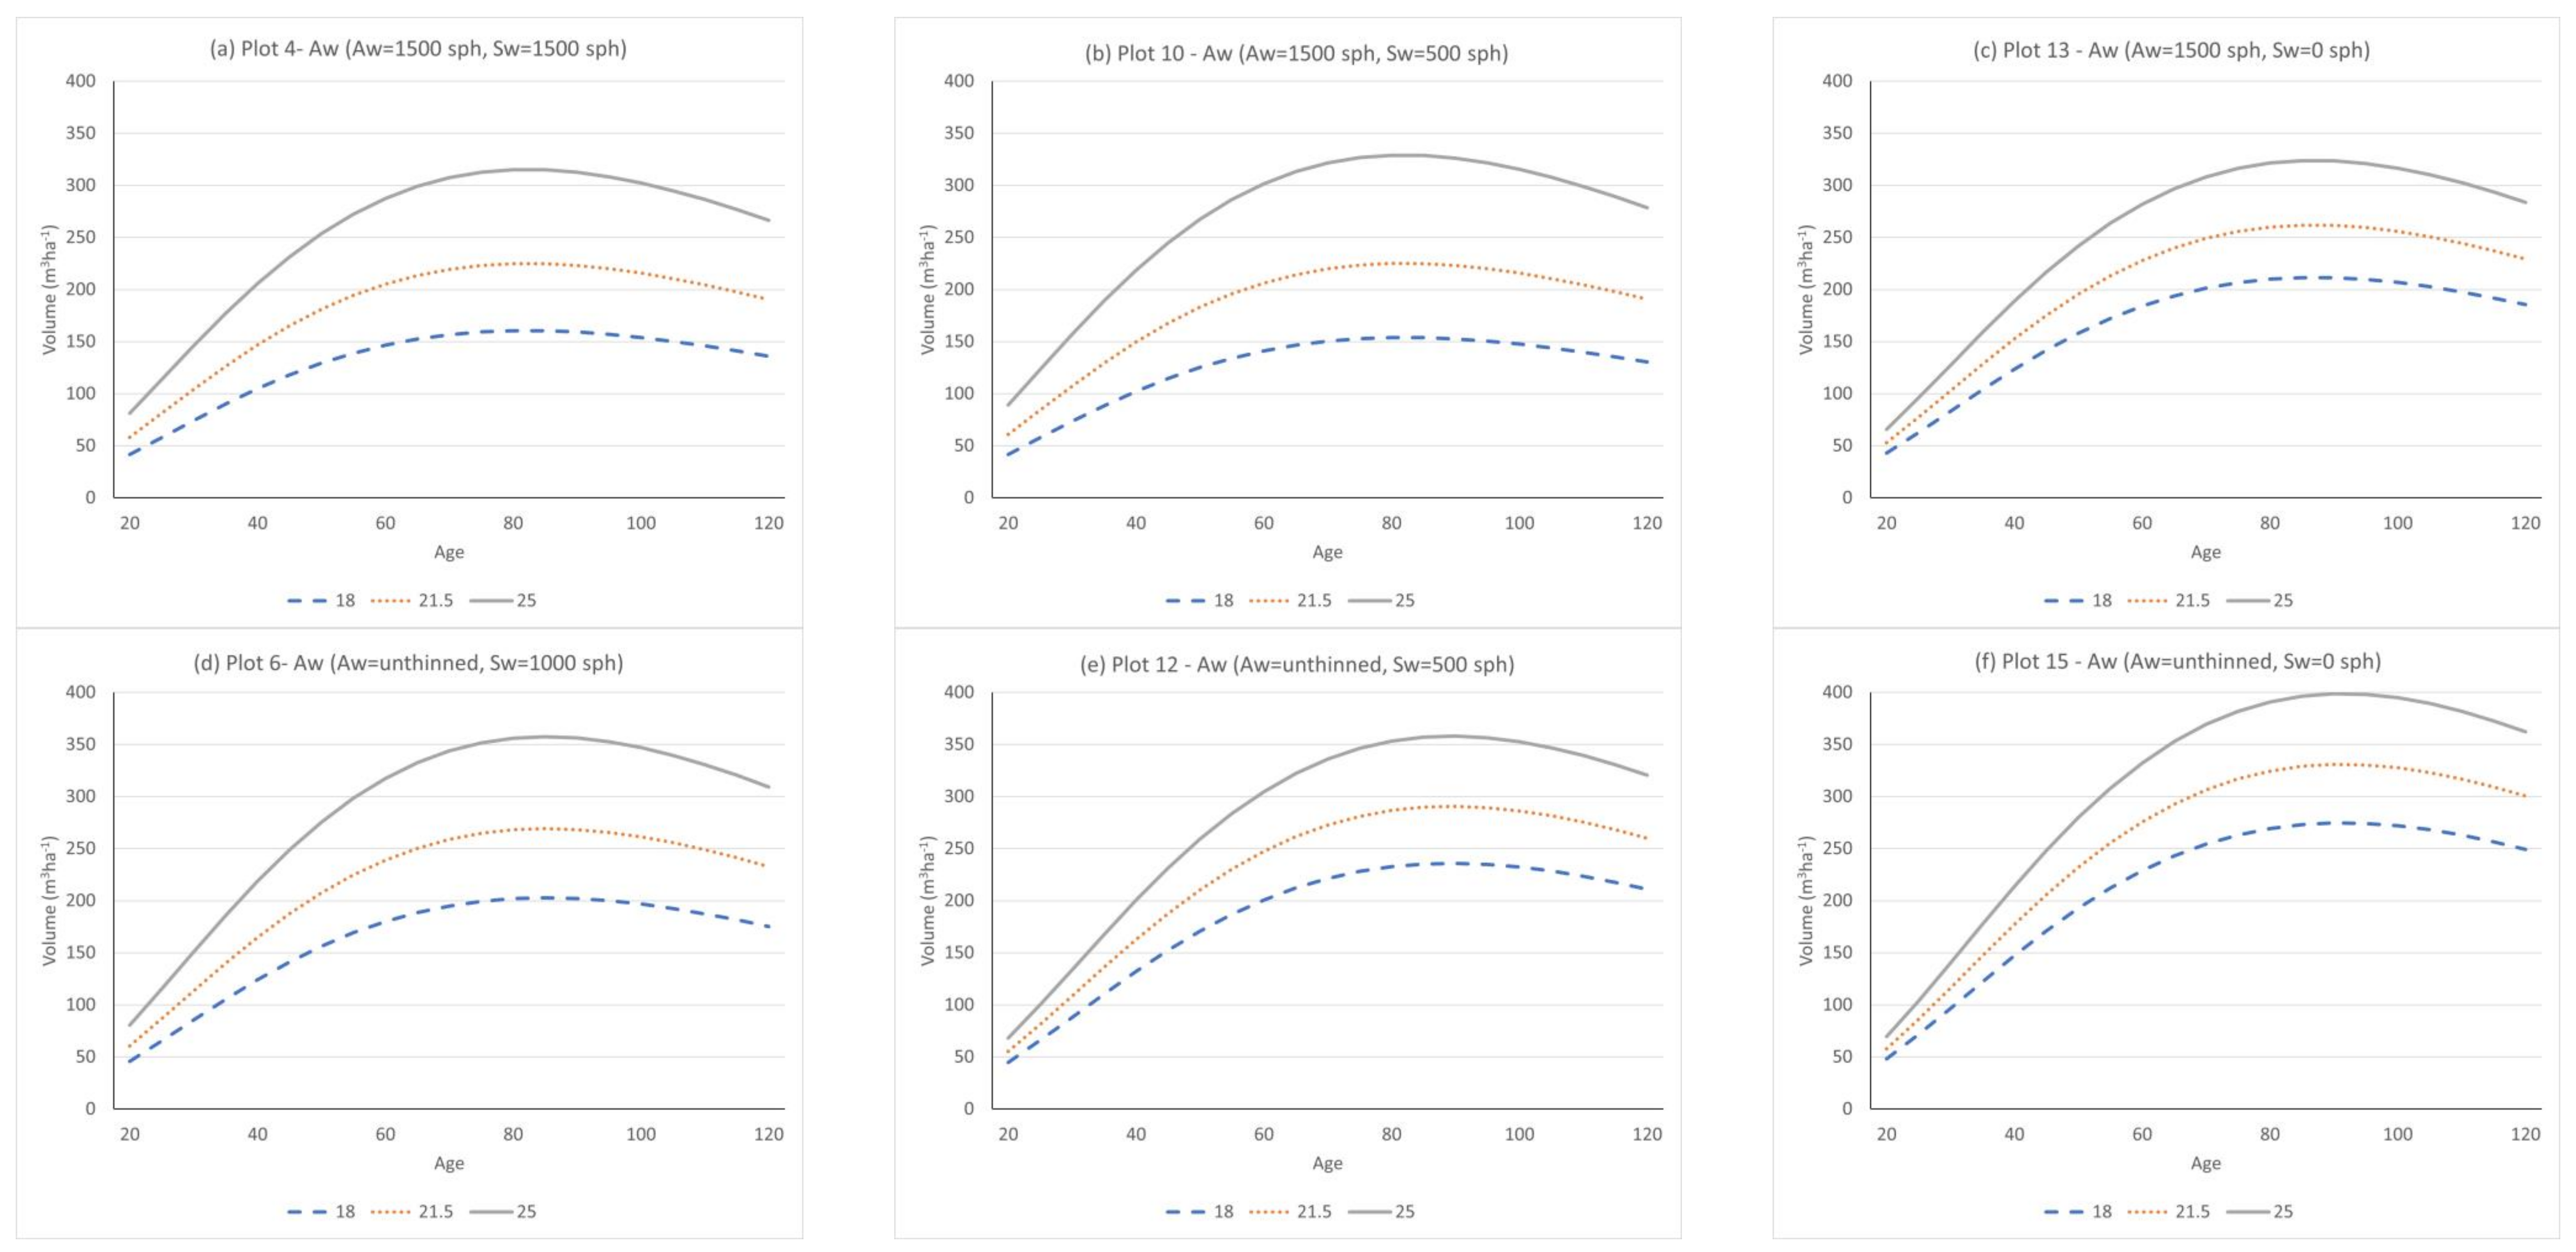
Figure 5.
Yield curves showing volume-age trends for aspen in plots 4 (a), 10 (b), 13 (c), 6 (d), 12 (e), and 15 (f) for aspen site index values of 18, 21.5 and 25 m. sph = stems·ha−1.
Figure 5.
Yield curves showing volume-age trends for aspen in plots 4 (a), 10 (b), 13 (c), 6 (d), 12 (e), and 15 (f) for aspen site index values of 18, 21.5 and 25 m. sph = stems·ha−1.
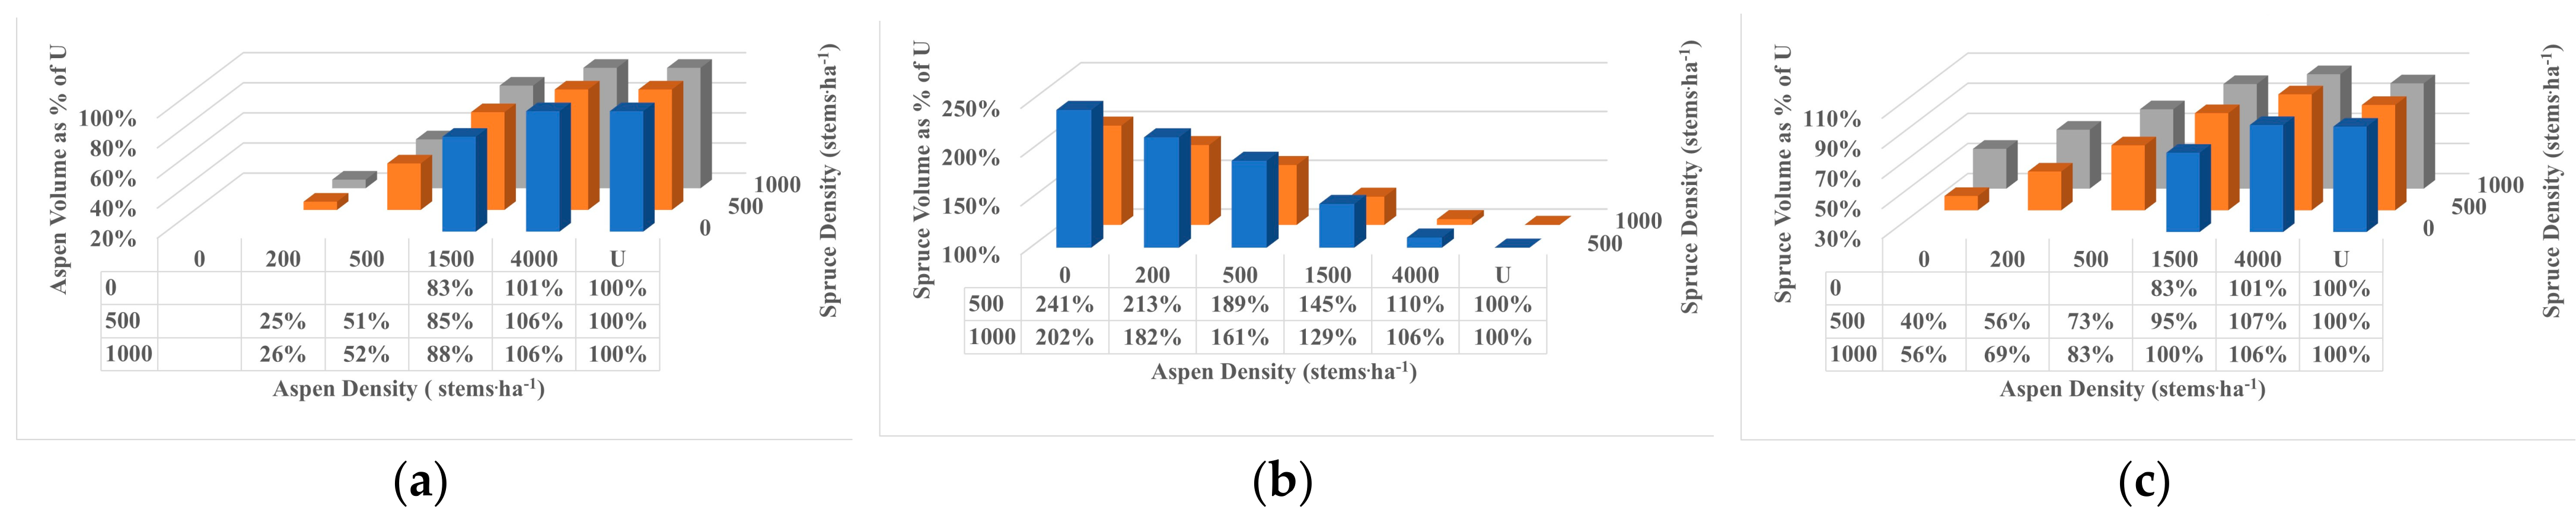
Figure 6.
Effects of aspen and spruce densities on (a) aspen, (b) spruce, and (c) stand volumes at age 90 expressed as a % of volume in the unthinned (U).
Figure 6.
Effects of aspen and spruce densities on (a) aspen, (b) spruce, and (c) stand volumes at age 90 expressed as a % of volume in the unthinned (U).
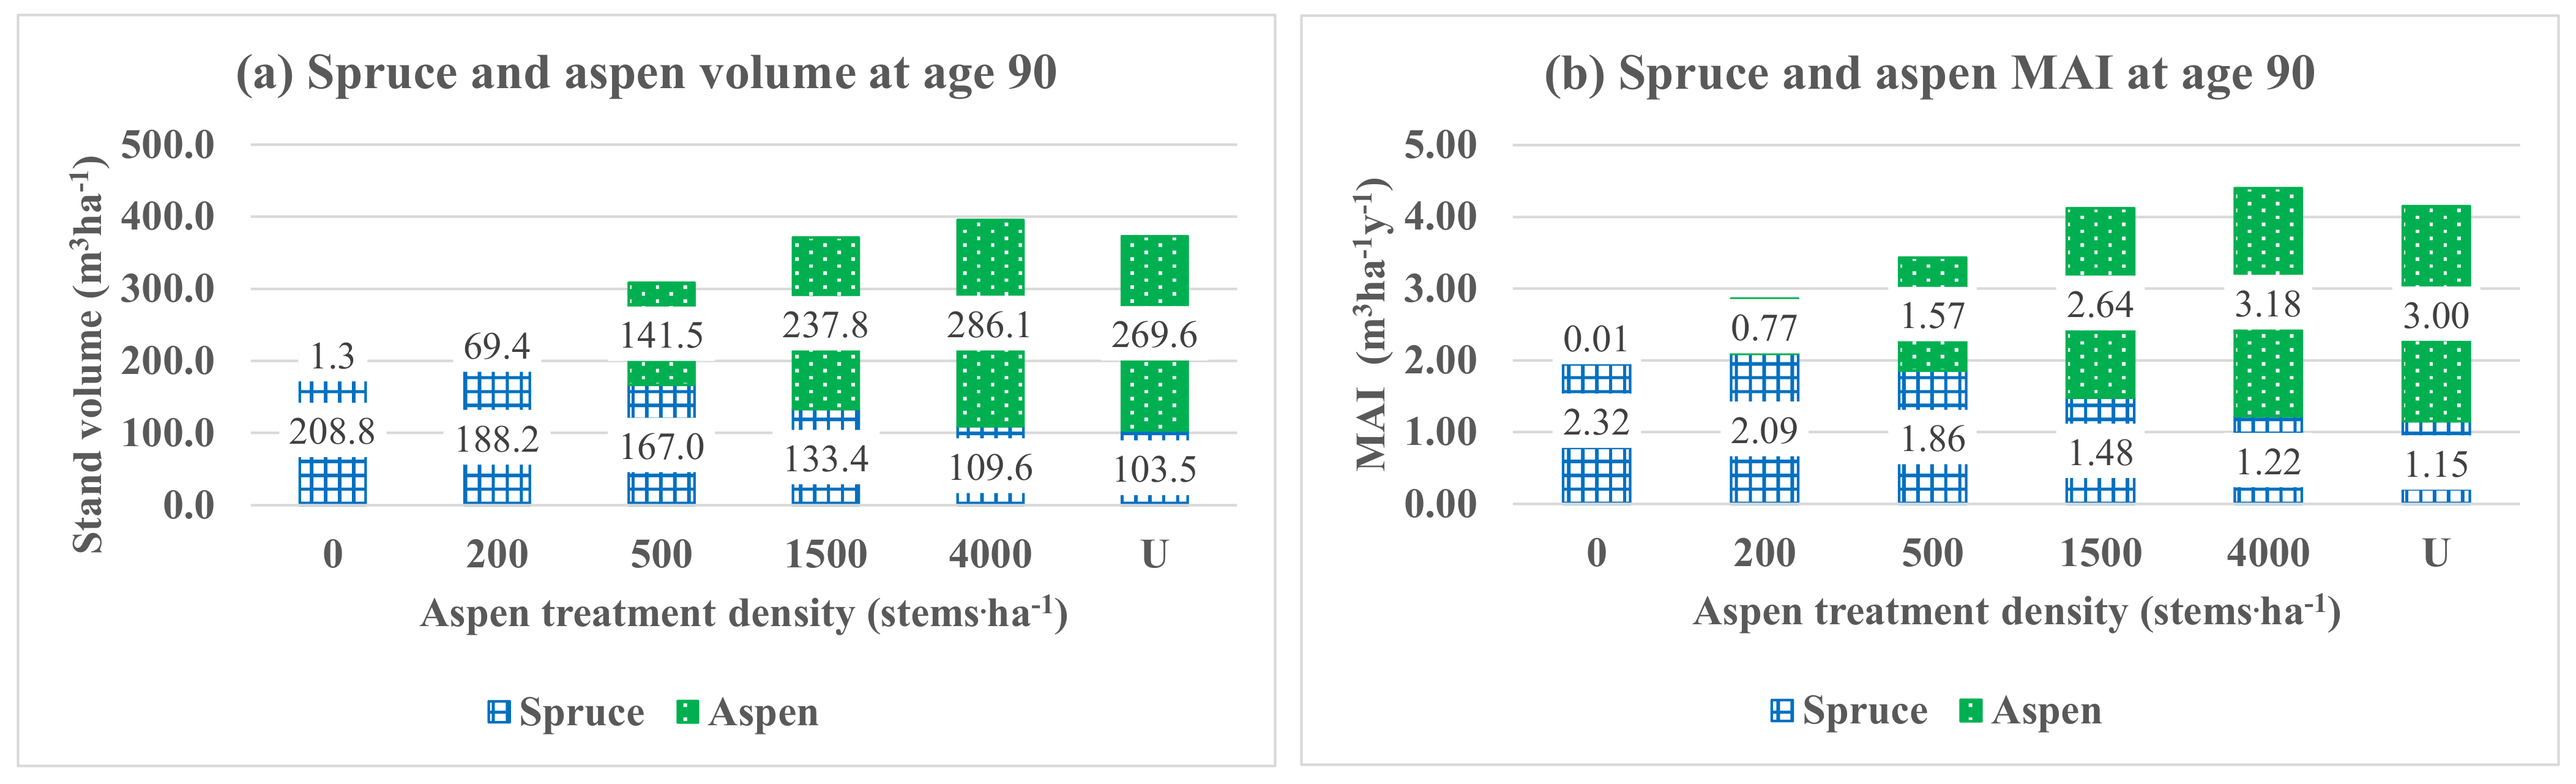
Figure 7.
Treatment effects on spruce and aspen volume (a) and MAI (b) at age 90 for initial spruce densities of 1000 stems·ha−1.
Figure 7.
Treatment effects on spruce and aspen volume (a) and MAI (b) at age 90 for initial spruce densities of 1000 stems·ha−1.
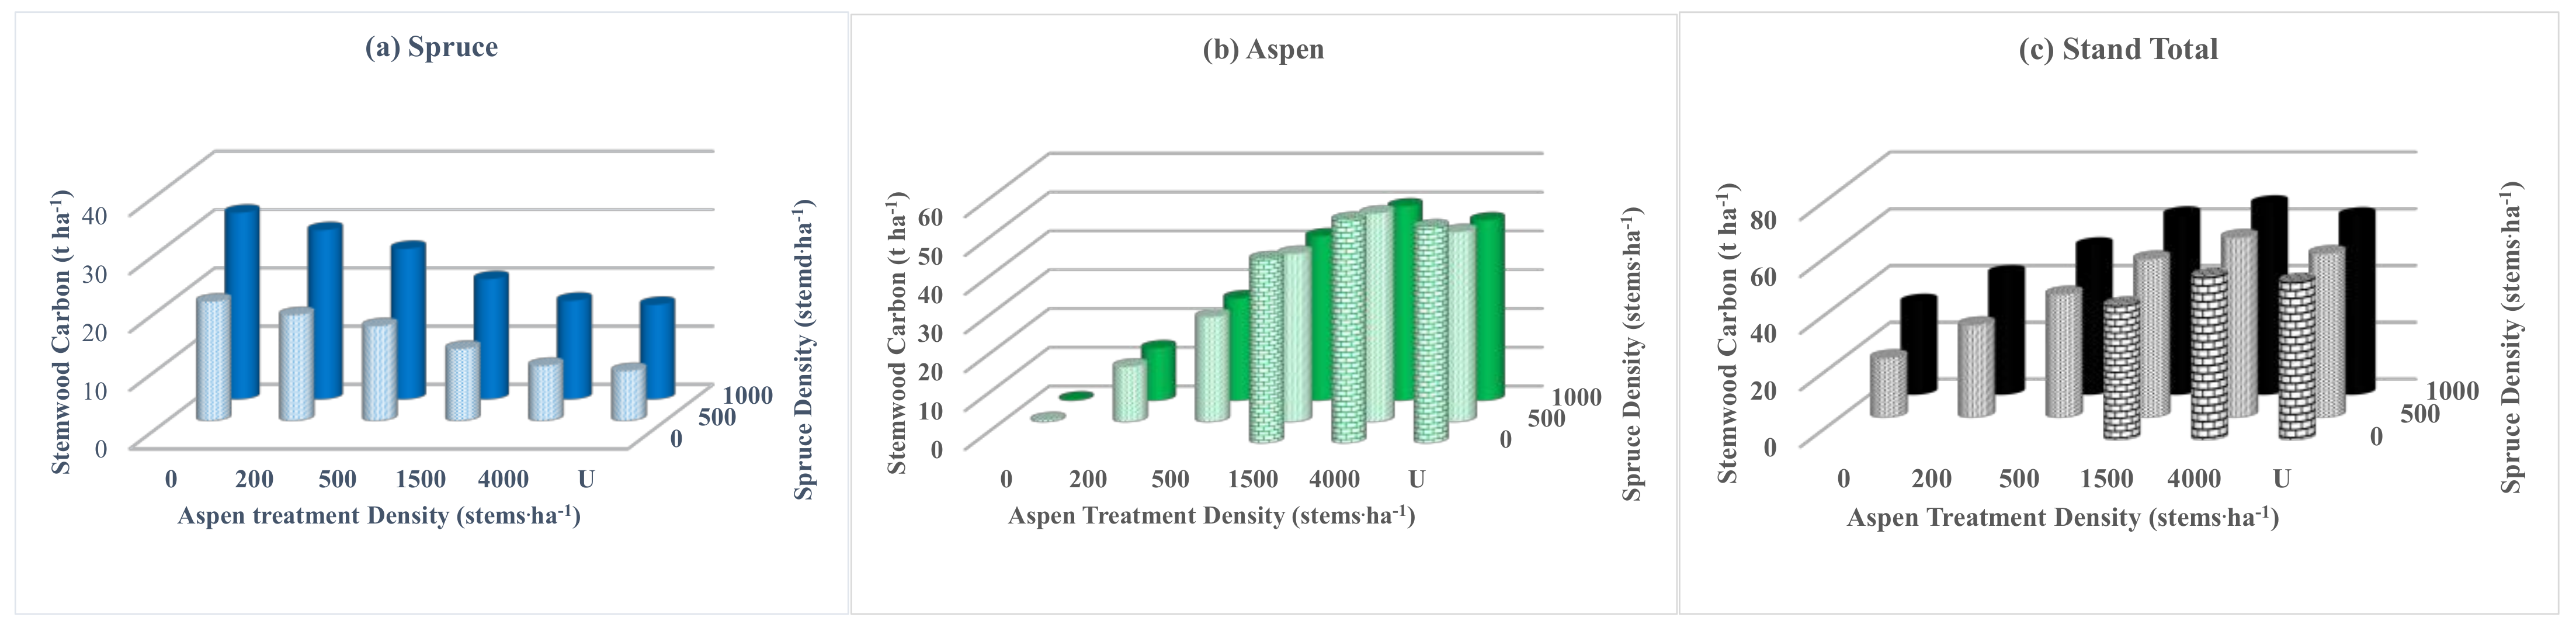
Figure 8.
Effects of aspen and spruce densities on stemwood carbon at age 90.
Figure 8.
Effects of aspen and spruce densities on stemwood carbon at age 90.
Table 1.
Location, climate, and age of the 21 WESBOGY LTS installations. MAT = mean annual temperature (1991–2020), MAP = mean annual precipitation (1991–2020), CMI = mean climate moisture index (1991–2020). Climate values were generated using ClimateNA7.3 (climateNA.ca). Site index (height of the 100 largest diameter trees at breast height age 50) was calculated for each installation using the GYPSY Site Index equations [
28], with aspen site index (SI-Aw) determined from unthinned plots (plots 6, 12, and 15) and spruce site index (SI-Sw) determined from plots with zero aspen density (plots 1 and 7) based on measurements at age 12.
| Agency | Installation | Est. Yr | Lat. | Long. | Elev. | MAT
(°C) | MAP
(mm) | CMI
(mm) | Last Meas. | Age at Last Meas. | SI-Sw | SI-Aw |
|---|
| Government of Alberta | Median | 1992 | 55.317 | −114.070 | 622 | 1.7 | 477 | 4.38 | 2017 | 25 | 20.6 | 24.3 |
| Alberta Pacific Forest Industries | Median | 2001 | 55.216 | −111.913 | 648 | 1.4 | 478 | 3.89 | 2020 | 19 | 19.4 | 22.6 |
| Alberta Pacific Forest Industries | Superior | 1993 | 55.041 | −111.948 | 596 | 1.6 | 453 | 1.09 | 2019 | 26 | 18.8 | 24.2 |
| Canadian Forest Products | Median | 2001 | 54.760 | −117.400 | 755 | 2.5 | 530 | 7.47 | 2021 | 20 | 19.1 | 19.4 |
| Canadian Forest Products | Superior | 2001 | 54.754 | −117.369 | 800 | 2.5 | 533 | 7.83 | 2020 | 20 | 22.6 | 22.0 |
| Louisiana Pacific Canada—Dawson Creek | Median | 2000 | 53.758 | −120.051 | 900 | 2.2 | 481 | 6.08 | 2020 | 20 | 12.9 | 23.4 |
| Louisiana Pacific Canada—Dawson Creek | Superior-Rep1 | 2000 | 55.392 | −121.687 | 671 | 3.1 | 499 | 4.57 | 2020 | 20 | 11.4 | 18.2 |
| Louisiana Pacific Canada—Dawson Creek | Superior-Rep2 | 2003 | 55.222 | −121.663 | 730 | 3.0 | 511 | 7.88 | 2020 | 17 | 18.5 | 19.1 |
| Louisiana Pacific Canada—Swan River | Median | 1998 | 56.485 | −101.251 | 640 | 1.0 | 519 | 7.47 | 2021 | 23 | 23.1 | 17.4 |
| Louisiana Pacific Canada—Swan River | Superior | 1998 | 51.702 | −101.550 | 619 | 1.0 | 511 | 5.61 | 2021 | 23 | 25.9 | 20.9 |
| Mercer Peace River Pulp | Median | 1992 | 56.385 | −118.589 | 788 | 1.0 | 436 | 3.28 | 2019 | 27 | 22.1 | 20.9 |
| Mercer Peace River Pulp | Superior | 1992 | 56.414 | −117.729 | 728 | 1.1 | 423 | −0.22 | 2019 | 27 | 22.1 | 21.9 |
| NWT | Median | 1993 | 61.342 | −120.749 | 240 | −2.2 | 388 | −2.34 | 2015 | 22 | 15.5 | 20.3 |
| NWT | Superior | 1993 | 61.239 | −120.469 | 270 | −2.3 | 369 | −3.08 | 2015 | 22 | 17.9 | 23.6 |
| Saskatchewan Environment-Prince Albert | Median | 1990 | 53.759 | −105.551 | 548 | 0.7 | 483 | 4.60 | 2021 | 31 | 21.9 | 22.0 |
| Saskatchewan Environment-Prince Albert | Superior | 1990 | 53.678 | −105.937 | 535 | 1.0 | 476 | 2.68 | 2021 | 31 | 20.9 | 23.2 |
| Saskatchewan Environment-Big River | Median | 1992 | 54.092 | −107.066 | 515 | 1.1 | 433 | −1.19 | 2018 | 26 | 21.4 | 25.0 |
| Saskatchewan Environment-Big River | Superior | 1992 | 54.052 | −106.979 | 505 | 1.2 | 436 | −1.04 | 2018 | 26 | 19.6 | 25.1 |
| WestFraser | Median | 1992 | 53.760 | −116.678 | 1050 | 2.9 | 544 | 10.76 | 2019 | 27 | 19.5 | 20.3 |
| WestFraser | Superior-Rep1 | 1992 | 53.804 | −116.644 | 1100 | 2.9 | 555 | 13.33 | 2019 | 27 | 21.2 | 19.8 |
| WestFraser | Superior-Rep2 | 1994 | 53.796 | −116.610 | 1085 | 2.9 | 551 | 12.28 | 2019 | 25 | 19.0 | 18.5 |
| Weyerhaeuser Canada—Grand Prairie | Median | 1991 | 54.886 | −118.898 | 703 | 2.4 | 476 | 1.01 | 2018 | 27 | 15.7 | 19.6 |
| Weyerhaeuser Canada—Grand Prairie | Superior | 1991 | 54.913 | −118.919 | 711 | 2.35 | 466 | −0.74 | 2018 | 27 | 16.0 | 20.1 |
Table 2.
Treatment (plot) numbers associated with each of the 15 spruce and aspen density combinations created in the WESBOGY Long-Term Study.
Table 2.
Treatment (plot) numbers associated with each of the 15 spruce and aspen density combinations created in the WESBOGY Long-Term Study.
| | | Aspen Density (stems·ha−1) |
|---|
| | | 0 | 200 | 500 | 1500 | 4000 | Natural |
|---|
| Spruce Density (stems·ha−1) | 1000 | 1 | 2 | 3 | 4 | 5 | 6 |
| 500 | 7 | 8 | 9 | 10 | 11 | 12 |
| 0 | x | x | x | 13 | 14 | 15 |
Table 3.
Results from repeated measures analysis testing effects of age, aspen treatment density, spruce treatment density, and interaction terms on aspen and spruce height and DBH. Significant (p < 0.05) terms are indicated in bold.
Table 3.
Results from repeated measures analysis testing effects of age, aspen treatment density, spruce treatment density, and interaction terms on aspen and spruce height and DBH. Significant (p < 0.05) terms are indicated in bold.
| Species: | Aspen (Top 200 Trees ha−1) | Spruce |
|---|
| Variable: | Height | DBH | Height | DBH |
|---|
| Source | Num df | Den df | p-Value | Num df | Den df | p-Value | Num df | Den df | p-Value | Num df | Den df | p-Value |
|---|
| Age | 1 | 2770 | <0.0001 | 1 | 2810 | <0.0001 | 1 | 771 | <0.0001 | 1 | 718 | <0.0001 |
| Age2 | 1 | 2701 | 0.0408 | 1 | 2537 | 0.0307 | 1 | 2855 | <0.0001 | 1 | 2521 | <0.0001 |
| Age3 | 1 | 2504 | 0.0869 | 1 | 2540 | 0.0260 | | | | | | |
| Aspen Treatment Density (Aw) | 4 | 371 | 0.8060 | 4 | 395 | 0.0491 | 5 | 470 | <0.0001 | 5 | 456 | <0.0001 |
| Spruce Planting Density (Sw) | 1 | 370 | 0.3683 | 1 | 396 | 0.1384 | 1 | 470 | 0.7155 | 1 | 456 | 0.0026 |
| Aw × Sw | 4 | 370 | 0.9179 | 4 | 398 | 0.8299 | 5 | 469 | 0.8771 | 5 | 456 | 0.1926 |
| Age × Aw | 4 | 343 | 0.7916 | 4 | 352 | 0.0003 | 5 | 469 | <0.0001 | 5 | 456 | <0.0001 |
| Age × Sw | 1 | 344 | 0.2011 | 1 | 353 | 0.0353 | 1 | 469 | 0.9822 | 1 | 456 | 0.0121 |
| Age × Aw × Sw | 4 | 344 | 0.9046 | 4 | 353 | 0.5848 | 5 | 469 | 0.9072 | 5 | 456 | 0.4198 |
Table 4.
Mixed model ANOVA results (α = 0.05) for aspen, testing differences in mean HT (m), DBH (cm), Slenderness, crown width (CW) (m), height to live crown base (HTLC) (m), SPH (stems·ha−1) and basal area (BA) (m2·ha−1) by treatment at year 10. Significant (p < 0.05) terms are indicated in bold.
Table 4.
Mixed model ANOVA results (α = 0.05) for aspen, testing differences in mean HT (m), DBH (cm), Slenderness, crown width (CW) (m), height to live crown base (HTLC) (m), SPH (stems·ha−1) and basal area (BA) (m2·ha−1) by treatment at year 10. Significant (p < 0.05) terms are indicated in bold.
| Source | df | HT | DBH | Slendernes | CW | HTLC | SPH | BA |
|---|
| | | p-Value | p-Value | p-Value | p-Value | p-Value | p-Value | p-Value |
|---|
| Agency (A) | 10 | - | - | - | - | - | - | - |
| Installation (I) | 1 | 0.2073 | 0.3467 | 0.5691 | 0.6068 | 0.1742 | 0.3300 | 0.6683 |
| Aspen Treatment Density (Aw) | 3 | <0.0001 | 0.0109 | <0.0001 | 0.4947 | <0.0001 | <0.0001 | <0.0001 |
| Spruce Planting Density (Sw) | 1 | 0.7137 | 0.2358 | 0.6205 | 0.4446 | 0.9486 | 0.3300 | 0.7211 |
| A × I | 9 | - | - | - | - | - | - | - |
| Replicate (A × I) | 20 | - | - | - | - | - | - | - |
| Aw × Sw | 3 | 0.2765 | 0.1504 | 0.3674 | 0.6113 | 0.4175 | 0.4190 | 0.8348 |
| I × Aw | 3 | 0.3653 | 0.6592 | 0.7982 | 0.9297 | 0.3922 | 0.0851 | 0.8719 |
| I × Sw | 1 | 0.9301 | 0.6139 | 0.5167 | 0.9994 | 0.7343 | 0.0905 | 0.8783 |
| I × Aw × Sw | 3 | 0.2199 | 0.9002 | 0.1516 | 0.6781 | 0.4960 | 0.0353 | 0.9462 |
| Residual Error | 272 | - | - | - | - | - | - | - |
| Total | 326 | - | - | - | - | - | - | - |
Table 5.
Mixed model ANOVA results (α = 0.05) for aspen, testing differences in mean HT (m), DBH (cm), Slenderness, crown width (CW) (m), height to live crown base (HTLC) (m), SPH (stems·ha−1) and basal area (BA) (m2·ha−1) by treatment at year 20. Significant (p < 0.05) terms are indicated in bold.
Table 5.
Mixed model ANOVA results (α = 0.05) for aspen, testing differences in mean HT (m), DBH (cm), Slenderness, crown width (CW) (m), height to live crown base (HTLC) (m), SPH (stems·ha−1) and basal area (BA) (m2·ha−1) by treatment at year 20. Significant (p < 0.05) terms are indicated in bold.
| Source | df | HT | DBH | Slendernes | CW | HTLC | SPH | BA |
|---|
| | | p-Value | p-Value | p-Value | p-Value | p-Value | p-Value | p-Value |
|---|
| Agency (A) | 10 | - | - | - | - | - | - | - |
| Installation (I) | 1 | 0.6718 | 0.4282 | 0.3710 | 0.9925 | 0.3438 | 0.5983 | 0.5819 |
| Aspen Treatment Density (Aw) | 4 | <0.0001 | <0.0001 | <0.0001 | <0.0001 | <0.0001 | <0.0001 | <0.0001 |
| Spruce Planting Density (Sw) | 1 | 0.8226 | 0.3320 | 0.5397 | 0.7923 | 0.2371 | 0.3899 | 0.9749 |
| A × I | 9 | - | - | - | - | - | - | - |
| Replicate (A × I) | 19 | - | - | - | - | - | - | - |
| Aw × Sw | 4 | 0.9769 | 0.3390 | 0.4685 | 0.1364 | 0.7584 | 0.5927 | 0.7405 |
| I × Aw | 4 | 0.1650 | 0.2471 | 0.5172 | 0.5511 | 0.3283 | 0.3918 | 0.9368 |
| I × Sw | 1 | 0.8730 | 0.8840 | 0.7671 | 0.8982 | 0.0625 | 0.1383 | 0.8510 |
| I × Aw × Sw | 4 | 0.7850 | 0.9976 | 0.9200 | 0.8057 | 0.9570 | 0.0782 | 0.9932 |
| Residual Error | 340 | - | - | - | - | - | - | - |
| Total | 397 | - | - | - | - | - | - | - |
Table 6.
Mixed model ANOVA results (α = 0.05) for aspen, testing differences in mean HT (m), DBH (cm), Slenderness, crown width (CW) (m), height to live crown base (HTLC) (m), SPH (stems·ha−1) and basal area (BA) (m2·ha−1) by treatment at year 28. Significant (p < 0.05) terms are indicated in bold.
Table 6.
Mixed model ANOVA results (α = 0.05) for aspen, testing differences in mean HT (m), DBH (cm), Slenderness, crown width (CW) (m), height to live crown base (HTLC) (m), SPH (stems·ha−1) and basal area (BA) (m2·ha−1) by treatment at year 28. Significant (p < 0.05) terms are indicated in bold.
| Source | df | HT | DBH | Slenderness | CW | HTLC | SPH | BA |
|---|
| | | p-Value | p-Value | p-Value | p-Value | p-Value | p-Value | p-Value |
|---|
| Agency (A) | 6 | - | - | - | - | - | - | - |
| Installation (I) | 1 | 0.2329 | 0.3441 | 0.0720 | 0.2537 | 0.4929 | 0.2103 | 0.6716 |
| Aspen Treatment Density (Aw) | 4 | 0.0010 | <0.0001 | <0.0001 | <0.0001 | <0.0001 | <0.0001 | <0.0001 |
| Spruce Planting Density (Sw) | 1 | 0.1346 | 0.1762 | 0.8035 | 0.1909 | 0.2978 | 0.2533 | 0.2227 |
| A × I | 4 | - | - | - | - | - | - | - |
| Replicate (A × I) | 10 | - | - | - | - | - | - | - |
| Aw × Sw | 4 | 0.5198 | 0.4927 | 0.1084 | 0.8385 | 0.4933 | 0.2627 | 0.5223 |
| I × Aw | 4 | 0.3651 | 0.0021 | 0.0056 | 0.7459 | 0.5860 | 0.0521 | 0.4855 |
| I × Sw | 1 | 0.6091 | 0.5043 | 0.3445 | 0.8205 | 0.2995 | 0.2823 | 0.7067 |
| I × Aw × Sw | 4 | 0.0111 | 0.7156 | 0.3293 | 0.9275 | 0.1254 | 0.4036 | 0.3505 |
| Residual Error | 178 | - | - | - | - | - | - | - |
| Total | 217 | - | - | - | - | - | - | - |
Table 7.
Summary of treatment means (least square means) for aspen height (HT), DBH, Slenderness, crown width (CW), height to live crown (HTLC) for top trees, density (SPH, stems·ha−1), and basal area (BA) by treatment and age. Values within each row with different letters were found to be significantly (α = 0.05) different using Tukey’s test. The standard deviation is indicated in parentheses.
| | | Treatment |
|---|
| Variable | Age | 200 | 500 | 1500 | 4000 | Unthinned |
|---|
| HT (m) | 10 | 6.18 b (1.600) | 6.79 a (1.752) | 6.88 a (1.759) | 6.95 a (1.705) | 6.04 b (1.706) |
| HT (m) | 20 | 11.09 c (2.261) | 12.08 ab (2.118) | 12.13 a (1.912) | 12.28 a (1.911) | 11.42 bc (1.967) |
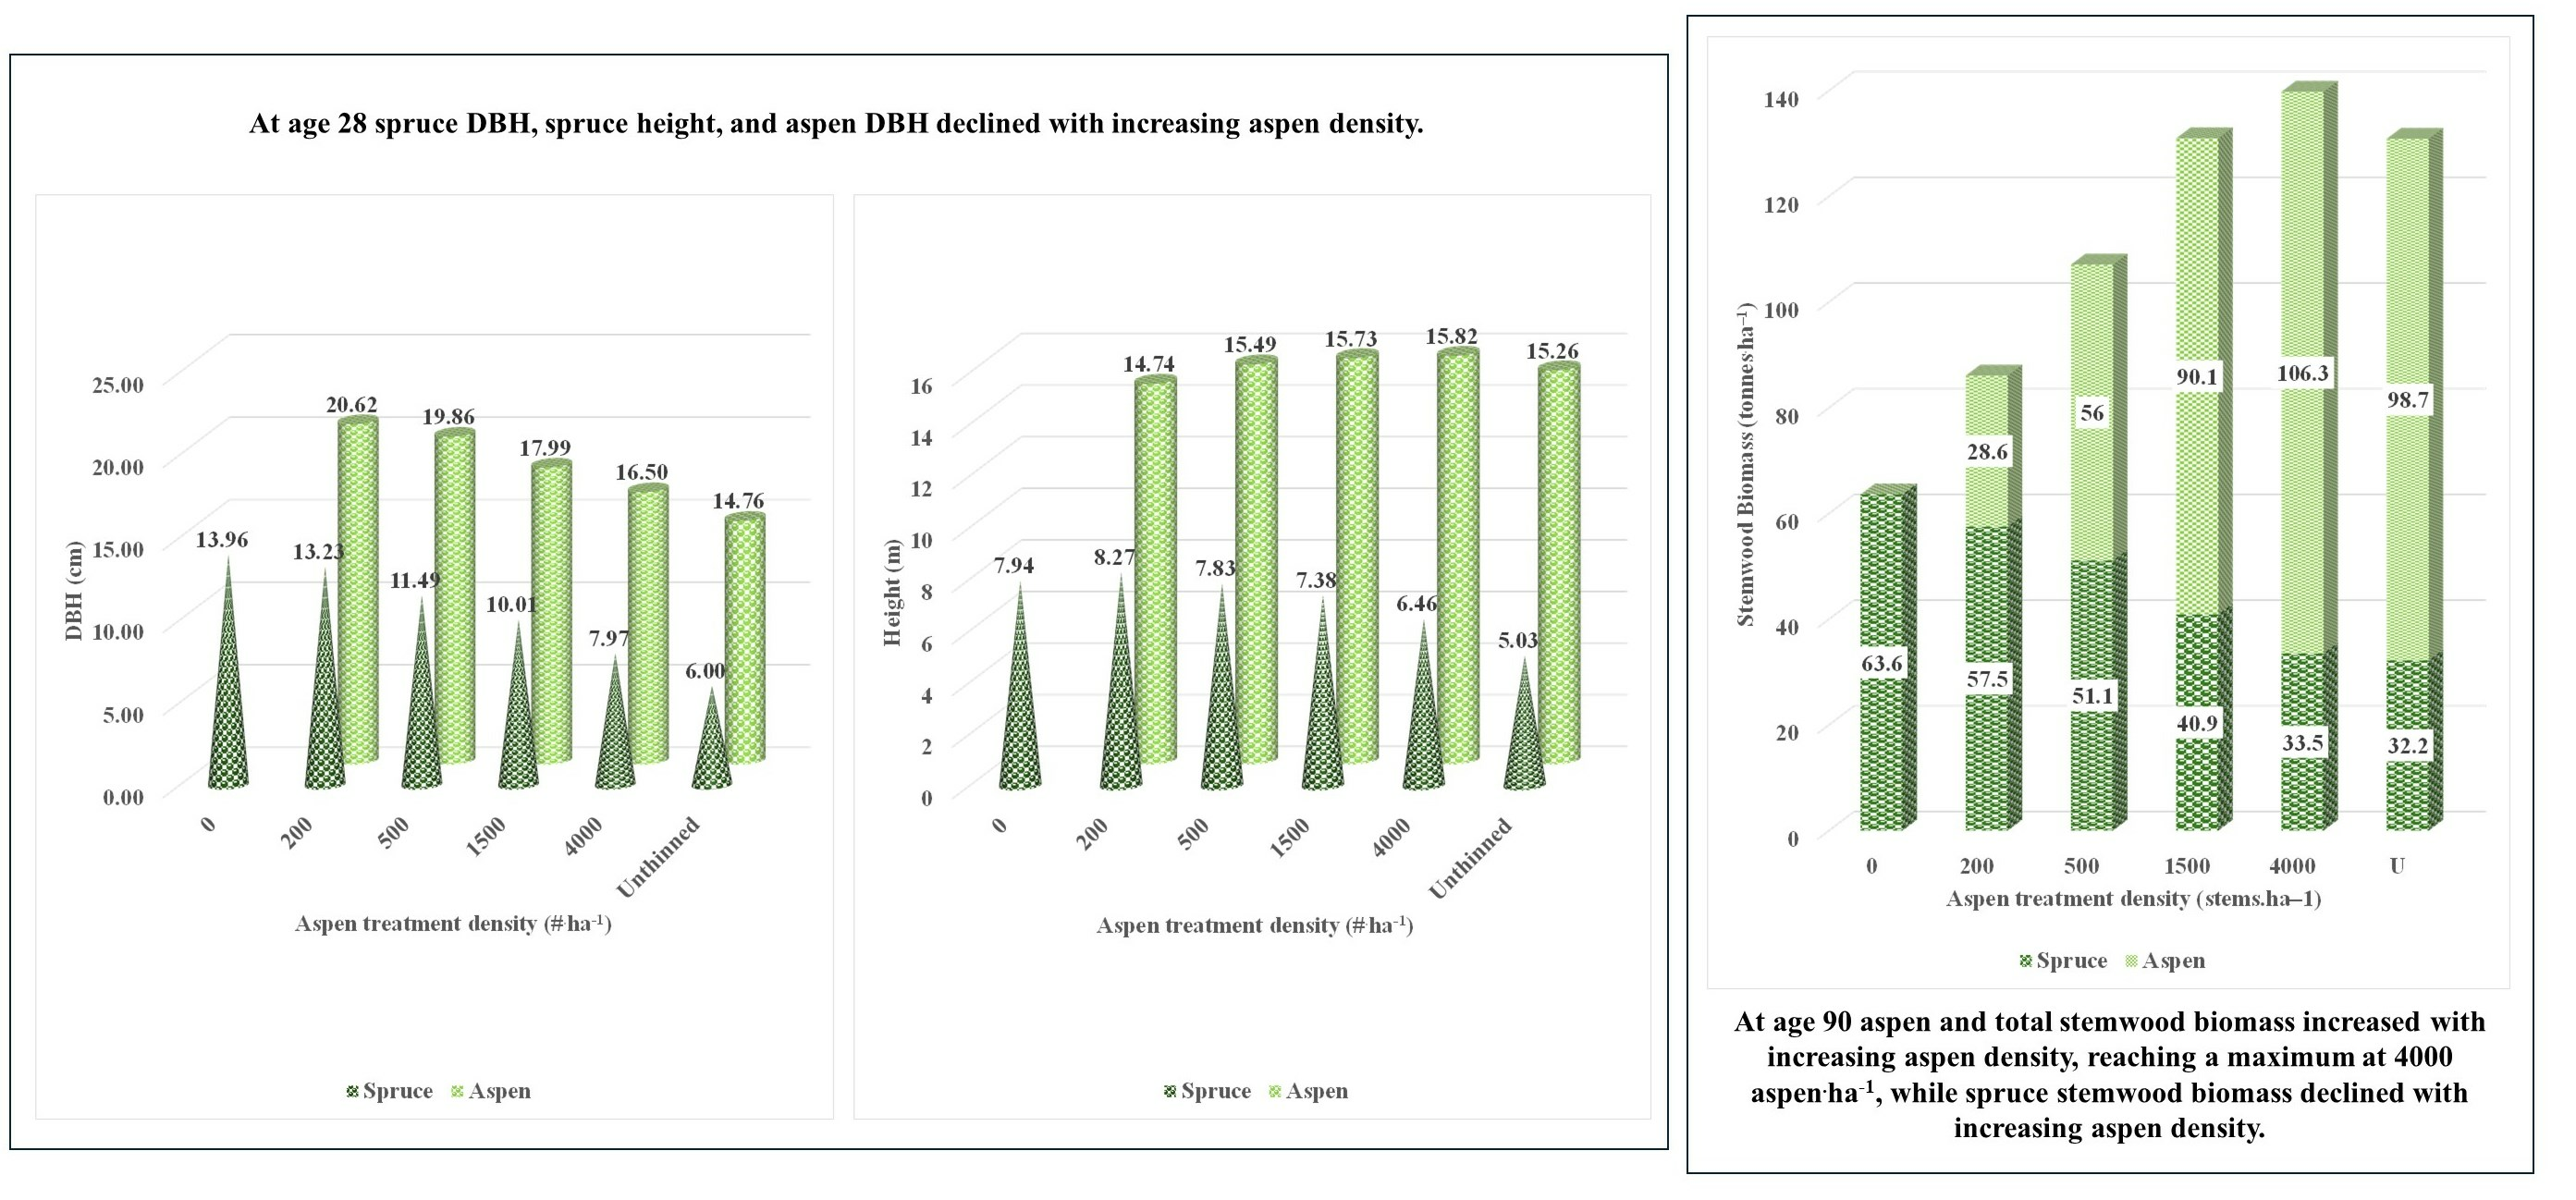
| HT (m) | 28 | 14.74 b (1.465) | 15.49 ab (1.957) | 15.73 a (1.870) | 15.82 a (1.870) | 15.26 ab (1.832) |
| DBH (cm) | 10 | 6.87 a (1.908) | 7.38 a (1664) | 7.29 a (1.578) | 7.09 a (1.330) | 5.09 b (1.397) |
| DBH (cm) | 20 | 14.44 ab (3.230) | 15.14 a (2.589) | 13.93 b (1.974) | 12.95 c (1.458) | 10.96 d (2.162) |
| DBH (cm) | 28 | 20.62 a (2.244) | 19.86 a (2.527) | 17.99 b (1.651) | 16.50 c (1.779) | 14.76 d (2.115) |
| Slenderness | 10 | 0.93 c (0.176) | 0.92 c (0.135) | 0.94 bc (0.125) | 0.98 b (0.155) | 1.22 a (0.252) |
| Slenderness | 20 | 0.85 bc (0.556) | 0.80 c (0.109) | 0.88 bc (0.115) | 0.95 b (0.128) | 1.07 a (0.196) |
| Slenderness | 28 | 0.72 e (0.074) | 0.79 d (0.079) | 0.88 c(0.104) | 0.97 b (0.105) | 1.05 a (0.152) |
| CW (m) | 10 | 1.20 a (0.357) | 1.24 a (0.299) | 1.23 a (0.330) | 1.18 a (0.268) | 0.86 b (0.338) |
| CW (m) | 20 | 1.97 ab (0.541) | 2.06 a (0.619) | 1.81 bc (0.418) | 1.68 c (0.376) | 1.41 d (0.475) |
| CW (m) | 28 | 2.68 a (0.636) | 2.48 a (0.438) | 2.14 b (0.420) | 1.83 c (0.348) | 1.61 d (0.516) |
| HTLC (m) | 10 | 1.58 c (0.615) | 1.68 bc (0.587) | 1.70 bc (0.717) | 1.87 ab (0.785) | 2.02 a (0.835) |
| HTLC (m) | 20 | 2.96 e (0.986) | 3.45 d (1.393) | 3.97 c (1.435) | 4.71 b (1.412) | 5.27 a (1.546) |
| HTLC (m) | 28 | 4.97 d (1.070) | 5.75 c (1.503) | 6.91 b (1.599) | 7.41 ab (1.659) | 7.86 a (1.553) |
| SPH (stems·ha−1) | 10 | 182 c (41.5) | 492 c (91.5) | 1364 c (216.1) | 3599 b (453.5) | 17,775 a (7605.4) |
| SPH (stems·ha−1) | 20 | 160 c (41.4) | 467 c (92.1) | 1354 c (217.9) | 3590 b (458.5) | 17,466 a (7736.9) |
| SPH (stems·ha−1) | 28 | 150 c (54.0) | 464 c (122.8) | 1356 c (223.5) | 3507 b (571.6) | 16,490 a (5898.8) |
| BA (m2·ha−1) | 10 | 1.25 e (0.670) | 2.70 d (1.156) | 5.21 c (2.422) | 8.72 b (3.214) | 12.01 a (5.654) |
| BA (m2·ha−1) | 20 | 1.26 e (0.656) | 2.70 d (1.150) | 5.23 c (2.444) | 8.86 b (3.113) | 11.94 a (5.705) |
| BA (m2·ha−1) | 28 | 1.62 e (0.596) | 3.16 d (1.205) | 6.18 c (2.223) | 10.10 b (3.008) | 12.94 a (3.621) |
Table 8.
Mixed model ANOVA results (α = 0.05) for spruce, testing differences in mean height (HT) (m), root collar diameter (RCD) (cm), height: diameter ratio (HDR), crown width (CW) (m) and height to live crown base (HTLC) (m) by treatment at year 10. Significant (p < 0.05) terms are indicated in bold.
| Source | df | HT | RCD | HDR | CW | HTLC |
|---|
| | | p-Value | p-Value | p-Value | p-Value | p-Value |
|---|
| Agency (A) | 10 | - | - | - | - | - |
| Installation (I) | 1 | 0.2180 | 0.1263 | 0.2348 | 0.1662 | 0.7794 |
| Aspen Treatment Density (Aw) | 5 | 0.0064 | <0.0001 | <0.0001 | 0.0832 | 0.0852 |
| Spruce Planting Density (Sw) | 1 | 0.2822 | 0.7305 | 0.2739 | 0.0962 | 0.9316 |
| A × I | 9 | - | - | - | - | - |
| Replicate (A × I) | 20 | - | - | - | - | - |
| Aw × Sw | 5 | 0.7804 | 0.7928 | 0.8974 | 0.5788 | 0.8032 |
| I × Aw | 5 | 0.0049 | 0.0059 | 0.1714 | 0.0022 | 0.6081 |
| I × Sw | 1 | 0.3241 | 0.3296 | 0.3034 | 0.3630 | 0.4518 |
| I × Aw × Sw | 5 | 0.3074 | 0.0554 | 0.3393 | 0.4178 | 0.7897 |
| Residual Error | 429 | - | - | - | - | - |
| Total | 491 | - | - | - | - | - |
Table 9.
Mixed model ANOVA results (α = 0.05) for spruce, testing differences in mean height HT (m), DBH (cm), Slenderness, crown width (CW) (m), and height to live crown base (HTLC) (m) by treatment at year 20. Significant (p < 0.05) terms are indicated in bold.
Table 9.
Mixed model ANOVA results (α = 0.05) for spruce, testing differences in mean height HT (m), DBH (cm), Slenderness, crown width (CW) (m), and height to live crown base (HTLC) (m) by treatment at year 20. Significant (p < 0.05) terms are indicated in bold.
| Source | df | HT | DBH | Slenderness | CW | HTLC |
|---|
| | | p-Value | p-Value | p-Value | p-Value | p-Value |
|---|
| Agency (A) | 10 | - | - | - | - | - |
| Installation (I) | 1 | 0.7536 | 0.4082 | 0.6940 | 0.9849 | 0.3533 |
| Aspen Treatment Density (Aw) | 5 | <0.0001 | <0.0001 | <0.0001 | <0.0001 | <0.0001 |
| Spruce Planting Density (Sw) | 1 | 0.5258 | 0.0019 | 0.9190 | 0.0001 | 0.1422 |
| A × I | 9 | - | - | - | - | - |
| Replicate (A × I) | 19 | - | - | - | - | - |
| Aw × Sw | 5 | 0.5492 | 0.2767 | 0.0448 | 0.1009 | 0.0932 |
| I × Aw | 5 | 0.0396 | 0.5296 | 0.0196 | 0.0475 | 0.8642 |
| I × Sw | 1 | 0.2304 | 0.4760 | 0.1300 | 0.7081 | 0.0775 |
| I × Aw × Sw | 5 | 0.7703 | 0.5308 | 0.4156 | 0.9048 | 0.4306 |
| Residual Error | 418 | - | - | - | - | - |
| Total | 479 | - | - | - | - | - |
Table 10.
Mixed model ANOVA results (α = 0.05) for top spruce, testing differences in mean height (HT) (m), DBH (cm), Slenderness, crown width (CW) (m) and height to live crown base (HTLC) (m) by treatment at year 28. Significant (p < 0.05) terms are indicated in bold.
Table 10.
Mixed model ANOVA results (α = 0.05) for top spruce, testing differences in mean height (HT) (m), DBH (cm), Slenderness, crown width (CW) (m) and height to live crown base (HTLC) (m) by treatment at year 28. Significant (p < 0.05) terms are indicated in bold.
| Source | df | HT | DBH | Slenderness | CW | HTLC |
|---|
| | | p-Value | p-Value | p-Value | p-Value | p-Value |
|---|
| Agency (A) | 6 | - | - | - | - | - |
| Installation (I) | 1 | 0.0839 | 0.8733 | 0.6394 | 0.9675 | 0.5502 |
| Aspen Treatment Density (Aw) | 5 | <0.0001 | <0.0001 | <0.0001 | <0.0001 | 0.2009 |
| Spruce Planting Density (Sw) | 1 | 0.6546 | 0.0057 | 0.9711 | 0.0056 | <0.0001 |
| A × I | 4 | - | - | - | - | - |
| Replicate (A × I) | 10 | - | - | - | - | - |
| Aw × Sw | 5 | 0.1834 | 0.0415 | 0.6557 | 0.0300 | 0.0117 |
| I × Aw | 5 | 0.1018 | 0.3381 | 0.4640 | 0.0326 | 0.1337 |
| I × Sw | 1 | 0.5789 | 0.7092 | 0.2405 | 0.9036 | 0.9675 |
| I × Aw × Sw | 5 | 0.8171 | 0.9803 | 0.9884 | 0.9382 | 0.1071 |
| Residual Error | 220 | - | - | - | - | - |
| Total | 263 | - | - | - | - | - |
Table 11.
Summary of treatment means for spruce height (HT), root collar diameter (RCD), DBH, height: diameter ratio (HDR), slenderness (Slend.), crown width (CW), and height to live crown base (HTLC) by treatment at years 10, 20 and. Values within each row within each spruce density (Sw density) with different letters were found to be significantly (α = 0.05) different using Tukey’s test. The bolded values indicate cases where the two spruce densities should be examined separately due either to significant interactions between aspen and spruce densities (age 20 slenderness, age 28 DBH, CW, and HTLC) or significance of both spruce and aspen densities (age 20 DBH and CW, age 28 DBH, CW and HTLC). U represents the unthinned treatment. The standard deviation is indicated in parentheses.
| | | Sw Density = 500 | Sw Density = 1000 | Sw Density = Both |
|---|
| | | Aspen Density (stems·ha−1) | Aspen Density (stems·ha−1) | Aspen Density (stems·ha−1) |
|---|
| Var | Age | 0 | 200 | 500 | 1500 | 4000 | U | 0 | 200 | 500 | 1500 | 4000 | U | 0 | 200 | 500 | 1500 | 4000 | U |
|---|
| HT (m) | 10 | 1.49 ab (0.617) | 1.44 ab (0.550) | 1.49 ab (0.599) | 1.50 ab (0.635) | 1.53 a (0.529) | 1.34 b (0.553) | 1.41 ab (0.564) | 1.46 ab (0.575) | 1.45 ab (0.550) | 1.46 ab (0.532) | 1.48 a (0.531) | 1.37 b (0.549) | 1.45 ab (0.589) | 1.45 ab (0.559) | 1.47 ab (0.572) | 1.49 a (0.582) | 1.51 a (0.527) | 1.36 b (0.548) |
| HT (m) | 20 | 5.28 a (1.751) | 5.18 a (1.569) | 5.11 a (1.470) | 4.93 ab (1.776) | 4.57 b (1.623) | 3.54 c (1.469) | 4.97 ab (1.670) | 5.23 a (1.668) | 5.07 a (1.657) | 4.85 ab (1.593) | 4.51 ab (1.544) | 3.68 c (1.404) | 5.06 a (1.707) | 5.14 a (1.609) | 5.03 a (1.557) | 4.83 ab (1.677) | 4.48 b (1.575) | 3.54 c (1.430) |
| HT (m) | 28 | 8.41 a (2.083) | 7.91 ab (1.792) | 7.94 ab (1.728) | 7.22 bc (1.581) | 6.52 c (1.741) | 4.61 d (1.731) | 7.94 ab (1.687) | 8.27 a (1.491) | 7.83 ab (1.601) | 7.38 b (1.300) | 6.46 c (1.498) | 5.03 d (1.559) | 8.13 a (1.888) | 8.05 a (1.639) | 7.84 a (1.647) | 7.26 b (1.432) | 6.45 c (1.605) | 4.78 d (1.642) |
| RCD (cm) | 10 | 3.08 a (1.259) | 2.92 ab (1.114) | 2.78 abc (1.137) | 2.69 bc (1.153) | 2.45 c (0.902) | 2.04 d (0.827) | 2.93 a (1.146) | 2.92 a (1.078) | 2.81 a (1.092) | 2.73 a (1.023) | 2.46 b (0.987) | 1.99 c (0.771) | 3.04 a (1.199) | 2.95 ab (1.089) | 2.83 ab (1.108) | 2.74 b (1.083) | 2.48 c (0.940) | 2.05 d (0.795) |
| DBH (cm) | 20 | 8.72 a (3.540) | 8.07 ab (3.197) | 7.48 bc (2.978) | 6.75 c (3.000) | 5.60 d (2.572) | 3.83 e (1.662) | 7.76 a (3.070) | 7.76 ab (3.013) | 7.20 b (2.859) | 6.29 c (2.568) | 5.39 d (2.227) | 3.94 e (1.498) | 8.23 a (3.331) | 7.91 ab (3.093) | 7.34 b (2.905) | 6.51 c (2.788) | 5.49 d (2.301) | 3.88 e (1.572) |
| DBH (cm) | 28 | 15.68 a (3.854) | 13.53 ab (3.851) | 12.64 b (3.709) | 10.27 c (3.889) | 8.14 d (3.501) | 5.35 e (1.790) | 13.96 a (2.477) | 13.23 b (2.821) | 11.49 c (2.704) | 10.01 d (2.544) | 7.97 e (2.364) | 6.00 f (1.695) | 14.82 a (3.334) | 13.38 b (3.343) | 12.06 c (3.273) | 10.14 d (2.968) | 8.05 e (2.956) | 5.67 f (1.743) |
| HDR | 10 | 0.46 c (0.093) | 0.46 c (0.078) | 0.50 bc (0.073) | 0.52 b (0.079) | 0.58 a (0.104) | 0.62 a (0.114) | 0.45 e (0.071) | 0.47 de (0.078) | 0.48 d (0.074) | 0.52 c (0.092) | 0.57 b (0.071) | 0.62 a (0.118) | 0.45 e (0.082) | 0.46 de (0.078) | 0.49 d (0.074) | 0.52 c (0.085) | 0.57 b (0.089) | 0.62 a (0.115) |
| Slend. | 20 | 0.66 b (0.119) | 0.72 b (0.179) | 0.74 b (0.143) | 0.81 b (0.162) | 0.90 b (0.162) | 1.32 a (1.117) | 0.73 e (0.165) | 0.75 de (0.132) | 0.80 cd (0.163) | 0.92 bc (0.452) | 0.95 b (0.169) | 1.11 a (0.282) | 0.69 d (0.147) | 0.74 cd (0.157) | 0.77 bcd (0.154) | 0.86 bc (0.343) | 0.92 b (0.165) | 1.22 a (0.818) |
| Slend. | 28 | 0.55 c (0.062) | 0.65 bc (0.280) | 0.65 bc (0.097) | 0.78 ab (0.341) | 0.83 ab (0.144) | 0.97 a (0.315) | 0.58 d (0.049) | 0.65 cd (0.069) | 0.72 bc (0.102) | 0.76 b (0.095) | 0.84 ab (0.117) | 0.92 a (0.170) | 0.56 e (0.057) | 0.65 de (0.202) | 0.68 cd (0.103) | 0.77 bc (0.248) | 0.83 b (0.130) | 0.94 a (0.252) |
| CW | 10 | 0.47 (0.103) | 0.45 (0.094) | 0.47 (0.118) | 0.46 (0.117) | 0.47 (0.097) | 0.42 (0.114) | 0.45 (0.103) | 0.45 (0.106) | 0.44 (0.099) | 0.45 (0.109) | 0.45 (0.090) | 0.43 (0.098) | 0.46 (0.103) | 0.45 (0.099) | 0.46 (0.109) | 0.45 (0.112) | 0.46 (0.093) | 0.43 (0.105) |
| CW | 20 | 1.21 a (0.297) | 1.18 a (0.319) | 1.14 ab (0.279) | 1.12 ab (0.317) | 1.03 b (0.278) | 0.78 c (0.256) | 1.08 a (0.280) | 1.13 a (0.292) | 1.09 a (0.288) | 1.05 ab (0.269) | 0.98 b (0.227) | 0.81 c (0.211) | 1.15 a (0.295) | 1.15 a (0.305) | 1.12 a (0.283) | 1.09 a (0.295) | 1.00 b (0.253) | 0.80 c (0.235) |
| CW | 28 | 1.90 a (0.275) | 1.74 ab (0.320) | 1.64 b (0.248) | 1.53 b (0.323) | 1.28 c (0.307) | 1.02 d (0.315) | 1.67 a (0.247) | 1.66 ab (0.191) | 1.60 b (0.271) | 1.44 c (0.276) | 1.27 d (0.239) | 1.07 e (0.248) | 1.79 a (0.285) | 1.7 ab (0.264) | 1.62 b (0.258) | 1.48 c (0.301) | 1.28 d (0.272) | 1.04 e (0.269) |
| HTLC (m) | 10 | 0.28 (0.128) | 0.27 (0.112) | 0.27 (0.114) | 0.27 (0.131) | 0.28 (0.108) | 0.29 (0.105) | 0.28 (0.115) | 0.30 (0.156) | 0.30 (0.114) | 0.29 (0.108) | 0.31 (0.103) | 0.32 (0.100) | 0.29 (0.121) | 0.30 (0.135) | 0.30 (0.113) | 0.29 (0.119) | 0.31 (0.105) | 0.32 (0.101) |
| HTLC (m) | 20 | 0.53 (0.217) | 0.52 (0.216) | 0.51 (0.199) | 0.53 (0.217) | 0.55 (0.201) | 0.60 (0.229) | 0.49 c (0.202) | 0.52 c (0.221) | 0.56 bc (0.236) | 0.55 bc (0.257) | 0.62 ab (0.264) | 0.66 a (0.214) | 0.51 c (0.209) | 0.52 c (0.217) | 0.54 bc (0.218) | 0.54 bc (0.236) | 0.59 ab (0.235) | 0.63 a (0.221) |
| HTLC (m) | 28 | 0.96 (0.522) | 0.88 (0.332) | 0.91 (0.296) | 0.97 (0.367) | 0.95 (0.307) | 0.89 (0.342) | 1.10 ab (0.435) | 1.23 a (0.419) | 1.13 a (0.409) | 1.03 b (0.324) | 1.00 b (0.379) | 0.99 b (0.376) | 1.03 (0.481) | 1.06 (0.417) | 1.02 (0.372) | 1.00 (0.344) | 0.97 (0.342) | 0.94 (0.360) |
Table 12.
Parameter estimates for non-linear models describing MGM-based volume-age trends for the 15 treatments. The modified non-linear Chapman-Richards model fit using SAS Proc NLIN was: Vol = a × ageb × exp(−a × age + c × SI). SI was defined separately for each species. Parameters were significantly different from 0 (p < 0.01) in all cases except for spruce site index (c) in plot 6. ns indicates a non-significant parameter.
| | | | Spruce | Aspen |
|---|
| PLOT | Aspen Density
(stems·ha−1) | Spruce
Density
(stems·ha−1) | a | b | c | a | b | c |
|---|
| 1 | 0 | 1000 | 0.013406 | 2.103442 | 0.069621 | | | |
| 2 | 200 | 1000 | 0.013013 | 2.055303 | 0.075101 | 0.024172 | 1.692271 | 0.107603 |
| 3 | 500 | 1000 | 0.012498 | 1.988504 | 0.083878 | 0.024681 | 1.925144 | 0.096546 |
| 4 | 1500 | 1000 | 0.011594 | 1.888494 | 0.094996 | 0.025084 | 2.062146 | 0.096351 |
| 5 | 4000 | 1000 | 0.010323 | 1.760039 | 0.113647 | 0.025401 | 2.106533 | 0.097945 |
| 6 | unthinned | 1000 | 0.013565 | 2.226961 | 0.006931 ns | 0.025652 | 2.182628 | 0.081048 |
| 7 | 0 | 500 | 0.011652 | 1.937034 | 0.083284 | | | |
| 8 | 200 | 500 | 0.011242 | 1.909724 | 0.083304 | 0.024831 | 1.744878 | 0.099654 |
| 9 | 500 | 500 | 0.011176 | 1.908504 | 0.077902 | 0.025498 | 1.978808 | 0.08919 |
| 10 | 1500 | 500 | 0.009829 | 1.751954 | 0.100082 | 0.02438 | 1.996066 | 0.108543 |
| 11 | 4000 | 500 | 0.008973 | 1.703911 | 0.098421 | 0.027075 | 2.251298 | 0.07519 |
| 12 | unthinned | 500 | 0.008933 | 1.714591 | 0.090917 | 0.025794 | 2.304432 | 0.059599 |
| 13 | 1500 | 0 | | | | 0.026231 | 2.280332 | 0.06079 |
| 14 | 4000 | 0 | | | | 0.027682 | 2.434509 | 0.043261 |
| 15 | unthinned | 0 | | | | 0.025888 | 2.364609 | 0.053273 |
Table 13.
Effects of aspen and spruce densities on aspen, spruce, stand volume, and MAI at age 90 estimated using MGM21. Values within each row with different letters were found to be significantly (α = 0.05) different using Tukey’s test. The standard deviation is indicated in parentheses.
Table 13.
Effects of aspen and spruce densities on aspen, spruce, stand volume, and MAI at age 90 estimated using MGM21. Values within each row with different letters were found to be significantly (α = 0.05) different using Tukey’s test. The standard deviation is indicated in parentheses.
| Species | Sw Density (stems·ha−1) | Volume (m3 ha−1) | MAI (m3 ha−1 y−1) |
|---|
| Aspen Density (stems·ha−1) | Aspen Density (stems·ha−1) |
|---|
| 0 | 200 | 500 | 1500 | 4000 | U | 0 | 200 | 500 | 1500 | 4000 | U |
|---|
| Spruce | 0 | - | - | - | - | - | - | - | - | - | - | - | - |
| 500 | 132.4 a (59.89) | 117.0 b (52.69) | 103.8 c (47.14) | 79.5 d (45.37) | 60.6 e (38.84) | 54.9 f (36.14) | 1.47 a (0.665) | 1.30 b (0.585) | 1.15 b (0.524) | 0.88 c (0.504) | 0.67 d (0.432) | 0.61 d (0.402) |
| 1000 | 208.8 a (80.20) | 188.2 ab (76.08) | 167.0 b (77.03) | 133.4 c (65.55) | 109.6 cd (70.91) | 103.5 d (75.63) | 2.32 a (0.891) | 2.09 ab (0.845) | 1.86 b (0.856) | 1.48 c (0.728) | 1.22 cd (0.788) | 1.15 d (0.840) |
| All | 170.6 a (80.23) | 152.6 ab (74.33) | 135.4 b (71.05) | 106.5 c (72.03) | 85.1 d (65.00) | 79.2 d (64.48) | 1.90 a (0.891) | 1.70 ab (0.826) | 1.50 b (0.789) | 1.18 c (0.800) | 0.95 d (0.722) | 0.88 d (0.716) |
| Aspen | 0 | - | - | - | 266.0 b (75.74) | 325.1 a (69.01) | 320.5 a (83.51) | - | - | - | 2.96 b (0.842) | 3.61 a (0.023) | 3.56 a (0.928) |
| 500 | - | 72.7 d (40.57) | 145.1 c (65.13) | 242.2 b (95.37) | 303.6 a (86.44) | 285.2 a (111.38) | - | 0.81 d (0.451) | 1.61 c (0.724) | 2.69 b (1.060) | 3.37 a (0.960) | 3.17 a (1.238) |
| 1000 | - | 69.4 d (43.11) | 141.5 c (66.31) | 237.8 b (99.59) | 286.1 a (100.61) | 269.6 ab (115.21) | - | 0.77 d (0.479) | 1.57 c (0.737) | 2.64 b (1.107) | 3.18 a (1.118) | 3.00 ab (1.280) |
| All | - | 70.7 d (41.62) | 142.9 c (65.33) | 249.1 b (91.10) | 305.3 a (87.48) | 290.2 a (106.12) | - | 0.79 d (0.462) | 1.59 c (0.726) | 2.77 b (1.012) | 3.39 a (0.972) | 3.22 a (1.179) |
| Stand | 0 | - | - | - | 266.0 b (75.74) | 325.1 a (69.01) | 320.5 a (83.51) | - | - | - | 2.96 b (0.842) | 3.62 a (0.023) | 3.56 a (0.928) |
| 500 | 132.4 e (59.89) | 189.9 d (58.90) | 249.1 c (62.85) | 321.9 b (83.09) | 364.4 a (67.73) | 340.4 ab (95.28) | 1.49 e (0.665) | 2.11 d (0.654) | 2.77 c (0.698) | 3.58 b (0.923) | 4.05 a (0.752) | 3.78 ab (1.059) |
| 1000 | 208.8.6 d (80.20) | 259.2 c (78.79) | 310.0 b (78.24) | 372.8 a (86.25) | 397.3 a (65.83) | 374.6 a (95.28) | 2.35 d (0.891) | 2.88 c (0.875) | 3.44 b (0.869) | 4.14 a (0.958) | 4.41 a (0.731) | 4.16 a (1.030) |
| All | 170.6 e (80.23) | 224.2 d (77.33) | 279.2 c (76.81) | 320.5 b (91.77) | 362.6 a (72.55) | 344.4 a (92.67) | 1.90 e (0.891) | 2.49 d (0.859) | 3.10 c (0.853) | 3.56 b (1.020) | 4.03 a (0.806) | 3.83 a (1.030) |
Table 14.
Effects of aspen and spruce densities on aspen and spruce stemwood biomass and stemwood carbon at age 90 estimated using MGM21 (note that values represent total aboveground stemwood biomass and do not include bark). Calculation of carbon from biomass was based on a conversion from biomass to carbon using values of 0.4709 and 0.5039 for trembling aspen and white spruce, respectively, from Lamlon and Savidge [
44]. Values within each row with different letters were found to be significantly (α = 0.05) different using Tukey’s test. The standard deviation is indicated in parentheses.
| Species | Sw Density (stems·ha−1) | Stemwood Biomass (tonnes.ha−1) | Stemwood Carbon (tonnes.ha−1) |
|---|
| Aspen Density (stems·ha−1) | Aspen Density (stems·ha−1) |
|---|
| 0 | 200 | 500 | 1500 | 4000 | U | 0 | 200 | 500 | 1500 | 4000 | U |
|---|
| Spruce | 0 | - | - | - | - | - | - | - | - | - | - | - | - |
| | 500 | 40.5 a (17.11) | 36.0 bc (14.95) | 32.1 c (13.77) | 24.5 d (13.17) | 18.6 e (11.42) | 16.9 e (10.46) | 20.4 a (8.62) | 18.1 bc (7.53) | 16.2 c (6.94) | 12.3 d (6.64) | 9.4 e
(5.76) | 8.5 e
(5.27) |
| | 1000 | 63.6 a (22.20) | 57.5 ab (21.11) | 51.1 b (21.64) | 40.9 c (18.45) | 33.5 cd (20.54) | 32.2 d (26.07) | 32.0 an (11.18) | 29.0 ab (10.64) | 25.8 b (10.90) | 20.6 c (9.30) | 16.9 cd (10.35) | 16.2 d (13.14) |
| Aspen | 0 | - | - | - | 100.6 b (28.78) | 122.1 a (26.67) | 118.0 a (31.41) | - | - | - | 47.4 b (13.55) | 57.5 a (12.56) | 55.6 a (14.79) |
| | 500 | - | 30.1 d (16.58) | 57.3 c (25.72) | 91.9 b (36.06) | 114.1 a (33.64) | 103.9 ab (41.22) | - | 14.2 d (7.81) | 27.0 c (12.11) | 43.3 b (16.98) | 53.7 a (15.84) | 48.9 ab (19.41) |
| | 1000 | - | 28.6 d (17.78) | 56.0 c (25.94) | 90.1 b (37.92) | 106.3 a (36.94) | 98.7 ab (41.22) | | 13.5 d (8.37) | 26.4 c (12.22) | 42.4 b (17.86) | 50.1 a (17.39) | 46.5 ab (19.91) |
| Stand Total | 0 | - | - | - | 100.6 b (28.78) | 122.1 a (26.67) | 118.0 a (31.41) | - | - | - | 47.4 b (13.55) | 57.5 a (12.56) | 55.6 a (14.79) |
| | 500 | 40.5 e (17.11) | 66.2 d (19.54) | 89.5 c (23.21) | 116.4 b (31.53) | 132.8 a (27.79) | 120.8 ab (35.85) | 20.4 e (8.62) | 32.4 d (9.49) | 43.2 c (10.98) | 55.6 b (14.79) | 63.2 a (12.96) | 57.5 b (16.75) |
| | 1000 | 63.6 d (22.20) | 86.6 c (24.19) | 107.6 b (25.68) | 131.5 a (32.42) | 140.4 a (25.49) | 131.4 a (35.53) | 32.0 d (11.18) | 42.7 c (11.89) | 52.4 b (12.40) | 63.3 a (12.52) | 67.2 a (11.83) | 63.0 a (16.82) |


