Article

Early Dynamics of Carbon Accumulation as Influenced by Spacing of a Populus deltoides Planting

by
Emile S. Gardiner
1,*,
Krishna P. Poudel
2,
Theodor D. Leininger
1,
Ray A. Souter
1,†,
Randall J. Rousseau
2,† and
Bini Dahal
2,3
1
Center for Bottomland Hardwoods Research, Southern Research Station, USDA Forest Service, Stoneville, MS 38776, USA
2
Department of Forestry, Mississippi State University, Starkville, MS 39762, USA
3
College of Natural Resources, North Carolina State University, Raleigh, NC 27695, USA
*
Author to whom correspondence should be addressed.
Retired.
Forests 2024, 15(2), 226; https://doi.org/10.3390/f15020226
Submission received: 13 December 2023 / Revised: 17 January 2024 / Accepted: 20 January 2024 / Published: 24 January 2024

Abstract

:
The fast-growing tree, eastern cottonwood (Populus deltoides), currently is being planted to catalyze native forest restoration on degraded agricultural sites in the southeastern United States. Many of these restoration sites are appropriate for short rotation woody crop (SRWC) culture that addresses climate mitigation objectives, but information needed to optimize climate mitigation objectives through such plantings is limited. Therefore, we established a 10-year experiment on degraded agricultural land located in the Mississippi Alluvial Valley, USA, aiming to quantify the dynamics of aboveground carbon (AGC) accumulation in a cottonwood planting of four replicated spacing levels (3.7 × 3.7 m, 2.7 × 1.8 m, 2.1 × 0.8 m, and (0.8 + 1.8) × 0.8 m) aligned with SRWC systems targeting various ecosystem services. Annual sampling revealed a substantial range in increments of AGC and year 10 carbon stocks among stands of different densities. Mean annual increments for AGC (MAIAGC) were similar for the two tightest spacing levels, peaking higher than for the other two spacings at about 7.5 Mg ha−1 y−1 in year 7. Year 10 AGC ranged between 22.3 Mg ha−1 for stands spaced 3.7 × 3.7 m and 70.1 Mg ha−1 for stands of the two tightest spacings, leading us to conclude that a spacing between 2.1 × 0.8 m and 2.7 × 1.8 m would maximize aboveground carbon stocks through year 10 on sites of similar agricultural degradation. Increments and accumulation of AGC on the degraded site trended lower than values reported from more productive sites but illustrate that quick and substantial transformation of the carbon stock status of degraded agricultural sites can be achieved with the application of SRWCs to restore forests for climate mitigation and other compatible ecosystem services.

1. Introduction

The current realities of climate change have stimulated a global demand for practical solutions, applicable in working landscapes, that contribute to a reduction in atmospheric CO2. Pragmatists understand that this issue requires an approach inclusive of a broad suite of alternative energy sources and strategies effective in drawing CO2 from the atmosphere. The strategy of enhancing carbon uptake and storage in forests persists as being fundamental to the global climate mitigation effort [1,2], and this strategy encompasses the afforestation of deforested land, which holds high potential to restore a significant fraction of these functions [1,3,4]. Recent projections by Walker et al. [1] suggest that an area of about 0.9 billion ha appropriate for forest restoration accounts for almost 19% of the unrealized carbon storage potential of land globally. This accompanies a growing body of literature that validates that sustainably established plantations reinitiate the forest carbon cycle and in doing so expand carbon sinks and regenerate plant and soil carbon stocks at the afforestation site [5,6,7,8].
Short rotation woody crop (SRWC) culture, a type of plantation forestry, offers options for targeting various climate mitigation objectives in agricultural and peri-urban landscapes [9,10,11]. The utility of SRWC culture for biomass feedstock production has been demonstrated, for example, with shrub willow (Salix spp.) systems in Sweden and the USA, poplar (Populus spp.) systems in Italy and India, and eucalypt (Eucalyptus spp.) systems in Australia [12,13,14,15,16]. Their role in producing fossil fuel alternatives to support climate mitigation has been recognized by the Intergovernmental Panel on Climate Change and the International Energy Agency, and through prominent national and international assessments [17,18,19]. However, significant development of SRWC systems as part of the climate mitigation effort remains stalled for various reasons, many of which challenge their economic feasibility [11,16,20,21,22]. As researchers continue to develop plant material and SRWC systems to improve efficiencies for economically and ecologically sustainable bioenergy feedstock production, we are also learning more about how these systems regulate other important ecosystem services such as the buffering of environmental disturbance, soil and water quality maintenance, and carbon sequestration functions [9,12,15]. Few bioenergy alternatives offer a diversity of ecosystem services comparable to that of SRWCs and several researchers have emphasized that a valuation of these co-benefits will be key to their broader application for climate mitigation [11,23,24].
Carbon sequestration is perhaps the only ecosystem service, other than biomass feedstock production, currently marketed from forests or tree crops for climate mitigation purposes. The expansions of compliance and voluntary carbon markets are beginning to create opportunities for landowners to generate an income stream from climate mitigation, especially where agricultural land is prioritized for forest restoration [25]. The agricultural landscape of the Mississippi Alluvial Valley in the southern USA, for example, holds a significant land base with an ownership eager to transition economically marginal agricultural land to a more ecologically sustainable land use [26]. This transition is hampered by acreage caps and limited funding in federal conservation programs that are the primary means by which owners remove land from intensive agriculture [27]. The carbon market has undoubtedly catalyzed forest restoration in this region [28] and it could further incentivize restoration of terrestrial carbon pools through coupling with SRWC culture [11,24]. But our knowledge of SRWC systems and their capacity for carbon sequestration in this region lacks depth and is insufficient for supporting this emerging aspect of the bioeconomy.
Eastern cottonwood (Populus deltoides), a fast-growing tree endemic to much of the mid-western and southern US, has been domesticated through tree improvement programs and raised in plantation culture for over 70 years. The silvical characteristics and domestication of this broadleaf species have promoted its study by geneticists and biologists at the forefront of advancements to improve anatomical, morphological, and physiological traits that confer a wide range of efficiencies in tree growth and enhance yields at biorefineries [29,30,31]. While this species and its hybrids are primarily raised throughout the temperate zone for fiber and wood industries, plantings over the last two decades have also been established for broader utility in achieving various ecosystem services and environmental technologies [9,32]. These successes indicate that deliberate use of eastern cottonwood SRWC systems in agricultural landscapes offers a means for achieving a carbon sequestration objective simultaneous to biomass feedstock production, establishment of buffers or stands of perennial cover that protect soil and water, improvement of wildlife habitats, enhancement of recreational values, or other environmental or ecological objectives [9,32].
We understand from research conducted on various SRWC systems that optimizing system functions or production of multiple ecosystem services at a given site balances on decisions concerning species or cultivar, planting design, cultivation and silvicultural practices, and cutting cycle. Work on poplar SRWC systems in the temperate zone illustrates that planting arrangement and spacing hold a prevailing influence over tree growth and stand development [33,34]. This ultimately translates to affect variables that inform decisions relevant to bioenergy feedstock production such as feedstock dimension, feedstock quality, total biomass yield, and optimal rotation length [35,36,37,38]; additional variables that inform decisions relevant to a carbon stock objectives including tree allometry, stand-level carbon accumulation increment, and soil carbon status [39,40,41].
A lack of tree growth and stand development information, particularly for degraded agricultural sites, limits our ability to reliably project outcomes for the management of SRWC systems to regulate carbon uptake and storage in forest restoration settings. The objective of this work was to quantify and evaluate the dynamics of aboveground carbon (AGC) accumulation and stocks in plantings of eastern cottonwood relative to stand densities appropriate for various SRWC systems. We meet this objective by analyzing carbon accumulation at the individual tree and stand levels for years 1 through 10 in an operationally scaled experimental planting established at four spacings on a site too wet to sustain agricultural production. Results from this work provide a better understanding of how a basic plantation establishment decision, i.e., spacing, influences the aboveground component of carbon accumulation dynamics and carbon storage capacity by eastern cottonwood SRWC systems on marginal agricultural soils.

2. Materials and Methods

2.1. Study Site, Plant Material, and Establishment

This work was conducted as part of a larger study on eastern cottonwood and black willow (Salix nigra) SRWC management for bioenergy feedstock production on agricultural land slated for forest restoration—additional background information is provided by Dahal et al. [42]. The experiment was established in Washington County, MS, USA (33°8′ N, 90°55′ W), on a 120 ha site typical of marginal agricultural land in the Mississippi Alluvial Valley. Soils at the site are alluvial in origin and mapped to the very poorly drained, occasionally flooded Dowling series (very-fine, smectitic, nonacid, thermic Vertic Endoaquepts) and the poorly drained, rarely flooded Sharkey series (very-fine, smectitic, thermic Chromic Epiaquerts) [43]. The temperate climate is humid, sub-tropical with air temperature in January averaging 6.8 °C, air temperature in July averaging 27.8 °C, and annual precipitation averaging 1272 mm [44]. Site index for eastern cottonwood averages about 28 m at base age 30 on undisturbed forest sites [45].
Land use of the site prior to study installation was agriculture and it was last cultivated for rice (Oryza sativa) in 2010. Site preparation for plantation establishment, initiated in June 2011, began with removal of the levees used to paddy the site for rice production and that was followed by soil discing. The site was subsoil plowed to 46 cm deep in September 2011 and received a broadcasted herbicide solution (oxyfluorfen, rate = 2.3 L ha−1, water volume = 187 L ha−1) for preemergent vegetation control in late January 2012.
Two improved eastern cottonwood clones (S7C8 and S7C15) were selected for planting based on the suitability of their silvical characteristics to the site. In February 2012, 46-cm long, unrooted cuttings of the clones were treated to minimize early-season cottonwood leaf beetle (Chrysomela scripta) damage by soaking in a systemic insecticide solution (imidacloprid, 1.09 mL L−1 water) for 24 h [46]. After soaking, cuttings were mixed to equal proportions of clones, then hand-planted to about 36 cm deep (≈10 cm of the cutting remained aboveground) in furrows created by the previous subsoil plowing. The plantation received post-planting applications of insecticides (bifenthrin and carbaryl) for cottonwood leaf beetle control in August 2012 and July 2013. Post-planting vegetation control included hoeing around planting spots in March 2013, and directed and broadcast applications of an herbicide (clopyralid, rate = 0.38 L ha−1, water volume = 187 L ha−1) from 2012 through 2015.

2.2. Experimental Design and Measurements

The experiment was established according to a randomized complete block design with 3 blocks of 4 plots. Delineation and positioning of the blocks minimized variation in soil series and site topography within a block. Each block contained 4, 1 ha plots randomly assigned 1 of 4 planting spacings that included 3.7 × 3.7 m, 2.7 × 1.8 m, 2.1 × 0.8 m, and (0.8 + 1.8) × 0.8 m (Figure 1). Because the subsoil plow shanks were arranged at designated row spacings, between-row spacing was consistent with the assigned level, but within-row spacing showed operational variability common to hand planting.
Measurements of tree survival, number of stems, height, and diameter at breast height (DBH) were collected annually (ages 1 through 10) in 10 subplots permanently established in each plot. The subplots were fixed-length (20 m) row segments located randomly within plots [47]. The number of planting spots in a subplot varied with assigned spacing such that there were about 5.6 planting spots in subplots established in plots spaced 3.7 × 3.7 m, about 11 planting spots in subplots established in plots spaced 2.7 × 1.8 m, about 26.5 planting spots in subplots established in plots spaced 2.1 × 0.8 m, and about 52.5 planting spots in subplots established in plots spaced (0.8 + 1.8) × 0.8 m. Measurements were collected in English units (ft and in) and converted to metric units (m and cm) for analysis and modeling.

2.3. Data Analysis and Modeling

Individual tree aboveground biomass (AGBI) (kg) was estimated for all trees in a subplot by running annual measurements of height, DBH, and number of stems through models developed by Dahal et al. [42] who conducted their work at the current study site. These models were slightly modified such that no data augmentation was performed; i.e., only trees that had measured dry weights were used to refit the Dahal et al. [42] models in the current analysis. We estimated biomass of individuals too small to have a DBH with the model:
ln(AGBI) = −3.20530 + 2.71330 ln(height) + 0.10447 ln(number of stems);
the correction factor 1.17 was multiplied to these data to correct for bias introduced by log transformation [42]. AGBI of trees having a DBH was estimated with the model:
ln(AGBI) = −1.07227 + 1.24323 ln(DBH) + 0.59751 ln(height) + 0.15653 ln(number of stems);
the log transformation bias correction factor multiplied to these data was 1.09. All corrected AGBI data were multiplied by 0.5 for conversion to individual tree aboveground carbon mass (AGCI). Stand-level AGC (AGCS) (Mg ha−1) was calculated by summing AGCI for all surviving trees in a subplot and multiplying the sum by an expansion factor for subplot size. We used AGCS to calculate current annual increment (CAIAGC) (Mg ha−1 yr−1) and mean annual increment (MAIAGC) (Mg ha−1 yr−1) of stand carbon by spacing following the formulae:
CAIAGC = AGCS(age i) − AGCS(age i − 1)
and
MAIAGC = AGCS(age i) ÷ agei.
Data were analyzed according to a randomized complete block design with the MIXED procedure in SAS software version 9.4 [48]. The analysis was structured to use plot means in testing for spacing, age, and interaction effects on response variables. We used the PLM procedure and LS-means statement with the Adjust = Tukey option to separate means of variables showing a significant source effect. Significance for all tests was defined at an alpha level of 0.05.

3. Results

Eastern cottonwood growth and stand structure showed a marked response to plantation spacing. Survival through year 10 averaged about 72% across the study and was not influenced by spacing (p = 0.2573) (Table 1). Trees spaced 3.7 × 3.7 m grew 54% taller than those spaced (0.8 + 1.8) × 0.8 m (p = 0.0148). DBH was greatest where the planting was spaced 3.7 × 3.7 m, averaging about 2.5 cm more than where the planting was spaced 2.7 × 1.8 m and about 5.6 cm more than where spaced 2.1 × 0.8 m or (0.8 + 1.8) × 0.8 m (p < 0.0001). Stand basal area increased as plantation spacing decreased, ranging more than 115% from the widest spacing level to the two tightest levels (p = 0.0004) (Table 1). Trees accumulated about 43% more AGB where the planting was spaced 3.7 × 3.7 m than where spaced 2.7 × 1.8 m, and about 78% more where spaced 2.7 × 1.8 m versus the two tightest levels (p = 0.0004). Stands with an initial spacing of 2.1 × 0.8 m or (0.8 + 1.8) × 0.8 m produced 67% more AGB than stands spaced 2.7 × 1.8 m and 214% more AGB than stands spaced 3.7 × 3.7 m (p < 0.0001) (Table 1).
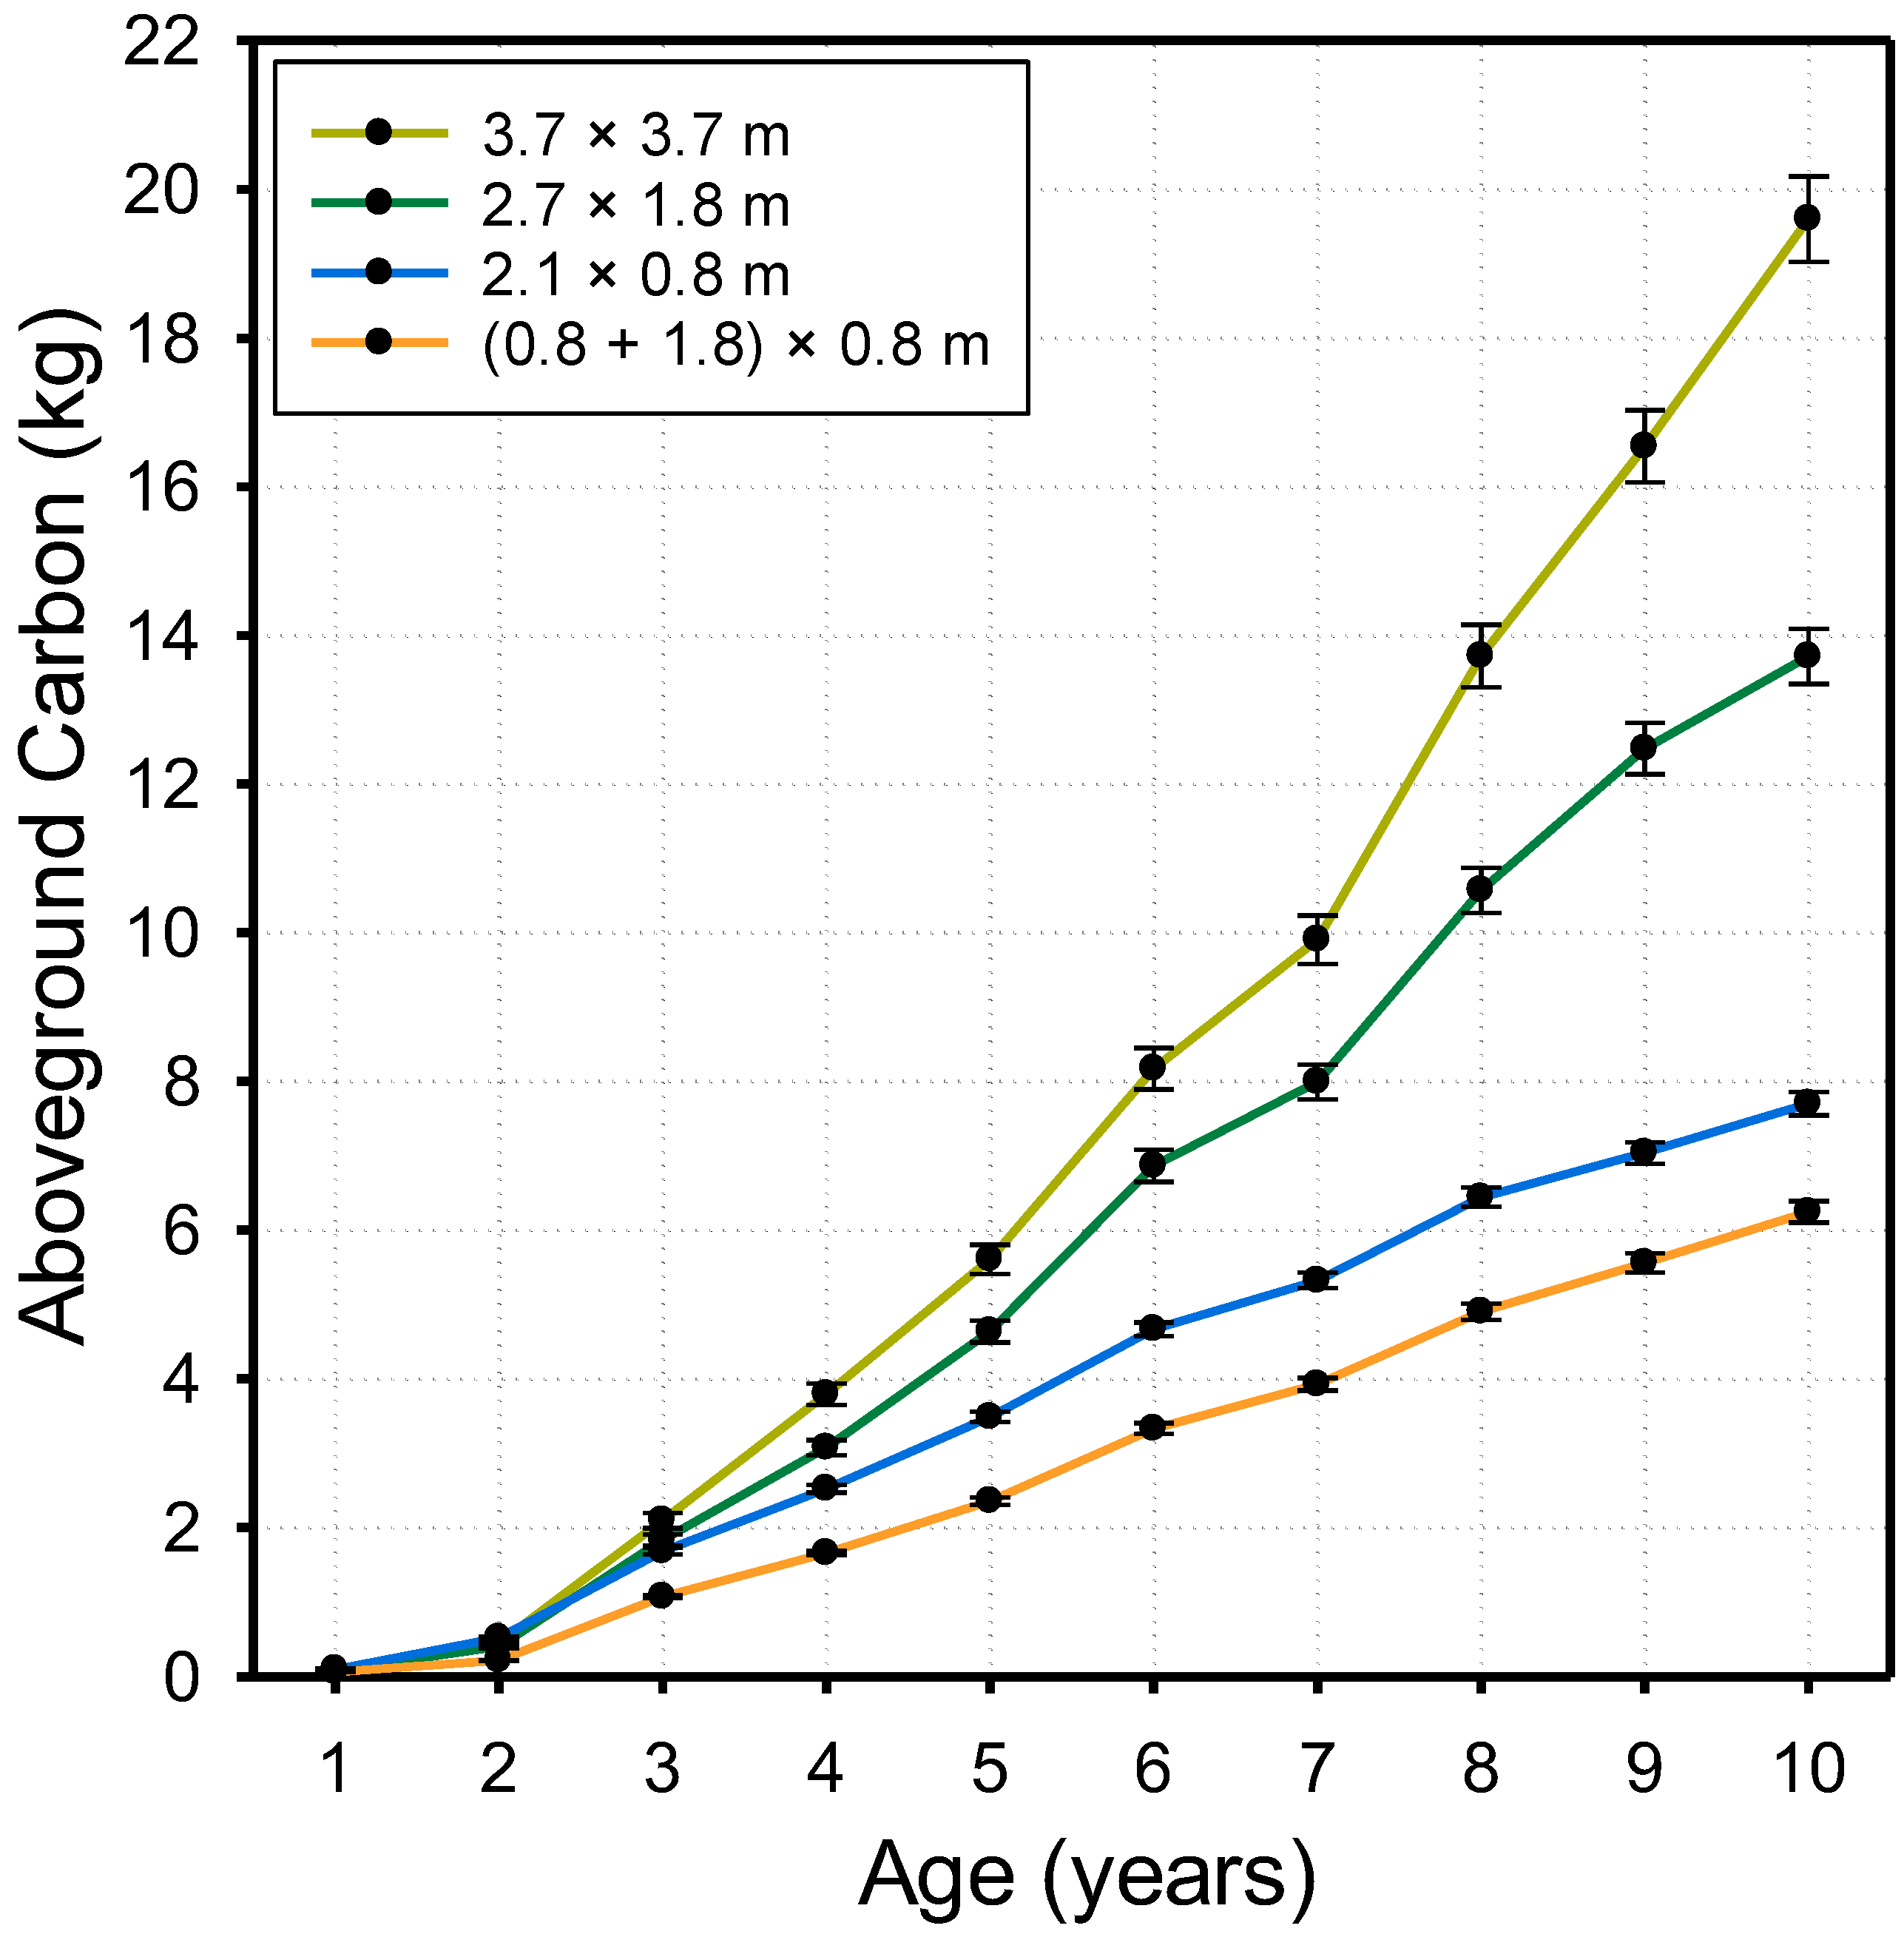
Accumulation of AGCI was similar for all spacing levels through the first 4 years after planting (Figure 2). By year 5, AGCI for eastern cottonwood established at (0.8 + 1.8) × 0.8 m averaged 49 and 58% less than that of trees established at 2.7 × 1.8 m and 3.7 × 3.7 m spacings, respectively (p = 0.0356). Separation in accumulation of AGCI between the two tightest and two widest spacing levels was observed 7 years after establishment with AGCI ranging 60% from trees spaced (0.8 + 1.8) × 0.8 m to those spaced 3.7 × 3.7 m (p = 0.0002). AGCI in 3.7 × 3.7 m plantings began outpacing AGCI in 2.7 × 1.8 m plantings in year 8 (p < 0.0001). Through year 10, the steepest accumulation of AGCI occurred where trees were spaced 3.7 × 3.7 m (Figure 2). Relative to this spacing level, AGCI accumulation was limited to 30% where trees were spaced 2.7 × 1.8 m, 61% where spaced 2.1 × 0.8 m, and 68% where spaced (0.8 + 1.8) × 0.8 m (p < 0.0001).
CAIAGC for stands of all spacing levels showed the steepest increase between years 1 and 4 or 5 after establishment (Figure 3). We observed a maximum CAIAGC of about 10 Mg ha−1 y−1 in year 5 for stands spaced 2.1 × 0.8 m or (0.8 + 1.8) × 0.8 m. Compared to this rate, year 5 CAIAGC was about 45% lower where stand spacing was 2.7 × 1.8 m and about 76% lower where spacing was 3.7 × 3.7 m. A maximum CAIAGC near 6 Mg ha−1 y−1 in year 8 was observed for stands established on the 2.7 × 1.8 m spacing level, and an apparent maximum CAIAGC near 3.5 Mg ha−1 y−1 in year 9 was observed for the 3.7 × 3.7 m spacing level. In year 10, the CAIAGC for stands spaced 2.1 × 0.8 m or (0.8 + 1.8) × 0.8 m remained at least 26% higher than that of the other two spacing levels.
MAIAGC for spacing levels 2.1 × 0.8 m and (0.8 × 1.8) × 0.8 m rose substantially quicker than that of the other spacing levels, peaking near 7.5 Mg ha−1 y−1 in year 7 (Figure 4). Year 7 MAI for stands established on an initial spacing of 2.7 × 1.8 m was half as much as that observed for the tighter spacings—MAIAGC for this spacing apparently crested in year 10 near 4.2 Mg ha−1 y−1. For stands established at 3.7 × 3.7 m, MAIAGC remained 47% below that of the 2.7 × 1.8 m spacing level and did not peak during the study period. The year 10 MAIAGC for stands spaced 2.1 × 0.8 m or (0.8 + 1.8) × 0.8 m stayed at least 39% greater than stands spaced 2.7 × 1.8 m and 68% greater than those spaced 3.7 × 3.7 m.
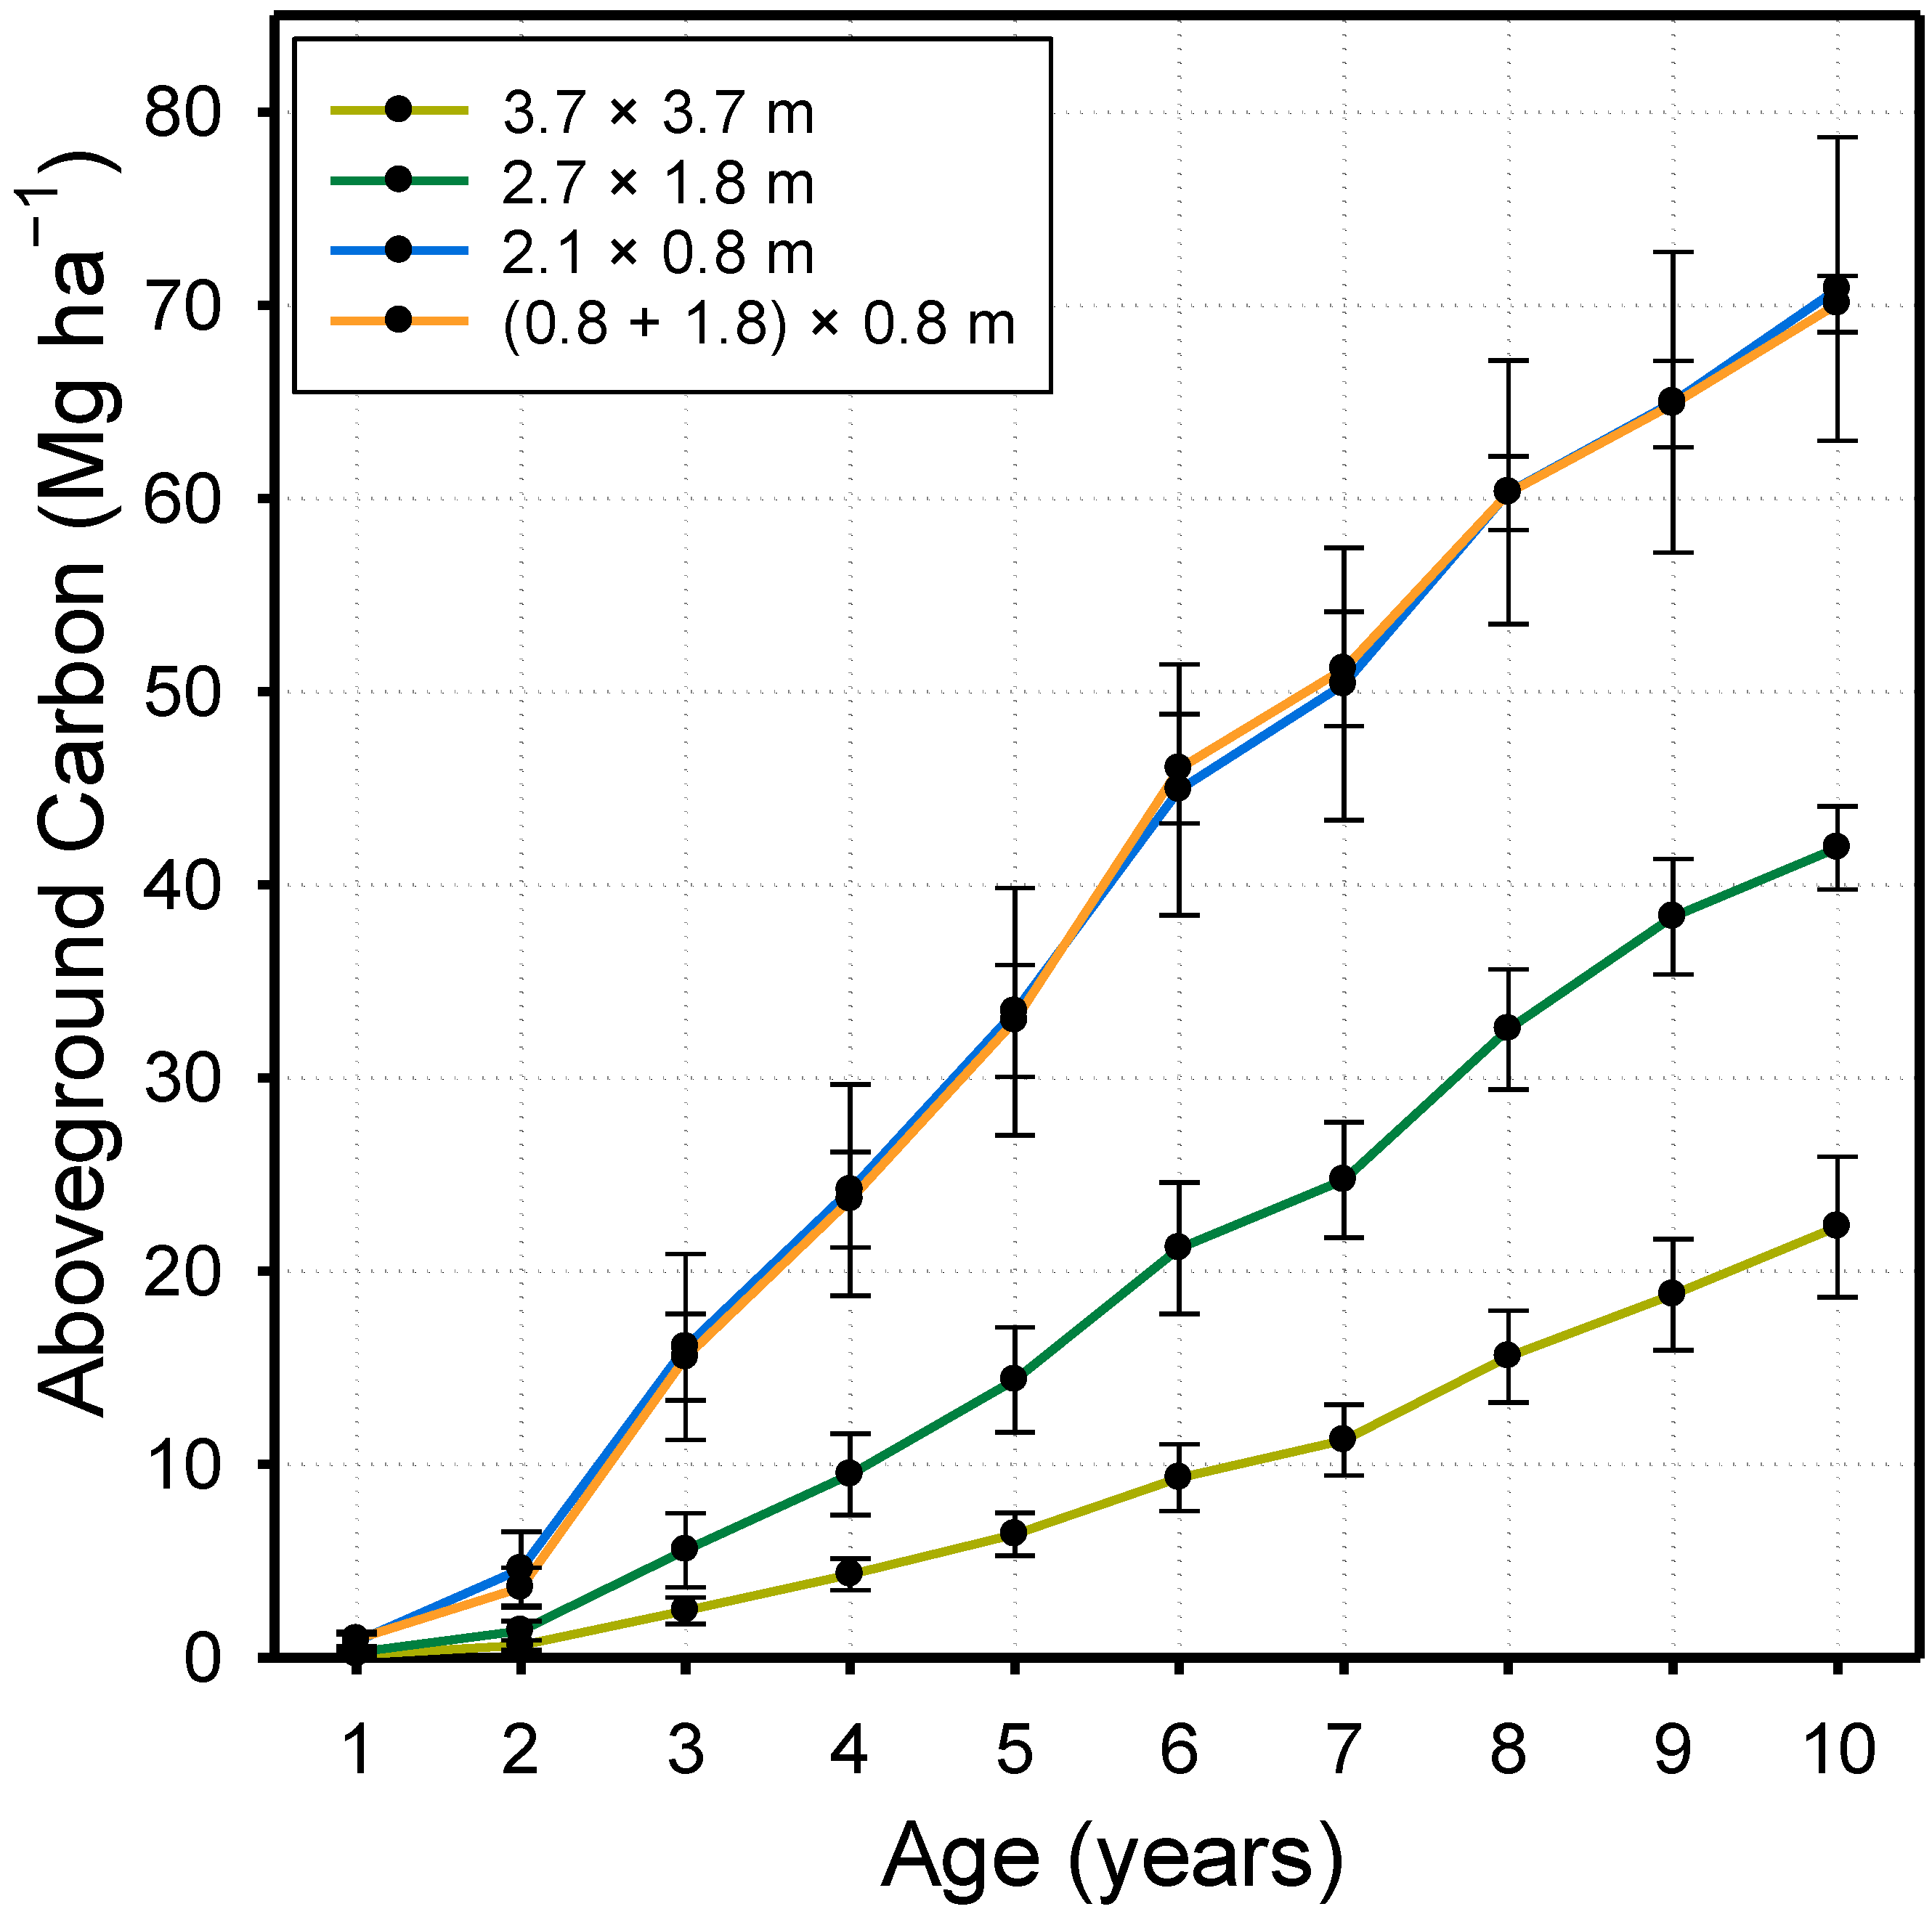
Accumulation of AGC by stands planted at 2.1 × 0.8 m or (0.8 + 1.8) × 0.8 m exceeded that of stands planted at the two wider spacings by at least 180% in year 3 (p = 0.0018) (Figure 5). By year 5, stands established at 2.7 × 1.8 m showed 125% more AGCS than stands spaced at 3.7 × 3.7 m (p < 0.0001). Though variable over time, annual increments of AGCS maintained the early trajectories initiated by spacing such that AGCS accumulation in year 10 was 28.2 Mg ha−1 higher for stands spaced 2.1 × 0.8 m or (0.8 + 1.8) × 0.8 m than for those spaced 2.7 × 1.8 m, and it was 19.6 Mg ha−1 higher for stands spaced 2.7 × 1.8 m than for those spaced 3.7 × 3.7 m (p < 0.0001).
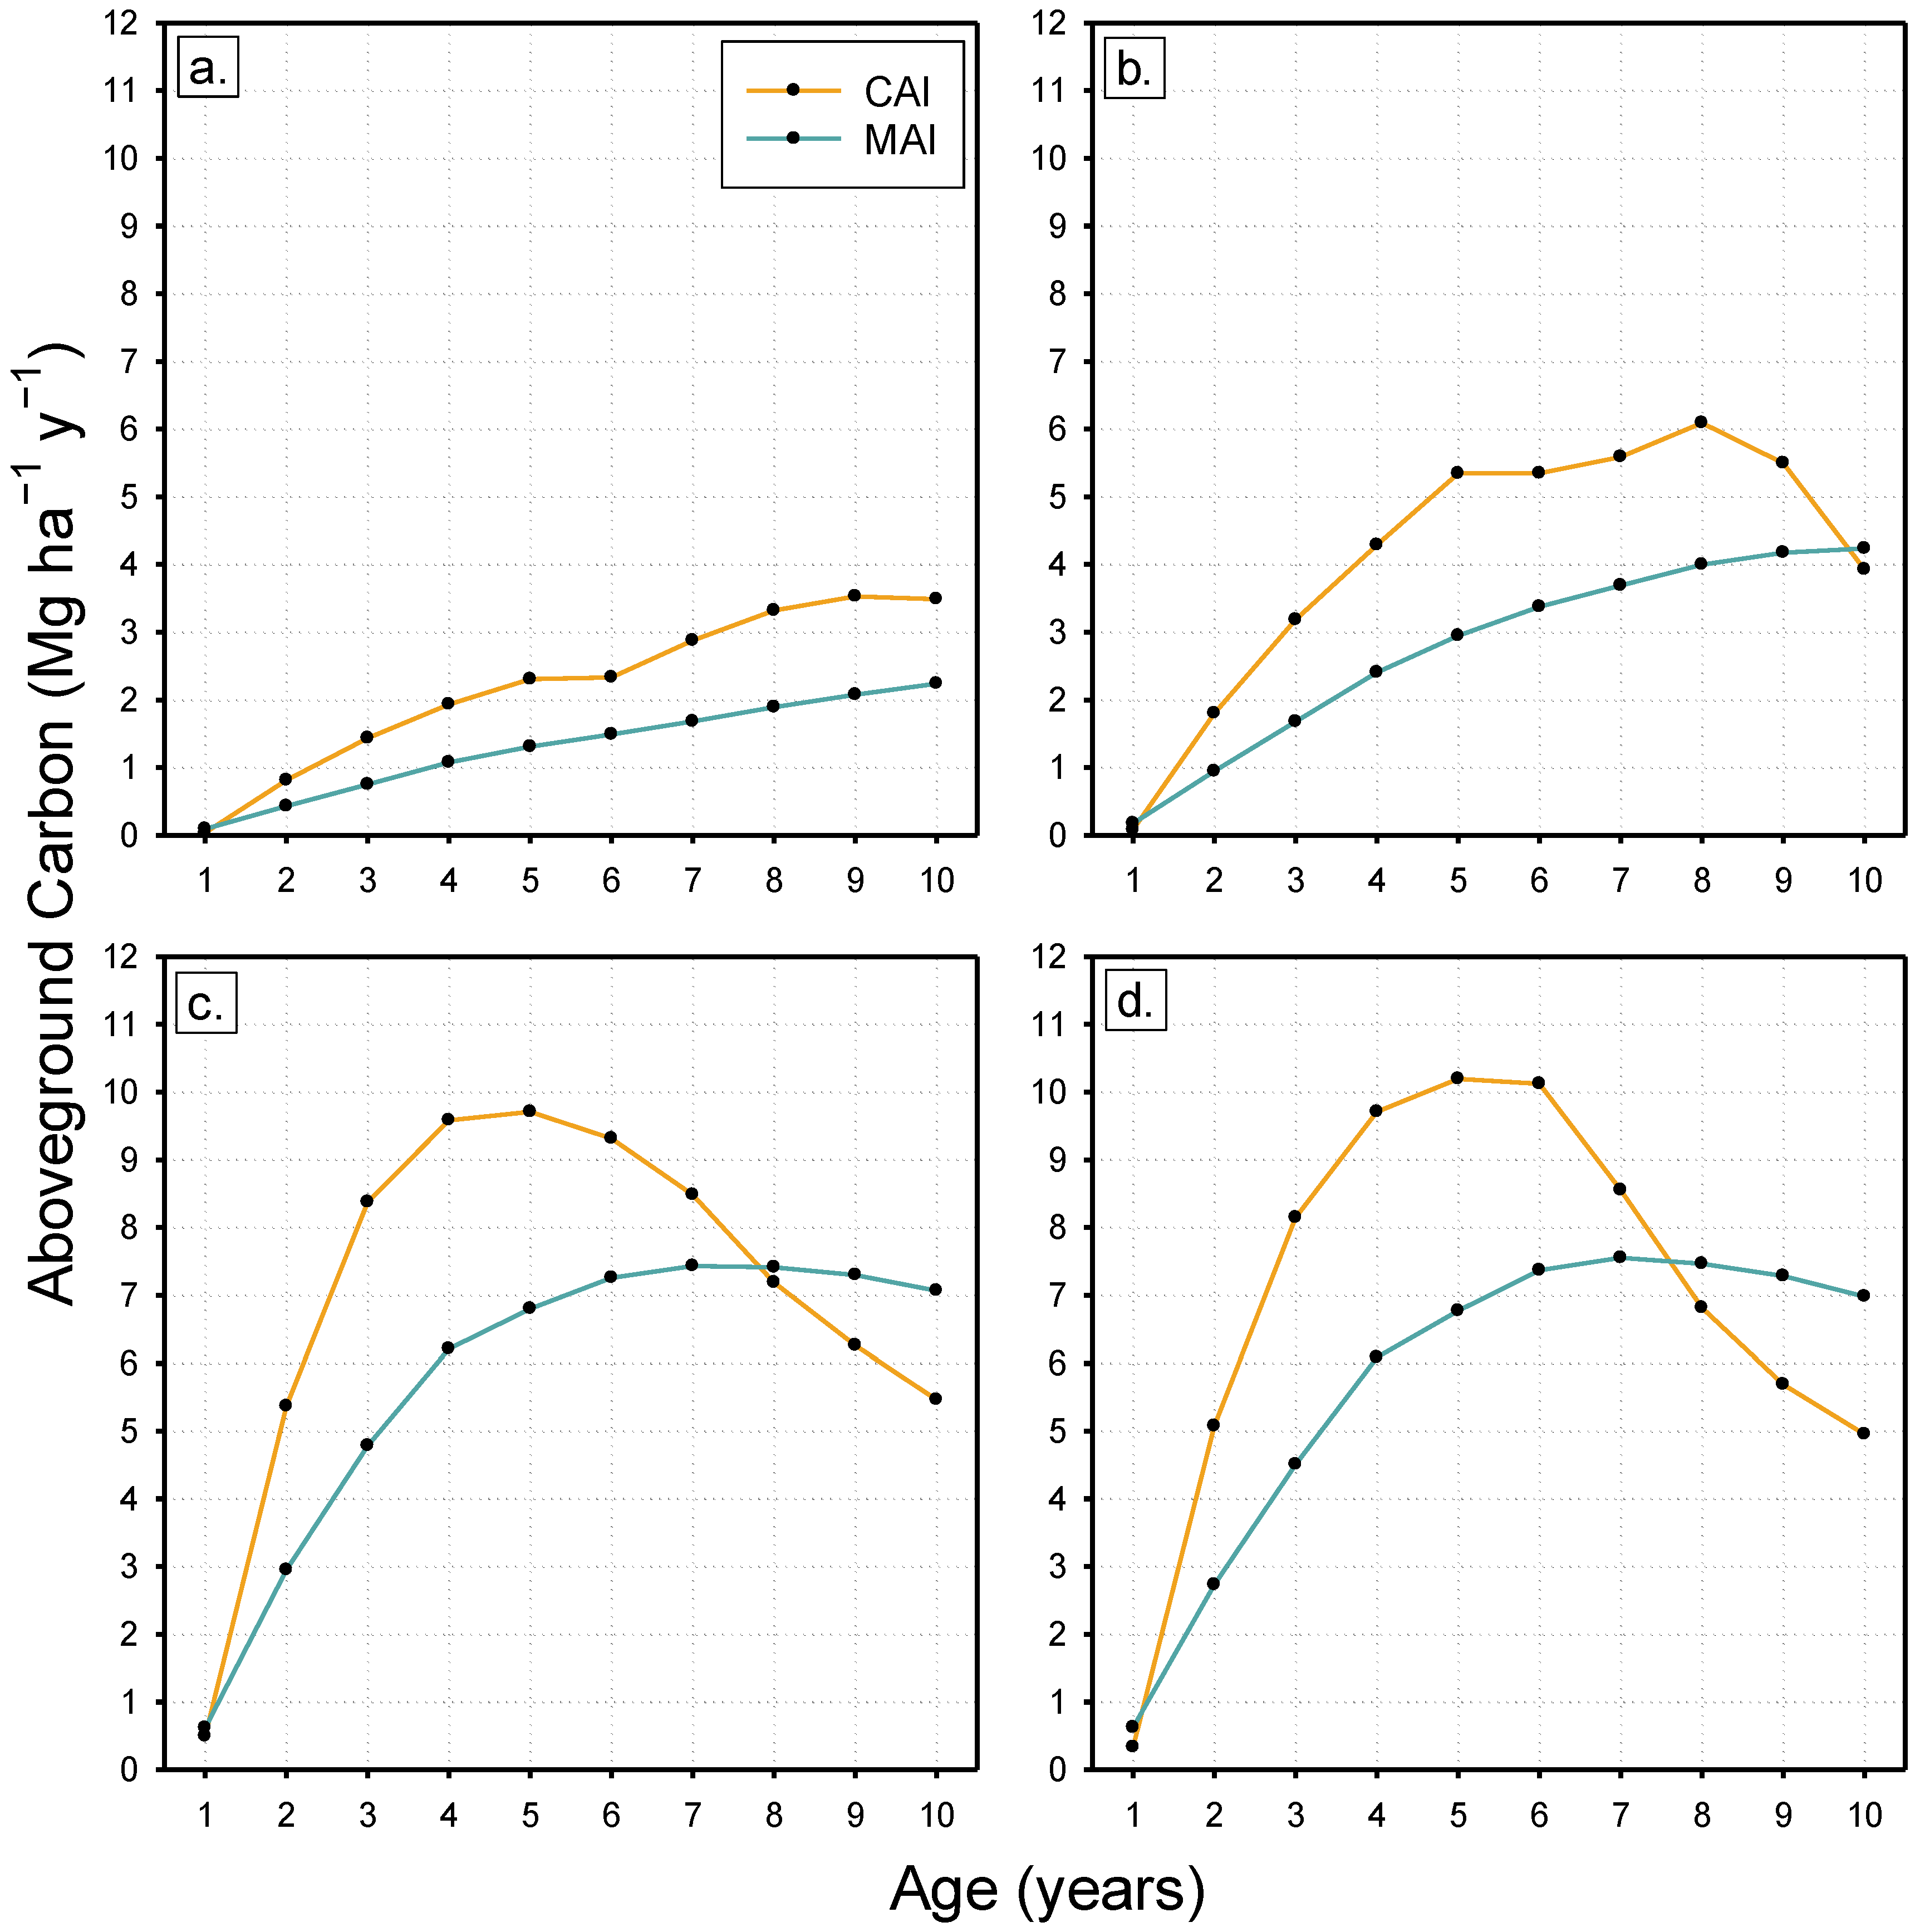
Intersections of CAIAGC and MAIAGC curves marked different biologically optimal rotation lengths relative to spacing in eastern cottonwood plantations (Figure 6). Stands established at the tightest spacing, (0.8 + 1.8) × 0.8 m, showed the shortest biological rotation with the intersection of CAIAGC and MAIAGC curves at about year 7.5. Biological rotation was reached in year 8 for the 2.1 × 0.8 m spacing level and in year 10 for plantings spaced 2.7 × 1.8 m. Stands established at 3.7 × 3.7 m had not reached biological rotation by year 10, though CAIAGC appeared to be leveling. AGCS stocks at biological rotation averaged 55.4 ± 2.4 Mg ha−1 for the (0.8 + 1.8) × 0.8 m spacing level, 60.3 ± 6.8 Mg ha−1 for the 2.1 × 0.8 m level, and 41.9 ± 2.1 Mg ha−1 for the 2.7 × 1.8 m level. The 3.7 × 3.7 m spacing had accumulated 22.3 ± 3.6 Mg ha−1 of AGCS at the end of the 10-year study period.

4. Discussion

Afforestation of land that was deforested for agricultural production offers an effective means for re-building depleted terrestrial carbon stocks, while also restoring a range of other ecosystem functions and services associated with forests [39,49,50,51,52]. Though investment in afforestation is economically dubious, many have argued that fast-growing tree species, such as poplars, can play a central role in this climate mitigation approach because of their silvical characteristics and domestication that facilitate afforestation success, their effectiveness in promoting recovery of important forest ecosystem processes, their demonstrated utility for quickly developing carbon-storing forest structure, and their flexibility in an application for multiple management objectives compatible with carbon accumulation and storage [9,15,24,38,39,52]. In the Mississippi Alluvial Valley of the southeastern United States, for example, indigenous eastern cottonwood currently is being planted to catalyze the restoration of native forests and their functions, especially on sites appropriate for SRWC culture where a climate mitigation objective could be pursued [53].
Eastern cottonwood management for carbon accumulation and storage is presently encumbered by limited knowledge of tree growth and stand development in SRWC systems established on the degraded and relatively low-productivity floodplain sites typically available for afforestation in the southeastern US. Earlier research on cottonwood stand growth and development has primarily been conducted on comparatively high productivity sites in this region—these sites differ from the current study site by having lighter-textured soils of better arability, shorter periods of soil waterlogging for increased access and equipment operation, and relatively less edaphic and hydrologic degradation [54,55,56,57]. Additionally, little research has focused on tight spacings common to some current SRWC systems. Spacings studied in this experiment cover a range considered appropriate for accommodating various SRWC management objectives, complementary to carbon accumulation and storage, that are usually optimized at contrasting stand densities, rotation lengths, and tree size classes at rotation. This research broadens our understanding of the AGC accumulation and stock dynamics exhibited by cottonwood plantings at different spacings on a low productivity site, thereby holding economic and ecological implications important to informing the management of SRWC systems for carbon storage and various other ecosystem services, such as biomass feedstock production, wildlife habitat, and water quality, on afforested, marginal agricultural land.

4.1. Cottonwood Survival and Growth Relative to Spacing on a Degraded, Low Productivity Site

Prior work in plantings of eastern cottonwood and other poplars explored the role of spacing on tree survival and growth in SRWCs [38,40,55,58]. Some studies clearly illustrate increased tree mortality associated with inter-tree competition that intensifies as spacing decreases [55,56,58], though this relationship is not apparent through rotation lengths conventional to SRWCs in other studies [40,41]. Various factors can contribute to mortality in young poplar plantations. In general, initial mortality has been attributed to poor rooting of cuttings, whereas mortality after establishment, where factors like plantation inundation, disease, insect damage, or storm damage are not an acute issue, has been attributed to poor clonal adaptability to the site [59]. As to be expected, when tree mortality is associated with spacing, it is typically realized quickest where the distance between trees is least [55,56,58]. Survival through year 10 observed in this study was not affected by spacing and it ranged towards the lower end of survival rates reported for other poplar plantings of approximately the same age [40,55,59,60]. The mortality we observed may be partly attributed to the harsh environmental conditions of the degraded site, i.e., where altered hydrologic regimes led to flooding over a large portion of the site during each growing season of the study.
Tree height, DBH, and AGBI were influenced by spacing such that each of these variables tended to increase as the spacing or area available to the tree increased. Consistent with the growth of poplars in other studies, height was mildly responsive to spacing while DBH and AGBI were considerably responsive [40,41,61,62]. Fang et al. [63], who worked in the Jiangsu Province of China, confirmed genetic control over the correlation between DBH and crown volume for 14 eastern cottonwood clones native to the southeastern United States, but they also recognized the strong impact of environment on this relationship. Stem diameter, and consequentially AGBI, tends to show a positive response to spacing as observed in this study because it is coupled to vascular support of the live crown—live crown volume and distribution of leaf area for an individual tree in a stand is largely limited by competition for light in the canopy [64].
We observed a substantial difference in growth through year 10 between eastern cottonwood in our experimental planting and other plantings reported in the literature. For example, Krinard and Johnson [55], who studied cottonwood on a highly productive site in the vicinity of the current study, reported the average size for 10-year-old trees in stands spaced 3.7 × 3.7 m was 75% greater in DBH and 105% taller than those in our study. Likewise, a diploid hybrid poplar clone planted on an alluvial site of the Huabei Great Plain, China, grew 52% more in DBH and 58% taller by year 11 in stands spaced 3 × 4 m (versus the 3.7 × 3.7 m spacing at year 10 in this study) [37]. However, our results for eastern cottonwood growth were more encouraging than those reported by Kaczmarek et al. [59], who conducted research on a relatively low productivity, upland site in South Carolina, USA. They noted year 10 observations of cottonwood clone S7C15 (spaced 2.5 × 2.5 m), one of the two clones we deployed, to be 18% smaller in DBH and 33% shorter than for trees spaced 2.7 × 1.8 m in this study. Thus, it appears that the dissimilarity in growth between trees at our study site and the better-performing trees at other sites is in part due to the lower site index inherent in our study area as well as the soil quality degradation and hydrologic regime alteration persisting from the previous agricultural use. Moreover, we did not fertilize our study site to mitigate depleted nutrient pools, principally nitrogen, as is conventionally practiced to enhance the early growth of eastern cottonwood raised for industrial purposes.

4.2. Stand Development and Dynamics of Carbon Accumulation

Poplars grown in short-rotation systems have the potential to exhibit some of the highest initial annual carbon increments among plantation-grown temperate broadleaf trees [9]. However, the annual net productivity and carbon stocks in poplar plantings are influenced by a host of site factors and silvicultural decisions. Basic factors tied to site productivity include inherent soil and hydrologic characteristics, climate/weather, and prior land use. Additional factors include silvicultural decisions such as species and clonal selection, plantation spacing, and management regime (fertilization, irrigation, weed/pest control practices, and rotation length). All of these will impact annual increment and total carbon accumulation realized for a given planting [15,39,40,41,58,65,66,67]. Due to the extensive variability of these factors across studies reported from throughout the temperate zone, calculated rates of CAIAGC and MAIAGC in young poplar plantings range substantially. An example calculated from two sites in Suceava County, Romania, showed peak CAIAGC ranged from 6.8 to 7.6 Mg ha−1 y−1 at year 4 for a hybrid poplar clone established in 3 × 2 m plantings, and MAIAGC in year 5 ranged from 3.8 to 4.6 Mg ha−1 y−1 for the two sites, respectively [66]. Two hybrid poplar clones raised on a 1 × 1 m spacing in Washington, DC, USA, differed substantially in annual carbon increment [58]. A peak CAIAGC near 8.5 Mg ha−1 y−1 at age 5 and an MAIAGC of 5.6 Mg ha−1 y−1 at age 5 were realized for the first clone, while a peak CAIAGC of 14.2 Mg ha−1 y−1 at age 4 and an MAIAGC of 9.2 Mg ha−1 yr−1 at age 6 were realized for the second clone [58]. Further, poplar clones established in Baoying County, China, showed peak CAIAGC ranged near 6.4 Mg ha−1 y−1 in year 5 where plantings were spaced 4 × 5 m to about 8.6 Mg ha−1 y−1 in year 4 where spaced 3 × 3 m [39]. Estimated MAIAGC at that site ranged from about 4.9 Mg ha−1 y−1 in year 6 for the 4 × 5 m spacing to about 7.2 Mg ha−1 y−1 in year 6 for the 3 × 3 m spacing [39].
Trajectories of annual carbon increments relative to spacing for our study patterned similarly to those of other non-coppiced poplar stands reported in the literature, CAIAGC and MAIAGC rose quickest and peaked earliest for the tightest spacings [39,58]. Because the productivity of young plantations is fundamentally tied to light-intercepting leaf area [34,68,69], most SRWC systems feature relatively high planting densities designed to rapidly build stand-level, rather than tree-level, leaf area. This design enhances early stand productivity, shifting slopes of CAI and MAI to rise more quickly with an increase in stand density [39,58,70]. Our findings for CAIAGC and MAIAGC bear this relationship but also suggest an upper limit for the current study site at which an increase in stand density will not increase CAIAGC nor MAIAGC. For the eastern cottonwood clones deployed on our study site, an upper limit of planting density for maximum 10-year carbon accumulation appears positioned between the 2.7 × 1.8 m and 2.1 × 0.8 m spacings. Increasing planting density from the 2.1 × 0.8 m spacing to the (0.8 + 1.8) × 0.8 m spacing failed to improve increments of AGCS through year 10. Likewise, there is probably a spacing level intermediate to the 2.7 × 1.8 m and 2.1 × 0.8 m levels that would provide sufficient stocking to approach the carbon increment observed for the later spacing.
Expectedly, results for carbon increments on the current study site were comparably lower than values reported from seemingly higher productivity, more intensively managed sites. For example, Krinard and Kennedy [54], who investigated eastern cottonwood growth on a site of heavy clay soils within 80 km of our study area, reported values that allowed us to calculate CAIAGC and MAIAGC for their 5-year study. Neither variable peaked by year 5, but annual carbon increments in the Krinard and Kennedy [54] planting were in the range of values from the literature discussed above and much greater than for our planting at the two widest spacings (2.7 × 1.8 m and 3.7 × 3.7 m). Year 5 CAIAGC for their plantation, which was spaced 3.7 × 3.7 m, was 11.2 Mg ha−1 yr−1 and MAIAGC was 5.7 Mg ha−1 yr−1. These rates are nearly five times greater than the CAIAGC and more than four times greater than the MAIAGC observed at the same age and spacing in our study. Yet, the year 6 MAIAGC for stands spaced 2.7 × 1.8 m (3.4 Mg ha−1 yr−1) on our site was intermediate to the calculated range of 2.7 to 4.5 Mg ha−1 y−1 reported by Ghezehei et al. [71] for eastern cottonwood clones (stand density = 2500 trees ha−1) planted on coastal sites with marginal soils in North Carolina, USA. Prior to our research, CAI and MAI rates for carbon uptake and accumulation by eastern cottonwood on relatively low-productivity alluvial sites degraded by agriculture were not known for the southeastern United States. Referencing our data to those of Krinard and Kennedy [54] illustrates that a certain level of site degradation may be expected to negatively impact cottonwood productivity where it is established in short rotation culture on native soils under long-term cultivation for agriculture.
The AGCS increment patterns for eastern cottonwood on the current study site confirm a commonly reported relationship between stand density and optimal biological rotation of biomass crops. In general, increasing stand density will lead to earlier realization of biological rotation [39,70,72]. As described above, a densely stocked stand accumulates biomass earlier than a thinly stocked stand, but it will also develop sooner into a canopy closure and inter-tree competition that limits annual increments. Too, the more thinly stocked stand will sustain annual increments near maximum over more growing seasons than the densely stocked stand [70]. Biological rotation holds significance to a carbon accumulation and storage objective from the standpoint of understanding the timeframe and duration for which a stand maximizes carbon increment. The biological optima, or the timeframe of greatest AGCS increment, for the two tightest spacings in this experiment was near 7.5 to 8 years. Widening distance between trees to 2.7 × 1.8 m increased the biological rotation by 2 years and decreased AGCS stocks at biological rotation by 18.4 Mg ha−1. Though stands of the two tightest spacings had surpassed their biological rotation, annual increments at year 10 were still at least 10 Mg ha−1 greater than the annual increment of stands spaced 2.7 × 1.8 m at their 10-year biological rotation. This finding reflects the previously noted observation that inter-tree competition at year 10 had yet to impact survival in the more tightly spaced stands.
As mentioned above, the environmental and silvicultural factors that govern annual carbon increments will ultimately determine total carbon accumulation and storage. In this eastern cottonwood planting, differences in annual increments respective to spacing levels accrued to result in a 47.8 Mg ha−1 range in year 10 AGCS stocks. Carbon stocks for the 2.1 × 0.8 m and (0.8 + 1.8) × 0.8 m spacing levels were equivalent at year 10; i.e., the same level of carbon accumulated with 60% of the planting material and effort used to establish the tighter spacing. Carbon stocks for the 3.7 × 3.7 m spacing, which is the conventional spacing in the region for cottonwood fiber and sawlog production, remained substantially lower than all other spacing levels through year 10. Clearly, selection of this spacing level to accommodate an objective met by quickly producing trees in relatively large size classes could result in significant shortfalls in early AGCS stocks on similar sites of degraded marginal agricultural land. As noted by Zhang et al. [38], an optimal rotation length based on a merchantable size class or economic maturity of a stand for a given objective like sawlog production would likely extend beyond the biological rotation length defined by annual increments of biomass or carbon. Together with the range in biological rotation, the observed range in total carbon stored per hectare should prove significant to balancing the ecological and economical tradeoffs associated with managing SRWCs for a climate mitigation objective concurrent with various other targeted objectives.
Evaluated against some other reports for poplars raised in SRWC systems across the temperate zone, early AGC stocks at our study site appear underwhelming [39,41,65,71]. The AGC stocks calculated for an eastern cottonwood planting spaced 3.7 × 3.7 m in Issaquena County, MS, USA, reveal that the similarly spaced stands at our study site accumulated 28.5 Mg ha−1 less carbon by year 10 [55]. Yet, we held no expectation that the carbon accumulation and storage potential of this degraded agricultural site would match that of less degraded or higher productivity sites where SRWC systems are intensively managed for biomass feedstocks, pulp, or solid wood products. Rather, our purpose was to quantify the early carbon stock dynamics on a site representative of marginal agricultural land in the southeastern US, particularly the Mississippi Alluvial Valley. The site we selected is typical of the land in this area being enrolled in US Federal conservation programs for forest restoration, and characteristic of afforested land entered into contracts with carbon project aggregators selling carbon in the voluntary market. From this perspective, carbon stocks on the current site were within the range of potential we calculated from biomass productivity modeled by Stanturf et al. [20] for the southeastern and midwestern US. The year 10 measured AGCS at our site for the tightest and widest spacings varied between 160 and 51%, respectively, of the 43.7 Mg ha−1 modeled for eastern cottonwood and hybrid poplar (1729 stems ha−1) across the southeast and Midwest regions of the US.

5. Conclusions

The silvicultural factor examined in this study, plantation spacing, was found to be of high consequence to AGC accumulation and storage potential by eastern cottonwood grown as a SRWC on a degraded floodplain site marginal for agricultural production. Spacing did not impact tree survival but, expectedly, AGCI increment of individual trees improved as the distance between trees increased. Slopes for annual carbon increments rose more quickly and carbon stored in aboveground biomass increased more rapidly on an area basis with decreasing distance between trees in stands. Results gathered from our study site and the clonal material we deployed suggest that early AGCS increment and stocks for cottonwood raised as a SRWC on similarly degraded agricultural sites could be maximized at a spacing level between 2.1 × 0.8 m and 2.7 × 1.8 m. Stands planted to a spacing level in this range would develop to the biologically optimal rotation for AGCS stocks within 8 to 10 years of establishment. Rates for AGC increments through year 10 were substantially lower than the potentials reported for dedicated biomass crops on higher productivity sites but appear promising for pursuing a climate mitigation objective, concurrent with management for other ecosystem services, through forest restoration on degraded agricultural sites. These findings inform the management of SRWC systems for carbon storage and other compatible ecosystem services by expanding our knowledge of how initial spacing impacts early carbon accumulation and carbon stock development in eastern cottonwood established on low-productivity sites entering forest restoration. Future SRWC research on similarly degraded agricultural sites should explore other aspects of eastern cottonwood productivity and carbon storage potential including genotypic variation in response to spacing, below-ground dynamics of carbon accumulation and stocks, and the dynamics of carbon accumulation and stocks over multiple coppice rotations.

Author Contributions

Conceptualization, T.D.L. and R.A.S.; methodology, E.S.G., K.P.P., T.D.L., R.A.S. and R.J.R.; formal analysis, K.P.P.; investigation, E.S.G., T.D.L., K.P.P., R.A.S. and B.D.; data curation, E.S.G.; writing—original draft preparation, E.S.G.; writing—review and editing, E.S.G., K.P.P., T.D.L., R.A.S., R.J.R. and B.D.; supervision, E.S.G., K.P.P., T.D.L. and R.A.S.; project administration, T.D.L., K.P.P. and R.A.S.; funding acquisition, T.D.L. All authors have read and agreed to the published version of the manuscript.

Funding

This work was supported by operating funds of the Southern Research Station, USDA Forest Service and Joint Venture Agreement 16-JV-11330127-098 with Mississippi State University.

Data Availability Statement

The datasets generated and/or analyzed during the current study are on file at the Center for Bottomland Hardwoods Research, Southern Research Station, USDA Forest Service, Stoneville, MS, USA, and are available from the corresponding author on reasonable request.

Acknowledgments

We thank Chris Kirk, Shelley Griffin, Matt Moran, Carl Smith, and Chuck Walker for their contributions to annual maintenance and measurement of the experiment. We also thank Charles Sabatia who contributed improvements to the experimental design. The US Army Corps of Engineers, Vicksburg District, granted the use of a site in their holdings for this research.

Conflicts of Interest

The authors declare no conflict of interest.

References

  1. Walker, W.S.; Gorelik, S.R.; Cook-Patton, S.C.; Baccini, A.; Farina, M.K.; Solvik, K.K.; Ellis, P.W.; Sanderman, J.; Houghton, R.A.; Leavitt, S.M.; et al. The global potential for increased storage of carbon on land. Proc. Natl. Acad. Sci. USA 2022, 119, e2111312119. [Google Scholar] [CrossRef]
  2. Waring, B.; Neumann, M.; Prentice, I.C.; Adams, M.; Smith, P.; Siegert, M. Forests and decarbonization—Roles of natural and planted forests. Front. For. Glob. Chang. 2020, 3, 58. [Google Scholar] [CrossRef]
  3. Bastin, J.-F.; Finegold, Y.; Garcia, C.; Mollicone, D.; Rezende, M.; Routh, D.; Zohner, C.M.; Crowther, T.W. The global tree restoration potential. Science 2019, 365, 76–79. [Google Scholar] [CrossRef] [PubMed]
  4. Nayak, N.; Mehrotra, R.; Mehrotra, S. Carbon biosequestration strategies: A review. Carbon. Capture Sci. Technol. 2022, 4, 100065. [Google Scholar] [CrossRef]
  5. Doelman, J.C.; Stehfest, E.; van Vuuren, D.P.; Tabeau, A.; Hof, A.F.; Braakhekke, M.C.; Gernaat, D.E.H.J.; van den Berg, M.; van Zeist, W.-J.; Daioglou, V.; et al. Afforestation for climate change mitigation: Potentials, risks and trade-offs. Glob. Chang. Biol. 2020, 26, 1576–1591. [Google Scholar] [CrossRef] [PubMed]
  6. Hong, S.; Yin, G.; Piao, S.; Dybzinski, R.; Cong, N.; Li, X.; Wang, K.; Peñuelas, J.; Zeng, H.; Chen, A. Divergent responses of soil organic carbon to afforestation. Nat. Sustain. 2020, 3, 694–700. [Google Scholar] [CrossRef]
  7. Forster, E.J.; Healey, J.R.; Dymond, C.; Styles, D. Commercial afforestation can deliver effective climate change mitigation under multiple decarbonisation pathways. Nat. Commun. 2021, 12, 3831. [Google Scholar] [CrossRef] [PubMed]
  8. Guo, Y.; Abdalla, M.; Espenberg, M.; Hastings, A.; Hallett, P.; Smith, P. A systematic analysis and review of the impacts of afforestation on soil quality indicators as modified by climate zone, forest type and age. Sci. Total Environ. 2021, 757, 143824. [Google Scholar] [CrossRef]
  9. Zalesny, R.S., Jr.; Stanturf, J.A.; Gardiner, E.S.; Perdue, J.H.; Young, T.M.; Coyle, D.R.; Headlee, W.L.; Bañuelos, G.S.; Hass, A. Ecosystem services of woody crop production systems. BioEnergy Res. 2016, 9, 465–491. [Google Scholar] [CrossRef]
  10. Taylor, G.; Donnison, I.S.; Murphy-Bokern, D.; Morgante, M.; Bogeat-Triboulot, M.-B.; Bhalerao, R.; Hertzberg, M.; Polle, A.; Harfouche, A.; Alasia, F.; et al. Sustainable bioenergy for climate mitigation: Developing drought-tolerant trees and grasses. Ann. Bot. 2019, 124, 513–520. [Google Scholar] [CrossRef]
  11. Englund, O.; Dimitriou, I.; Dale, V.H.; Kline, K.L.; Mola-Yudego, B.; Murphy, F.; English, B.; McGrath, J.; Busch, G.; Negri, M.C.; et al. Multifunctional perennial production systems for bioenergy: Performance and progress. WIREs Energy Environ. 2020, 9, e375. [Google Scholar] [CrossRef]
  12. Volk, T.A.; Heavy, J.P.; Eisenbies, M.H. Advances in shrub-willow crops for bioenergy, renewable products, and environmental benefits. Food Energy Secur. 2016, 5, 97–106. [Google Scholar] [CrossRef]
  13. Mola-Yudego, B.; Pelkonen, P. Pulling effects of district heating plants on the adoption and spread of willow plantations for biomass: The power plant in Enköping (Sweden). Biomass Bioenergy 2011, 35, 2986–2992. [Google Scholar] [CrossRef]
  14. Sabatti, M.; Fabbrini, F.; Harfouche, A.; Beritognolo, I.; Mareschi, L.; Carlini, M.; Paris, P.; Scarascia-Mugnozza, G. Evaluation of biomass production potential and heating value of hybrid poplar genotypes in a short-rotation culture in Italy. Ind. Crops Prod. 2014, 61, 62–73. [Google Scholar] [CrossRef]
  15. Chavan, S.B.; Dhillon, R.S.; Sirohi, C.; Uthappa, A.R.; Jinger, D.; Jatav, H.S.; Chichaghare, A.R.; Kakade, V.; Paramesh, V.; Kumari, S.; et al. Carbon sequestration potential of commercial agroforestry systems in Indo-Gangetic Plains of India: Poplar and eucalyptus-based agroforestry systems. Forests 2023, 14, 559. [Google Scholar] [CrossRef]
  16. McGrath, J.F.; Goss, K.F.; Brown, M.W.; Bartle, J.R.; Abadi, A. Aviation biofuel from integrated woody biomass in southern Australia. WIREs Energy Environ. 2016, 6, e221. [Google Scholar] [CrossRef]
  17. Langholtz, M.H.; Stokes, B.J.; Eaton, L.M.; Brandt, C.C.; Davis, M.R.; Theiss, T.J.; Turhollow, A.F., Jr.; Webb, E.; Coleman, A.; Wigmosta, M.; et al. 2016 Billion-Ton Report: Advancing Domestic Resources for a Thriving Bioeconomy, Volume 1: Economic Availability of Feedstocks; Oak Ridge National Lab (ORNL): Oak Ridge, TN, USA, 2016. [CrossRef]
  18. Shukla, P.R.; Skea, J.; Slade, R.; Al Khourdajie, A.; van Diemen, R.; McCollum, D.; Pathak, M.; Some, S.; Vyas, P.; Fradera, R.; et al. Climate Change 2022: Mitigation of Climate Change. Contribution of Working Group III to the Sixth Assessment Report of the Intergovernmental Panel on Climate Change; Cambridge University Press: Cambridge, UK; New York, NY, USA, 2022. [Google Scholar]
  19. Gul, T.; Cozzi, L.; Havlik, P. What Does Net-Zero Emissions by 2050 Mean for Bioenergy and Land Use? International Energy Agency. Available online: https://www.iea.org/articles/what-does-net-zero-emissions-by-2050-mean-for-bioenergy-and-land-use (accessed on 25 August 2023).
  20. Stanturf, J.A.; Young, T.M.; Perdue, J.H.; Doughetry, D.; Pigott, M.; Guo, Z.; Huang, X. Potential profitability zones for Populus spp. biomass plantings in the eastern United States. For. Sci. 2017, 63, 586–595. [Google Scholar] [CrossRef]
  21. Chudy, R.P.; Busby, G.M.; Binkley, C.S.; Stanton, B.J. The economics of dedicated hybrid poplar biomass plantations in the western U.S. Biomass Bioenergy 2019, 124, 114–124. [Google Scholar] [CrossRef]
  22. Ghezehei, S.B.; Nichols, E.G.; Hazel, D.W. Productivity and cost-effectiveness of short-rotation hardwoods on various land types in the southeastern USA. Int. J. Phytoremediat. 2019, 22, 98–110. [Google Scholar] [CrossRef]
  23. Bressler, A.; Vidon, P.; Hirsch, P.; Volk, T. Valuation of ecosystem services of commercial shrub willow (Salix spp.) woody biomass crops. Environ. Monit. Assess. 2017, 189, 137. [Google Scholar] [CrossRef]
  24. Ile, O.J.; McCormick, H.; Skrabacz, S.; Bhattacharya, S.; Aguilos, M.; Carvalho, H.D.R.; Idassi, J.; Baker, J.; Heitman, J.L.; King, J.S. Integrating short rotation woody crops into conventional agricultural practices in the southeastern United States: A review. Land 2022, 12, 10. [Google Scholar] [CrossRef]
  25. Mei, B. Carbon offset as another driver of timberland investment returns in the United States. J. For. Bus. Res. 2023, 2, 1–19. [Google Scholar]
  26. Adhikari, R.K.; Grala, R.K.; Grado, S.C.; Grebner, D.L.; Petrolia, D.R. Landowner satisfaction with conservation programs in the southern United States. Sustainability 2022, 14, 5513. [Google Scholar] [CrossRef]
  27. Hellerstein, D.M. The US Conservation Reserve Program: The evolution of an enrollment mechanism. Land. Use Policy 2017, 63, 601–610. [Google Scholar] [CrossRef]
  28. Van Voorhis, C. The rise of natural capitalism and the new frontier of the restoration economy. For Landowner, November/December 2012; pp. 18–25. [Google Scholar]
  29. Fahrenkrog, A.M.; Neves, L.G.; Resende, M.F.R., Jr.; Vazquez, A.I.; de los Campos, G.; Dervinis, C.; Sykes, R.; Davis, M.; Davenport, R.; Barbazuk, W.B.; et al. Genome-wide association study reveals putative regulators of bioenergy traits in Populus deltoides. New Phytol. 2017, 213, 799–811. [Google Scholar] [CrossRef] [PubMed]
  30. Zhang, J.; Xie, M.; Tuskan, G.A.; Muchero, W.; Chen, J.-G. Recent advances in the transcriptional regulation of secondary cell wall biosynthesis of the woody plants. Front. Plant Sci. 2018, 9, 1535. [Google Scholar] [CrossRef] [PubMed]
  31. Balmant, K.M.; Noble, J.D.; Alves, F.C.; Dervinis, C.; Conde, D.; Schmidt, H.W.; Vazquez, A.I.; Barbazuk, W.B.; de los Campos, G.; Resende, M.F.R., Jr.; et al. Xylem systems genetics analysis reveals a key regulator of lignin biosynthesis in Populus deltoides. Genome Res. 2020, 30, 1131–1143. [Google Scholar] [CrossRef] [PubMed]
  32. Zalesny, R.S., Jr.; Stanturf, J.A.; Gardiner, E.S.; Bañuelos, G.S.; Hallett, R.A.; Hass, A.; Stange, C.M.; Perdue, J.H.; Young, T.M.; Coyle, D.R.; et al. Environmental technologies of woody crop production systems. BioEnergy Res. 2016, 9, 492–506. [Google Scholar] [CrossRef]
  33. DeBell, D.S.; Harrington, C.A. Productivity of Populus in monoclonal and polyclonal blocks at three spacings. Can. J. For. Res. 1997, 27, 978–985. [Google Scholar] [CrossRef]
  34. Gabira, M.M.; Girona, M.M.; DesRochers, A.; Kratz, D.; da Silva, R.B.G.; Duarte, M.M.; deAguiar, N.S.; Wendling, I. The impact of planting density on forest monospecific plantations: An overview. For. Ecol. Manag. 2023, 534, 120882. [Google Scholar] [CrossRef]
  35. Armstrong, A.; Johns, C.; Tubby, I. Effects of spacing and cutting cycle on the yield of poplar grown as an energy crop. Biomass Bioenergy 1999, 17, 305–314. [Google Scholar] [CrossRef]
  36. Hall, R.B.; Hart, E.R.; Peszlen, I. Modifying Populus environmental responses: Impacts on wood quantity and quality. In Molecular Breeding of Woody Plants, 1st ed.; Morohoshi, N., Komamine, A., Eds.; Elsevier Science B.V.: Amsterdam, The Netherlands, 2001; pp. 229–238. [Google Scholar]
  37. Sang, Y.; Gao, P.; Kang, X.; Zhang, P. Effect of initial planting density on growth traits and wood properties of triploid Chinese white poplar (Populus tomentosa) plantation. Forests 2021, 12, 1676. [Google Scholar] [CrossRef]
  38. Zhang, Y.; Tian, Y.; Ding, S.; Lv, Y.; Samjhana, W.; Fang, S. Growth, carbon storage, and optimal rotation in poplar plantations: A case study on clone and planting spacing effects. Forests 2020, 11, 842. [Google Scholar] [CrossRef]
  39. Fang, S.; Xue, J.; Tang, L. Biomass production and carbon sequestration potential in poplar plantations with different management patterns. J. Environ. Manag. 2007, 85, 672–679. [Google Scholar] [CrossRef] [PubMed]
  40. Truax, B.; Fortier, J.; Gagnon, D.; Lambert, F. Planting density and site effects on stem dimensions, stand productivity, biomass partitioning, carbon stocks and soil nutrient supply in hybrid poplar plantations. Forests 2018, 9, 293. [Google Scholar] [CrossRef]
  41. Qian, Z.; Ge, X.; Bai, Y.; Tian, Y.; Zhuang, S.; Fang, S.; Tang, L. Effects of different planting configurations and clones on biomass and carbon storage of a 12-year-old poplar ecosystem in southern China. Can. J. For. Res. 2022, 52, 70–78. [Google Scholar] [CrossRef]
  42. Dahal, B.; Poudel, K.P.; Renninger, H.J.; Granger, J.J.; Leininger, T.D.; Gardiner, E.S.; Souter, R.A.; Rousseau, R.J. Aboveground biomass equations for black willow (Salix nigra Marsh.) and eastern cottonwood (Populus deltoides Bartr. ex Marsh.). Trees For. People 2022, 7, 100195. [Google Scholar] [CrossRef]
  43. USDA Natural Resources Conservation Service, Web Soil Survey. Available online: https://websoilsurvey.sc.egov.usda.gov (accessed on 15 August 2023).
  44. USDOC National Oceanic and Atmospheric Administration, National Centers for Environmental Information, 2006–2020 Normals. Available online: http://www.ncdc.noaa.gov/cdo-web/datatools/normals (accessed on 15 August 2023).
  45. Broadfoot, W.M. Hardwood Suitability for and Properties of Important Midsouth Soils; Southern Forest Experiment Station: New Orleans, LA, USA, 1976; USDA Forest Service Research Paper SO-127; 84p. [Google Scholar]
  46. Robison, T.L.; Rousseau, R.R. Cottonwood leaf beetle control with imidacloprid soaked cuttings. In Proceedings, 15th Central Hardwood Forest Conference; Buckley, D.S., Clatterbuck, W.K., Eds.; USDA Forest Service, Southern Research Station, e-GTR-SRS-101; USDA: Asheville, NC, USA, 2007; pp. 198–205. [Google Scholar]
  47. Lynch, T.B.; Hamlin, D.; Ducey, M.J.; Borders, B.E. Design-unbiased estimation and alternatives for sampling trees on plantation rows. Forests 2018, 9, 362. [Google Scholar] [CrossRef]
  48. SAS. Version 9.4 for Windows; SAS Institute, Inc.: Cary, NC, USA, 2013. [Google Scholar]
  49. Vera, I.; Hoefnagels, R.; Junginger, M.; van der Hilst, F. Supply potential of lignocellulosic energy crops grown on marginal land and greenhouse gas footprint of advanced biofuels—A spatially explicit assessment under the sustainability criteria of the Renewable Energy Directive Recast. GCB-Bioenergy 2021, 13, 1425–1447. [Google Scholar] [CrossRef]
  50. Zhang, B.; Lan, K.; Harris, T.B.; Ashton, M.S.; Yao, Y. Climate-smart forestry through innovative wood products and commercial afforestation and reforestation on marginal land. Proc. Natl. Acad. Sci. USA 2023, 120, e2221840120. [Google Scholar] [CrossRef]
  51. Čomić, D.R. Regression models of carbon and CO2 sequestration of hybrid poplar plantations in northern Serbia. Can. J. For. Res. 2021, 51, 1859–1874. [Google Scholar] [CrossRef]
  52. Bazrgar, A.B.; Sidders, D.; Thevathasan, N. Predicting aboveground biomass carbon sequestration potential in hybrid poplar clones under afforestation plantation management in southern Ontario, Canada. For. Chron. 2022, 98, 89–102. [Google Scholar] [CrossRef]
  53. Stanturf, J.A.; Gardiner, E.S.; Hamel, P.B.; Devall, M.S.; Leininger, T.D.; Warren, M.E., Jr. Restoring bottomland hardwood ecosystems in the Lower Mississippi Alluvial Valley. J. For. 2000, 98, 10–16. [Google Scholar] [CrossRef]
  54. Krinard, R.M.; Kennedy, H.E., Jr. Five-year-old cottonwood plantation on a clay site: Growth, yield, and soil properties. South. J. Appl. For. 1980, 4, 80–83. [Google Scholar] [CrossRef]
  55. Krinard, R.M.; Johnson, R.L. Ten-Year Results in a Cottonwood Plantation Spacing Study; USDA Forest Service Research Paper SO-106; Southern Forest Experiment Station: New Orleans, LA, USA, 1975; 10p.
  56. Krinard, R.M. Cottonwood Development through 19 Years in a Nelder’s Design; USDA Forest Service Research Note SO-322; Southern Forest Experiment Station: New Orleans, LA, USA, 1985; 4p.
  57. Cao, Q.V.; Durand, K.M. Site index curves for eastern cottonwood plantations in the Lower Mississippi Delta. South. J. Appl. For. 1991, 15, 28–30. [Google Scholar] [CrossRef]
  58. DeBell, D.S.; Clendenen, G.W.; Harrington, C.A.; Zasada, J.C. Tree growth and stand development in short-rotation Populus plantings: 7-year results for two clones at three spacings. Biomass Bioenergy 1996, 11, 253–269. [Google Scholar] [CrossRef]
  59. Kaczmarek, D.J.; Coyle, D.R.; Coleman, M.D. Survival and growth of a range of Populus clones in central South Carolina USA through age ten: Do early assessments reflect longer-term survival and growth trends? Biomass Bioenergy 2013, 49, 260–272. [Google Scholar] [CrossRef]
  60. DeBell, D.S.; Harrington, C.A.; Clendenen, G.W.; Zasada, J.C. Tree growth and stand development of four Populus clones in large monoclonal plots. New For. 1997, 14, 1–18. [Google Scholar] [CrossRef]
  61. Larocque, G.R. Performance and morphological response of the hybrid poplar DN-74 (Populus deltoides × nigra) under different spacings on a 4-year rotation. Ann. For. Sci. 1999, 56, 275–287. [Google Scholar] [CrossRef]
  62. Bo, H.; Zhu, J.; Zhang, R.; Nie, L.; Song, L. Effects of planting density and clone type on growth and wood volume of Populus tomentosa stands. J. For. Res. 2020, 25, 444–449. [Google Scholar] [CrossRef]
  63. Fang, S.; Liu, Y.; Yue, J.; Tian, Y.; Xu, X. Assessments of growth performance, crown structure, stem form and wood property of introduced poplar clones: Results from a long-term field experiment at a lowland site. For. Ecol. Manag. 2021, 479, 118586. [Google Scholar] [CrossRef]
  64. Benomar, L.; DesRochers, A.; Larocque, G.R. The effects of spacing on growth, morphology and biomass production and allocation in two hybrid poplar clones growing in the boreal region of Canada. Trees 2012, 26, 939–949. [Google Scholar] [CrossRef]
  65. Arora, G.; Chaturvedi, S.; Kaushal, R.; Nain, A.; Tewari, S.; Alam, N.M.; Chaturvedi, O.P. Growth, biomass, carbon stocks, and sequestration in an age series of Populus deltoides plantations in Tarai region of central Himalaya. Turk. J. Agric. For. 2014, 38, 550–560. [Google Scholar] [CrossRef]
  66. Dănilă, I.-C.; Mititelu, C.; Palaghianu, C. Productivity of short-rotation poplar crops: A case study in the NE of Romania. Forests 2022, 13, 1089. [Google Scholar] [CrossRef]
  67. Ghezehei, S.B.; Wright, J.; Zalesny, R.S., Jr.; Nichols, E.G.; Hazel, D.W. Matching site-suitable poplars to rotation length for optimized productivity. For. Ecol. Manag. 2019, 457, 117670. [Google Scholar] [CrossRef]
  68. Verlinden, M.S.; Broeckx, L.S.; Van den Bulcke, J.; Van Acker, J.; Ceulemans, R. Comparative study of biomass determinants of 12 poplar (Populus) genotypes in a high-density short-rotation culture. For. Ecol. Manag. 2013, 307, 101–111. [Google Scholar] [CrossRef]
  69. Zenone, T.; Fischer, M.; Arriga, N.; Broeckx, L.S.; Verlinden, M.S.; Vanbeveren, S.; Zona, D.; Ceulemans, R. Biophysical drivers of the carbon dioxide, water vapor, and energy exchanges of a short-rotation poplar coppice. Agric. For. Meteorol. 2015, 209–210, 22–35. [Google Scholar] [CrossRef]
  70. Strong, T.; Hansen, E. Hybrid poplar spacing/productivity relations in short rotation intensive culture plantations. Biomass Bioenergy 1993, 4, 255–261. [Google Scholar] [CrossRef]
  71. Ghezehei, S.B.; Ewald, A.L.; Hazel, D.W.; Zalesny, R.S., Jr.; Nichols, E.G. Productivity and profitability of poplars on fertile and marginal sandy soils under different density and fertilization treatments. Forests 2021, 12, 869. [Google Scholar] [CrossRef]
  72. Fang, S.; Xu, X.; Lu, S.; Tang, L. Growth dynamics and biomass production in short-rotation poplar plantations: 6-year results for three clones at four spacings. Biomass Bioenergy 1999, 17, 415–425. [Google Scholar] [CrossRef]
Figure 1. Planting density representations scaled to 0.05 ha of planting area for eastern cottonwood established at four spacings on former agricultural land in the Mississippi Alluvial Valley: (a) Illustration of the 3.7 × 3.7 m spacing; (b) Illustration of the 2.7 × 1.8 m spacing; (c) Illustration of the 2.1 × 0.8 m spacing; (d) Illustration of the (0.8 + 1.8) × 0.8 m spacing.
Forests 15 00226 g001
Figure 2. Average accumulation of AGC (mean ± standard error) by individual eastern cottonwood trees established at four spacing levels on former agricultural land in the Mississippi Alluvial Valley.
Forests 15 00226 g002
Figure 3. CAIAGC for eastern cottonwood established at four spacing levels on former agricultural land in the Mississippi Alluvial Valley.
Forests 15 00226 g003
Figure 4. MAIAGC for eastern cottonwood established at four spacing levels on former agricultural land in the Mississippi Alluvial Valley.
Forests 15 00226 g004
Figure 5. Average accumulation of AGCS (mean ± standard error) for eastern cottonwood stands established at four spacing levels on former agricultural land in the Mississippi Alluvial Valley.
Forests 15 00226 g005
Figure 6. Superimposed curves of CAIAGC and MAIAGC through year 10 for eastern cottonwood stands established at four spacing levels on former agricultural land in the Mississippi Alluvial Valley: (a) Graph for the 3.7 × 3.7 m spacing level; (b) Graph for the 2.7 × 1.8 m spacing level; (c) Graph for the 2.1 × 0.8 m spacing level; (d) Graph for the (0.8 + 1.8) × 0.8 m spacing level.
Forests 15 00226 g006
Table 1. Tree and stand characteristics (mean ± standard error) at year 10 for eastern cottonwood established at four spacing levels on former agricultural land in the Mississippi Alluvial Valley. Means in a row followed by the same letter are not different.
Spacing
Variable3.7 × 3.7 m2.7 × 1.8 m2.1 × 0.8 m(0.8 + 1.8) × 0.8 m
Survival (%)73 ± 4 a77 ± 5 a76 ± 5 a64 ± 3 a
Height (m)12.8 ± 0.7 a11.2 ± 0.7 ab9.6 ± 0.9 ab8.4 ± 0.2 b
DBH (cm)11.9 ± 0.6 a9.4 ± 0.7 b6.3 ± 0.5 c5.4 ± 0.2 c
Stand BA (sq m ha−1)14.8 ± 2.1 c24.2 ± 0.9 b33.4 ± 3.4 a31.9 ± 0.4 a
Tree AGB (kg)39.2 ± 1.1 a27.4 ± 0.7 b15.4 ± 0.3 c12.5 ± 0.3 c
Stand AGB (Mg ha−1)44.6 ± 7.2 c83.8 ± 4.3 b141.7 ± 15.7 a140.1 ± 2.9 a
Disclaimer/Publisher’s Note: The statements, opinions and data contained in all publications are solely those of the individual author(s) and contributor(s) and not of MDPI and/or the editor(s). MDPI and/or the editor(s) disclaim responsibility for any injury to people or property resulting from any ideas, methods, instructions or products referred to in the content.