Article

Water Balance Characteristics of the Salix Shelterbelt in the Kubuqi Desert

1
College of Energy and Transportation Engineering, Inner Mongolia Agricultural University, Hohhot 010018, China
2
Forestry and Grassland Administration, Ordos City 017000, China
3
Ordos Afforestation General Plant, Ordos City 014300, China
*
Author to whom correspondence should be addressed.
These authors contributed equally to this work.
Forests 2024, 15(2), 278; https://doi.org/10.3390/f15020278
Submission received: 3 January 2024 / Revised: 26 January 2024 / Accepted: 31 January 2024 / Published: 1 February 2024
(This article belongs to the Section Forest Hydrology)

Abstract

:
Water shortages are the main factor restricting the survival and construction of shelterbelts in sandy areas. Comprehensive analysis of the water balance characteristics of forest stands is crucial for scientifically understanding and regulating the water supply of shelterbelts in sandy areas and formulating appropriate vegetation cultivation and restoration strategies. We simultaneously monitored outer-forest precipitation, canopy interception, stemflow, throughfall, forest transpiration, understory evapotranspiration, and soil moisture content changes in the Salix forest in the Kubuqi Desert during the main growing season (June–October) of 2022. The results showed that the total evapotranspiration of the forest was 185.62 mm, and the components and their proportions of precipitation during the same period were as follows: forest floor evapotranspiration, 94.43 mm (35.88%); stand transpiration, 68.34 mm (25.97%); and canopy interception, 22.85 mm (8.68%). Based on the water balance of the 0–60 cm soil layer and by integrating the changes in soil water storage and the influence of external water transport, the net runoff of the forestland was calculated to be approximately 77.58 mm; that is, the water balance requirements for growth were met. In the future, appropriate irrigation and supplementation can be carried out in June and July to ensure healthier growth in the shelterbelt, and plant photosynthesis and internal physiology can be further studied for cultivation in other desert areas.

1. Introduction

Land degradation and desertification constitute significant global ecological challenges with direct implications for human survival and development [1]. While afforestation has proven effective in ameliorating the local ecological environment and mitigating land erosion and soil loss [2], the unique desert climate imposes severe constraints on shelterbelt survival and establishment because of chronic water scarcity. Under this specific climate condition, the water use of a plant generally depends on the water absorbed by the plant, the distribution of the root system, and the sensitivity of the vegetation to soil and atmospheric drought [3]. In light of these circumstances, conducting a comprehensive assessment of the water balance within areas is imperative. This assessment is crucial for scientifically understanding and managing the water supply to sandy region shelterbelts [4]. It also plays a pivotal role in developing suitable strategies for vegetation growth, ecosystem restoration, and tailored reforestation plans in sandy environments.
The water balance of forestland refers to the ability of vegetation to maintain the dynamic water balance of the atmosphere–vegetation–soil during the long-term growth process. This shows that the water balance of forest stands is not merely static but is also complex, exhibiting elasticity and a robust dynamic network. This stability involves a balance between forest climate, vegetation, soil, water resources, and other factors [5,6]. In this regard, the study of water balance is carried out through the synergistic effect of plant transpiration, soil evaporation, precipitation, canopy interception, soil moisture, runoff production, and other factors [7]. Spatial variations in these factors inevitably lead to changes in the water balance. Therefore, extensive research is required to investigate the gradients of these influential factors [8].
Vegetation transpiration, soil evaporation, and vegetation canopy interception are collectively called ecosystem total evapotranspiration [9,10]. Vegetation evapotranspiration is by far the largest water flux on the Earth’s land surface. The core components of quantitative evapotranspiration are the determination of water use efficiency and an estimation of the system water balance. A large number of evapotranspiration research methods have been derived from this type of research, including remote sensing research [11], vorticity research [12], Bowen ratio research [13], etc. Each measurement method has advantages and disadvantages. The remote sensing estimation method is affected by the time of the image and spatial resolution limitations [11], and the Bowen ratio method and disaster correlation method are difficult to use to calculate evapotranspiration measurements at the regional/large watershed scale [14]. Therefore, simultaneous field research on rainfall canopy interception, plant transpiration, and soil evaporation is the most accurate and reliable method to obtain total evapotranspiration from forestland [7]. In addition, the amount of soil water also has a certain impact on the water balance of forestland, especially in arid inland river areas with shallow groundwater levels. The connectivity of the soil will affect the supply of underground runoff and groundwater. In this regard, it is necessary to monitor the changing characteristics of the soil moisture content within the vegetation ecosystem in a dynamic manner [15].
There are currently rich research results on water balance. For example, Joffre et al. studied the water balance under different site conditions and obtained the yield in a Mediterranean region [16]. Gerten et al. demonstrated the important impact of climate change on water balance dynamics by simulating runoff and evapotranspiration on a large scale [17]. Shawn et al. studied changes in climate water balance by analyzing the distribution of species at different altitudes [18]. Dai Junfeng et al. studied the water balance of a forest-grass system through a model and found that evapotranspiration was the core of forestland water balance expenditure [19]. Yu Xinxiao and others proposed a water balance equation of a forest ecosystem in a loess area through dynamic research on the water balance of forestland and grassland [20]. However, it is worth noting that the current research on the relationship between water balance and forest water mainly focuses on unilateral research on canopy interception, forestland evapotranspiration, or soil layers, and there is a lack of continuous field research on the water balance of the water–vegetation–soil complex [21]. Comprehensive evaluations of the water balance across entire forest stands are limited. This limitation hampers the development of ecohydrological models for sandy areas and poses challenges to the regulation of forest structure and the implementation of coordinated forest–water management strategies.
The Kubuqi Desert is located in the southwest of China’s Inner Mongolia Autonomous Region, with a fragile ecological environment and serious soil erosion. The establishment of shelterbelts has greatly improved local climate conditions; stabilized the regional ecological environment; and, indeed, led to the success of afforestation in some areas in preventing desertification [22]. Given the current frequency of climate extremes, shelterbelt productivity, quality, and health may be further threatened by growing water budget imbalances. Salix is a pioneer tree species in the Kubuqi Desert shelterbelt. Its excellent adaptability and low water consumption make it widely used in desert afforestation projects, effectively preventing the spread of desert areas. However, detailed studies on the water balance of these Salix species have been limited to date.
To address this gap, this study conducted systematic and quantitative monitoring within the Kubuqi Desert’s Ordos afforestation zone, Inner Mongolia Autonomous Region, China. This study delved deeply into hydrological processes and soil moisture variations during the growing season of Salix shelterbelts. Through the continuous monitoring of water–vegetation–soil, canopy interception, Salix forest transpiration, forest evaporation, soil water storage, etc., the forest water balance status was estimated. Through comprehensive evaluation, this study aimed to elucidate the characteristics of the water balance of these shelterbelts and then provide guidance on water management for ecological restoration in arid and semiarid transitional areas from the perspective of the water balance. This research poses two key questions: first, can desert willow stands in the Kubuqi Desert maintain a water balance during the growing season, and second, based on the characteristics of the water balance, can we determine how improved stand management strategies can be developed in the future?

2. Materials and Methods
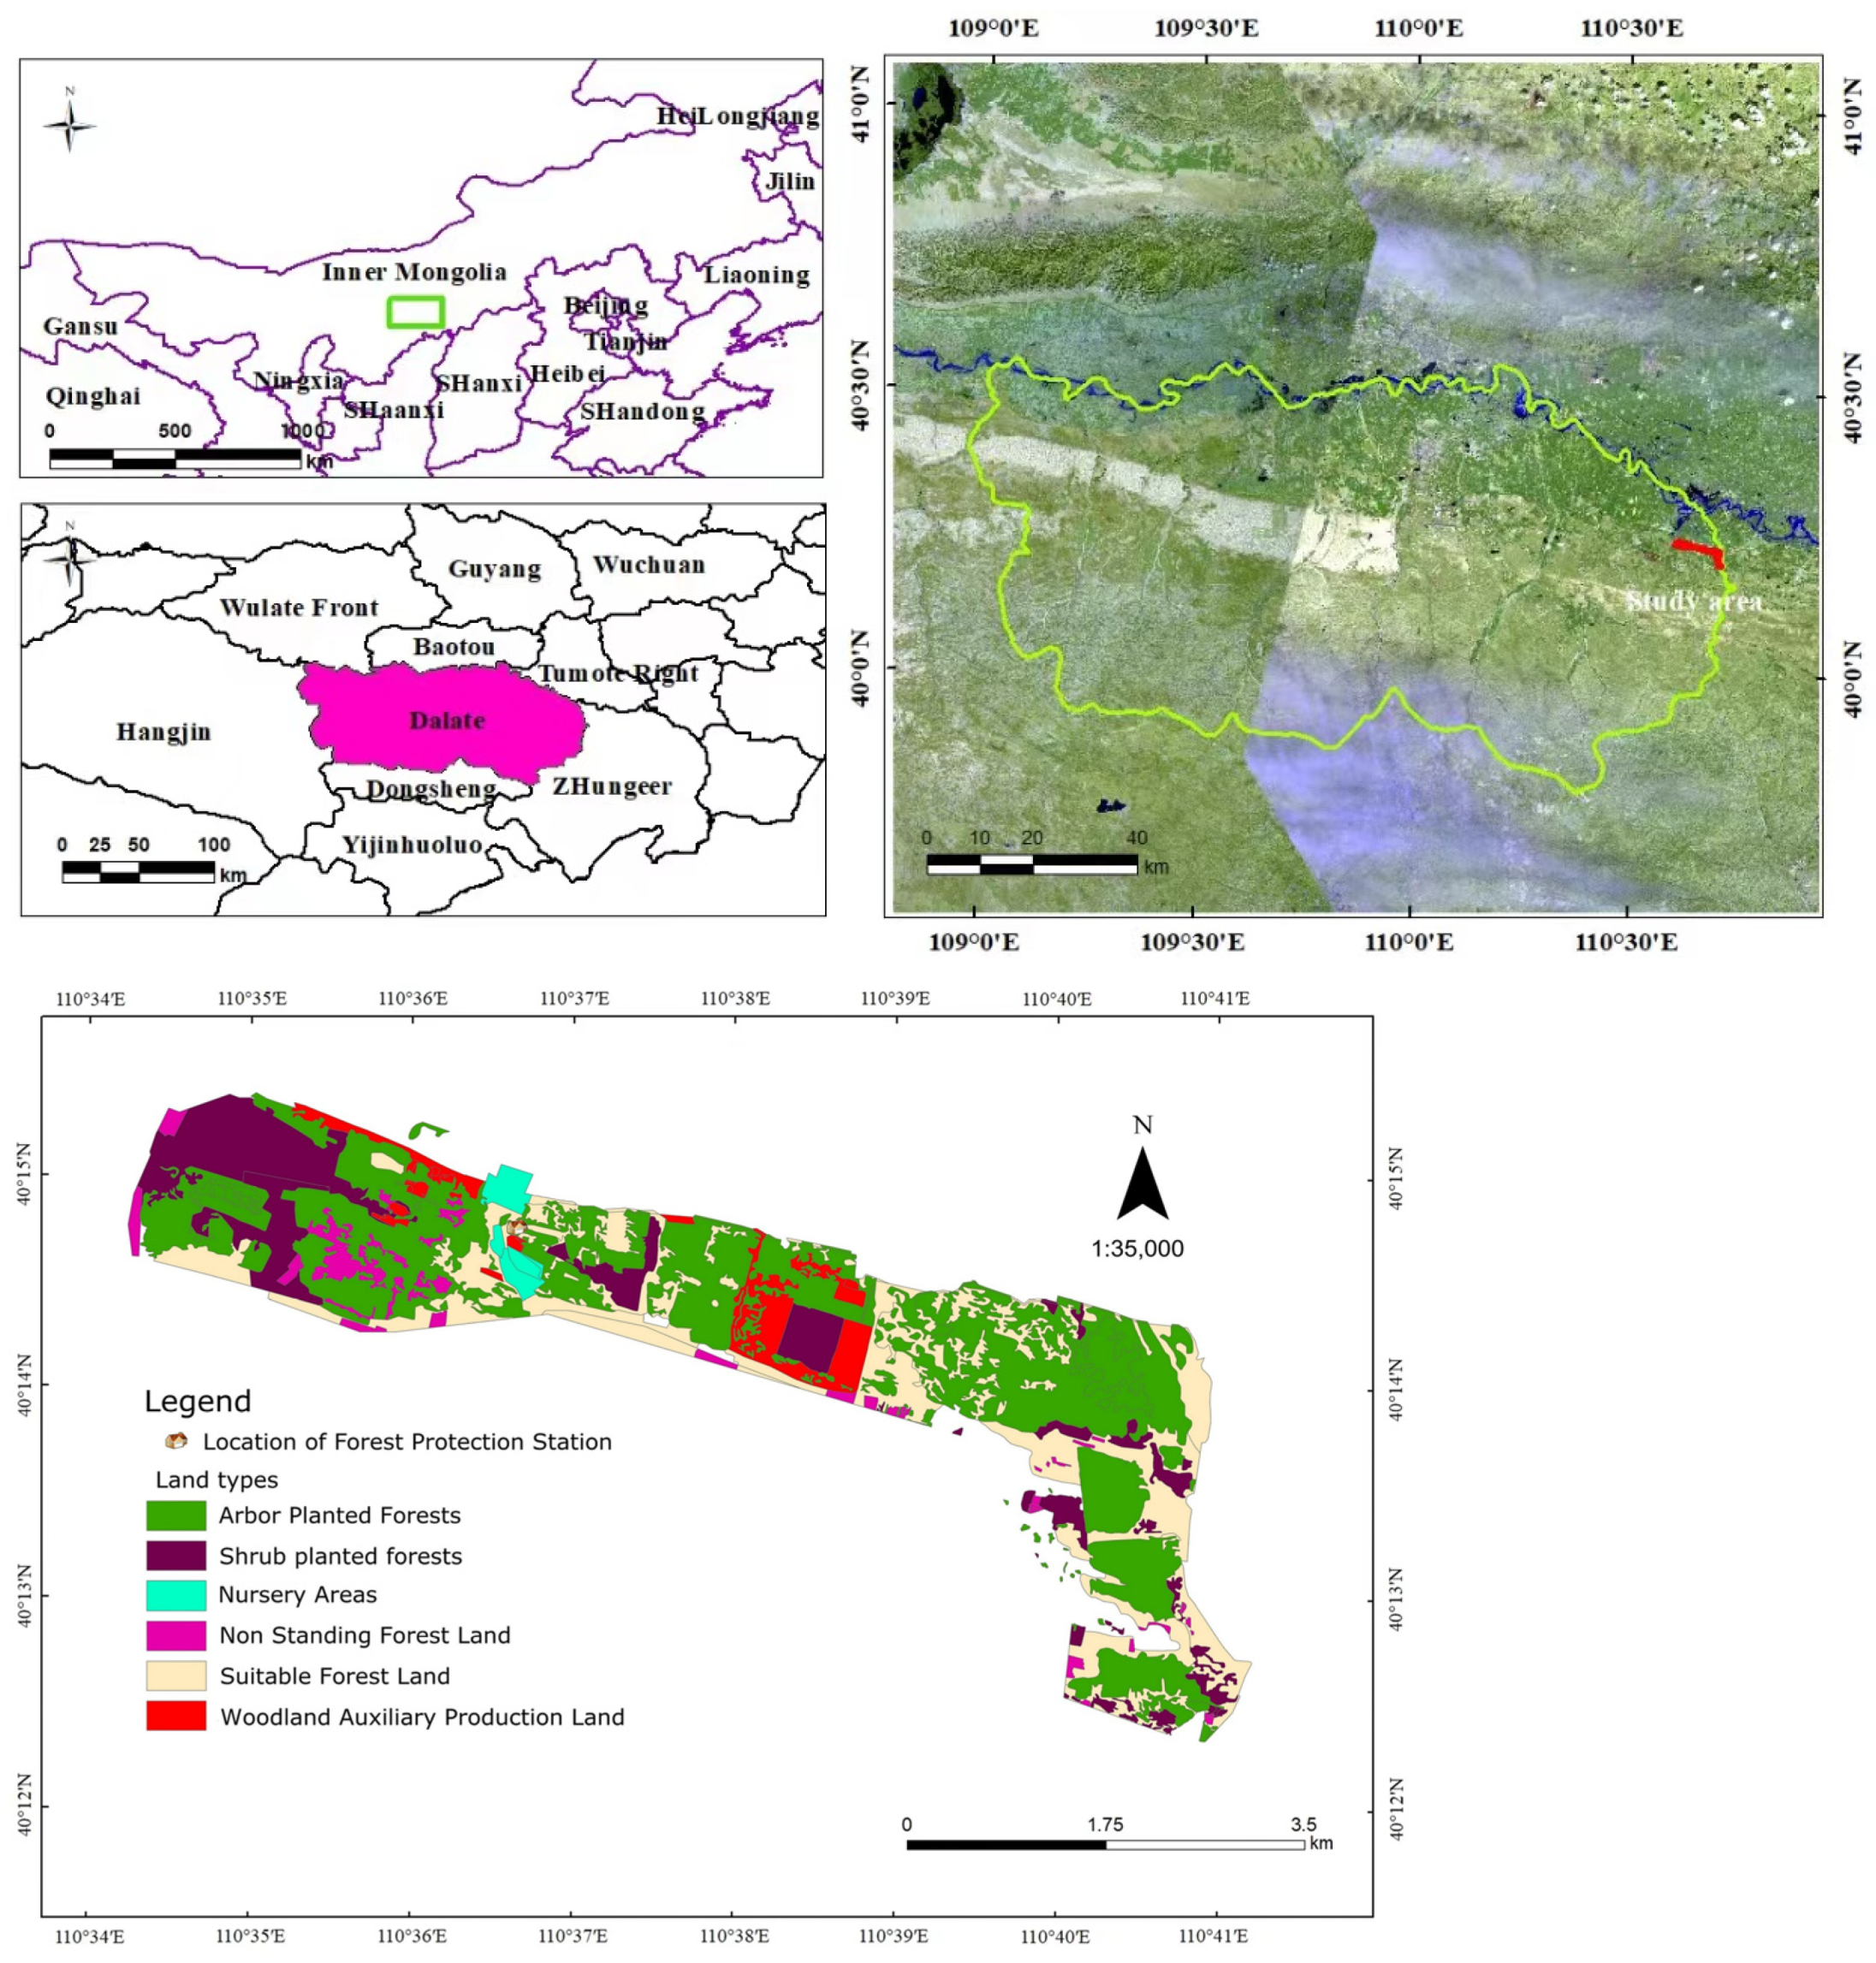
2.1. Study Area

The study area is located at the Caositan Forestry Station of the Ordos Afforestation General Field in the Kubuqi Desert of the Inner Mongolia Autonomous Region (Figure 1). The geographical coordinates are 40°14′24″ N, 110°39′14″ E, located on the eastern edge of the Kubuqi Desert. The region has a temperate continental monsoon climate, with an average annual temperature of 6.1 °C, hot days, and cold nights. The average annual precipitation is 273 mm, and the precipitation in the growing season is 247 mm. Westerly and northwesterly winds prevail throughout the year, with an average wind speed of approximately 3.6 m/s. The climate type is classified as mid-temperate arid or semiarid. The growing season of Salix stands is mainly from May to September. The soil is mainly meadow wind–sand soil, and the understory herbaceous vegetation is mainly sandy vegetation.

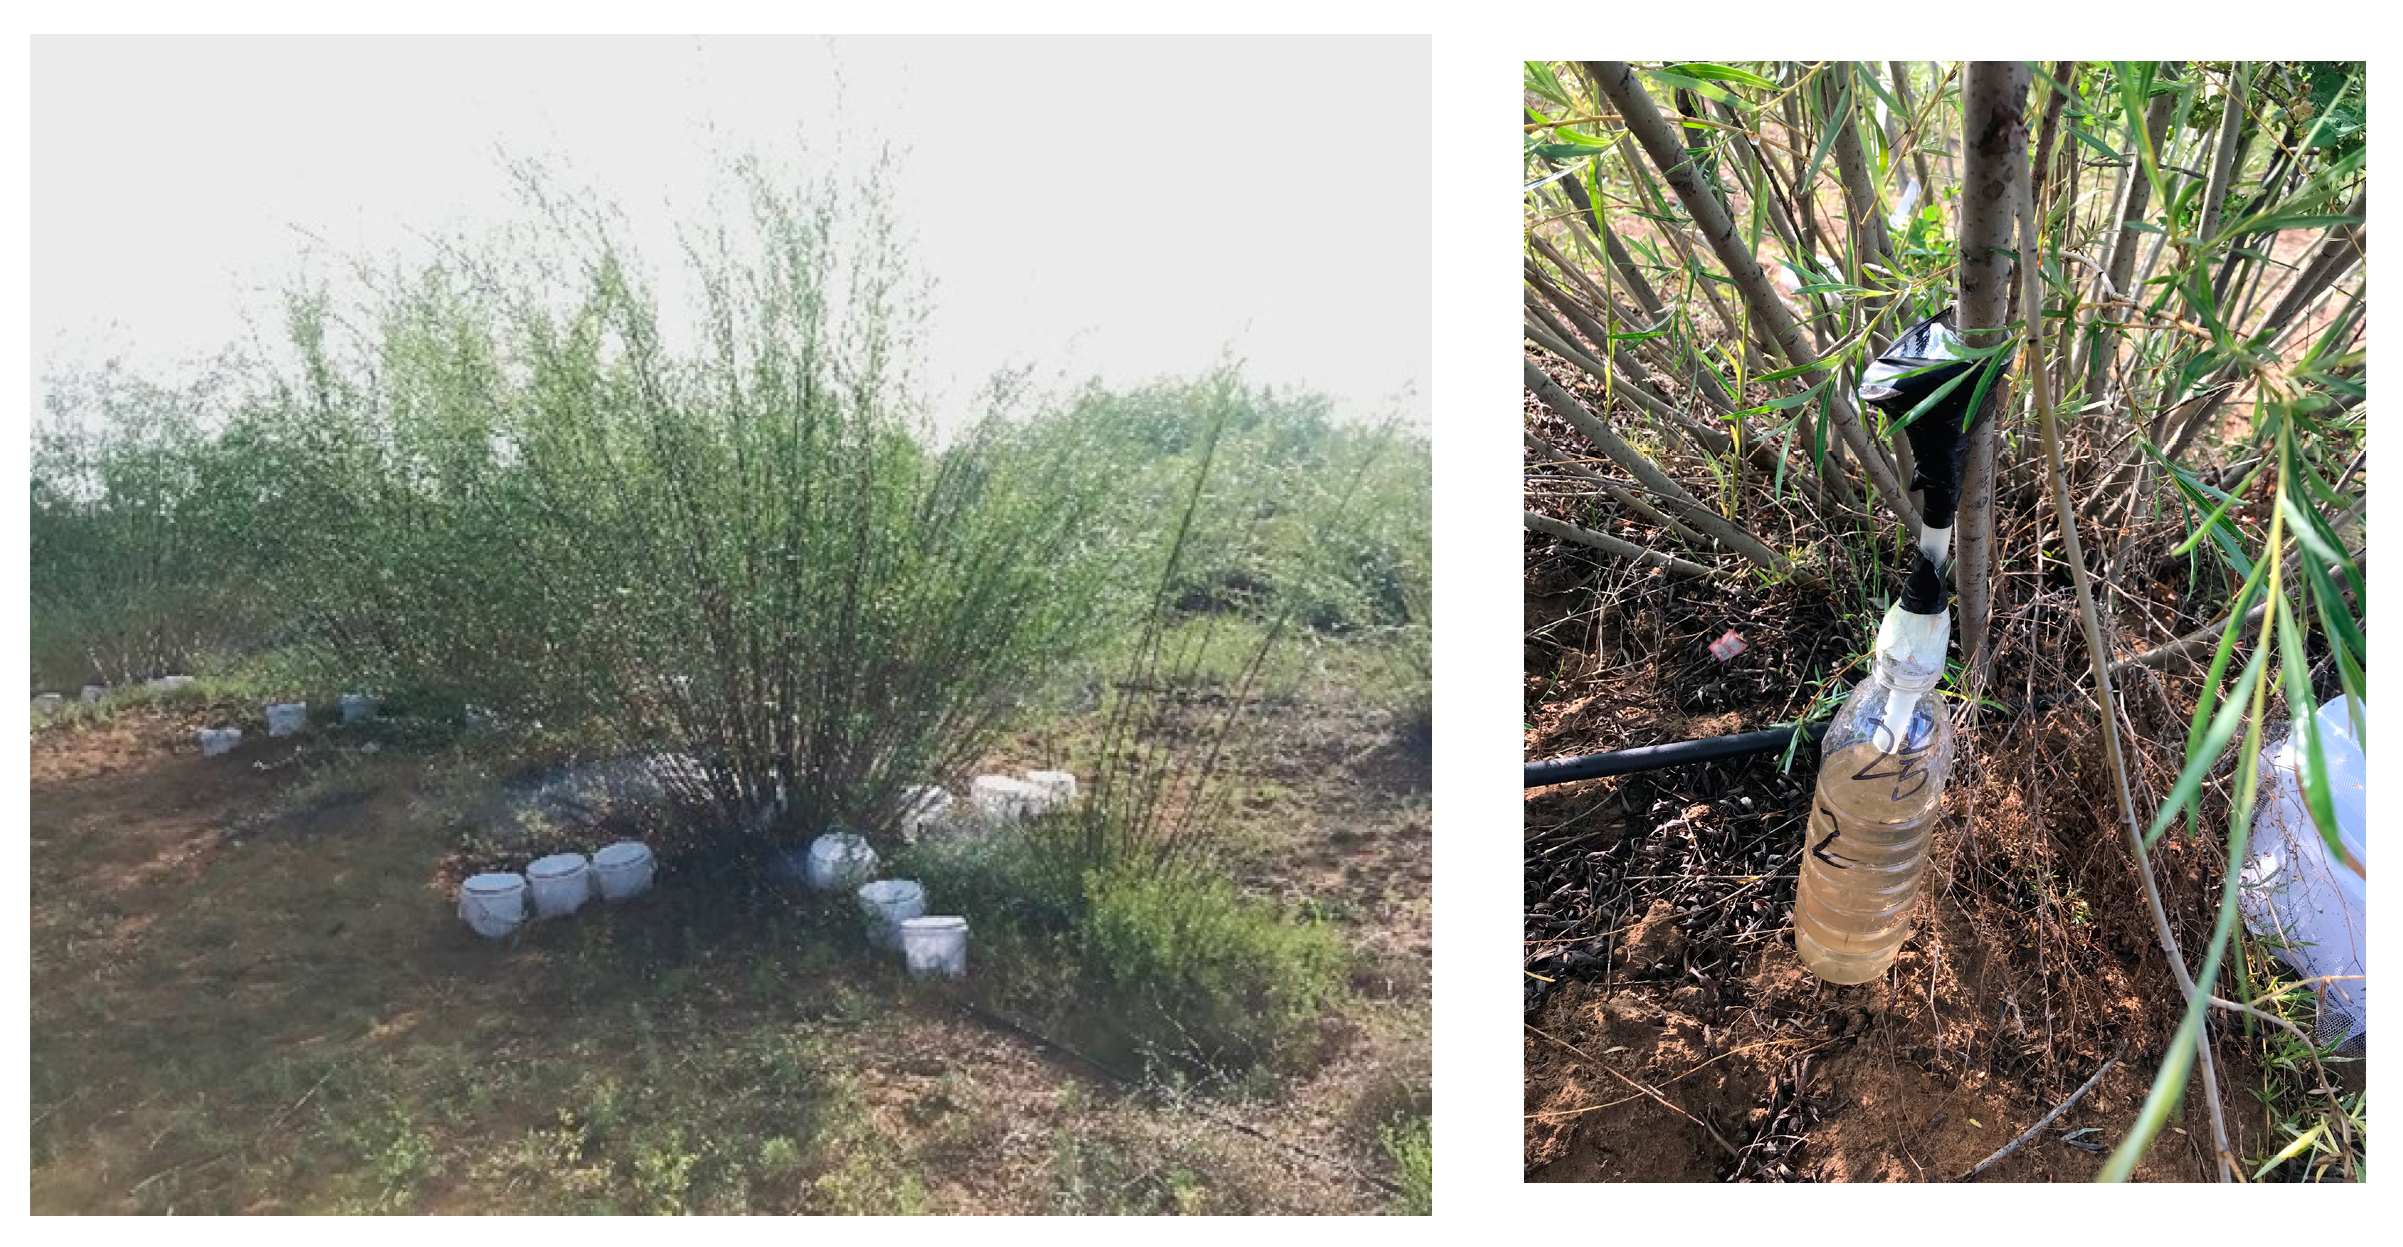
2.2. Plot Setting and Investigation

The experiment was carried out in June 2022. On the basis of the investigation of the site conditions and forest stand structure of the sample plot, a middle-aged Salix protective forest at the afforestation site was selected as the research object, and a 30 m × 30 m area was randomly selected from each forest stand. In the test plot, basic information such as plant height, diameter at breast height, and crown width was collected.

2.3. Determination of Meteorological Factors

A small automatic weather station was installed in an open and unobstructed location around the sample plot to simultaneously monitor meteorological factors outside the forest, including temperature, wetness index, wind speed, wind direction, solar radiation, and precipitation; data were recorded every 10 min. Simultaneously, three plastic rain tubes with a diameter of 20 cm were randomly placed in the open space of the sample plot for backup and correction.

2.4. Measurement of Throughfall and Stemflow in the Forest and Calculation of Canopy Interception

Following the method outlined by Levia and Germer [23], 9 Salix clumps were randomly selected in the sample plot, as shown in Figure 2. Plastic barrels with an outer diameter of 20 cm were selected to receive penetrating rain. A total of 12 plastic barrels were placed under each Salix clump; 4 rows of collection tubes (the angle between the rows was 90°) were used. The distances between the water collection barrels under the Salix plants and the main trunk were approximately 30, 70, and 120 cm. The rainfall was calculated after the rainfall was measured using a graduated cylinder.
T F = 1 m × F A i = 1 m ( V T ) i × 10
where TF is the throughfall (mm); VT is the volume of penetrating rain in the i-th plastic bucket (mL); m is the number of plastic barrels under the canopy; FA is the cross-sectional area of the plastic bucket mouth (cm2).
Since Salix plants are characterized by multiple branches, we applied the standard branch method to compute the total shrub-generated stemflow volume. A total of 9 Salix clumps with penetrating rain barrels were selected as objects. All base diameter dimensions of each Salix clump were measured and marked with a Vernier caliper. The average base diameter of each Salix clump was calculated; 5 branches were selected from the east, west, south, north, and middle that were closest to the average base diameter (the error in selecting branches did not exceed 3 mm); and a total of 45 stemflow collection devices were installed and arranged. The stemflow collector was affixed using hot melt glue and sealed with waterproof hot melt glue, ensuring that rainwater could flow into the plastic bottle of the collection device through the rubber tube. After each rainfall event, we utilized a measuring cylinder to quantify the stemflow volume (mL) within the bottle.
The formula for calculating trunk stemflow is as follows:
V S = ( 1 5 i = 1 5 V S ) × N
S F = V S / ( S P × 1000 )
where VS is the stemflow volume of the Salix (mL); VS is the stemflow measured after rain on a single branch of Salix (mL); N is the number of Salix branches; SF is the stemflowof the Salix (mm); and SP is the projected canopy area of the Salix (m2).
According to the principle of water balance, canopy interception loss was estimated, which is numerically equal to the difference between total rainfall and net rainfall.
I L = P g N = P g ( T F + S F )
where IL is the canopy interception loss (mm), Pg is the rainfall outside the forest (mm), and N is the net rainfall (mm).

2.5. Measurement of Trunk Sap Flow and Calculation of Stand Transpiration

As shown in Figure 3, we utilized an EMS 62 SAP FLOW SYSTEM (Czech Republic, www.emsbrno.cz (12 December 2023)) for sap flow measurements. The measuring principle is based on the stem heat balance method (SHB) with external heating and internal temperature sensing [24,25]. Within the test area, we selected three well-developed and moderately sized individual Salix clumps. For each clump, we chose standard branches in four cardinal directions: east, west, south, and north. To measure sap flow, we employed a 0.8 mm diameter drill to create holes in the xylem of the Salix stem, where we installed stemflow sensors. These sensors were enclosed in tinfoil bags and securely fastened with insulating tape. Stem sap flow in the Salix plants was continuously monitored throughout the growing season using Mini32 data collection devices, which collected and recorded fluid flow data. The measured sap flow rate was then extrapolated from individual branches to the forest stand level.
Following the approach outlined by researchers in [26,27], we employed the cross-sectional area of the basal diameter as the scaling factor to estimate shrub transpiration for the entire forest stand.
T =   1 n i = 1 n ( A t / A i ) ( 1000 J S / ρ A s )
where At, Ai, and As are the total basal stem cross-sectional area in the sampling plot, the basal cross-sectional area of stem i, and the land surface area of the plot (m2), respectively. Js is the sap flow rate in stem i (kg·h−1), ρ is the density of water (kg·m−3), and n is the number of gauged stems.

2.6. Understory Evapotranspiration and Community Evapotranspiration

Following the research plan of [28,29,30], we positioned three custom-made microlysimeters beneath each Salix clump to measure sap flow and monitor understory evapotranspiration, which included soil evaporation and understory vegetation transpiration. These three lysimeters were placed at specific locations on the east side of each Salix clump, near the root neck, half of the crown width, and at the crown edge.
The microlysimeters were constructed using PVC pipes. The inner cylinder had an 11 cm inner diameter and was held at a height of 20 cm, with a 16 cm diameter sleeve. An impermeable layer of pearl cotton separated the sleeve and the inner cylinder to prevent rainwater from entering the gap. The bottom of the inner cylinder was fitted with 300-mesh yarn, permitting moisture passage, and securely fastened with tape (as illustrated in the image).
Throughout the research period, we removed the microlysimeter for weighing twice daily at 7:00 and 19:00 using an electronic balance with a precision of 0.01 g. The electronic balance remained in a fixed location and was protected by a windproof cover during weighing. Two measurements were taken, and the difference between them represented the understory evapotranspiration for that particular day.
E T u n d e r = 1 3 ( 10 × ( ( Δ M s ρ ) / A l ) )
where ETunder is the amount of evapotranspiration under the forest on different single days (mm·d−1); Al is the surface area of the microlysimeter (cm2); ρ is the density of water (g·m−3); and ΔMs is the daily water storage change in the microlysimeter (g·d−1).
Evapotranspiration from artificial shrub communities in deserts consists of shrub transpiration and underbrush evapotranspiration [31].
E T = T + E T u n d e r
E T = I L + E T
where ET is the evapotranspiration of the Salix community, and ET is the total evapotranspiration of the Salix community.

2.7. Determination of Soil Hydrological Characteristics and Calculation of Water Storage Capacity

The soil profile was excavated at the base of the Salix forest to a depth of 80 cm for a total of 4 layers, each spaced 20 cm apart. To minimize errors, three soil samples were randomly collected from each layer using a ring knife. These soil samples were subsequently transported to the laboratory and subjected to soil water retention rate measurements via the ring–knife soaking method.
To monitor the soil moisture dynamics near the Salix trees within the shelterbelt, representative locations were selected. Soil moisture sensors (EC-5, METER, Pullman, WA, USA) were deployed to continuously monitor changes in the soil volumetric moisture content across each soil layer (0–20, 20–40, 40–60 cm). Three sensors are randomly arranged in each layer. Subsequently, soil moisture gains and losses during specific time intervals were calculated.
W i = 10 × V i × h i
Δ W = ( W e W i )
where hi and Vi are the thickness (cm) and water volume content (cm3·cm−3) of the i-th layer of soil, respectively; ΔW is the soil moisture gain; and loss (mm), We, and Wi are the water storage capacities of the 1 m soil layer at the end and beginning of the stage, respectively (mm).

2.8. Water Balance and Yield Calculations for the Sample Plots

The following formula was used to calculate the forestland yield for each observation period.
P = E T + Δ W + R + Q
where P is the amount of rainfall outside the forest during a certain period (mm); ET is the forest stand evapotranspiration during a certain period (mm), including canopy interception (IL) and community evapotranspiration (ET mm); ΔW is the change in water storage in the 0~60 cm soil layer during a certain period (mm); R is the yield in a certain period (including surface runoff and soil flow, mm); and Q is the exchange of water from the study soil layer to the deep layer or lateral direction during a certain period (mm). A positive value indicates that soil moisture leaks from the study soil layer to the deep layer or laterally, and a negative value indicates that the study soil layer receives water input from the deep soil or the upper slope.
During the study period, the surface runoff and in-soil flow in the soil layer in the sample plot were very low and could be ignored; R = 0. Q is a positive value and indicates that there is water side leakage from the study soil layer to the deep layer, which is the flow of forest resources in this study.

3. Results

3.1. Characteristics of Rainfall Changes in the Salix Shelterbelt

3.1.1. Rainfall Redistribution Characteristics in the Salix Shelterbelt in Different Months

As depicted in Table 1, a total of 33 precipitation events (for which the rainfall on that day exceeded 0.2 mm) were observed during the study period (the rainfall event here is based on the rainfall value monitored by the deployed weather station), for which the total precipitation was 263.2 mm. The maximum precipitation in a single event was 59.5 mm, and the minimum was 0.2 mm. Rainfall was mainly concentrated in August, accounting for 73.18% of the total observations. During the study period, rainfall events were less than 10 mm, accounting for 72.73% of the total observation time. Although there were many rainfall events, the cumulative rainfall was relatively low. From the perspective of precipitation, rainfall events > 15 mm accounted for 70.33% of the total precipitation. Therefore, such large rainfall events that occurred less frequently were the main precipitation sources in the study area.
During the study period, the throughfall, stemflow, and canopy interceptions of Salix were 233.3, 7.055, and 22.845 mm, accounting for 88.64%, 2.68%, and 8.68%, respectively, of the total precipitation. The penetrating rainfall, stemflow, and canopy interception in each month all showed a trend of first increasing and then decreasing, with the highest occurring in August, followed by July and September, and the lowest occurring in October. Among the months, the penetrating rain rate was the highest in August, while the stemflow rate and canopy interception rate were relatively low in August.

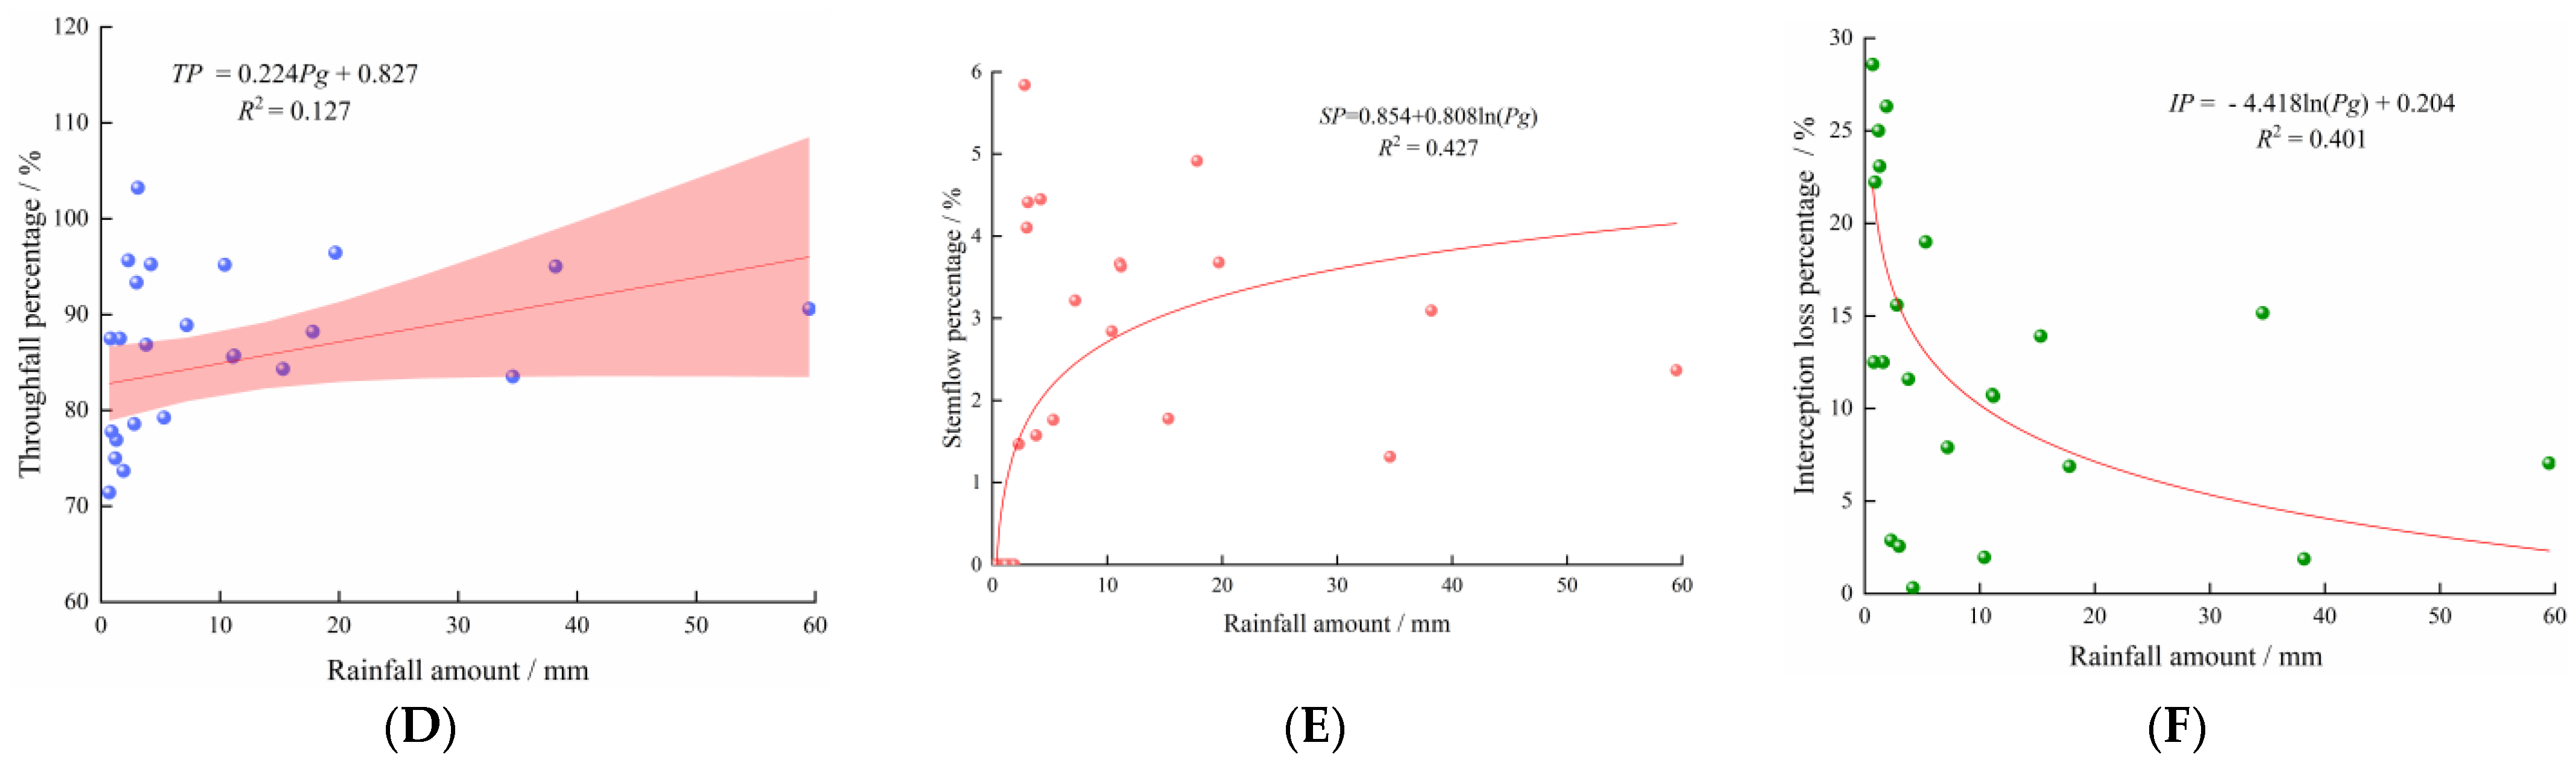
3.1.2. Effects of Rainfall in Forests on Rainfall Redistribution

Rainfall in forests is an important factor affecting rainfall redistribution. As shown in Figure 4, based on regression analysis and curve fitting, rainfall was positively correlated with throughfall rainfall, stemflow, and canopy interception (p < 0.01), which showed that throughfall, stemflow, and canopy interception increased with increasing rainfall. As calculated from the linear regression equation, the throughfall threshold was approximately 0.15 mm, which was similar to the measured value. The threshold value generated by stemflow was approximately 0.57 mm; because of the influence of factors such as canopy structure, wind direction, and rain speed under natural conditions, this value was slightly lower than the measured value.
There was no obvious correlation between the throughfall rate and rainfall. The stemflow rate basically exhibited a logarithmic growth trend with increasing rainfall. Taken together, these findings showed that, within a certain range, stemflow generally exhibited an increasing trend as rainfall increased. However, in some cases, the stemflow rate may have been greater when the rainfall was low, and the stemflow rate may have been lower when the rainfall was heavy. The canopy interception rate exhibited a decreasing trend as a logarithmic function, which indicated that large rainfall events were more likely to result in lower canopy interception than small rainfall events.

3.2. Transpiration Variation Characteristics of the Salix Shelterbelt

As illustrated in Figure 5a, vegetation transpiration in different directions exhibited the same trend over time. The transpiration of branches on the north side was significantly greater than that on the other three sides. The mean transpiration values in different directions were calculated, and a Salix transpiration change curve was plotted from June 15 to October 15, as depicted in Figure 5b. The total transpiration of Salix during the study period was 67.47 mm, the average daily transpiration was 0.58 mm, and the maximum transpiration was 1.01 mm. Transpiration showed obvious differences between seasons, with an overall parabolic shape. The daily average transpiration volume in June and July was 0.45 mm. The transpiration volume began to increase significantly in August and peaked in early September. The daily average transpiration volume in August and September was 0.69 mm, and then, it began to decrease significantly in October.

3.3. Characteristics of Understory Evapotranspiration and Community Evapotranspiration in the Salix Shelterbelt

As depicted in Figure 6, during the study period, the daily evaporation values from the root neck to the periphery of the Salix shelterbelt were 0.81, 0.87, and 0.94 mm, which clearly showed a gradual increasing trend from the root neck of the shrub to the outside. This change trend was mainly affected by soil moisture. As shown in Figure 7, from 15 May to 30 September 2021, the average monthly transpiration of Salix was approximately 17.39 mm, with small fluctuations. The monthly average subcluster evapotranspiration was approximately 26.98 mm, with large fluctuations. Underground evapotranspiration was the dominant component of shrub community evapotranspiration, accounting for approximately 68.6% of the total water consumption. During the growing season, the changing dynamics of community evapotranspiration were basically synchronized with rainfall, showing unimodal change on the monthly scale. With the sudden increase in rainfall in August, the evapotranspiration under the cluster reached the maximum value in August. With underground evapotranspiration reaching its peak value, community evapotranspiration also reached its highest point during the year.

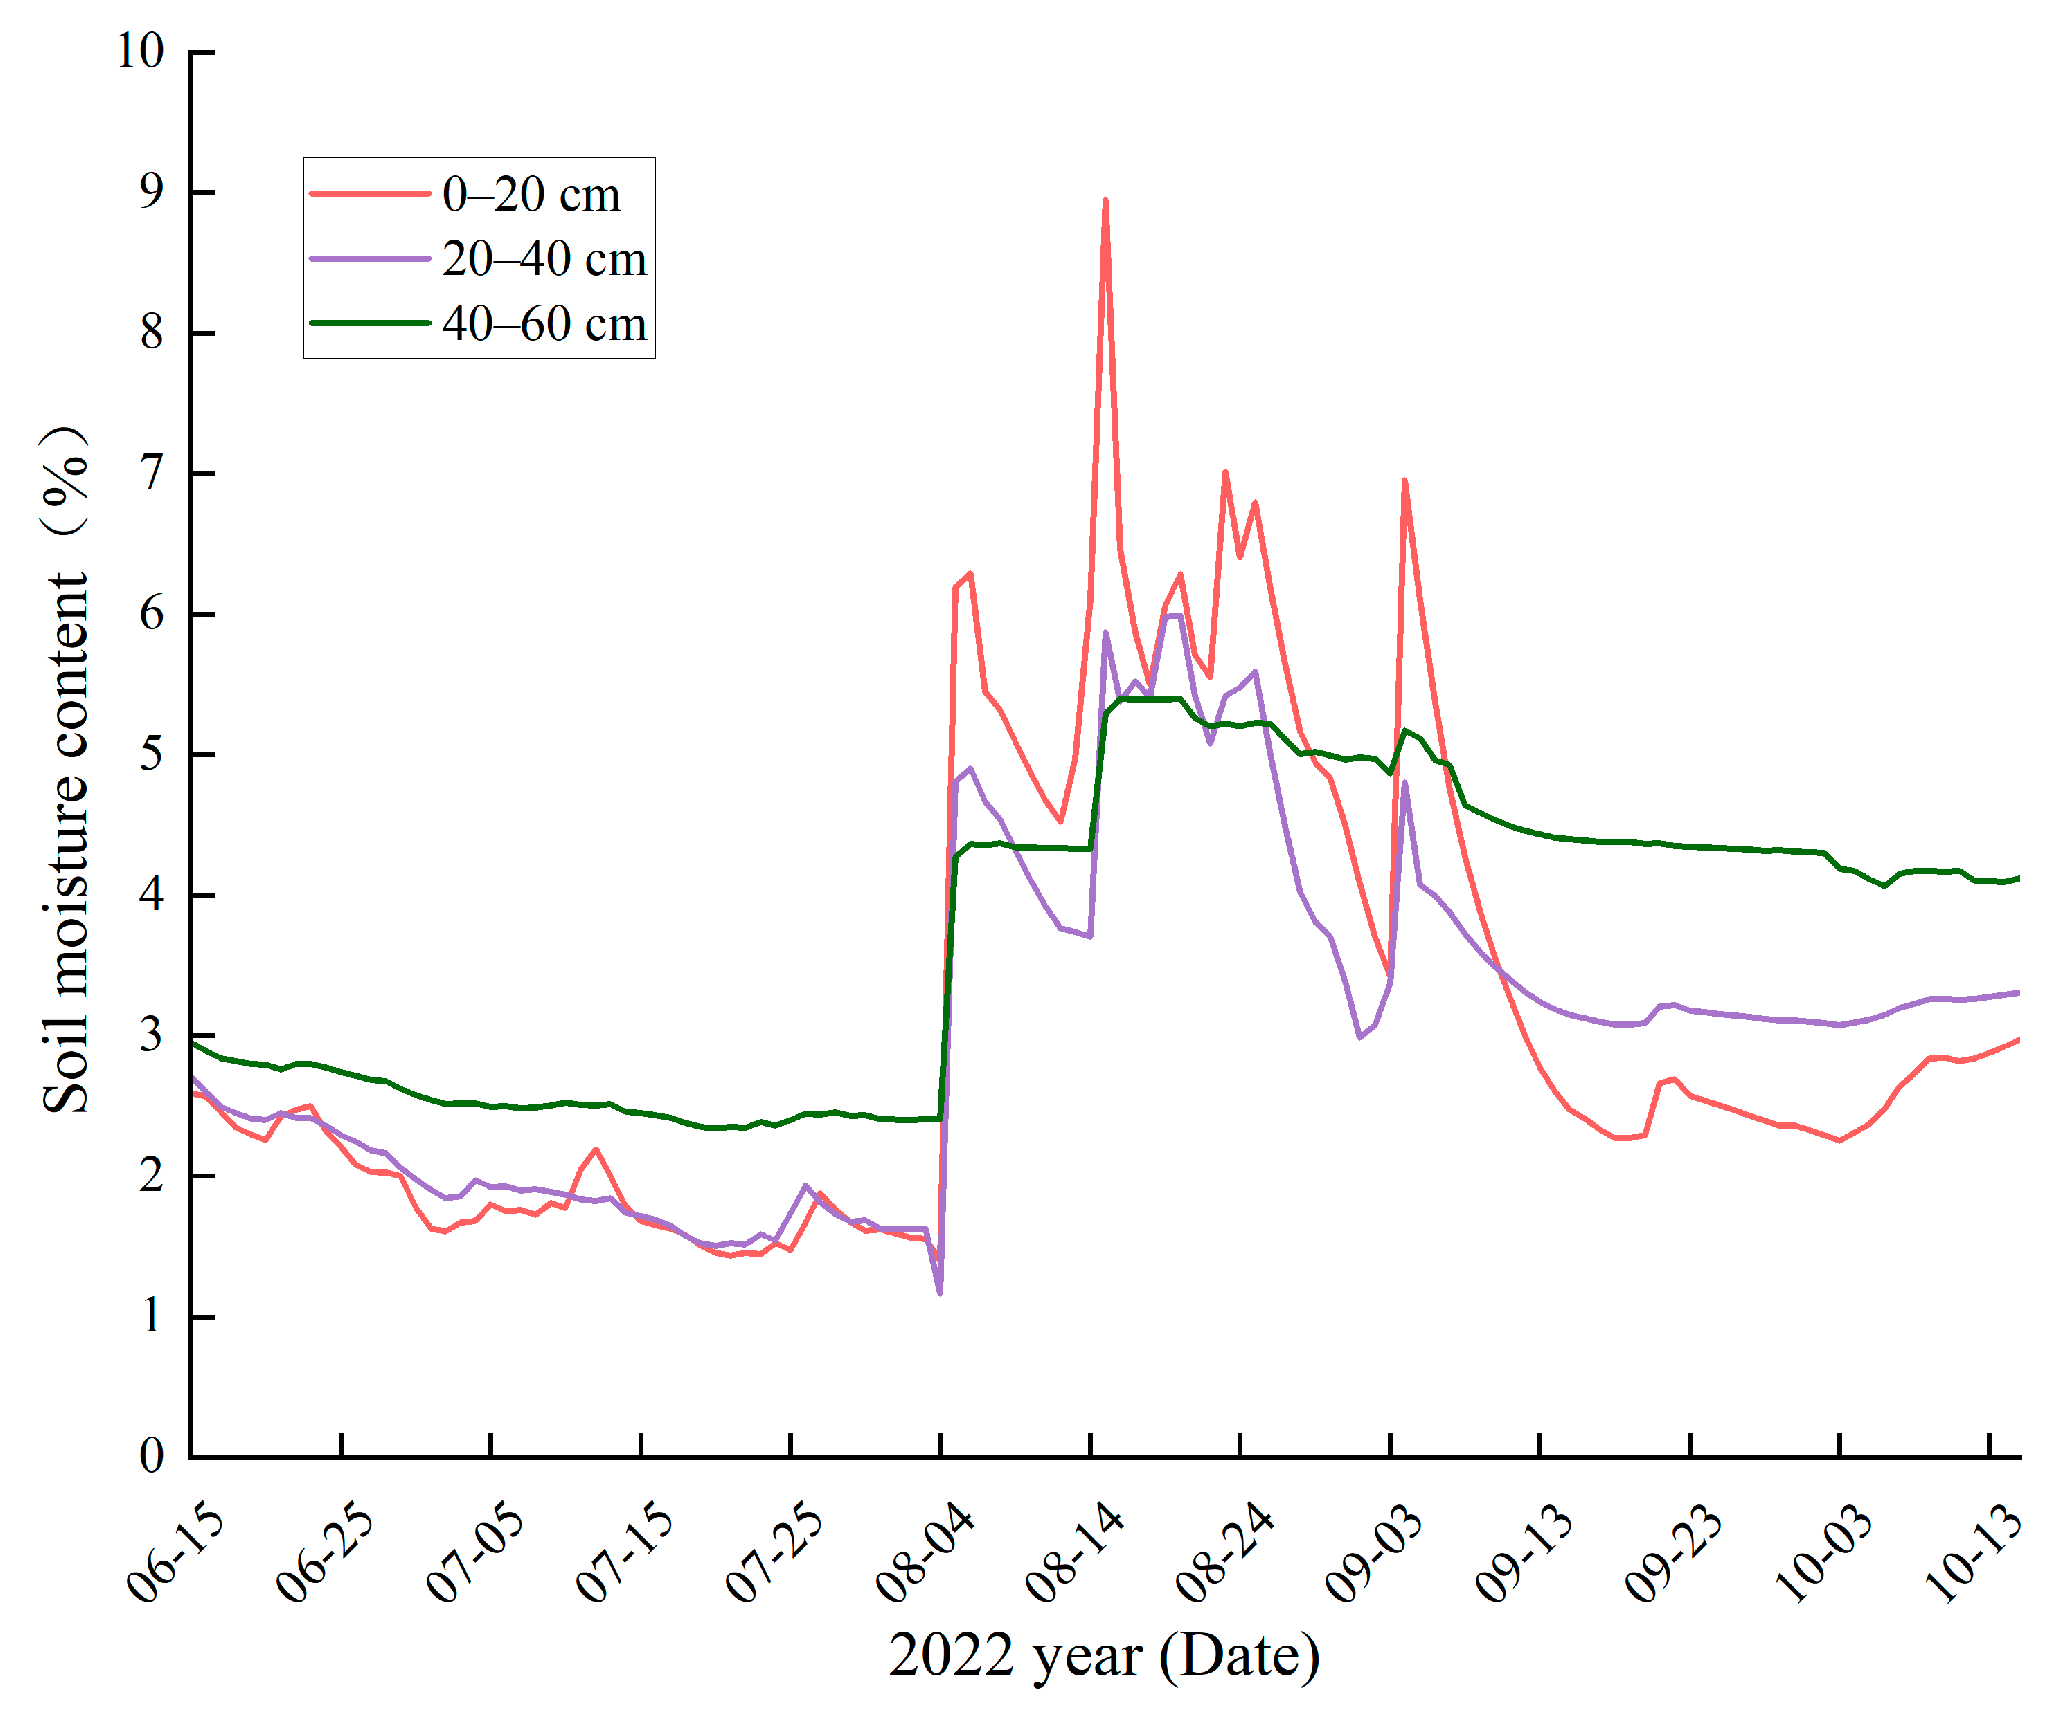
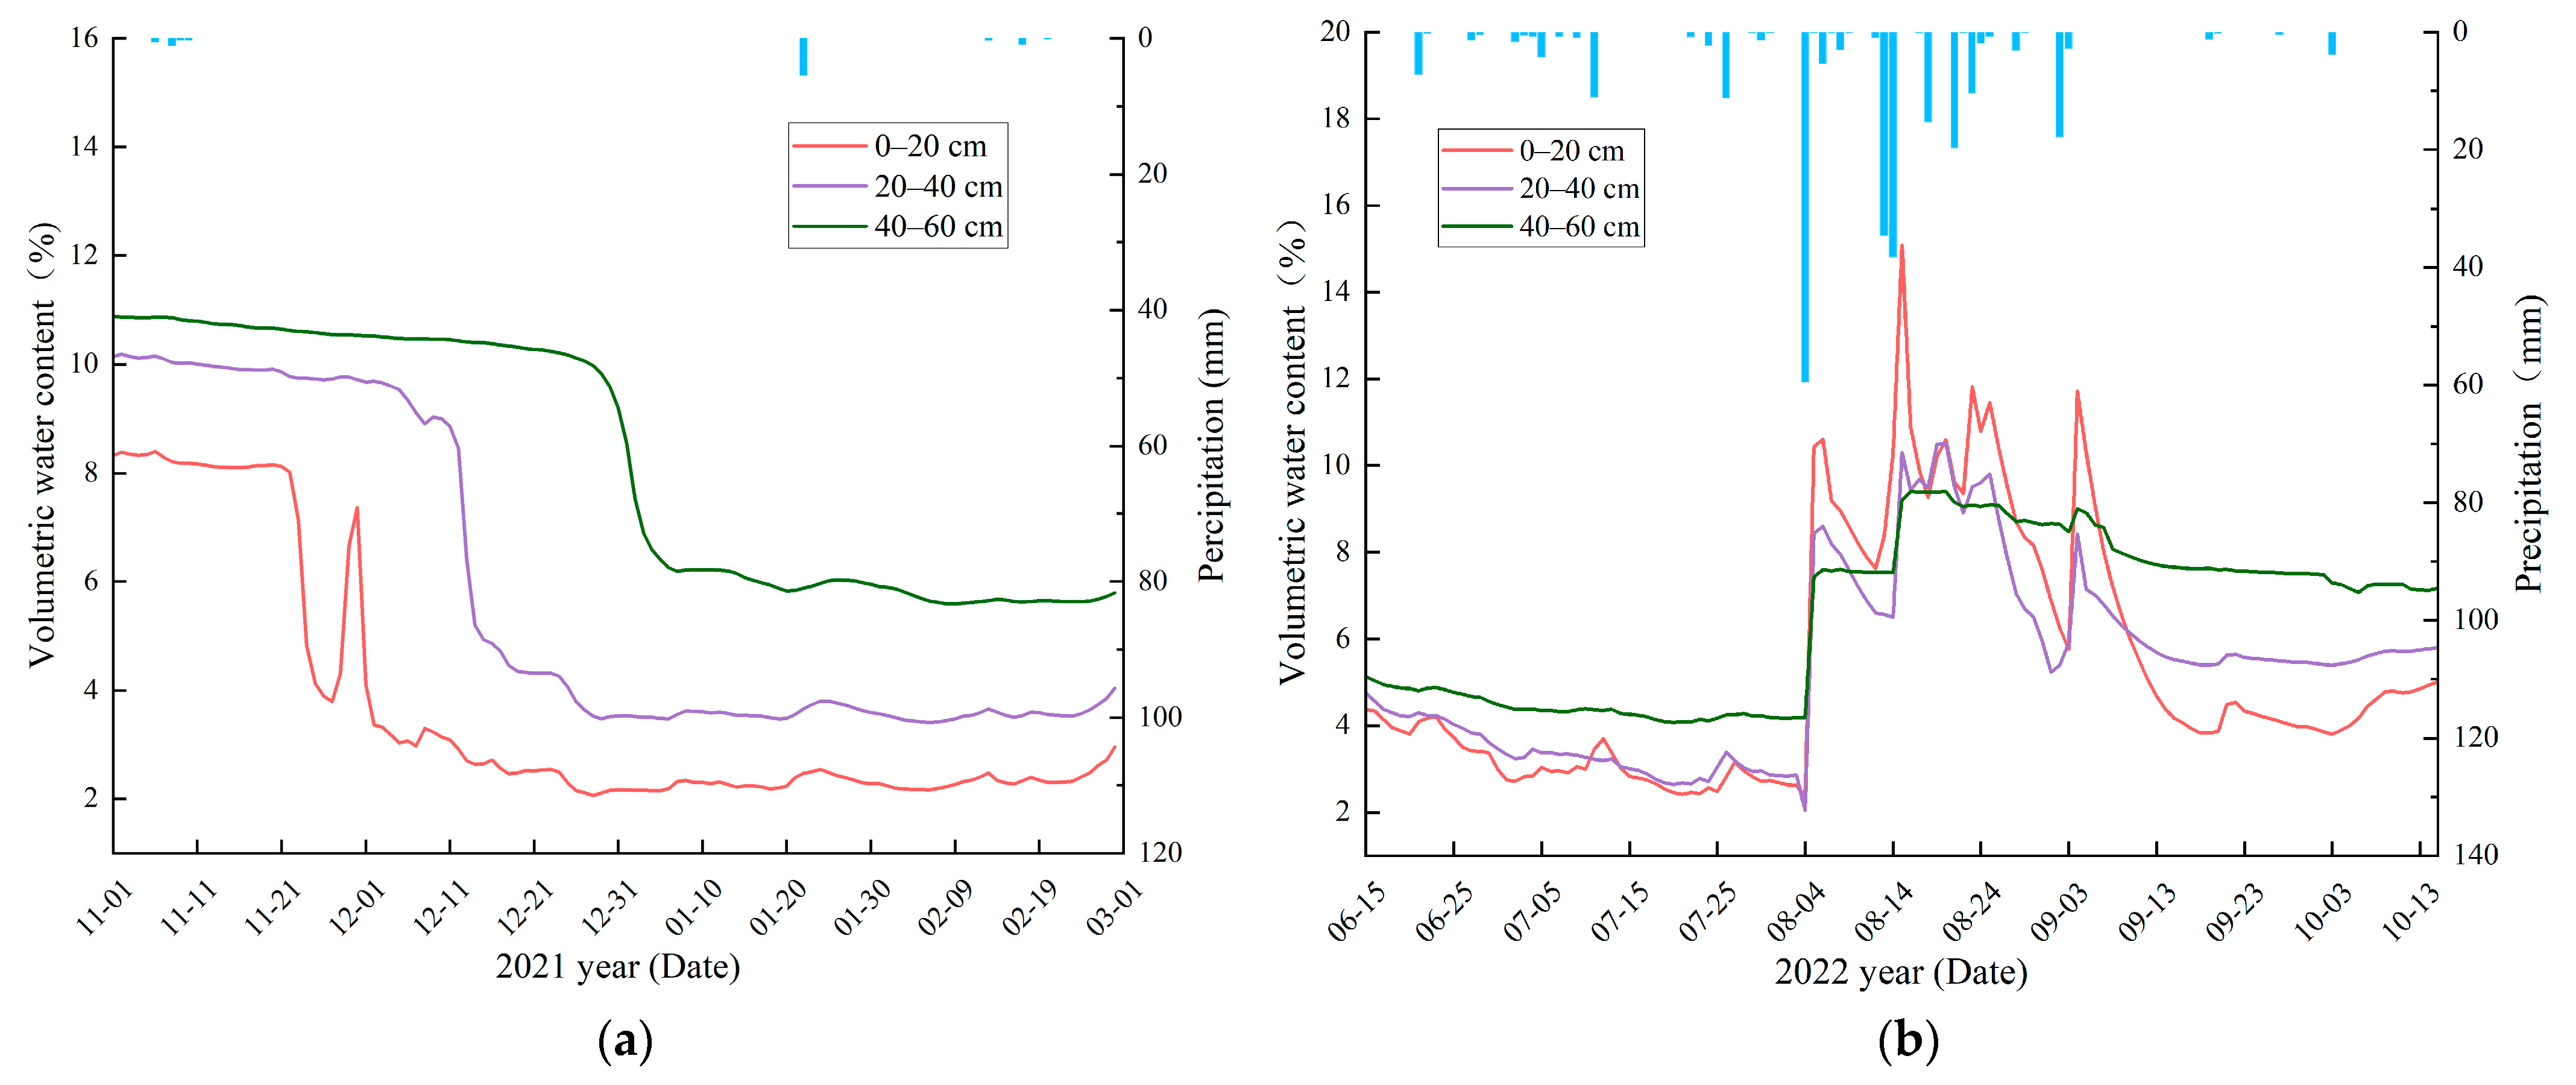
3.4. Soil Moisture Characteristics of the Salix Shelterbelt

A ring–knife experiment was conducted on the local soil properties. The results are in Table 2. From Table 2, we can see that the soil bulk density basically shows an upward trend as soil depth increases, and the total porosity gradually decreases with soil depth, which indicates that the vegetation roots have a certain soil-fixing ability. At the same time, as the soil depth increases, the saturated water-holding capacity of the soil gradually decreases, which indicates that the deep soil has better water permeability and can spread to the deeper soil.
The changes in soil moisture content of the Salix plantation in 2022 are shown in Figure 8. It can be seen that, from June to early August, the soil moisture content gradually increases as the soil layer deepens. This may be due to the drier weather. The surface soil is subject to strong solar radiation and is more likely to evaporate water, while the deeper soil avoids direct sunlight. At the same time, the roots of vegetation protect a certain amount of water, thus showing higher soil moisture content. From August to September, the soil moisture content of each layer was affected by rainfall and showed strong fluctuations. At this time, the soil moisture content of 0–20 cm soil was higher than that of 40–60 cm soil. After September, the soil moisture content gradually returned to a trend of increasing with soil depth.
The changes in soil moisture in the Salix plantation in the winter of 2021 are shown in Figure 9a. It can be observed that the soil moisture content showed a significant downward trend from November to December. This may be due to very low temperatures, low temperatures, and frost in December. The water in the soil freezes, causing the soil moisture content to plummet. At the same time, the soil moisture content was basically stable from December to March of the next year, and a small amount of snowfall did not have a significant impact on the soil moisture content. From the perspective of different soil layers, the 40–60 cm soil layer has the highest water content, and the 0–20 cm soil layer has the lowest water content. This may be because the Salix root system is mainly distributed at 40–60 cm, and the root system absorbs soil water, causing the deep soil water content to be higher. This may also be caused by the accumulation of rainfall that penetrates into the deep layers and is not easily discharged.
Figure 9b shows the changes in soil moisture in the summer of 2022. From June to July, there was less precipitation and higher temperatures. At this time, all layers of the soil were in a state of water consumption, showing a gradual downward trend. Among them, the 40–60 cm soil layer was less affected by solar radiation than the other layers, so it declined slowly. At this time, the deep soil moisture content was greater than the surface soil moisture content, and the forest soil was under drought stress. The soil moisture recovery period occurred during August and September. With the increase in precipitation in August, rainfall infiltration exceeded evapotranspiration water consumption, and the soil moisture content fluctuated significantly. The soil moisture content in the 0–20 cm and 20–40 cm layers fluctuated the most, with the highest soil moisture content of 14.9% occurring on August 14. At this time, the surface soil moisture content was higher than the deep soil moisture content until the rainfall decreased, and the deep soil moisture content exceeded the surface soil moisture content again in mid-September. Moreover, the changes in the soil moisture content in each soil layer were slightly delayed after rainfall, which may be due to interception or because water is first supplied to vegetation and subsequently recharges the soil moisture.

3.5. Water Balance and Runoff Characteristics of the Salix Shelterbelt

The water balance results for the Salix shelterbelt from June to October 2022 are presented in Table 3. During the study period, the total precipitation of the forestland was 263.2 mm; the average humidity index was 62.26%; the total evapotranspiration of the forestland was 185.62 mm, of which canopy interception accounted for 12.31%; stand transpiration accounted for 36.82%; and forestland evapotranspiration accounted for 51.71%. The evapotranspiration was 77.58 mm lower than the precipitation during the same period. It can be seen from the changes in each stage that precipitation affects air humidity changes and evapotranspiration. The results showed that soil water storage had a net increase of 1.72 mm, that water exchanged from the study soil layer to the deep layer or in the lateral direction during a certain period was 75.86 mm (Q), and that the net water yield was 77.58 mm, indicating that forestland made a positive contribution to slope and regional runoff.
The results show that forestland water loss occurred in August when the rainfall was as high as 192.6 mm, which directly alleviated the forestland water deficit in the previous period. The rainfall in other months was lower, and the forestland experienced a water deficit, requiring additional water input to maintain the water balance of the forestland. During the study period, the additional water input was approximately 42.83 mm, and the final net runoff was approximately 77.58 mm. This shows that the water replenishment of forestland in arid areas mainly comes from heavy rain or heavy rainfall events in the rainy season.

4. Discussion

4.1. Analysis of Forestland Precipitation Redistribution Characteristics

The redistribution of rainfall by the forest canopy is a dynamic and complex process. Factors such as substructures, rainfall characteristics [32,33], and local microclimates [34] all have certain impacts. Among these factors, rainfall characteristics outside the forest are among the core influencing factors [35]. Research shows that penetrating rain and stemflow generally account for 70% to 90% of rainfall outside the forest [36]. During the study period (6.15–10.30), penetrating rain, stemflow, and canopy interception in the Salix forest accounted for 88.64%, 2.68%, and 8.68%, respectively, of the total precipitation, which is similar to the conclusions of Levia [37].
Through regression analysis and curve fitting, rainfall was shown to be positively correlated with throughfall, stemflow, and canopy interception. This finding is consistent with the conclusions of most related studies. The canopy interception rate exhibited a downward trend as a logarithmic function. This may be because, when the rainfall is low, the branches of the canopy trees can completely intercept the rainfall, and the interception rate is close to 100% [38]. As rainfall increases, the total rainfall gradually increases and eventually reaches the saturated canopy interception volume [39,40]. When the rainfall outside the forest continues to increase, the interception amount of the forest canopy itself will remain basically constant [41]. This means that small rainfall events are more likely to cause canopy interception losses than large rainfall events.

4.2. Analysis of Forestland Transpiration and Understory Evapotranspiration

Research shows that the stemflow of different plant species has significant diurnal and seasonal dynamic characteristics [42]. In this study, the total transpiration of Salix salix showed obvious differences between seasons during the study period. The transpiration increased significantly beginning in August, peaked in early September, and began to decrease significantly in October, indicating an overall parabolic shape. Studies have shown that a saturated water vapor pressure difference has a greater impact on vegetation transpiration than a constant water vapor pressure difference [43]. In this study, affected by heavy rainfall in August, vegetation increased transpiration to increase water absorption and nutrient uptake in the soil, and transpiration increased significantly. However, photosynthetically active radiation is also the main factor affecting stemflow [44]. In August, because of frequent rain and relatively weak solar radiation, the amount of Salix transpiration did not reach its peak in August. Dynamic changes in transpiration and environmental factors are not completely synchronized [45]. Therefore, maximum transpiration occurs in early September.

4.3. Analysis of the Total Evapotranspiration and Components of Salix

Given differences in meteorology, forest stands, soil characteristics, etc., it becomes difficult to directly compare differences in water balance between different regions. Therefore, we selected the main influential factors of the water balance for analysis and comparison. To facilitate comparisons between different studies, we expressed each water balance component as a proportion of precipitation during the same period, such as the canopy interception rate, the tree transpiration rate, the soil water storage change rate (soil water storage change/precipitation amount), and the yield flow rate. The following is a description of the total evapotranspiration and component characteristics of the Salix shelterbelt in the Kubuqi Desert during the growing season:
The total evapotranspiration in the Kubuqi Desert Salix shelterbelt growing season (June–October 2022) was 185.62 mm, which was 77.58 mm (29.5%) lower than the precipitation in the same period (263.20 mm). The components and proportions of precipitation during the same period were as follows: forest evapotranspiration, 94.43 mm (35.88%); forest stand transpiration, 68.34 mm (25.97%); and canopy interception, 22.85 mm (8.68%). Table 4 shows the evapotranspiration data for shrubs in different regions of the world. According to the table data, in 2006, the local forest stand had evapotranspiration greater than precipitation and was in a state of water deficit. However, after the long-term maintenance of the forestland and the adaptation of tree species, although rainfall declined at this stage, the vegetation basically ensured normal growth. The evapotranspiration value of the Salix in this study was similar to that of the Salix in the Mu Us Desert and the Creosotebush in the Santa Rita Experimental Range (which lies entirely within the Sonoran Desert) but significantly lower than that of the Salix community on the Loess Plateau and in the Yanchi area of Ningxia. This may be due to dry climate conditions that reduce evapotranspiration in vegetation to retain more water for its growth. In addition, the proportions of the average evapotranspiration components in the Mu Us Desert to the average precipitation in the same period are as follows: understory evapotranspiration, 89.03 mm (31.74%); canopy interception, 47.69 mm (17%); and stand transpiration, 43.24 mm (15.41%). The ranking of evapotranspiration is slightly different from this study, which may be due to density, meteorological factors, and other factors, which results in less transpiration in forest trees in the Mu Us Desert [46]. Moreover, we can see that evapotranspiration is greater than precipitation in the Loess Plateau and the Chihuahuan Desert, which indicates that, in addition to relying on rainfall, local vegetation also needs other water supply channels to ensure vegetation growth.

4.4. Soil Water Storage Change Characteristics

The water storage capacity of soil profoundly affects the stability of ecosystems in response to drought. During periods of heavy rainfall, the soil in the root layer can store additional water to maintain the transpiration and growth of plants in the forest. This process is reflected in fluctuating changes in the soil moisture content. In this study, the total evapotranspiration of the Salix plantation during the growing season was 77.58 mm lower than the precipitation during the same period, but around August, the forestland experienced a water deficit (Q < 0), which was supplemented by additional water input. Since the additional water input was calculated based on the water balance, although the value may be affected by errors caused by the uneven spatial distribution of soil moisture, this did not affect our conclusion that there was water input from outside the sample plot. This conclusion is consistent with the conclusion reached by Liu et al. [54] in their study using isotope technology; i.e., plantations may utilize additional water sources.
The concentrated heavy rainfall in August caused the soil moisture in the forest to reach a peak. However, as shown in Figure 9b, the peak soil moisture content did not occur after the maximum rainfall in early August but instead occurred during the sub-maximum rainfall in mid-August. This may be because the soil moisture content is delayed because of excessive drought in the early stage. After the concentrated rainfall in August, although the soil did not reach a fully saturated state, in September and after, although the rainfall frequency was not high, the soil moisture content remained higher than before August.

4.5. Shelterbelt Water Balance and Runoff Impact

Given differences in the response of different soil layers to precipitation input and evapotranspiration output, these processes have varying degrees of impact on the drought resistance of a forest. Therefore, there are also differences in the time lags of different precipitation inputs and evapotranspiration outputs, which have been confirmed in the studies of Liu Wenhao and others [8]. Therefore, it is necessary to comprehensively consider all the factors to scientifically assess the forestland water balance.
The total precipitation in the 2022 growing season from June to October reached 263.2 mm. Notably, concentrated precipitation and heavy rainfall began to occur in August, causing the soil moisture content to reach a peak and the soil water storage to increase. The Q value shows that, except for Q > 0 in August, Q was negative in the other months. This shows that, except in August, the soil layer needs additional water input, and the yield is negative at this time. In fact, when we were in the sand digging a pit at the bottom of a willow (we carried out soil excavation and determined the location of the root system in order to bury the water content sensor), we found that soil at about 1 m deep was in a slightly moist state. This may be due to the recharge of groundwater or a phenomenon caused by water storage in the previous year. The counter-supply of groundwater at this time can ensure that the forest stand can still maintain normal evapotranspiration growth in June and July when there is less rainfall. When August comes, the heavy rainfall allows soil moisture to be exchanged deeply or laterally, thereby allowing the soil moisture to replenish water during later water shortages.
Overall, the low consumption of water in the study area makes it possible for the forestland to maintain its water balance throughout the growing season (for which the cumulative Q value is positive). Notably, our study mainly used the water balance method for calculation, so there may be some uncertainty in the results. To more accurately estimate the various components of the forestland water balance, future research on forest runoff and water input should be supplemented.

5. Conclusions

In this regard, this study conducted systematic quantitative monitoring at the Ordos Afforestation General Field in Dalat Banner, Kubuqi Desert; conducted an in-depth study of the hydrological process and soil moisture changes in the Salix shelterbelt during the growing season; and comprehensively evaluated its water balance characteristics, drawing the following conclusions:
  • According to this research, the Salix forest in the Kubuqi Desert is basically in a state of water balance during the growing season, and the forestland has made a positive contribution to improving the desert climate and water conservation.
  • In the future, appropriate irrigation treatments can be applied in June and July to meet the needs of healthier Salix forest growth.
However, this study still has many limitations: the influence of groundwater factors was not considered, and the internal research on vegetation was not in-depth enough. Future research will further study the photosynthetic characteristics and physiological characteristics of Salix vegetation, expand research on groundwater issues, and further analyze the reasons why it thrives in arid environments.

Author Contributions

Conceptualization, data curation, writing—original draft preparation, Q.H.; Conceptualization and manuscript revision, K.S.; supervision, H.W.; writing–reviewing and editing, Z.P.; software, H.C. and J.Y.; investigation, X.S. All authors have read and agreed to the published version of the manuscript.

Funding

This research was funded by the National Natural Science Foundation of China, grant number 52069018; the Science and Technology Major Project of Inner Mongolia, grant number 2020ZD0009; the Science and Technology Plan Project of the Inner Mongolia Autonomous Region, grant number 2020GG0078; and the Natural Science Foundation of the Inner Mongolia Autonomous Region, grant number 2023QN03029.

Data Availability Statement

The content and analysis of this article have included most of the data. Since the research area belongs to the Ordos Afforestation Base and is a nationally recognized research base for returning sand to forest, we are unable to directly disclose the data due to cooperation issues. But if readers want to know more, please contact the first author ([email protected]) or corresponding author via email, and we will transfer the relevant data according to the reader’s needs.

Conflicts of Interest

The authors declare no conflicts of interest.

References

  1. Cui, X.H.; Que, X.E.; Yang, L. Current status and thoughts on international standardization in the field of mitigating land degradation and combating desertification. Sci. Soil Water Conserv. 2020, 18, 147–152. [Google Scholar] [CrossRef]
  2. Schwärzel, K.; Zhang, L.; Montanarella, L.; Wang, Y.; Sun, G. How afforestation affects the water cycle in drylands: A process-based comparative analysis. Glob. Chang. Biol. 2020, 26, 944–959. [Google Scholar] [CrossRef]
  3. Shen, Q.; Gao, G.; Fu, B.; Lü, Y. Responses of shelterbelt stand transpiration to drought and groundwater variations in an arid inland river basin of Northwest China. J. Hydrol. 2015, 531, 738–748. [Google Scholar] [CrossRef]
  4. Naithani, K.J.; Ewers, B.E.; Pendall, E. Sap flux-scaled transpiration and stomatal conductance response to soil and atmos pheric drought in a semi-arid sagebrush ecosystem. J. Hydrol. 2012, 464–465, 176–185. [Google Scholar] [CrossRef]
  5. Du, A.P.; Yu, P.T.; Wang, Y.H.; Yuan, Y.X.; Guo, M.C.; He, C.Q.; Guan, W. The soil physical characteristics in the small watershed of Diediegou located on the north side of Liupan Mountains. For. Res. 2006, 19, 547–554. [Google Scholar]
  6. Li, M.Y.; Zhang, J.J.; Wang, C.X. Effects of land use types on soil physical properties in Loess Plateau of Western Shanxi. J. Soil Water Conserv. 2013, 27, 125–130. [Google Scholar]
  7. Qian, D. Transpiration Characteristics and Water Balance of a Mixed Shrubland in Mu Us Desert. Ph.D. Thesis, Beijing Forestry University, Beijing, China, 2016. [Google Scholar]
  8. Liu, W.H.; Wang, X.; Duan, W.B.; Yu, P.T.; Wang, Y.H. Water balance characters of Pinus tabuliformis plantation in Xining city of China. Sci. Silvae Sin. 2023, 59, 46–56. [Google Scholar]
  9. Dugas, W.A.; Hicks, R.A.; Gibbens, R.P. Structure and function of C3 and C4 Chihuahuan Desert plant communities. Energy balance components. J. Arid Environ. 1996, 34, 63–79. [Google Scholar] [CrossRef]
  10. Barbour, M.M.; Hunt, J.E.; Walcroft, A.S.; Rogers, G.N.D.; McSeveny, T.M.; Whitehead, D. Components of ecosystem evaporation in a temperate coniferous rainforest, with canopy transpiration scaled using sapwood density. New Phytol. 2005, 165, 549–558. [Google Scholar] [CrossRef]
  11. Batra, N.; Islam, S.; Venturini, V.; Bisht, G.; Jiang, L. Estimation and comparison of evapotranspiration from MODIS and AVHRR sensors for clear sky days over the Southern Great Plains. Remote Sens. Environ. 2006, 103, 1–15. [Google Scholar] [CrossRef]
  12. Scott, R.L.; Huxman, T.E.; Williams, D.G.; Goodrich, D.C. Ecohydrological impacts of woody-plant encroachment: Seasonal patterns of water and carbon dioxide exchange within a semiarid riparian environment. Glob. Chang. Biol. 2006, 12, 311–324. [Google Scholar] [CrossRef]
  13. Kurc, S.A.; Small, E.E. Dynamics of evapotranspiration in semiarid grassland and shrubland ecosystems during the summer monsoon season, central New Mexico. Water Resour. Res. 2004, 40, W09305. [Google Scholar] [CrossRef]
  14. Zhang, S.; Yu, P.; Wang, Y.; Zhang, H.; Valentina, K.; Huang, S.; Xiong, W.; Xu, L. Estimation of actual evapotranspiration and its components in the upper reaches of the Jinghe River. Acta Geogr. Sin. 2011, 66, 385–395. [Google Scholar]
  15. Vincke, C.; Thiry, Y. Water table is a relevant source for water uptake by a scots pine (Pinus sylvestris L.) stand: Evidences from continuous evapotranspiration and water table monitoring. Agric. For. Meteorol. 2008, 148, 1419–1432. [Google Scholar] [CrossRef]
  16. Joffre, R.; Rambal, S. How Tree Cover Influences the Water Balance of Mediterranean Rangelands. Ecology 1993, 74, 570–582. [Google Scholar] [CrossRef]
  17. Gerten, D.; Schaphoff, S.; Haberlandt, U.; Lucht, W.; Sitch, S. Terrestrial vegetation and water balance—Hydrological evaluation of a dynamic global vegetation model. J. Hydrol. 2004, 286, 249–270. [Google Scholar] [CrossRef]
  18. Shawn, M.C.; Solomon, Z.D.; Greenberg, J.A. Changes in climatic water balance drive downhill shifts in plant species’ optimum elevations. Science 2011, 331, 324–327. [Google Scholar]
  19. Dai, J. Application of SWAT Model in the Study of Water Balance of Forest and Grass Systems in Red Soil Hilly Areas in Northeastern Jiangxi. Master’s Thesis, Huazhong Agricultural University, Wuhan, China, 2004. [Google Scholar]
  20. Yu, X.; Zhang, J. Analysis and evaluation of soil water conditions of protective forest ecosystems in loess areas. For. Sci. 1996, 4, 289–297. [Google Scholar]
  21. Li, Y. Research on Characteristics of Typical Plantations and Soil Moisture Dynamics in the Loess Area of Western Shanxi. Ph.D. Thesis, Beijing Forestry University, Beijing, China, 2021. [Google Scholar] [CrossRef]
  22. Tao, J.L. Thinking and prospect of “three-north” shelterbelt system project. For. Sci. Technol. Inf. 2020, 52, 95–96. [Google Scholar]
  23. Levia, D.F.; Germer, S. A review of stemflow generation dynamics and stemflow-environment interactions in forests and shrublands. Rev. Geophys. 2015, 53, 673–714. [Google Scholar] [CrossRef]
  24. Lindroth, A.; Cermak, J.; Kucera, J.; Cienciala, E.; Eckersten, H. Sap flow by the heat-balance method applied to small-size salix trees in a short-rotation forest. Biomass Bioenergy 1995, 8, 7–15. [Google Scholar] [CrossRef]
  25. Cermak, J.; Kucera, J.; Nadezhdina, N. Sap flow measurements with some thermodynamic methods, flow integration within trees and scaling up from sample trees to entire forest stands. Trees 2004, 18, 529–546. [Google Scholar] [CrossRef]
  26. Ji, X.; Zhao, W.; Kang, E.; Jin, B.; Xu, S. Transpiration from three dominant shrub species in a desert-oasis ecotone of arid regions of Northwestern China. Hydrol. Process. 2016, 30, 4841–4854. [Google Scholar] [CrossRef]
  27. Duan, L.M.; Tong, X.; Lyu, Y. Upscaling of the transpiration and water consumption of sand-fixing vegetation Salix gordejevii and Caragana microphylla. J. Nat. Resour. 2018, 33, 52–62. [Google Scholar]
  28. Boast, C.W.; Robertson, T.M. A “micro-lysimeter” method for determining evaporation from bare soil: Description and laboratory evaluation. Soil Sci. Soc. Am. J. 1982, 46, 689–696. [Google Scholar] [CrossRef]
  29. Walker, G.K. Evaporation from wet soil surfaces beneath plant canopies. Agric. For. Meteorol. 1984, 33, 259–264. [Google Scholar] [CrossRef]
  30. Wei, N.N.; Mu, Y.M.; Jiang, X.Y.; Jia, X.; Gao, S.J.; Jiang, Y.; Jin, C.; Han, C.; Zha, T.S. Partitioning of evapotranspiration and the influencing factors of evapotranspiration components in a shrub ecosystem dominated by Artemisia ordosica and Hedysarum fruticosum var. mongolicum in the Mu Us Desert, Northwest China. Ying Yong Sheng Tai Xue Bao 2021, 32, 2407–2414. [Google Scholar] [CrossRef] [PubMed]
  31. Ma, L.L.; Du, L.T.; Dan, Y.; Wang, L.; Qiao, C.L.; Wu, H.Y. Characteristics of evapotranspiration in planted shrub communities in desert steppe zone based on sap flow and lysimeter methods. Chin. J. Plant Ecol. 2022, 44, 807. [Google Scholar] [CrossRef]
  32. Crockford, R.H.; Richardson, D.P. Partitioning of rainfall into throughfall, stemflow and interception: Effect of forest type, ground cover and climate. Hydrol. Process. 2000, 14, 2903–2920. [Google Scholar] [CrossRef]
  33. Cuartas, L.A.; Tomasella, J.; Nobre, A.D.; Hodnett, M.G.; Waterloo, M.J.; Múnera, J.C. Interception water-partitioning dynamics for a pristine rainforest in Central Amazonia: Marked differences between normal and dry years. Agric. For. Meteorol. 2007, 145, 69–83. [Google Scholar] [CrossRef]
  34. Gash, J.H.C.; Wright, I.R.; Lloyd, C.R. Comparative estimates of interception loss from three coniferous forests in Great Britain. J. Hydrol. 1980, 48, 89–105. [Google Scholar] [CrossRef]
  35. Chang, M. Forest Hydrology: An Introduction to Water And Forests; CRC Press: Boca Raton, FL, USA, 2006. [Google Scholar]
  36. Levia, D.F.; Frost, E.E. A review and evaluation of stemflow literature in the hydrologic and biogeochemical cycles of forested and agricultural ecosystems. J. Hydrol. 2003, 274, 1–29. [Google Scholar] [CrossRef]
  37. Llorens, P.; Domingo, F. Rainfall partitioning by vegetation under Mediterranean conditions: A review of studies in Europe. J. Hydrol. 2007, 335, 37–54. [Google Scholar] [CrossRef]
  38. Cheng, R.R. Eco-hydrological Processes in Two Typical Natural Forests and Artificial Forests in the Loess Hilly Region of China. Ph.D. Thesis, University of Chinese Academy of Sciences, Beijing, China, 2020. [Google Scholar] [CrossRef]
  39. Li, C.X.; Ouyang, Z.Y.; Zheng, H.; Liu, X.L.; Su, Y.M. Comparison of Rainfall Redistribution in Two Ecosystems in Minjiang Upper Catchments, China. J. Plant Ecol. 2006, 30, 723–731. [Google Scholar]
  40. Gerrits, M.J.; Pfister, L.; Savenije, H.H.G. Spatial and temporal variability of canopy and forest floor interception in a beech forest. Hydrol. Process. 2010, 24, 3011–3025. [Google Scholar] [CrossRef]
  41. Dang, H.Z.; Dong, T.S.; Zhao, Y.S. Study on Canopy Interception of Fraxinus mandshurica. For. Res. 2008, 21, 657–661. [Google Scholar]
  42. Lagergren, F.; Lindroth, A. Transpiration response to soil moisture in pine and spruce trees in Sweden. Agric. For. Meteorol. 2002, 112, 67–85. [Google Scholar] [CrossRef]
  43. Li, W.; Si, J.H.; Feng, Q. Response of transpiration to water vapour pressure defferential of Populus euphratic. J. Desert Res. 2013, 33, 1377–1384. [Google Scholar]
  44. Guo, Y.; Dong, Y.; Zhou, Z.F. The sap flow of corn during the growth period and its response to meteorological factors in semi-arid area. J. Arid. Land Resour. Environ. 2014, 28, 94–99. [Google Scholar] [CrossRef]
  45. O’Grady, A.P.; Worledge, D.; Battaglia, M. Constraints on transpiration of Eucalyptus globulus in southern Tasmania, Australia. Agric. For. Meteorol. 2008, 148, 453–465. [Google Scholar] [CrossRef]
  46. An, H.; An, Y. Soil moisture dynamics and water balance of Salix psammophila shrubs in south edge of Mu Us Sandy Land. Chin. J. Appl. Ecol. 2011, 22, 2247–2252. [Google Scholar] [CrossRef]
  47. Tang, D. Research on Water Consumption Characteristics of Main Shrub Species in Kubuqi Sandy Land. Master’s Thesis, Beijing Forestry University, Beijing, China, 2007. [Google Scholar]
  48. Cheng, X.R. Water Transformation and Simulation of Soil-Artificial Vegetation-Atmospheretransfer in the Farming-Pastoral Zone of the Loess Plateau. Ph.D. Thesis, Graduate University of Chinese Academy of Sciences, Beijing, China, 2008. [Google Scholar]
  49. Yang, X.L. Characteristics of Rainfall Redistribution and Evapotranspiration for Typical Shrub Species on the Northern Loess Plateau. Ph.D. Thesis, Northwest A & F University, Xianyang, China, 2016. [Google Scholar]
  50. Yang, Q. Effect of Rainfall on Transpiration of Artemisia Ordosica and Salix Psammophila in the Mu Us Desert. Master’s Thesis, Beijing Forestry University, Beijing, China, 2016. [Google Scholar]
  51. Tian, Y. Study on Water Consumption Characteristics of Trees and Structure Installation of Protection Forest in Yanchi Sandy Land. Ph.D. Thesis, Beijing Forestry University, Beijing, China, 2010. [Google Scholar]
  52. Cavanaugh, M.L.; Kurc, S.A.; Scott, R.L. Evapotranspiration partitioning in semiarid shrubland ecosystems: A two-site evaluation of soil moisture control on transpiration. Ecohydrology 2011, 4, 671–681. [Google Scholar] [CrossRef]
  53. Scott, R.L.; Huxman, T.E.; Cable, W.L.; Emmerich, W.E. Partitioning of evapotranspiration and its relation to carbon dioxide exchange in a Chihuahuan Desert shrubland. Hydrol. Process. 2006, 20, 3227–3243. [Google Scholar] [CrossRef]
  54. Liu, Z.Q.; Yu, X.X.; Deng, W.P.; Jia, G.D.; Lou, Y.H.; Li, H.Z. Water sources of Pinus tabuliformis and Platycladus orientalis before and after rain in Northern China. Sci. Soil Water Conserv. 2016, 14, 111–119. [Google Scholar] [CrossRef]
Figure 1. Map of the Caositan Forestry Station.
Forests 15 00278 g001
Figure 2. Arrangement of throughfall and stemflow equipment.
Forests 15 00278 g002
Figure 3. Details of the EMS62 equipment.
Forests 15 00278 g003
Figure 4. The correlation between rainfall redistribution and rainfall amount. (A) The correlation between rainfall amount and throughfall. (B) The correlation between rainfall amount and stemflow. (C) The correlation between rainfall amount and interception loss. (D) The correlation between rainfall amount and throughfall percentage. (E) The correlation between rainfall amount and stemflow percentage. (F) The correlation between the rainfall amount and interception loss percentage.
Forests 15 00278 g004aForests 15 00278 g004b
Figure 5. (a) Salix transpiration from branches oriented in different directions. (b) The correlation between transpiration and date.
Forests 15 00278 g005
Figure 6. Understory evapotranspiration of Salix reservoir at different locations (Among them, capital letters represent the differences between groups in different time periods, and lowercase letters represent the differences within groups between different distances in each group of time periods).
Forests 15 00278 g006
Figure 7. Evapotranspiration and precipitation during the observation period.
Forests 15 00278 g007
Figure 8. Changes in the soil moisture content in each soil layer of the Salix shelterbelt in 2022.
Forests 15 00278 g008
Figure 9. Changes in the soil water content and precipitation in each soil layer of the Salix shelterbelt in 2021 (a) and 2022 (b).
Forests 15 00278 g009
Table 1. Rainfall redistribution characteristics in different months.
MonthTimesRainfall
/mm
ThroughfallStemflowCanopy Interception
Depth/mmRatio/(%)Depth/mmRatio/(%)Depth/mmRatio/(%)
6.15–6.3049.17.481.320.2322.541.46816.14
71135.330.185.271.0342.934.16611.80
812192.6173.790.194.6902.4414.2107.38
9522.418.883.931.0394.642.56111.43
1013.83.386.840.0601.570.44011.58
Sum33263.2233.388.647.0552.6822.8458.68
Table 2. Soil water-holding capacity characteristics.
Soil LayerSoil Bulk Density
(g/cm3)
Total Voids (%)Capillary Porosity (%)Noncapillary Porosity (%)Saturated Water-Holding Capacity (t/hm2)Capillary Water Storage (t/hm2)Noncapillary Water Storage
(t/hm2)
0–20 cm1.68632.24230.7721.470644.834615.43429.400
20–40 cm1.75424.10922.3761.733482.182447.51534.667
40–60 cm1.74022.53721.0071.530450.743420.14330.600
60–80 cm1.78522.00519.8952.110440.103397.90342.200
average1.74125.22323.5121.711504.466470.24934.217
Table 3. Water balance and water yield of the 0–60 cm soil layer of the Salix shelterbelt during the growing season.
Date 2022 P/mm Wetness Index
/%
IL
/mm
T/mm ETunder/mm ET/mm Δ W /mm Q/mm Outside Input
/mm
Gross
Water Yield/mm
Net Water Yield/mm
6.15–6.309.152.201.476.527.6315.62−1.1−5.425.420−6.52
7.1–7.1519.764.862.516.7513.6822.94−0.28−2.962.960−3.24
7.16–7.3115.656.961.667.4310.9320.02−0.11−4.314.310−4.42
8.1–8.15141.574.3811.448.6210.7430.86.69104.010104.01110.7
8.16–8.3151.173.322.7710.0426.3439.15−2.7314.68014.6811.95
9.1–9.1520.664.671.6611.7915.4828.93−1.04−7.297.290−8.33
9.16–9.301.856.260.99.719.6320.24−0.11−18.3318.330−18.44
10.1–10.153.855.420.447.48-7.920.4−4.524.520−4.12
Total263.262.26 (Avg)22.8568.3494.43185.621.7275.8642.83118.6977.58
Table 4. Evapotranspiration data of shrubs in different regions.
Study AreaShrub SpeciesStudy TimeP/mmIL/mmT/mmETunder/mmET/mmET/mmReference
Kubuqi DesertSalix2022.6–10263.222.85 (8.68%)68.34 (25.97%)94.43 (35.88%)162.77185.62Our study
Kubuqi DesertSalix2006306-195.96 (64.03%)132.96 (43.45%)328.92-Tang [47]
Loess PlateauSalix2006.6–1028936.99 (12.80%)--282.9319.89Cheng [48]
2007.4–9302.338.69 (12.80%)--287.8326.49
2015.5–10303.678.03 (25.70%)--287.8365.83Yang [49]
Mu Us DesertSalix2013.5–1025743.69 (including stemflow)36.8 (14.32%)98.8 (38.44%)135.6179.29Qian [7]
2014.5–1030451.68 (including stemflow)49.68 (16.34%)79.25 (26.07%)128.93180.61
2015.5–9218.3-40.92 (18.74%)---Yang [50]
Yanchi Sandy land.Salix2006.5–10338.5-195.96 (57.89%)132.96 (39.28%)328.92-Tian [51]
SRERCreosotebush2008 (Day 200~285)259.6-54.7 (21.07%)92.4 (35.59%)147.1-Cavanaugh [52]
WGEWCreosotebush2008 (Day 205~273)211.8-44.5 (21.01%)57.7 (27.24%)102.2-Cavanaugh [52]
Chihuahuan DesertShrubland2003 (Day
185~315)
176-121 (68.75%)89 (50.57%)210-Scott [53]
The Santa Rita Experimental Range (SRER): the SRER lies entirely within the Sonoran Desert. The Walnut Gulch Experimental Watershed (WGEW): the WGEW is in the transition zone between the Sonoran and Chihuahuan Deserts.
Disclaimer/Publisher’s Note: The statements, opinions and data contained in all publications are solely those of the individual author(s) and contributor(s) and not of MDPI and/or the editor(s). MDPI and/or the editor(s) disclaim responsibility for any injury to people or property resulting from any ideas, methods, instructions or products referred to in the content.

