Article

Hydraulic Traits and Non-Structural Carbon Responses to Drought Stress in Reaumuria soongorica (Pall.) Maxim. and Salsola passerina Bunge

1
College of Forestry, Gansu Agricultural University, Lanzhou 730070, China
2
Wuwei Academy of Forestry, Wuwei 733000, China
3
College of Science, Gansu Agricultural University, Lanzhou 730070, China
*
Author to whom correspondence should be addressed.
Forests 2024, 15(2), 287; https://doi.org/10.3390/f15020287
Submission received: 19 December 2023 / Revised: 25 January 2024 / Accepted: 31 January 2024 / Published: 2 February 2024
(This article belongs to the Section Forest Hydrology)

Abstract

:
Drought-induced plant mortality, resulting from either hydraulic failure or carbon starvation, is hypothesized to be modulated by the drought intensity. However, there is a paucity of research investigating the response strategies in desert shrubs under drought stress with different intensities. We transplanted potted Reaumuria soongorica (Pall.) Maxim. and Salsola passerina Bunge seedlings in the rain-out shelter, and implemented three water treatments: a control (well-watered, CK), a chronic drought (gradually less watered, CD), and a flash drought (not watered, FD). We then quantified plant physiological traits associated with water use and carbon assimilation. Both R. soongorica and S. passerina showed similar changes in water use and carbon characteristics under different drought treatments. Water use efficiency was not significantly changed, but embolism resistance was significantly lower in CD, and leaf specific conductivity and embolism resistance were significantly lower in FD compared to CK. Under the drought treatment, both shrubs had significantly lower hydraulic safety margins than CK, with FD being significantly lower than CD. Notably, FD had lower carbon assimilation and a lower leaf non-structural carbon concentration, but higher stem non-structural carbon concentration. The results of a principal component analysis showed that net photosynthetic rate, sapwood specific conductivity, embolism resistance, midday water potential, and leaf and stem soluble sugar concentration were the main axes of variation for R. soongorica traits. CK had the highest water use efficiency, net photosynthetic rate, and gas exchange rate, while FD had the lowest embolism resistance and highest osmoregulation. Midday water potential, leaf and stem soluble sugar concentration were the main axes of variation for S. passerina traits, and individual distribution under three water treatments was associated with drought tolerance traits. The findings suggest that species exhibit different response strategies for resistance to drought stress, with R. soongorica being drought-avoidant and S. passerina being drought-tolerant. These findings highlight the adaptive capacity of desert shrubs to water deficit and provide insights for assessing hydraulic failure and carbon starvation in desert shrubs.

1. Introduction

Drought, as a pervasive environmental stressor, significantly curbs productivity across diverse terrestrial ecosystems [1,2]. The anticipated escalation in both the frequency and intensity of future droughts is poised to trigger widescale plant mortality [3,4]. Empirical findings substantiate that drought stress induces embolism within xylem conduits, severely impeding water transport, which subsequently triggers cellular dehydration and culminates in hydraulic failure, ultimately resulting in mortality [5]. This phenomenon typically manifests under high-intense but short-duration drought stress [6], while under less intense but longer-duration drought stress, plants experience diminished carbon assimilation, attributed to stomatal closure and limitations in carbon transport systems, and plant mortality may then occur due to carbon starvation triggered by the need to allocate resources towards infiltration and defense mechanisms [7,8]. Nevertheless, a scarcity of research in the literature exists regarding comparative analyses of water and carbon relationships in woody plants experiencing different drought intensities. Investigating the alterations in hydraulic traits and non-structural carbon across diverse drought intensities can provide insights into the risks of hydraulic failure and carbon starvation.
Stomatal regulation plays a crucial role as a conservation strategy employed by woody plants to mitigate the deleterious effects of drought stress [9]. By reducing stomatal conductance, plants effectively minimize water loss and postpone, though not completely prevent, the occurrence of hydraulic dysfunction within the xylem [10,11]. It has been reported that xylem refilling is a part of tree’s life [12,13], and it may repair embolized xylem through the mechanism, which is closely related to non-structural carbohydrates [14]. For instance, soluble sugars could adjust the osmotic pressure, subsequently driving water transport from functional conduits to embolic conduits [15,16]. A study result indicated that both mild and severe drought decreased soluble sugar and non-structural carbon concentrations, and increased starch concentration in all organs of Cunninghamia lanceolata seedlings [17]. However, Betula ermanii seedlings increased soluble sugar and non-structural carbon concentrations and decreased starch concentrations in all organs under drought stress because the plants responded to water deficit by increasing the conversion between starch and soluble sugars [18]. Furthermore, Robinia pseudoacacia L. seedlings had lower starch and NSC concentrations and higher soluble sugar concentrations under severe drought stress [19]. There is no consensus on the effects of different drought stresses on non-structural carbohydrates in seedlings.
Plant species vary in their capacity to withstand and adapt to drought stress, exhibiting diverse strategies [20,21]. The resistance of plants to drought stress can be broadly categorized into drought avoidance and drought tolerance [22,23,24]. Drought-avoidant species typically respond to reduced water availability by closing stomata early [22,25]. On the other hand, species with highly embolized xylem are capable of sustaining water transport even under more negative water potential conditions [26]. These species employ a preemptive strategy, closing stomata early in the drought period before any decline in water potential occurs [24]. In contrast, drought-tolerant species possess the ability to maintain photosynthesis under drought stress by concurrently reducing stomatal conductance and water potential until carbon availability becomes limited by stomatal closure. Drought tolerance involves mechanisms such as osmoregulation and resistance to embolization [27,28]. It is worth noting that current research on plant response strategies to drought predominantly focuses on tropical and subtropical regions [1,29], leaving a significant knowledge gap concerning drought tolerance strategies for plants in arid regions.
Reaumuria soongorica (Pall.) Maxim. and Salsola passerina Bunge emerge as prominent shrubs in the arid and semi-arid terrains of Northwest China [30], playing a pivotal role in shaping the successional trajectories of desert ecosystems [31]. Under diverse habitat conditions, R. soongorica exhibits a root system characterized by deeper distribution, in contrast to the shallower distribution observed in S. passerina [30]. Notably, two species manifest distinctive leaf habits under drought stress, with R. soongorica undergoing defoliation, while S. passerina remains non-defoliating. We investigated stem water use, xylem vulnerability to cavitation, and non-structural carbon response to drought in two shrub species, and measured their leaf water potential and leaf non-structural carbon. We aimed to provide insights into water and carbon variations in desert shrubs under varying drought conditions. We hypothesized that (1) chronic and flash droughts differentially impact desert shrubs, with flash droughts considered as extreme manifestations of drought stress, wherein water use efficiency and embolism resistance are significantly reduced, accompanied by an increase in non-structural carbon consumption in both shrubs, and (2) the drought response strategies of the two shrubs differed, with R. soongorica adopting a drought avoidance strategy and S. passerina adopting a drought tolerance strategy.

2. Materials and Methods

2.1. Plant Materials

R. soongorica seedlings were cultivated in the spring of 2020 in Zhangye, Gansu, China. S. passerina originated from the Gobi in Jingtai, Gansu, China. In March 2021, a total of 18 healthy and uniformly sized plants (9 per species) were transplanted into plastic flowerpots (30 cm diameter at the top, 18 cm diameter at the bottom, and 38 cm height) with drainage holes at the bottom. Each pot was filled with approximately 10 kg of a mixture of sandy loam and perlite (4:1), to improve soil air permeability with a field capacity of 17.41%. The sandy loam was sourced from the topsoil of the natural habitats of R. soongorica and S. passerina. The transplanted seedlings were placed under a rain-out shelter. The shelter was constructed of translucent material, and was used only for rain protection. Therefore, all the water in the plants came from the amount of watering under the different treatments.

2.2. Experimental Design

The experiment was conducted on the campus of Gansu Agricultural University, Lanzhou, Gansu, China. The drought treatments were initiated in August 2021. At this time, the average plant height of R. soongorica was 31.82 cm, the average basal diameter was 4.16 mm, and the crown spread was 1225.24 cm2. The average plant height of S. passerina was 26.85 cm, the average basal diameter was 4.20 mm, and the crown spread was 875.23 cm2. R. soongorica and S. passerina seedlings were randomly allocated to three water treatments: control (CK), chronic drought (CD), and flash drought (FD). There were 3 plants per treatment, totaling 9 plants for each species and 18 plants overall. In the control group, the gravimetric soil water content was consistently maintained at 80% of the field capacity. For shrubs in the chronic drought treatment, they were replenished with 60% of the water lost during the drying process. Watering ceased when the rewatering volume fell below 10 mL. In the case of the flash drought treatment, no additional watering was provided, and the shrubs were left to naturally experience drying conditions. The soil water content was controlled by weighing every other day.
All plant traits were assessed while subjecting them to drought stress for a duration of up to 37 days. This duration was chosen based on the findings of Tomasella et al. [14] on stem hydraulics of European beech seedlings. Their research revealed that after 36–66 days of prolonged and severe drought, the percentage loss of natural hydraulic conductivity in the seedlings reached approximately 88%. Typically, hydraulic failure and subsequent mortality are observed in angiosperm seedlings when they experience pressures exceeding an 88% loss of hydraulic conductivity [32]. We assessed the net photosynthetic rate of the shrubs and observed values exceeding zero.

2.3. Water Relations Measurement

2.3.1. Leaf Water Potential

Leaf water potential measurements (n = 3 per species per treatment) were conducted at predawn (4:00–6:00) and midday (12:00–14:00) on day 37, representing the maximum (ΨPD, MPa) and minimum (ΨMD, MPa), respectively. We measured leaf water potential on days 0, 7, 15, 27, and 37. For each measurement, a 10 cm twig with a leaf tip was measured using a pressure chamber (Model 1505D; PMS Instrument Company, Albany, OR, USA). Figure 1 shows the variation in predawn and midday leaf water potential.

2.3.2. Hydraulic Conductivity

The measurement of hydraulic conductivity requires that the stem length exceeds the maximum length of xylem conduits. To determine the maximum conduit length of R. soongorica and S. passerina branches, we employed the nitrogen gas injection method [33]. A total of 7–8 branches were selected for each species, and the average value was calculated. The maximum conduit length was found to be 23.5 cm for R. soongorica and 7.8 cm for S. passerina branches, respectively. Accordingly, we approximately harvested 30 cm sections of R. soongorica stems and 25 cm sections of S. passerina stems after leaf water potential was measured. These segments were wrapped in moist towels, sealed in a cooler, and promptly transported to the laboratory, where the temperature was maintained at 20–25 °C. Upon arrival, the ends of the stems were recut in distilled water, removing approximately 2–3 cm. Subsequently, the stem xylem hydraulic conductivity was measured using the low-pressure liquid flow method [34]. We selected a branch exhibiting evident xylem development from each seedling, yielding a sample size of three per species per treatment (n = 3). The branches were connected to the hydraulic conduction unit, ensuring that the direction of the injected flow consistently traveled from the base to the apex of the stem. A net water pressure of 5 kPa was applied to induce water flow through the branches, and the mass of water passing through the branches was measured over a period of 20 min. The natural hydraulic conductivity was calculated using the following equation:
K h   = ( m   ×   L ) / ( P   ×   t )
where Kh is the natural hydraulic conductivity, m is the mass of water flowing through the branch, t is the duration of the measurement (1200 s), P is the applied pressure (0.005 MPa), and L is the length of the measurement sample.

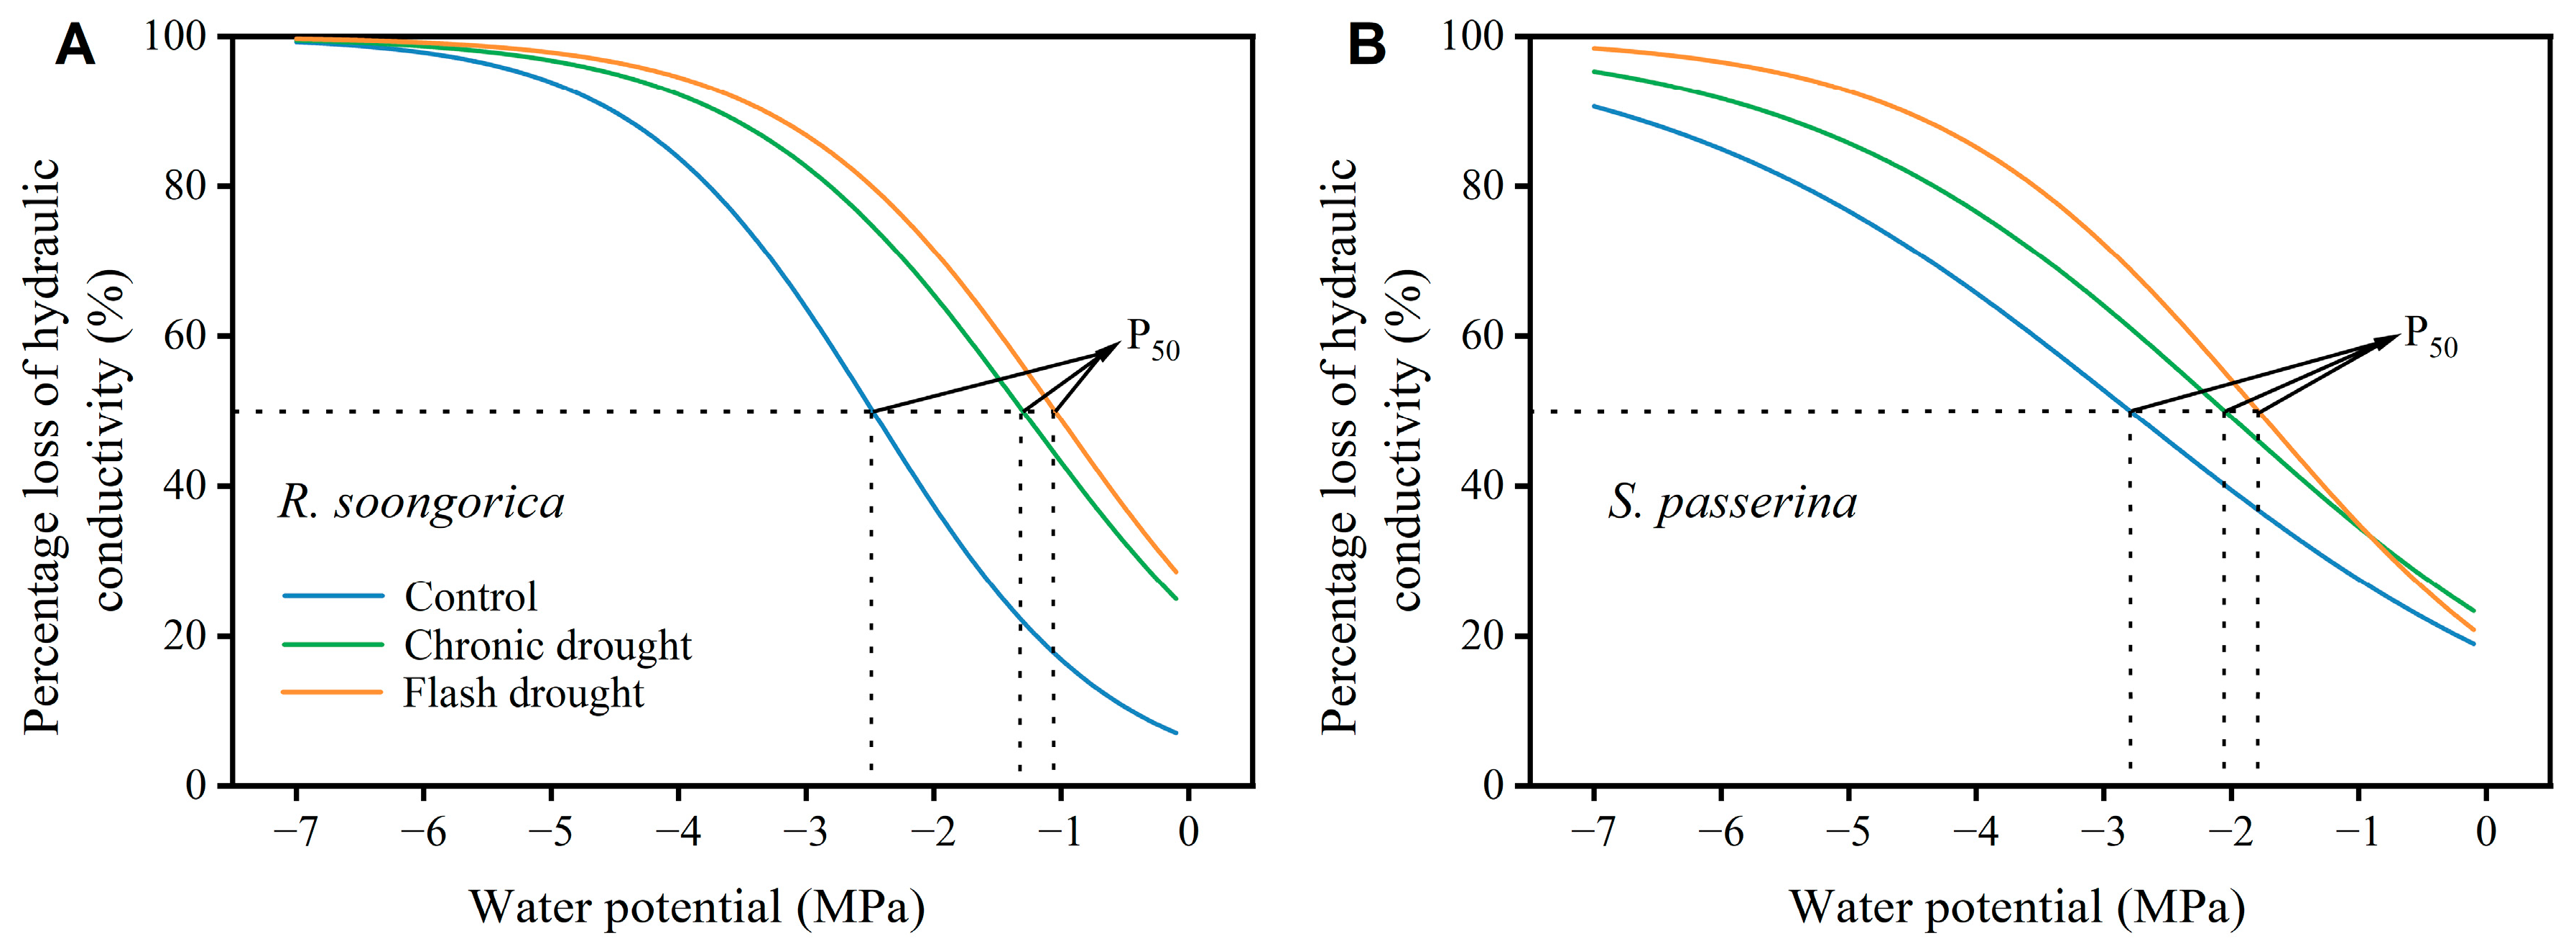
2.3.3. Vulnerability Curves and Hydraulic Safety Margin

After the aforementioned measurements, the branches were further subjected to a rinsing process using a pressure of 200 kPa, allowing water to flow through the xylem for 20 min. The maximum hydraulic conductivity (Kmax, kg·m·s−1·MPa−1) was determined using the same methodology as described earlier. Subsequently, the branches were placed in a pressure chamber (PMS, Corvallis, OR, USA), with both ends protruding, and the hydraulic conductivity (Ki, kg·m·s−1·MPa−1) was measured at various pressure levels. The measurements were conducted by gradually increasing the pressure (we set the following pressure gradients: −0.1, −0.3, −0.5, −1, −1.5, −2, −2.5, −3, −3.5, −4, −5, −6, and −7 MPa) and calculating the percentage loss of hydraulic conductivity (PLC, %) for each pressure level over 20 min [35].
PLC = 100 ( K max     K i ) / K max
Based on the percentage loss of hydraulic conductivity at different pressures and at different pressures, the vulnerability curve was fitted using Equation (3) [36]. Each water treatment had three branches with one curve per branch (n = 3).
PLC i = 100 / ( 1 + exp ( a ( Ψ   b ) ) )
where PLCi is the percentage loss of hydraulic conductivity under each pressurization, Ψ is the xylem water potential (i.e., different pressures), and a and b are the maximum slope of the curve and xylem water potential at 50% loss of stem hydraulic conductivity (P50, MPa), respectively. P50 is calculated according to Equation (4).
P 50 = Ψ   ln ( 100 PLC   1 ) / a
To assess the hydraulic safety of the shrubs, the hydraulic safety margin (HSM50, MPa) was calculated as follows: HSM50 = ΨMD − P50 [37].

2.3.4. Sapwood Specific Conductivity, Leaf Specific Conductivity, and Huber Value

After the embolic vulnerability curve measurement, the sapwood of the stems was rinsed with a methyl blue solution, allowing the sapwood area (AS, m2) to be determined. The sapwood specific conductivity (KS, kg·m−1·s−1·MPa−1) was calculated as follows: KS = Kh/AS [38]. Furthermore, the leaves from each branch were collected and scanned using WinRHIZO (Regent Instruments Inc., Quebec City, QC, Canada) to obtain the leaf area (AL, m2). The leaf specific conductivity (KL, kg·m−1·s−1·MPa−1) was calculated as follows: KL = Kh/AL [38]. To assess the cross-sectional area of sapwood available for water transport per unit stem end, we measured the sapwood area to leaf area ratio (Hv, mm2·cm−2) [1].

2.3.5. Leaf and Stem Water Content

We conducted measurements of leaf water content (LWC, %) and stem water content (SWC, %) for each seedling individually, with one measurement per seedling (n = 3). This allowed us to gain additional insights into the extent of water stress experienced by the shrubs. We measured leaf and stem water content at 37 days. Initially, the fresh weight of both leaves and stems was determined by weighing them (mfresh-leaf and mfresh-stem, g). Subsequently, the leaves and stems were placed in envelope bags and oven-dried at 75 °C. The dry weight of the leaves (mdry-leaf and mdry-stem, g) was measured. We calculate LWC and SWC: (1) LWC = (mfresh-leaf − mdry-leaf)/mfresh-leaf; (2) SWC = (mfresh-stem − mdry-stem)/mfresh-stem.

2.4. Photosynthesis and Gas Exchange Measurement

On the 37th day (a sunny day) and before the branches were intercepted, we assessed the leaf net photosynthetic rate (Pn, µmol·m−2·s−1) and stomatal conductance (gs, mmol·m−2·s−1) of the shrubs employing a plant photosynthesis meter (3051D, Zhejiang Top Instrument Co., Ltd., Hangzhou, China). Each seedling underwent a single measurement, resulting in a sample size of three per treatment (n = 3).

2.5. Non-Structural Carbohydrate Assay

When subjecting the seedlings to drought stress for 37 days, leaves and stems were harvested, and each seedling was divided into leaves and stems, and the non-structural carbohydrates (n = 3) were subsequently quantified in both organs. Freshly harvested organs were promptly placed in an oven set at 105 °C for 30 min to eliminate any biological activity, and then dried at 75 °C until constant weight. The resulting dried plant organ samples were finely ground. The soluble sugar (SSC, mg·g−1) and starch (SC, mg·g−1) concentrations were determined colorimetrically via the anthron method [39]. The non-structural carbon concentration (NSC, mg·g−1) was calculated as the sum of the soluble sugar and starch concentrations.

2.6. Statistics

We used two-way ANOVA to analyze the effects of species and water treatments on functional traits, and used one-way ANOVA to investigate the effects of different water treatments on the functional traits of the shrubs, and the dynamics of leaf water potential under the same treatment in SPSS 26.0. Meanwhile, independent t-tests were used to compare differences between the traits of R. soongorica and S. passerina. Principal components analysis was used to evaluate the drought response strategies of shrubs under different water treatments in Origin 2022.
To explore the relationships between traits, we performed piecewise structural equation modeling using the piecewiseSEM package [40] in R 4.2.1. The model’s global goodness-of-fit was assessed using Fischer’s C statistic. The model selection process involved evaluating the AIC and p-values. Additionally, standardized path coefficients and R2 were obtained for each path, and each path was considered independent.

3. Results

3.1. Plant Water Relation

Species had highly significant effects on KL, Hv, P50, ΨPD, ΨMD, HSM50, LWC, SWC, and significant effects on KS. Water treatment had a highly significant effect on KL, P50, ΨPD, ΨMD, HSM50, LWC, and SWC, and a significant effect on KS. The interaction between the two had a highly significant effect on KL, ΨPD, and SWC, and a significant effect on LWC (Table 1).
For R. soongorica, the values of KS and KL did not exhibit significant changes under the chronic drought treatment compared to the control. However, both KS and KL showed a significant decrease under the flash drought treatment (Figure 2A,B). The Hv did not show a significant difference among the different water treatments (Figure 2C). On the other hand, P50 exhibited a significantly higher value under both the chronic and flash drought treatments compared to the control, but there was no significant difference between the chronic and flash drought treatments (Figure 2D and Figure 3A). The difference in ΨPD was significantly lower only under the flash drought treatment compared to the control (Figure 2E). Additionally, significant differences were observed in ΨMD and HSM50 among the various water treatments, with the largest values observed under the control and the smallest values under the flash drought treatment (Figure 2F,G). The LWC and SWC were significantly reduced under both the chronic and flash drought treatments compared to the control, but no significant difference was found between LWC or SWC under the chronic and flash drought treatments (Figure 2H,I).
For S. passerina, the KS did not show any significant differences between the water treatments (Figure 2A). However, the variations in KL, Hv, and P50 were consistent with the trends observed in R. soongorica (Figure 2B–D and Figure 3B). Notably, significant differences were found in ΨPD under all water treatments (Figure 2E), while the variation in ΨMD followed a similar pattern to that of R. soongorica (Figure 2F). The variations in the HSM50 were also consistent with R. soongorica (Figure 2G). When examining LWC and SWC in S. passerina, LWC showed a significant reduction only under the flash drought treatment compared to the control (Figure 2H). In contrast, SWC exhibited significant differences across all water treatments, with the lowest value observed under the flash drought treatment (Figure 2I).
A comparison of the hydraulic traits between R. soongorica and S. passerina under the chronic and flash drought treatment indicated no significant difference in KS between the two species under chronic drought treatments (Figure 2A), but KL, Hv, ΨPD, ΨMD, HSM50, LWC, and SWC were significantly higher for S. passerina than R. soongorica (Figure 2B,C,E–I), while P50 was significantly lower than R. soongorica (Figure 2D). Under flash drought treatment, there were no significant differences between the two species for KS, KL, Hv, ΨPD, ΨMD, and SWC (Figure 2A–C,E,F,I), but R. soongorica exhibited a significantly higher value for P50 compared to S. passerina (Figure 2D). Furthermore, the HSM50 and LWC were significantly lower in R. soongorica than in S. passerina (Figure 2G,H). These findings suggest that S. passerina may possess a higher resistance to embolism compared to R. soongorica.

3.2. Non-Structural Carbohydrate

Species had highly significant effects on L-SSC and L-SC, and significant effects on S-NSC. Water treatments had highly significant effects on all non-structural carbohydrate traits of leaf and stem. The interaction between the two had a highly significant effect on S-SSC and S-NSC, and a significant effect on S-SC (Table 2).
For R. soongorica, we observed significant differences in L-SSC, L-SC, and L-SSC/L-SC under different water treatments. Specifically, L-SSC and L-SSC/L-SC exhibited the smallest values under the control, while the flash drought treatment resulted in the largest values. Conversely, L-SC showed opposite changes, with the largest values under the control and the smallest values under the flash drought treatment (Figure 4A–C). Regarding L-NSC, there were no significant changes under the chronic drought treatment compared to the control, but a significant decrease was observed under the flash drought treatment. However, no significant differences were found between L-NSC under the chronic and flash drought treatments (Figure 4D). Similarly, significant differences were observed in S-SSC, S-SSC/S-SC, and S-NSC under each water treatment, with the smallest values observed under the control and the largest values under the flash drought treatment (Figure 4E,G,H). S-SC was significantly lower under both the chronic and flash drought treatments compared to the control, but no significant difference was found between the two drought treatments (Figure 4F).
For S. passerina, the changes in L-SSC were consistent with those observed in R. soongorica (Figure 4A). Specifically, compared to the control, L-SC showed a significant decrease only under the flash drought treatment, while it did not change significantly under the chronic drought treatment (Figure 4B). Similarly, L-SSC/L-SC exhibited a significant increase only under the flash drought treatment, with no significant change observed under the chronic drought treatment (Figure 4C). The changes in L-NSC were similar to those observed in R. soongorica, but there were significant differences between L-NSC under the two drought treatments (Figure 4D). Furthermore, the changes in S-SSC were consistent with those observed in R. soongorica (Figure 4E). S-SC, on the other hand, showed a significant reduction only under the flash drought treatment compared to the control (Figure 4F). The changes in S-SSC/S-SC were also consistent with those observed in R. soongorica (Figure 4G). Finally, S-NSC exhibited a significant increase only under the flash drought treatment compared to the control (Figure 4H).
A comparison of non-structural carbohydrates between R. soongorica and S. passerina under chronic and flash drought treatment revealed L-SSC of R. soongorica was significantly lower than S. passerina under the chronic drought treatment (Figure 4A), but S-SSC and S-SSC/S-SC were significantly higher than S. passerina (Figure 4E,G). However, there were no significant differences in L-SC, L-SSC/L-SC, L-NSC, S-SC, and S-NSC between the two species (Figure 4B–D,F,H). Under flash drought treatment, there were no significant differences in L-NSC and S-SC between R. soongorica and S. passerina (Figure 4D,F), indicating similar levels of these carbohydrates. However, significant differences were observed in L-SSC, L-SSC/L-SC, S-SSC, S-SSC/S-SC, and S-NSC, with R. soongorica exhibiting significantly lower values than S. passerina (Figure 4A,C,E,G,H). Conversely, L-SC was significantly higher in R. soongorica compared to S. passerina (Figure 4B). These results suggest that S. passerina possesses a higher osmoregulatory capacity than R. soongorica, indicating its potential for higher drought tolerance.

3.3. Leaf Gas Exchange and Photosynthesis

Species and water treatments had highly significant effects on both gs and Pn (Table 3). Significant variations were observed in both gs or Pn for both R. soongorica and S. passerina across the different water treatments. The highest values were recorded under the control, followed by intermediate values under the chronic drought treatment, and the lowest values under the flash drought treatment (Figure 5A,B). When comparing the two species, significant differences were identified in both gs and Pn, specifically under the flash drought treatment (Figure 5A,B). Under the chronic drought treatment, Pn was significantly higher for S. passerina than R. soongorica, but gs was not significantly different between the two species (Figure 5A,B).

3.4. Drought Response Strategies

A principal component analysis (PCA) was conducted to analyze the variation in traits and understand the response of shrubs to different water conditions. For R. soongorica, the PCA revealed that two principal components accounted for 86.4% of the total trait variation (Figure 6A). PC1 explained 75.2% of the total variation and showed positive correlations with KS, ΨMD, HSM50, L-SC, gs, and Pn, while exhibiting negative correlations with P50, L-SSC, S-SSC, and S-NSC. PC2 explained 11.2% of the total variation and was primarily associated with KL, SWC, and S-SC. Under the control, individuals exhibited elevated levels of KS, ΨMD, gs, and Pn. Conversely, those subjected to flash drought demonstrated increased values for P50, L-SSC, and S-SSC. Individuals undergoing chronic drought displayed intermediate values between the two extremes.
For S. passerina, the PCA revealed that two principal components accounted for 87.8% of the total trait variation (Figure 6B). PC1 explained 79.1% of the total variation and showed positive correlations with ΨPD, ΨMD, HSM50, LWC, SWC, L-SC, and gs, while displaying negative correlations with L-SSC, S-SSC, and S-NSC. PC2 explained 8.7% of the total variation and was primarily associated with KL, Hv, P50, HSM50, and Pn. Notably, the distribution of shrubs across all three water treatments on the PC1 axis demonstrated a correlation with drought tolerance traits (ΨMD, L-SSC, S-SSC).

3.5. Links among Hydraulic Traits, Gas Exchange, and Non-Structural Carbohydrate

According to the relationship predicted by our assumptions, L-SC was negatively correlated with L-SSC; L-SSC was positively correlated with S-SSC; and S-SSC was negatively correlated with ΨMD and KS of R. soongorica (Figure 7A). L-SC was negatively correlated with L-SSC; L-SSC was negatively correlated with ΨMD; and ΨMD was positively correlated with gs of S. passerina (Figure 7B). However, it is important to note that the model did not support the existence of significant relationships between other traits of R. soongorica or S. passerina.

4. Discussion

4.1. Response of Plant Traits to Drought

We observed that R. soongorica and S. passerina were able to maintain photosynthetic activity and gas exchange even under both chronic and flash drought stress conditions (Figure 5A,B), indicating that these shrubs were still capable of carbon assimilation. Furthermore, S. passerina exhibited a significant decrease in L-NSC and a significant increase in S-NSC only under the flash drought treatment compared to the control (Figure 4D,H). Similarly, R. soongorica demonstrated a consistent pattern of change in L-NSC, but exhibited a significant increase in S-NSC under both chronic and flash drought treatments (Figure 4D,H). These findings suggest that both species allocated non-structural carbohydrates to their stems, which is consistent with our hypothesis for L-NSC, but contrary to our hypothesis for S-NSC. Many studies have reported that drought stress increases soluble sugar concentration [19,41,42], consistent with our results. Sugar concentration increase can reduce the water potential of woody plants, maintain cell swelling [42,43], and improve xylem water transport capacity. Meanwhile, under drought stress, starch synthesis was inhibited, and the activity of hydrolases was accelerated, leading to an increase in the ratio of soluble sugars to starch (Figure 4C,G) [19]. These results suggest that R. soongorica and S. passerina seedlings increase sugar concentration in response to increasing drought stress under both chronic and flash drought stress. However, a sustained increase in drought stress will accelerate NSC allocating to the stem, and woody plants can reduce the probability of carbon starvation through this compensation action, but sustained high water consumption increases burden on stems, and hydraulic failure may occur [44].
Our findings revealed no significant changes in the KS and KL of R. soongorica and S. passerina under the chronic drought treatment compared to the control. However, under the flash drought treatment, both R. soongorica and S. passerina exhibited a significant reduction in KS, and R. soongorica also showed a significant decrease in KL, indicating a reduced water use efficiency under flash drought stress (Figure 2A,B). This is consistent with our hypothesis on water use efficiency, and also consistent with previous studies [6,20,45]. For instance, Duan et al. conducted a study on dominant plant species in subtropical China, such as Syzygium rehderianum, Castanopsis chinensis, and Schima superba, and observed that plants respond more swiftly to high-intensity drought (i.e., flash drought) with less efficient water transport compared to low-intensity drought (i.e., chronic drought). This discrepancy can be attributed to the accelerated xylem conduit cavitation under flash drought, which significantly impairs water transport in woody plants [46]. To prevent excessive transpiration water loss and xylem embolism, woody plants adopt a two-fold strategy. Firstly, they reduce stomatal conductance, as evident in this study (Figure 5A). Secondly, they enhance water use efficiency by increasing starch hydrolysis rate in leaves and stems (Figure 4C,G) and augmenting soluble sugar concentration to improve cellular osmoregulation (Figure 4A,E) [47]. Additionally, the increase in soluble sugars in leaves leads to a smaller ΨPD and ΨMD (Figure 2E,F), enabling woody plants to extract more water from the environment with declining soil water content [48].
The magnitude of P50, which represents the embolism resistance of plants [1,49], and HSM, which can predict species mortality [1,7,50], are important parameters in assessing plant responses to drought. It has been established in previous studies that species with lower P50 values and higher HSM50 values exhibit higher resistance to exogenous stresses and have longer survival rates [51,52]. Here, P50 values for both R. soongorica and S. passerina were significantly higher under the chronic and flash drought treatments compared to the control (Figure 2D), indicating that drought reduces the plants’ ability to resist embolization. Although there was no significant difference in P50 between R. soongorica and S. passerina under the chronic and flash drought treatments, HSM50 was significantly higher under the chronic drought treatment than the flash drought treatment (Figure 2D,G), suggesting that woody plants under chronic drought stress exhibit a higher hydraulic safety margin. This is consistent with our hypothesis of embolism resistance. Variations in P50 are related to xylem anatomical characteristics and striatal structure [53]. These characteristics determine the critical water potential for gases to pass through the striatal membrane, leading to the cavitation of adjacent conduits and diffuse embolism in the xylem. The increase in drought stress resulted in increased conduit cavitation and decreased stomatal conductance [47], which may be responsible for the reduced embolism resistance (i.e., increased P50 values) in the xylem and is more pronounced in flash droughts. Drought stress led to a decrease in stomatal conductance and a subsequent decrease in water potential in both species, and a subsequent increase in P50 values, resulting in a decrease in HSM. However, a comparative study by Li et al. [54] on Banksia serrata under different climatic conditions (warm-wet, warm-dry, and cold-wet) did not observe any differences in P50 among the woody plants. This lack of variation can be attributed to the fact that in some species, adjustments in embolism vulnerability occur only under extremely dry conditions at the edge of their range [55,56]. The significant differences in soil moisture among our plants under the three treatments also may explain the intraspecific variation in P50 observed in this study. Additionally, we observed that under the flash drought treatment, the P50 of R. soongorica was significantly higher compared to S. passerina (Figure 2D), while the opposite trend was observed for HSM50 (Figure 2G). These findings indicate that S. passerina demonstrates a higher level of drought tolerance compared to R. soongorica.

4.2. Drought Response Strategies

Our findings revealed that resource acquisition (Pn), water use efficiency (KS), and drought tolerance (P50, ΨMD, L-SSC, S-SSC), were the primary axes of variation in R. soongorica traits. Plants subjected to the control treatment exhibited higher net photosynthetic rate and water use efficiency, while those under the flash drought treatment displayed higher osmoregulation and less resistance to embolism. Plants under the chronic drought treatment fell in between these two extremes (Figure 6A), suggesting that R. soongorica may employ drought avoidance strategies in response to both chronic and flash drought conditions. This is consistent with our hypothesis of a drought response strategy in R. soongorica, and our findings are also consistent with previous studies [57,58,59]. For instance, Mota-Gutiérrez et al. conducted a study on deciduous plant species in central Mexico and observed that plants can reduce their water demand by defoliating during the dry season. Under conditions of drought stress, plants employ adaptive strategies to minimize transpiration and metabolic consumption. One such strategy involves a reduction in stomatal conductance, effectively limiting water loss. Additionally, plants exhibit a defoliation response to reduce the overall transpiration area and maximize their ability to prevent dehydration [60,61]. Notably, R. soongorica exhibits a consistent leaf habit. This characteristic in deciduous plants not only indicates their high capacity for drought avoidance but also contributes to their ability to maintain robust hydraulic conductivity. The defoliation habit serves as a protective measure, preventing the occurrence of high pressures within the ducts and subsequent embolism [58].
Drought tolerance, as indicated by ΨMD, L-SSC, and S-SSC, emerged as the primary factor driving the variation in S. passerina traits. The distribution of individuals across all three water treatments exhibited a strong correlation with these drought tolerance traits (Figure 6B), implying that S. passerina employs drought tolerance strategies under both chronic and flash drought conditions. This is consistent with our hypothesis of a drought response strategy in S. passerina, and our findings are also consistent with previous investigations on evergreen species [1,21]. For instance, Chen et al. conducted a study on evergreen species at the Xishuangbanna Tropical Botanical Garden, highlighting that the leaf habit of plants determines their strategy for tolerating drought, with evergreen species displaying a drought tolerance strategy. S. passerina, as highly succulent and non-deciduous desert shrubs, share similarities with non-deciduous gymnosperms studied by Dai et al. [62]. The research highlighted that plants responded in a relatively conservative manner to various drought intensities, characterized by gradual decreases in water potential and hydraulic conductivity, and a rapid increase in embolism. Hence, the dominant trait enabling S. passerina to resist drought stress is likely their drought tolerance.
However, assessing the drought response strategies of woody plants solely based on stem hydraulic traits has its limitations. Particularly, under flash drought conditions, woody plants might prioritize the survival of their stems by allocating resources away from more vulnerable and consumptive organs, such as leaves and roots, through a process known as hydraulic vulnerability segmentation [63]. To reveal this limitation, it is necessary to consider the hydraulic traits of leaves, stems, and roots collectively when investigating the drought response strategies of woody plants. Such an integrated approach would offer a more comprehensive understanding of woody plant response to different drought intensities.

5. Conclusions

This study demonstrated that two drought stresses decreased embolism resistance in R. soongorica and S. passerina, but only flash drought stress decreased water use efficiency. Drought stress improved leaf and stem soluble sugar concentrations, and accelerated the hydrolysis of starch to soluble sugars. However, the decrease in leaf non-structural carbon concentration and the increase in stem non-structural carbon concentration indicated that they favored the allocation of non-structural carbon to stems to maintain or improve xylem water use capacity. In response to drought stress, R. soongorica possibly adopted a drought avoidance strategy, while S. passerina possibly adopted a drought tolerance strategy. It is essential to acknowledge that the present study was conducted using potted seedlings, which warrants caution when extrapolating the findings to mature plants. Seedlings often exhibit higher susceptibility to drought stress compared to their mature counterparts [49]. Nevertheless, even considering this limitation, our study offers valuable insights into the potential drought resistance of R. soongorica and S. passerina in the face of a future climate characterized by more frequent drought events. Furthermore, our findings shed light on the risks of hydraulic failure and carbon starvation in desert shrubs, presenting a comprehensive understanding of their responses to various drought intensities and adaptive strategies.

Author Contributions

Conceptualization, H.W.; methodology, H.W.; software, H.W. and J.M.; validation, J.Z. and Y.S.; resources, T.X., F.N., C.H. and L.S.; data curation, H.W., J.M. and T.X.; writing—original draft preparation, H.W.; writing—review and editing, H.W., F.N. and L.S.; visualization, H.W.; supervision, Y.S. and C.H.; project administration, L.S.; funding acquisition, J.M., Z.Z. and L.S. All authors have read and agreed to the published version of the manuscript.

Funding

This work was funded by the Gansu Province Key Research and Development Program (22YF7FA117); National Natural Science Foundation of China (32160253, U23A2061); Excellent Doctoral Program of Gansu Province (23JRRA1452); Gansu Provincial Major Project (22ZD6FA052); Gansu Agricultural University Public Recruitment Doctoral Research Start-up Fund (GAU–KYQD–2019-12).

Data Availability Statement

Data are contained within the article.

Conflicts of Interest

The authors declare that this research has no conflicts of interest.

References

  1. Chen, Y.J.; Choat, B.; Sterck, F.; Maenpuen, P.; Katabuchi, M.; Zhang, S.B.; Tomlinson, K.W.; Oliveira, R.S.; Zhang, Y.J.; Shen, J.X. Hydraulic prediction of drought-induced plant dieback and top-kill depends on leaf habit and growth form. Ecol. Lett. 2021, 24, 2350–2363. [Google Scholar] [CrossRef] [PubMed]
  2. Reichstein, M.; Bahn, M.; Ciais, P.; Frank, D.; Mahecha, M.D.; Seneviratne, S.I.; Zscheischler, J.; Beer, C.; Buchmann, N.; Frank, D.C. Climate extremes and the carbon cycle. Nature 2013, 500, 287–295. [Google Scholar] [CrossRef] [PubMed]
  3. Anderegg, W.R.; Anderegg, L.D.; Kerr, K.L.; Trugman, A.T. Widespread drought-induced tree mortality at dry range edges indicates that climate stress exceeds species’ compensating mechanisms. Glob. Chang. Biol. 2019, 25, 3793–3802. [Google Scholar] [CrossRef] [PubMed]
  4. Brodribb, T.J.; Powers, J.; Cochard, H.; Choat, B. Hanging by a thread? Forests and drought. Science 2020, 368, 261–266. [Google Scholar] [CrossRef] [PubMed]
  5. Tyree, M.T.; Sperry, J.S. Do woody plants operate near the point of catastrophic xylem dysfunction caused by dynamic water stress? Answers from a model. Plant Physiol. 1988, 88, 574–580. [Google Scholar] [CrossRef] [PubMed]
  6. Duan, H.; Li, Y.; Xu, Y.; Zhou, S.; Liu, J.; Tissue, D.T.; Liu, J. Contrasting drought sensitivity and post-drought resilience among three co-occurring tree species in subtropical China. Agric. For. Meteorol. 2019, 272, 55–68. [Google Scholar] [CrossRef]
  7. Adams, H.D.; Zeppel, M.J.; Anderegg, W.R.; Hartmann, H.; Landhäusser, S.M.; Tissue, D.T.; Huxman, T.E.; Hudson, P.J.; Franz, T.E.; Allen, C.D. A multi-species synthesis of physiological mechanisms in drought-induced tree mortality. Nat. Ecol. Evol. 2017, 1, 1285–1291. [Google Scholar] [CrossRef]
  8. Sala, A.; Piper, F.; Hoch, G. Physiological mechanisms of drought-induced tree mortality are far from being resolved. New Phytol. 2010, 186, 274–281. [Google Scholar] [CrossRef]
  9. Brodribb, T.; Holbrook, N.; Edwards, E.; Gutiérrez, M. Relations between stomatal closure, leaf turgor and xylem vulnerability in eight tropical dry forest trees. Plant Cell Environ. 2003, 26, 443–450. [Google Scholar] [CrossRef]
  10. Blackman, C.J.; Creek, D.; Maier, C.; Aspinwall, M.J.; Drake, J.E.; Pfautsch, S.; O’grady, A.; Delzon, S.; Medlyn, B.E.; Tissue, D.T. Drought response strategies and hydraulic traits contribute to mechanistic understanding of plant dry-down to hydraulic failure. Tree Physiol. 2019, 39, 910–924. [Google Scholar] [CrossRef]
  11. Hochberg, U.; Windt, C.W.; Ponomarenko, A.; Zhang, Y.-J.; Gersony, J.; Rockwell, F.E.; Holbrook, N.M. Stomatal closure, basal leaf embolism, and shedding protect the hydraulic integrity of grape stems. Plant Physiol. 2017, 174, 764–775. [Google Scholar] [CrossRef]
  12. Salleo, S.; Lo Gullo, M.; Trifilo, P.; Nardini, A. New evidence for a role of vessel-associated cells and phloem in the rapid xylem refilling of cavitated stems of Laurus nobilis L. Plant Cell Environ. 2004, 27, 1065–1076. [Google Scholar] [CrossRef]
  13. Secchi, F.; Pagliarani, C.; Cavalletto, S.; Petruzzellis, F.; Tonel, G.; Savi, T.; Tromba, G.; Obertino, M.M.; Lovisolo, C.; Nardini, A. Chemical inhibition of xylem cellular activity impedes the removal of drought-induced embolisms in poplar stems–new insights from micro-CT analysis. New Phytol. 2021, 229, 820–830. [Google Scholar] [CrossRef] [PubMed]
  14. Tomasella, M.; Nardini, A.; Hesse, B.D.; Machlet, A.; Matyssek, R.; Häberle, K.-H. Close to the edge: Effects of repeated severe drought on stem hydraulics and non-structural carbohydrates in European beech saplings. Tree Physiol. 2019, 39, 717–728. [Google Scholar] [CrossRef] [PubMed]
  15. Salleo, S.; Trifilò, P.; Esposito, S.; Nardini, A.; Gullo, M.A.L. Starch-to-sugar conversion in wood parenchyma of field-growing Laurus nobilis plants: A component of the signal pathway for embolism repair? Funct. Plant Biol. 2009, 36, 815–825. [Google Scholar] [CrossRef] [PubMed]
  16. Zwieniecki, M.A.; Holbrook, N.M. Confronting Maxwell’s demon: Biophysics of xylem embolism repair. Trends Plant Sci. 2009, 14, 530–534. [Google Scholar] [CrossRef] [PubMed]
  17. Huang, X.; Guo, W.; Yang, L.; Zou, Z.; Zhang, X.; Addo-Danso, S.D.; Zhou, L.; Li, S. Effects of drought stress on non-structural carbohydrates in different organs of Cunninghamia lanceolata. Plants 2023, 12, 2477. [Google Scholar] [CrossRef] [PubMed]
  18. Ma, Y.; Su, B.-L.; Han, Y.-G.; Wu, X.-H.; Zhou, W.-M.; Wang, Q.-W.; Zhou, L.; Yu, D.-P. Response of photosynthetic characteristics and non-structural carbohydrate accumulation of Betula ermanii seedlings to drought stress. J. Appl. Ecol. 2021, 32, 513–520. [Google Scholar]
  19. Zhang, T.; Cao, Y.; Chen, Y.; Liu, G. Non-structural carbohydrate dynamics in Robinia pseudoacacia saplings under three levels of continuous drought stress. Trees 2015, 29, 1837–1849. [Google Scholar] [CrossRef]
  20. Li, M.-Y.; Fang, L.-D.; Duan, C.-Y.; Cao, Y.; Yin, H.; Ning, Q.-R.; Hao, G.-Y. Greater risk of hydraulic failure due to increased drought threatens pine plantations in Horqin Sandy Land of northern China. For. Ecol. Manag. 2020, 461, 117980. [Google Scholar] [CrossRef]
  21. Zhang, S.-B.; Zhang, J.-L.; Cao, K.-F. Divergent hydraulic safety strategies in three co-occurring Anacardiaceae tree species in a Chinese savanna. Front. Plant Sci. 2017, 7, 2075. [Google Scholar] [CrossRef]
  22. Brodribb, T.J.; McAdam, S.A.M.; Jordan, G.J.; Martins, S.C.V. Conifer species adapt to low-rainfall climates by following one of two divergent pathways. Proc. Natl. Acad. Sci. USA 2014, 111, 14489–14493. [Google Scholar] [CrossRef] [PubMed]
  23. Oliveira, R.S.; Eller, C.B.; Barros, F.d.V.; Hirota, M.; Brum, M.; Bittencourt, P. Linking plant hydraulics and the fast–slow continuum to understand resilience to drought in tropical ecosystems. New Phytol. 2021, 230, 904–923. [Google Scholar] [CrossRef]
  24. Wyse, S.V.; Macinnis-Ng, C.M.; Burns, B.R.; Clearwater, M.J.; Schwendenmann, L. Species assemblage patterns around a dominant emergent tree are associated with drought resistance. Tree Physiol. 2013, 33, 1269–1283. [Google Scholar] [CrossRef]
  25. González-Rebeles, G.; Terrazas, T.; Méndez-Alonzo, R.; Paz, H.; Brodribb, T.J.; Tinoco-Ojanguren, C. Leaf water relations reflect canopy phenology rather than leaf life span in Sonoran Desert trees. Tree Physiol. 2021, 41, 1627–1640. [Google Scholar] [CrossRef]
  26. Johnson, D.M.; Domec, J.C.; Carter Berry, Z.; Schwantes, A.M.; McCulloh, K.A.; Woodruff, D.R.; Wayne Polley, H.; Wortemann, R.; Swenson, J.J.; Scott Mackay, D. Co-occurring woody species have diverse hydraulic strategies and mortality rates during an extreme drought. Plant Cell Environ. 2018, 41, 576–588. [Google Scholar] [CrossRef] [PubMed]
  27. Chaves, M.M.; Maroco, J.P.; Pereira, J.S. Understanding plant responses to drought—From genes to the whole plant. Funct. Plant Biol. 2003, 30, 239–264. [Google Scholar] [CrossRef] [PubMed]
  28. Vargas, G.G.; Brodribb, T.J.; Dupuy, J.M.; González-M, R.; Hulshof, C.M.; Medvigy, D.; Allerton, T.A.; Pizano, C.; Salgado-Negret, B.; Schwartz, N.B. Beyond leaf habit: Generalities in plant function across 97 tropical dry forest tree species. New Phytol. 2021, 232, 148–161. [Google Scholar] [CrossRef]
  29. Christoffersen, B.O.; Gloor, M.; Fauset, S.; Fyllas, N.M.; Galbraith, D.R.; Baker, T.R.; Kruijt, B.; Rowland, L.; Fisher, R.A.; Binks, O.J. Linking hydraulic traits to tropical forest function in a size-structured and trait-driven model (TFS v. 1-Hydro). Geosci. Model. Dev. 2016, 9, 4227–4255. [Google Scholar] [CrossRef]
  30. Zhang, Z.; Shan, L.; Li, Y.; Wang, Y. Belowground interactions differ between sympatric desert shrubs under water stress. Ecol. Evol. 2020, 10, 1444–1453. [Google Scholar] [CrossRef]
  31. Su, P.; Yan, Q.; Xie, T.; Zhou, Z.; Gao, S. Associated growth of C3 and C4 desert plants helps the C3 species at the cost of the C4 species. Acta Physiol. Plant. 2012, 34, 2057–2068. [Google Scholar] [CrossRef]
  32. Urli, M.; Porté, A.J.; Cochard, H.; Guengant, Y.; Burlett, R.; Delzon, S. Xylem embolism threshold for catastrophic hydraulic failure in angiosperm trees. Tree Physiol. 2013, 33, 672–683. [Google Scholar] [CrossRef] [PubMed]
  33. Brodribb, T.; Feild, T. Stem hydraulic supply is linked to leaf photosynthetic capacity: Evidence from New Caledonian and Tasmanian rainforests. Plant Cell Environ. 2000, 23, 1381–1388. [Google Scholar] [CrossRef]
  34. Sperry, J.; Donnelly, J.; Tyree, M. A method for measuring hydraulic conductivity and embolism in xylem. Plant Cell Environ. 1988, 11, 35–40. [Google Scholar] [CrossRef]
  35. Chen, Y.J.; Maenpuen, P.; Zhang, Y.J.; Barai, K.; Katabuchi, M.; Gao, H.; Kaewkamol, S.; Tao, L.B.; Zhang, J.L. Quantifying vulnerability to embolism in tropical trees and lianas using five methods: Can discrepancies be explained by xylem structural traits? New Phytol. 2021, 229, 805–819. [Google Scholar] [CrossRef] [PubMed]
  36. Pammenter, N.V.; Van der Willigen, C. A mathematical and statistical analysis of the curves illustrating vulnerability of xylem to cavitation. Tree Physiol. 1998, 18, 589–593. [Google Scholar] [CrossRef] [PubMed]
  37. Choat, B.; Jansen, S.; Brodribb, T.J.; Cochard, H.; Delzon, S.; Bhaskar, R.; Bucci, S.J.; Feild, T.S.; Gleason, S.M.; Hacke, U.G. Global convergence in the vulnerability of forests to drought. Nature 2012, 491, 752–755. [Google Scholar] [CrossRef]
  38. Burgess, S.S.; Pittermann, J.; Dawson, T.E. Hydraulic efficiency and safety of branch xylem increases with height in Sequoia sempervirens (D. Don) crowns. Plant Cell Environ. 2006, 29, 229–239. [Google Scholar] [CrossRef]
  39. Osaki, M.; Shinano, T.; Tadano, T. Redistribution of carbon and nitrogen compounds from the shoot to the harvesting organs during maturation in field crops. Soil. Sci. Plant Nutr. 1991, 37, 117–128. [Google Scholar] [CrossRef]
  40. Lefcheck, J.S. piecewiseSEM: Piecewise structural equation modelling in r for ecology, evolution, and systematics. Methods Ecol. Evol. 2016, 7, 573–579. [Google Scholar] [CrossRef]
  41. Latt, C.; Nair, P.; Kang, B. Reserve carbohydrate levels in the boles and structural roots of five multipurpose tree species in a seasonally dry tropical climate. For. Ecol. Manag. 2001, 146, 145–158. [Google Scholar] [CrossRef]
  42. Silva, E.N.; Ferreira-Silva, S.L.; Viégas, R.A.; Silveira, J.A.G. The role of organic and inorganic solutes in the osmotic adjustment of drought-stressed Jatropha curcas plants. Environ. Exp. Bot. 2010, 69, 279–285. [Google Scholar] [CrossRef]
  43. Handa, S.; Bressan, R.A.; Handa, A.K.; Carpita, N.C.; Hasegawa, P.M. Solutes contributing to osmotic adjustment in cultured plant cells adapted to water stress. Plant Physiol. 1983, 73, 834–843. [Google Scholar] [CrossRef] [PubMed]
  44. Birami, B.; Gattmann, M.; Heyer, A.G.; Grote, R.; Arneth, A.; Ruehr, N.K. Heat waves alter carbon allocation and increase mortality of Aleppo pine under dry conditions. Front. For. Glob. Chang. 2018, 1, 8. [Google Scholar] [CrossRef]
  45. Pangle, R.E.; Limousin, J.M.; Plaut, J.A.; Yepez, E.A.; Hudson, P.J.; Boutz, A.L.; Gehres, N.; Pockman, W.T.; McDowell, N.G. Prolonged experimental drought reduces plant hydraulic conductance and transpiration and increases mortality in a piñon–juniper woodland. Ecol. Evol. 2015, 5, 1618–1638. [Google Scholar] [CrossRef] [PubMed]
  46. Choat, B.; Brodribb, T.J.; Brodersen, C.R.; Duursma, R.A.; López, R.; Medlyn, B.E. Triggers of tree mortality under drought. Nature 2018, 558, 531–539. [Google Scholar] [CrossRef] [PubMed]
  47. Duan, H.; Resco de Dios, V.; Wang, D.; Zhao, N.; Huang, G.; Liu, W.; Wu, J.; Zhou, S.; Choat, B.; Tissue, D.T. Testing the limits of plant drought stress and subsequent recovery in four provenances of a widely distributed subtropical tree species. Plant Cell Environ. 2022, 45, 1187–1203. [Google Scholar] [CrossRef]
  48. Sevanto, S.; Mcdowell, N.G.; Dickman, L.T.; Pangle, R.; Pockman, W.T. How do trees die? A test of the hydraulic failure and carbon starvation hypotheses. Plant Cell Environ. 2014, 37, 153–161. [Google Scholar] [CrossRef]
  49. Luo, D.; Wang, C.; Jin, Y.; Li, Z.; Wang, Z. Different hydraulic strategies under drought stress between Fraxinus mandshurica and Larix gmelinii seedlings. J. For. Res. 2022, 34, 99–111. [Google Scholar] [CrossRef]
  50. Anderegg, W.R.; Klein, T.; Bartlett, M.; Sack, L.; Pellegrini, A.F.; Choat, B.; Jansen, S. Meta-analysis reveals that hydraulic traits explain cross-species patterns of drought-induced tree mortality across the globe. Proc. Natl. Acad. Sci. USA 2016, 113, 5024–5029. [Google Scholar] [CrossRef]
  51. Shao, J.; Zhou, X.; Zhang, P.; Zhai, D.; Yuan, T.; Li, Z.; He, Y.; McDowell, N.G. Embolism resistance explains mortality and recovery of five subtropical evergreen broadleaf trees to persistent drought. Ecology 2023, 104, e3877. [Google Scholar] [CrossRef] [PubMed]
  52. Smith-Martin, C.M.; Muscarella, R.; Ankori-Karlinsky, R.; Delzon, S.; Farrar, S.L.; Salva-Sauri, M.; Thompson, J.; Zimmerman, J.K.; Uriarte, M. Hurricanes increase tropical forest vulnerability to drought. New Phytol. 2022, 235, 1005–1017. [Google Scholar] [CrossRef] [PubMed]
  53. Lens, F.; Sperry, J.S.; Christman, M.A.; Choat, B.; Rabaey, D.; Jansen, S. Testing hypotheses that link wood anatomy to cavitation resistance and hydraulic conductivity in the genus Acer. New Phytol. 2011, 190, 709–723. [Google Scholar] [CrossRef] [PubMed]
  54. Li, X.; Blackman, C.J.; Choat, B.; Rymer, P.D.; Medlyn, B.E.; Tissue, D.T. Drought tolerance traits do not vary across sites differing in water availability in Banksia serrata (Proteaceae). Funct. Plant Biol. 2019, 46, 624–633. [Google Scholar] [CrossRef] [PubMed]
  55. López, R.; Cano, F.J.; Choat, B.; Cochard, H.; Gil, L. Plasticity in vulnerability to cavitation of Pinus canariensis occurs only at the driest end of an aridity gradient. Front. Plant Sci. 2016, 7, 769. [Google Scholar] [CrossRef] [PubMed]
  56. Stojnić, S.; Suchocka, M.; Benito-Garzón, M.; Torres-Ruiz, J.; Cochard, H.; Bolte, A.; Cocozza, C.; Cvjetković, B.; De Luis, M.; Martinez-Vilalta, J. Variation in xylem vulnerability to embolism in European beech from geographically marginal populations. Tree Physiol. 2018, 38, 173–185. [Google Scholar] [CrossRef]
  57. Fu, P.-L.; Jiang, Y.-J.; Wang, A.-Y.; Brodribb, T.J.; Zhang, J.-L.; Zhu, S.-D.; Cao, K.-F. Stem hydraulic traits and leaf water-stress tolerance are co-ordinated with the leaf phenology of angiosperm trees in an Asian tropical dry karst forest. Ann. Bot. 2012, 110, 189–199. [Google Scholar] [CrossRef]
  58. Kondoh, S.; Yahata, H.; Nakashizuka, T.; Kondoh, M. Interspecific variation in vessel size, growth and drought tolerance of broad-leaved trees in semi-arid regions of Kenya. Tree Physiol. 2006, 26, 899–904. [Google Scholar] [CrossRef]
  59. Mota-Gutiérrez, D.; Arreola-González, G.; Aguilar-Romero, R.; Paz, H.; Cavender-Bares, J.; Oyama, K.; Gonzalez-Rodriguez, A.; Pineda-García, F. Seasonal variation in native hydraulic conductivity between two deciduous oak species. J. Plant Ecol. 2020, 13, 78–86. [Google Scholar] [CrossRef]
  60. Choat, B.; Ball, M.C.; Luly, J.G.; Holtum, J.A. Hydraulic architecture of deciduous and evergreen dry rainforest tree species from north-eastern Australia. Trees 2005, 19, 305–311. [Google Scholar] [CrossRef]
  61. Ramírez-Valiente, J.A.; Cavender-Bares, J. Evolutionary trade-offs between drought resistance mechanisms across a precipitation gradient in a seasonally dry tropical oak (Quercus oleoides). Tree Physiol. 2017, 37, 889–901. [Google Scholar] [CrossRef] [PubMed]
  62. Dai, Y.; Wang, L.; Wan, X. Relative contributions of hydraulic dysfunction and carbohydrate depletion during tree mortality caused by drought. AoB Plants 2018, 10, plx069. [Google Scholar] [CrossRef] [PubMed]
  63. Creek, D.; Blackman, C.J.; Brodribb, T.J.; Choat, B.; Tissue, D.T. Coordination between leaf, stem, and root hydraulics and gas exchange in three arid-zone angiosperms during severe drought and recovery. Plant Cell Environ. 2018, 41, 2869–2881. [Google Scholar] [CrossRef] [PubMed]
Figure 1. Variations in leaf water potential of Reaumuria soongorica (Pall.) Maxim. (A,B) and Salsola passerina Bunge (C,D) during water treatments. Data are mean ± SE. Abbreviations: ΨPD, predawn leaf water potential; ΨMD, midday leaf water potential.
Forests 15 00287 g001
Figure 2. Variation in water use efficiency (AC), embolism resistance (D), leaf water potential (E,F), hydraulic safety margin (G), and leaf and stem water content (H,I) between different species or treatment. Lowercase letters indicate the variation between treatments for Reaumuria soongorica (Pall.) Maxim. traits (p < 0.05), and capital letters indicate the variation between treatments for Salsola passerina Bunge traits (p < 0.05). ‘*’ indicates significant differences between R. soongorica and S. passerina (p < 0.05), and ns indicates no difference (p > 0.05). Abbreviations: KS, sapwood specific conductivity; KL, leaf specific conductivity; Hv, Huber value; P50, pressure value in xylem at 50% loss of hydraulic conductivity; ΨPD, predawn leaf water potential; ΨMD, midday leaf water potential; HSM50, hydraulic safety margin; LWC, leaf water content; SWC, steam water content.
Forests 15 00287 g002
Figure 3. Vulnerability curves of Reaumuria soongorica (Pall.) Maxim. (A) and Salsola passerina Bunge (B) under different drought treatments. Abbreviations: P50, pressure value in xylem at 50% loss of hydraulic conductivity.
Forests 15 00287 g003
Figure 4. Variation in soluble sugar concentration (A,E), starch concentration (B,F), ratio of soluble sugar to starch concentration (C,G), and non-structural carbon concentration (D,H) between different species or treatments. Lowercase letters indicate the variation between treatments for Reaumuria soongorica (Pall.) Maxim. traits (p < 0.05), and capital letters indicate the variation between treatments for Salsola passerina Bunge traits (p < 0.05). ‘*’ indicates significant differences between R. soongorica and S. passerina (p < 0.05), and ns indicates no difference (p > 0.05). Abbreviations: L-SSC, leaf soluble sugar concentration; L-SC, leaf starch concentration; L-SSC/L-SC, ratio of leaf soluble sugar to starch concentration; L-NSC, leaf non-structural carbon concentration; S-SSC, stem soluble sugar concentration; S-SC, stem starch concentration; S-SSC/S-SC, ratio of stem soluble sugar to starch concentration; S-NSC, stem non-structural carbon concentration.
Forests 15 00287 g004
Figure 5. Variation in stomatal conductance (A) and net photosynthetic rate (B) between species or treatments. Lowercase letters indicate the variation between treatments for Reaumuria soongorica (Pall.) Maxim.traits (p < 0.05), and capital letters indicate the variation between treatments for Salsola passerina Bunge traits (p < 0.05). ‘*’ indicates significant differences between R. soongorica and S. passerina (p < 0.05), and ns indicates no difference (p > 0.05). Abbreviations: gs, stomatal conductance; Pn, net photosynthetic rate.
Forests 15 00287 g005
Figure 6. Principal component analysis of Reaumuria soongorica (Pall.) Maxim. (A) and Salsola passerina Bunge (B) traits. Abbreviations: KS, sapwood specific conductivity; KL, leaf specific conductivity; Hv, Huber value; P50, pressure value in xylem at 50% loss of hydraulic conductivity; ΨPD, predawn leaf water potential ΨMD, midday leaf water potential; HSM50, hydraulic safety margin; LWC, leaf water content; SWC, steam water content; L-SSC, leaf soluble sugar concentration; L-SC, leaf starch concentration; L-NSC, leaf non-structural carbon concentration; S-SSC, stem soluble sugar concentration; S-SC, stem starch concentration; S-NSC, stem non-structural carbon concentration; gs, stomatal conductance; Pn, net photosynthetic rate.
Forests 15 00287 g006
Figure 7. Results of pathways from piecewise structural equation models (pSEM) demonstrating the relationship between the Reaumuria soongorica (Pall.) Maxim. (A) or Salsola passerina Bunge (B) traits, respectively. The weights of the solid arrows correspond to p-values, where the thickest is <0.001, intermediate is <0.01, and thinnest is <0.05. The dotted arrows correspond to p > 0.05. Values on each arrow indicate the standardized parameter coefficient estimates for each pathway. The final model shows Fischer’s C and p-values as well as R2 for each pathway. Abbreviations: KS, sapwood specific conductivity; ΨMD, midday leaf water potential; L-SSC, leaf soluble sugar concentration; L-SC, leaf starch concentration; S-SSC, stem soluble sugar concentration; S-SC, stem starch concentration; gs, stomatal conductance.
Forests 15 00287 g007
Table 1. Results of two-way ANOVA for plant water relations traits. The values are F-values. ‘*’ indicates a significant effect (p < 0.05), and ‘**’ indicates a highly significant effect (p < 0.01). Abbreviations: KS, sapwood specific conductivity; KL, leaf specific conductivity; Hv, Huber value; P50, pressure value in xylem at 50% loss of hydraulic conductivity; ΨPD, predawn leaf water potential; ΨMD, midday leaf water potential; HSM50, hydraulic safety margin; LWC, leaf water content; SWC, steam water content.
TraitsSpeciesWater TreatmentSpecies × Water Treatment
KS8.50 *5.48 *0.87
KL68.92 **20.15 **14.13 **
Hv14.39 **3.303.57
P5027.98 **45.18 **1.37
ΨPD69.80 **164.43 **14.44 **
ΨMD57.03 **358.24 **2.04
HSM50107.14 **431.23 **0.33
LWC146.64 **33.92 **5.40 *
SWC122.15 **47.95 **10.42 **
Table 2. Results of two-way ANOVA for non-structural carbohydrates. The values are F-values. ‘*’ indicates a significant effect (p < 0.05), and ‘**’ indicates a highly significant effect (p < 0.01). Abbreviations: L-SSC, leaf soluble sugar concentration; L-SC, leaf starch concentration; L-NSC, leaf non-structural carbon concentration; S-SSC, stem soluble sugar concentration; S-SC, stem starch concentration; S-NSC, stem non-structural carbon concentration.
TraitsSpeciesWater TreatmentSpecies × Water Treatment
L-SSC48.34 **61.34 **0.32
L-SC21.60 **59.72 **1.69
L-NSC0.179.03 **2.10
S-SSC4.131060.56 **125.35 **
S-SC2.5512.48 **5.36 *
S-NSC5.66 *128.18 **26.12 **
Table 3. Results of two-way ANOVA for stomatal conductance and net photosynthetic rate. The values are F-values. ‘**’ indicates a highly significant effect (p < 0.01). Abbreviations: gs, stomatal conductance; Pn, net photosynthetic rate.
TraitsSpeciesWater TreatmentSpecies × Water Treatment
gs28.10 **93.38 **0.26
Pn63.74 **1280.85 **2.779
Disclaimer/Publisher’s Note: The statements, opinions and data contained in all publications are solely those of the individual author(s) and contributor(s) and not of MDPI and/or the editor(s). MDPI and/or the editor(s) disclaim responsibility for any injury to people or property resulting from any ideas, methods, instructions or products referred to in the content.

