Article

Spatial and Temporal Variation in Primary Forest Growth in the Northern Daxing’an Mountains Based on Tree-Ring and NDVI Data

1
Heilongjiang Province Key Laboratory of Geographical Environment Monitoring and Spatial Information Service in Cold Regions, Harbin Normal University, Harbin 150025, China
2
Heilongjiang Wuyiling Wetland Ecosystem National Observation and Research Station, Yichun 153000, China
*
Author to whom correspondence should be addressed.
Forests 2024, 15(2), 317; https://doi.org/10.3390/f15020317
Submission received: 8 January 2024 / Revised: 30 January 2024 / Accepted: 5 February 2024 / Published: 7 February 2024
(This article belongs to the Section Forest Ecology and Management)

Abstract

:
We used tree-ring width data of Larix gmelinii and Pinus sylvestris var. mongolica from the northern region of the Daxing’an Mountains, China; normalized difference vegetation index (NDVI) data; and microtopographic information (elevation, slope direction, slope gradient, and topographic location index) to assess spatiotemporal dynamics in the growth of the boreal forest and topographic patterns of forest decline under the background of climate warming. Forest growth trends were determined based on tree growth decline indicators and NDVI time series trends, and topographic patterns of forest decline were analyzed using the C5.0 decision tree model. More climatic information was present in the radial growth of the trees at higher elevations, and P. sylvestris var. mongolica was influenced strongly by climatic factors of the previous year. Since 1759, tree radial growth trends in the study area have experienced two recessions during 1878–1893 and 1935–1943, which were characterized by persistent narrow whorls of tree rings of below-average growth. Changes in NDVI and tree-ring information were similar, and they together indicate a high risk of declining forest growth in the northern Daxing’an Mountains after 2010, especially at higher elevations. The NDVI time series showed that the high temperatures in 2003 negatively affected forest growth in the study area, which was confirmed by the tree-ring data. The decision tree terrain model results had an accuracy of 0.861, and elevation was the most important terrain factor affecting forest decline. The relative importance of elevation, topographic position index, aspect, and slope was 58.41%, 17.70%, 16.81%, and 7.08%, respectively. Classification rule-based decision tree models can be used to quantify the effects of terrain factors on tree growth. This research methodology can aid the management of regional forestry resources and the conservation of forest resources under the background of climate change, which increases the risk of forest decline.

Graphical Abstract

1. Introduction

Forest ecosystems are critical components of terrestrial ecosystems that play a key role in the global material cycle and energy flow, and they are important for the construction of ecological civilization. Global warming as a result of climate change poses major long-term risks to forest ecosystems [1]. The IPCC Sixth Assessment Report (AR6) shows that global climate change will intensify in the coming decades, and extreme heat could pose a serious threat to the health of some forests [2]. Climate change has led to the degradation of perennial permafrost at high latitudes and altitudes [3,4] and the movement of some plant suitability zones towards the poles and high altitudes, which has altered the internal structure of ecosystems. Global warming has lengthened the growing season of vegetation, but stronger solar radiation and intensified extreme weather events might increase the vulnerability of some forest ecosystems to climate extremes, thereby reducing their resistance and ability to recover [5]. Global and regional forest health has thus received increased research attention [6]. For example, Rafał [7] used incremental radial growth changes and tree trait parameters to explore the decline in Abies alba Mill.; Li and Zhang [8] concluded that tree growth decline can be expressed as a tree-ring width that is consistently below the natural growth level and proposed an indicator of growth decline for a single tree. This approach allows standardized thresholds to be set for different environments in which trees grow, such as primary forests unaffected by human activities and planted forests subject to high levels of external disturbance. Forest decline has been documented in mid-latitude forests and some montane forests [9,10,11]. Because forests at high latitudes and in alpine zones are more sensitive to climate change, they have been used by many researchers to explore the link between climate change and forest decline.
Dendroclimatology is an effective method for studying the response and feedback mechanisms between trees and climate [12]. Tree rings are proxies of cumulative forest productivity that can be used to infer changes in forest growth [13]. Depending on the spectral properties of features, remotely sensed data can be used to invert surface information, including vegetation greenness and topographic relief. The normalized difference vegetation index (NDVI) obtained by remote sensing reflects the difference between red and near-infrared light reflected by plant canopies, and it can be used to quantify forest supply and the leaf area index [14,15]. Remote sensing permits NDVI to characterize continuous spatial variation in forest health [14,16]. There is a loose linkage between tree-ring information and remote sensing data [17,18], and the magnitude of this linkage varies among climates, forest types, and environmental conditions. D’Andrea et al. [19] explored forest decline using tree-ring and NDVI data and found that higher correlations between tree-ring and NDVI data were observed at drought-prone sites; a similar conclusion was obtained in Bunn et al. [20]. Coulthard et al. [21] suggested that the relationship between tree-ring and NDVI data might stem from the interaction between precipitation and stand differences. Zhang et al. [22] found that the consistency of tree-ring and NDVI correlations became weaker with increasing distance. Therefore, combining tree-ring information with NDVI is useful for exploring interannual spatial and temporal changes in vegetation phenology and the responses of vegetation to climate change.
Many researchers have shown that topographic factors, such as elevation and aspect of mountain forests, redistribute water and nutrients required for tree growth, which places different environmental pressures on trees under different microtopographical conditions [23,24,25]. For example, Kermavnar et al. [25] conducted an isotope study of beech tree rings in the northern hemisphere and found that trees growing on the southern slopes had a high δ13C content; they also found that relative humidity was lower on southern slopes and that southern slopes received more solar radiation compared with slopes with different aspects. Chen et al. [26] characterized the effects of elevation and slope on tree growth in their NPP study of forests in the Yangtze River Basin; flat slopes received more solar radiant energy relative to steeper slopes, and an increase in slope led to decreased precipitation and increased temperature limitation. Differences in elevation cause changes in temperature and moisture that can result in a gradual change in the length of the vegetation growing season with elevation [27]. These studies demonstrate the need to consider the effects of microtopography when exploring tree growth trends. However, most previous studies have compared the effects of single factors in different terrain environments on the growth of trees. In addition to this, some analyses based on multifactorial terrain models in the warm temperate zone have been conducted [28], but no such studies have been conducted in forests of the northern alpine regions.
To explore whether growth trends in the boreal alpine forest are affected by a warming climate, under which microtopographic patterns trees face a higher risk of decline, we determined whether (1) the environmental conditions of climate, soil, and biotic factors within the study area are homogeneous and consistent; (2) the stand density in the forest area is uniform and dense enough to make the NDVI in the study area representative of forest productivity and photosynthesis; and (3) NDVI is statistically significantly correlated with annual tree-ring data. In this paper, we utilized tree-ring data of Pinus sylvestris var. mongolica and Larix gmelinii in the northern part of the Daxing’an Mountains and NDVI, to analyze historical changes in tree growth decline using tree growth decline indicators and explore future forest growth trends. Four topographic components were used to explore spatial patterns of forest decline using NDVI as a dependent variable, and spatial and temporal changes in the primary forests of the northern Daxing’an Mountains were determined using tree-ring information and remote sensing image data. Studies of the growth dynamics of boreal forests under global climate change are important for the ecological protection and management of forest ecosystems in the Daxing’an Mountains.

2. Materials and Methods
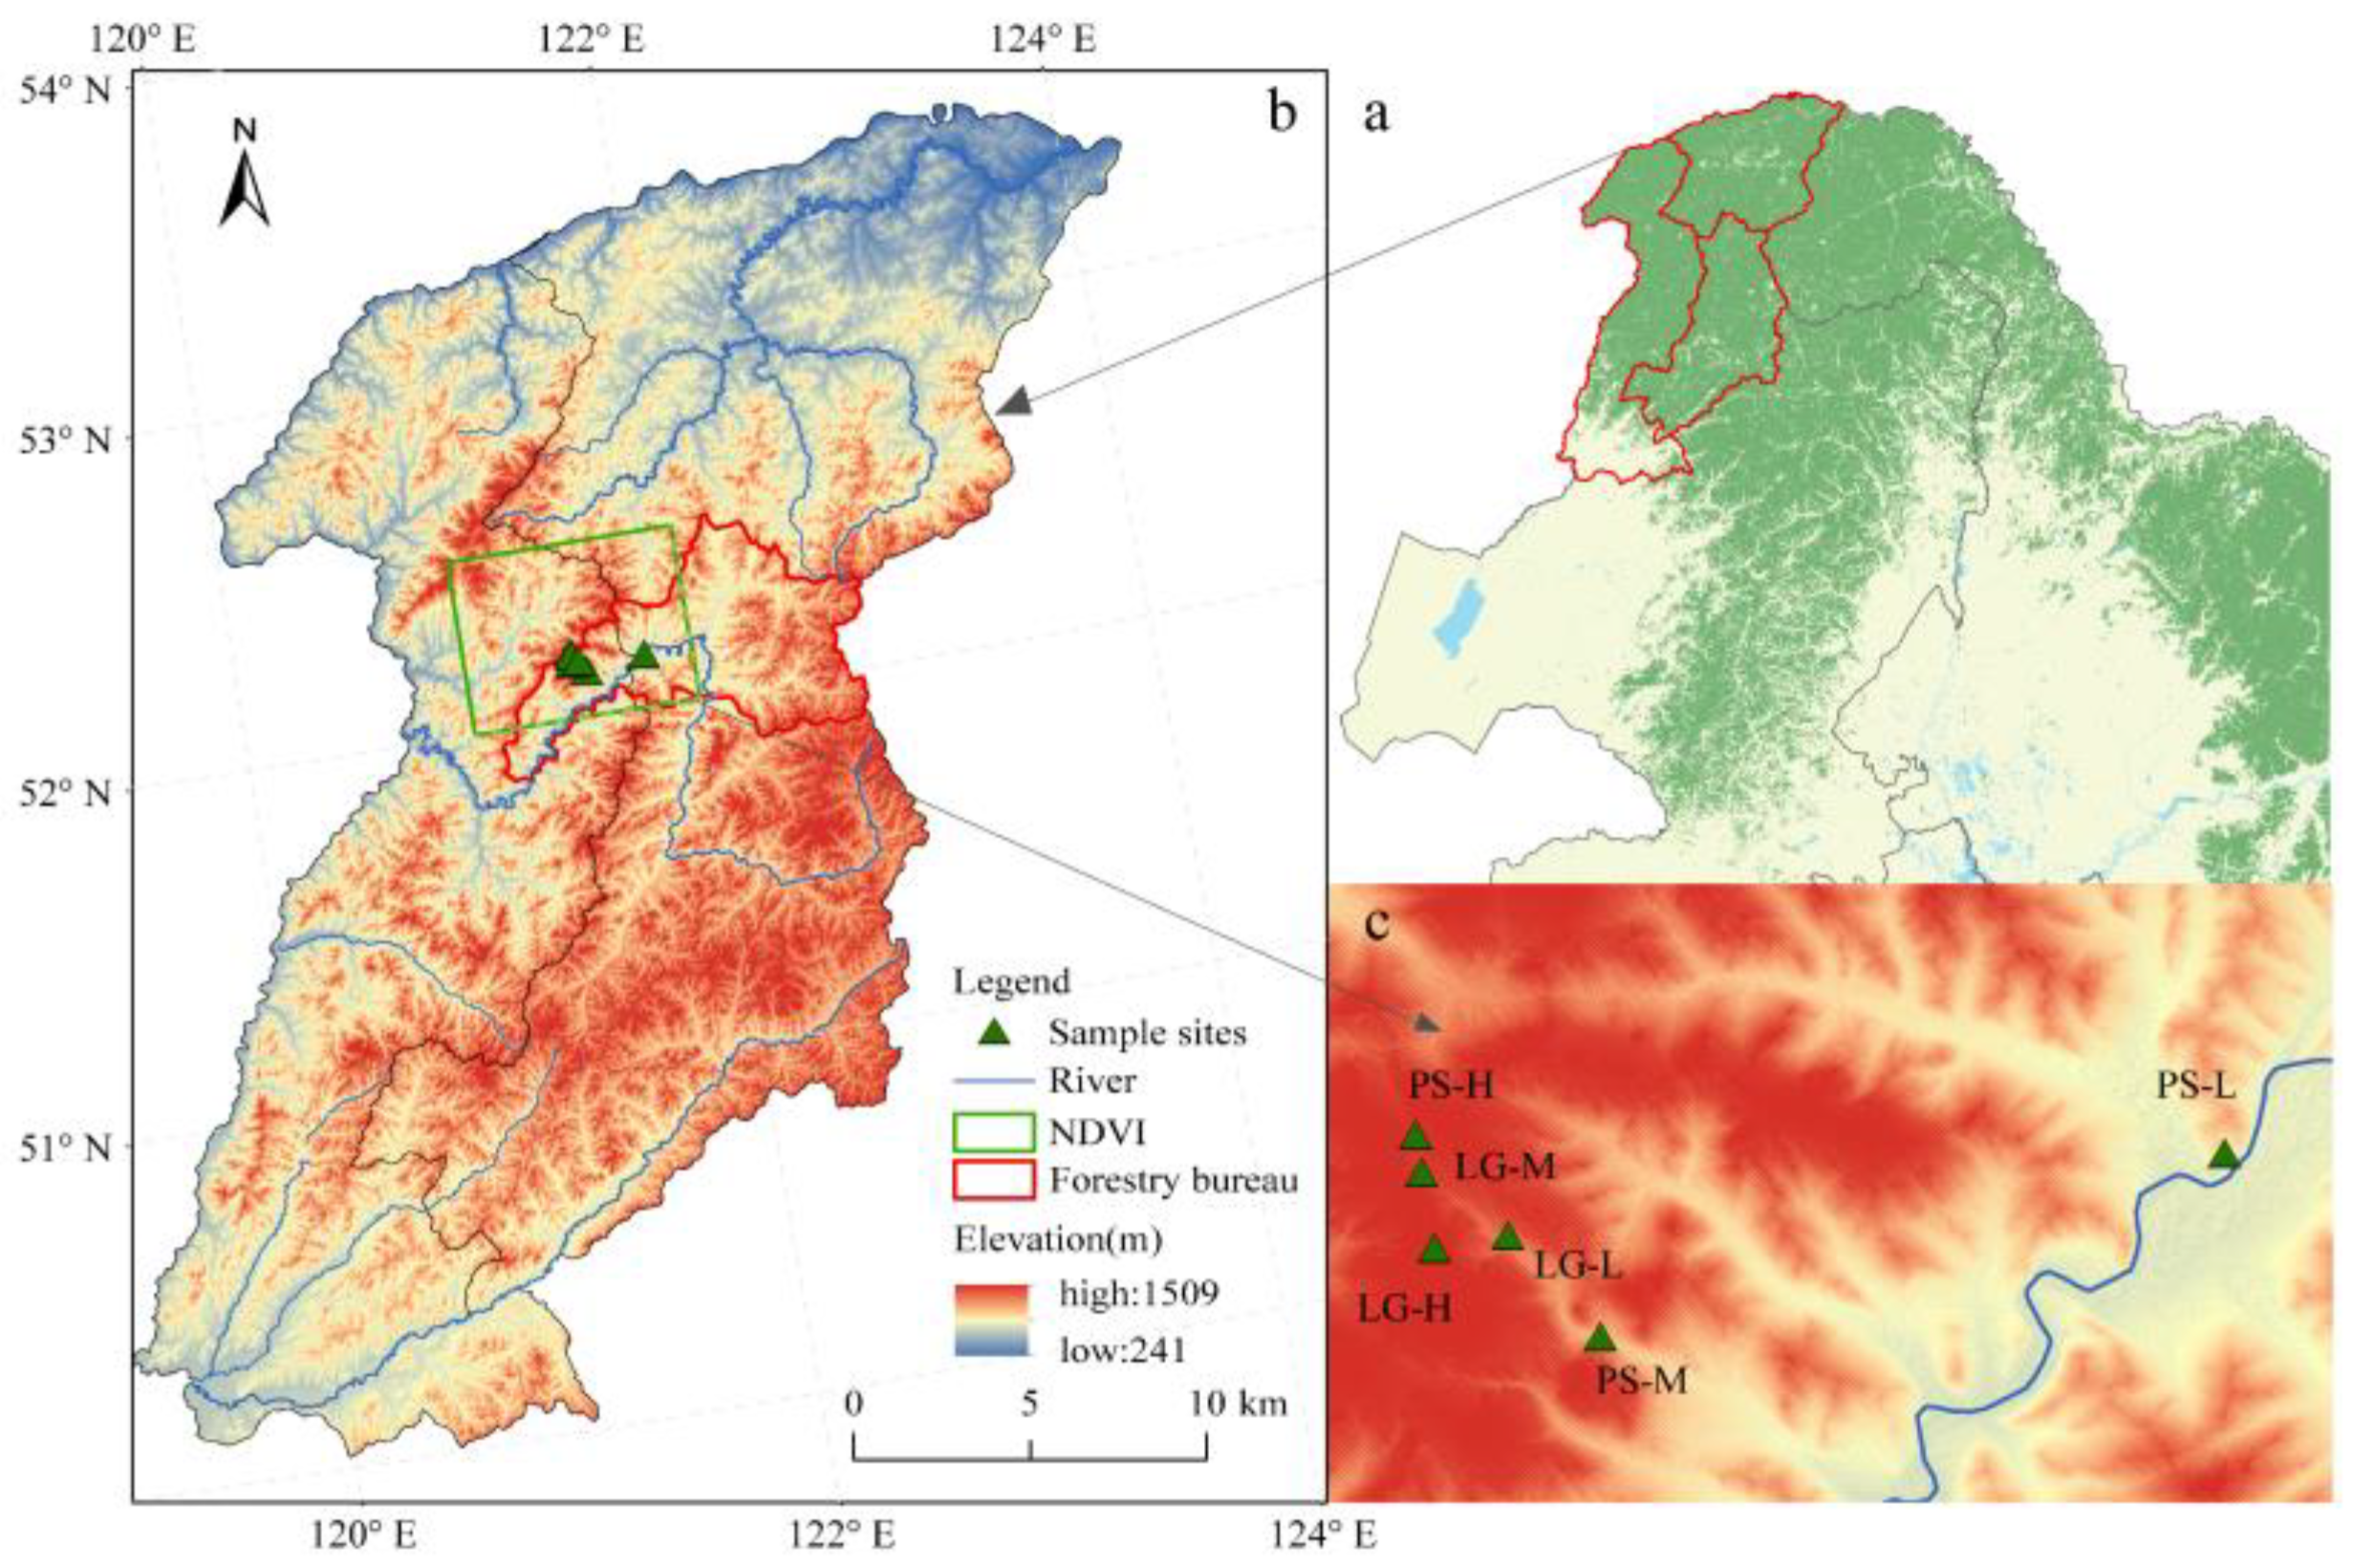
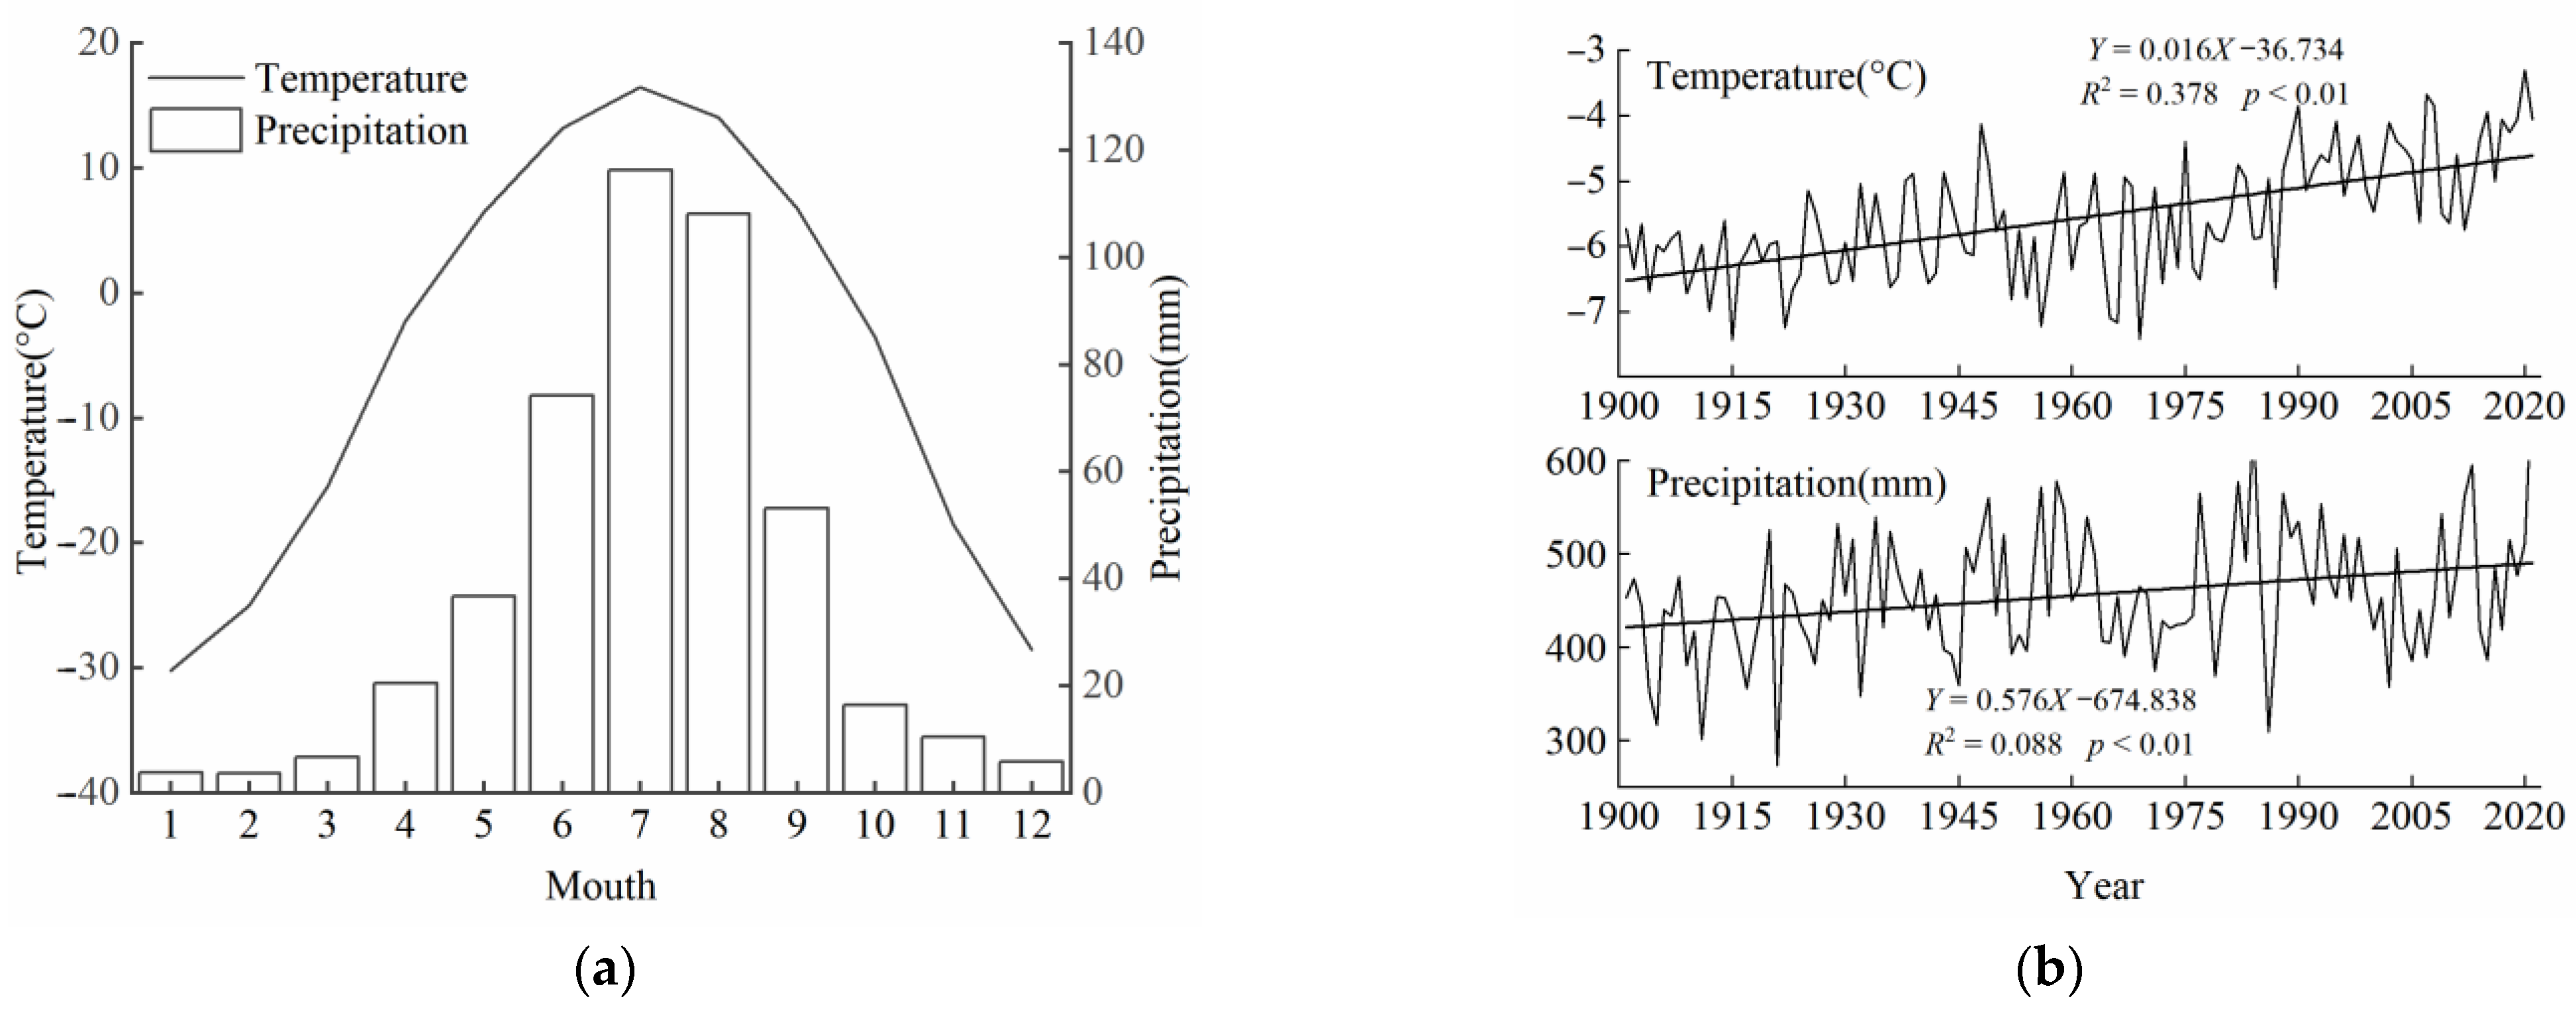
2.1. Study Area

The study area was located in the northern part of the Daxing’an Mountains, which is managed by the Mangui Forestry Bureau (52°–52°30′ N, 121°–122° E); it is a low-to-mid-mountainous landscape (Figure 1). The Mangui Forestry Bureau is the northernmost state-owned Forestry Bureau in the Inner Mongolia Autonomous Region. It is located on the northwest slope of the northern foot of the Daxing’an Mountains, which is in the core area of the Daxing’an Mountains and is dominated by coniferous forest with a forest coverage rate of 94.1%. The study area has a cold-temperate continental monsoon climate with cold, dry winters and warm, humid summers. The average annual temperature is −5.6 °C, and there is a large temperature difference between day and night. The annual precipitation is 455 mm, which is mostly concentrated in July and August (Figure 2). The study area is dominated by pristine natural forested areas, with a large proportion of middle-aged forests, and brown coniferous forest soils are the dominant soil type. The main tree species in the area are L. gmelinii, P. sylvestris var. mongolica, Betula platyphylla, and Populus davidiana. According to the growth distribution of P. sylvestris var. mongolica and L. gmelinii in the study area, one sampling point was selected at the upper and lower limits of their distribution and at the middle altitude, and a total of three Pinus sylvestris var. mongolica sample sites (PS-A, PS-B, and PS-C) and three Larix gmelinii sample sites (LG-A, LG-B, and LG-C) were selected.

2.2. Dendrochronological Methods

Tree-ring information was collected in July 2022, and the sampling locations are shown in Figure 1. Two species, L. gmelinii and P. sylvestris var. mongolica, were selected for sampling because they are drought-tolerant and sensitive to climate change; both species are dominant and older. Following the basic principles of dendrochronology [29], six sampling sites were selected along an altitudinal gradient from 700 to 1300 m. At least 20 trees were selected in as agglomerative a manner as possible for each sampling site, and two or three cores for each tree were taken from undamaged dominant trees using an increment borer at breast height (~1.3 m); Samples from one sampling site were collected over one day, and a total of 132 trees and 347 sample cores were obtained. The collected tree cores were air-dried and fixed on grooved wooden strips, and the sample cores were sanded until the tree rings were clearly visible [30]. The samples were then subjected to tree-ring width measurements using a LINTAB6 tree-ring analyzer with 0.001 mm accuracy; the quality of the tree-ring width data was assessed, and these data were cross-dated [29,31]. Finally, the ARSTAN program was used to eliminate age trends in the chronological sequence [32], which yielded standardized, dimensionless chronologies of the ring width index (RWI). A spline function was used to fit the tree growth trend with age, with a smoothed curve of 67% of the length of the series and a frequency response coefficient of 0.5. The dimensionless, single-sample tree-ring width index (STRI) was obtained by dividing the raw ring widths by the fitted growth trend curve.

2.3. Meteorological Data and Remote Sensing Images

Climate data were obtained from the Climatic Research Unit 4.06 grid point dataset of the University of East Anglia, UK, which included monthly mean temperature and precipitation data from 1901 to 2021 at a spatial resolution of 0.5°. NDVI data, which can be used to continuously monitor ecosystem health at large spatial scales, were used to evaluate the growth status of vegetation and conduct a comparative analysis of tree-ring data. This paper uses the NOAA Climate Data Record (CDR) product of the AVHRR Normalized Difference Vegetation Index with a spatial resolution of 0.05° × 0.05° [33]. A monthly-scale time series for this dataset from January 1982 to December 2019 was obtained for the following region: 52°–52°30′ N, 121°–122° E. An NDVI image of June 2003 from the MOD13Q1 dataset within the study area with a spatial resolution of 250 m was obtained [34]. Land use data at a resolution of 10 m in 2021 were used to extract natural forest land within the study area to eliminate the effects of other land use types on the spatial analysis [35]. Elevation data were obtained from the ASTER GDEMV3 digital elevation model data product with a spatial resolution of 30 m (https://www.gscloud.cn/home), and ArcGIS 10.2 was used to extract slope, aspect, and topographic position index (TPI) raster data.

2.4. Data Analysis

2.4.1. Statistical Analyses

Kernel density estimation (KDE) was used to characterize the distribution of SRWI for specific years. Principal component analysis and Pearson correlation analysis applied to the RWI at each sampling site were used to understand the relationships between sampling sites. Pearson correlation analysis was used between the tree-ring data (RWI, PC1) and the NDVI time series to determine the optimal month for building the decision tree terrain model. Simple linear regression equations for RWI and NDVI versus year were calculated for the period 2010–2022. KDE was performed in R 4.2.1. Other statistical analyses were performed by using commercial software, IBM SPSS Statistics 26.0 (IBM Corp. Armonk, NY, USA).

2.4.2. Indicators of Decline in Single-Tree Growth

The effects of biological pests and drought stress experienced by trees during radial growth are usually expressed in tree-ring widths (i.e., long-term and short-term values that are lower than the mean) [7,8]. Therefore, the thresholds for assessing the decline in tree growth were as follows: (1) values of STRI must be less than 1 for at least six consecutive years; (2) the average value of the STRI must be less than 0.75 during this period; and (3) the lowest value of the STRI must be less than 0.6 for at least three years. Criteria for evaluating the severity of individual tree declines were determined based on the sample size and proportion of growth decline. A proportion of growth decline greater than 20% and 40% was considered a growth decline and a significant growth decline, respectively.

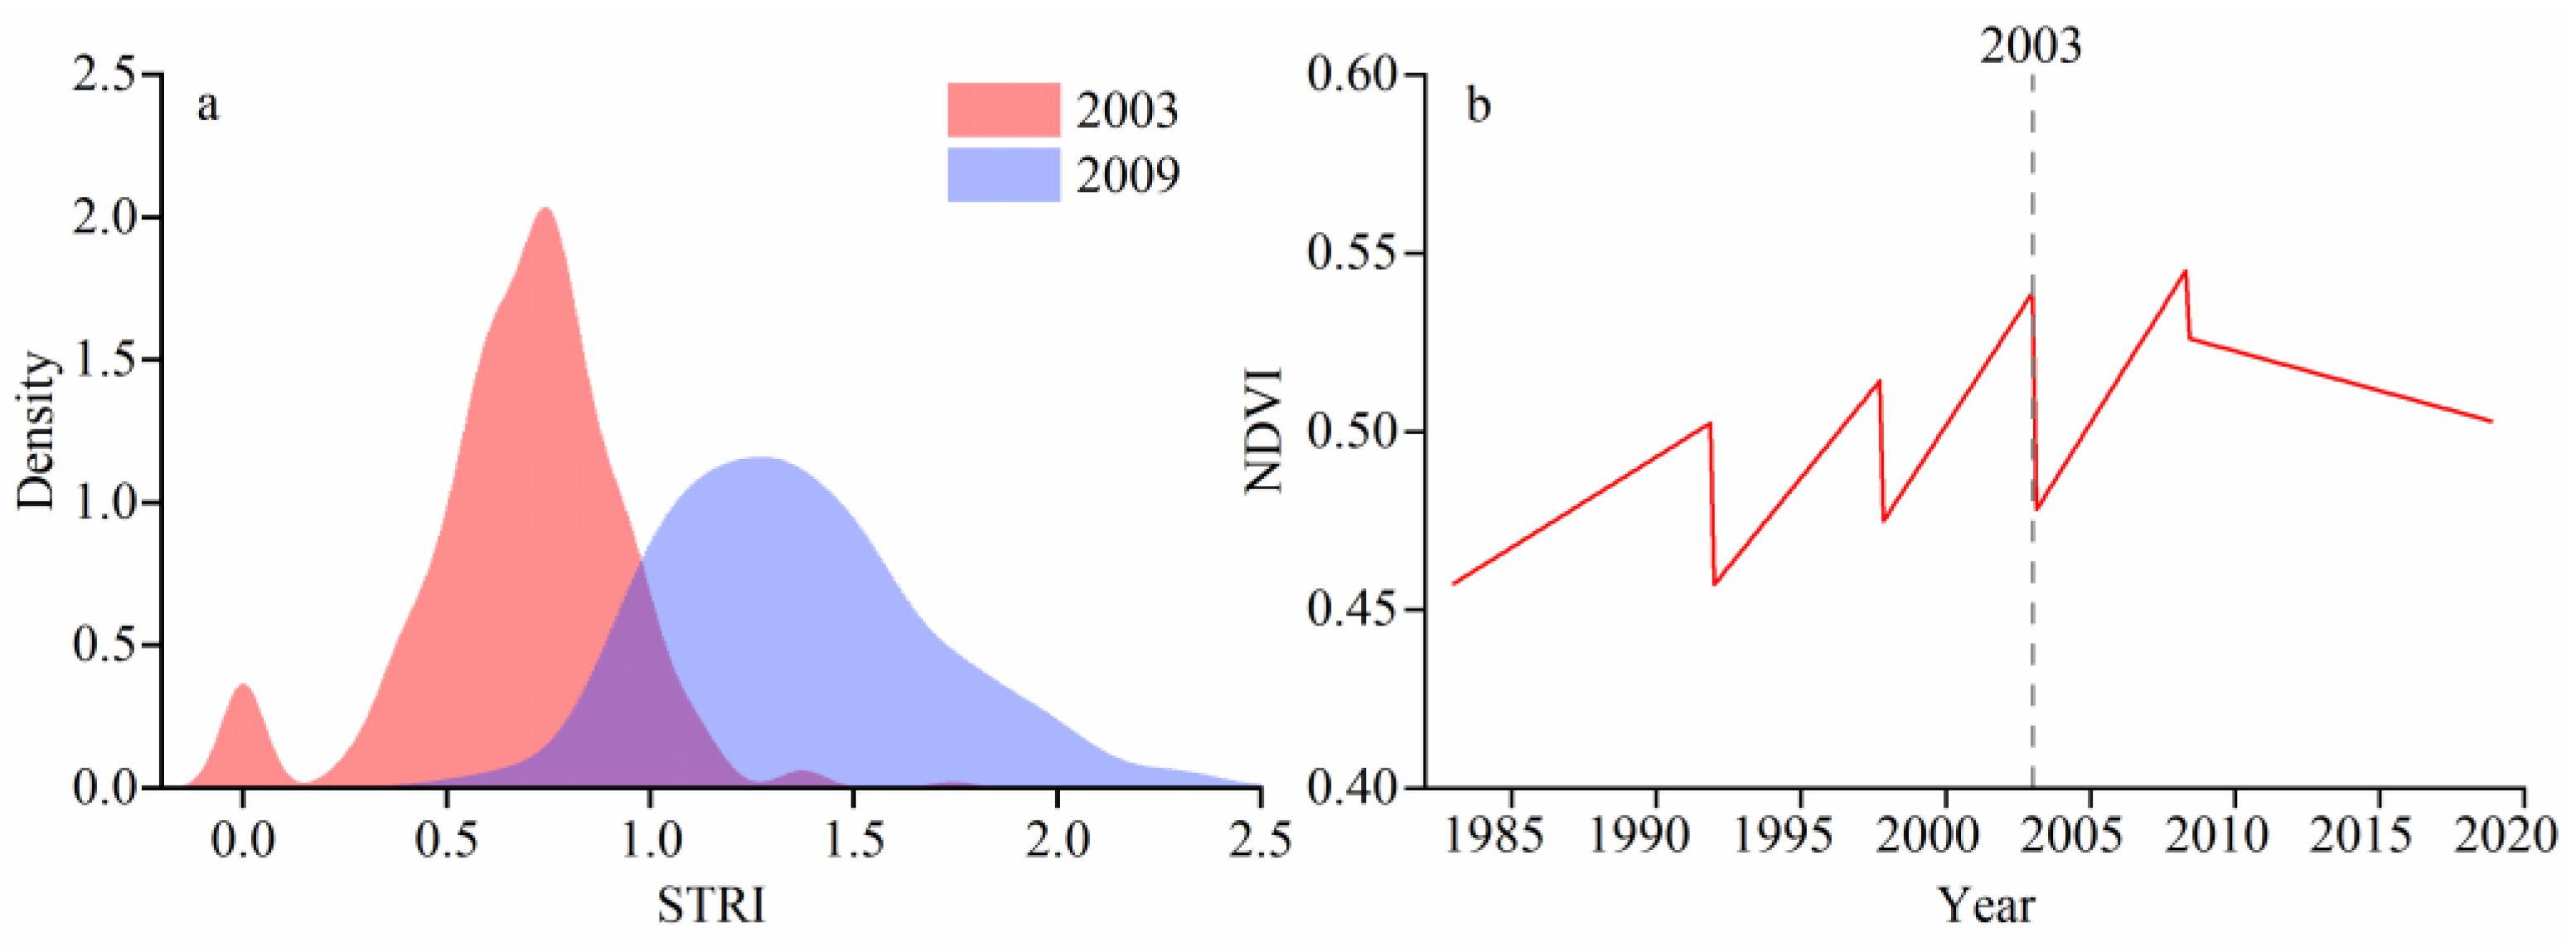
2.4.3. BFAST Trend Breakpoints

The Breaks for Additive Season and Trend (BFAST) method was used to decompose the May–November 1982–2019 NDVI time series into three terms: seasonal cycle, long-term trend, and residual contribution; season breaks and trend breaks in the sequence were detected. This method ignores linear trends in changes in vegetation activity and detects gradual or abrupt changes in forest components [14,36]. Frequency distribution analysis of data corresponding to tree-ring width was performed using the year of the breakpoints detected by BFAST. A single peak in the distribution indicates that the overall growth of the forest in that year is healthy [28], and multiple peaks in the frequency distribution or low peak areas indicate that the health of the forest is poor.

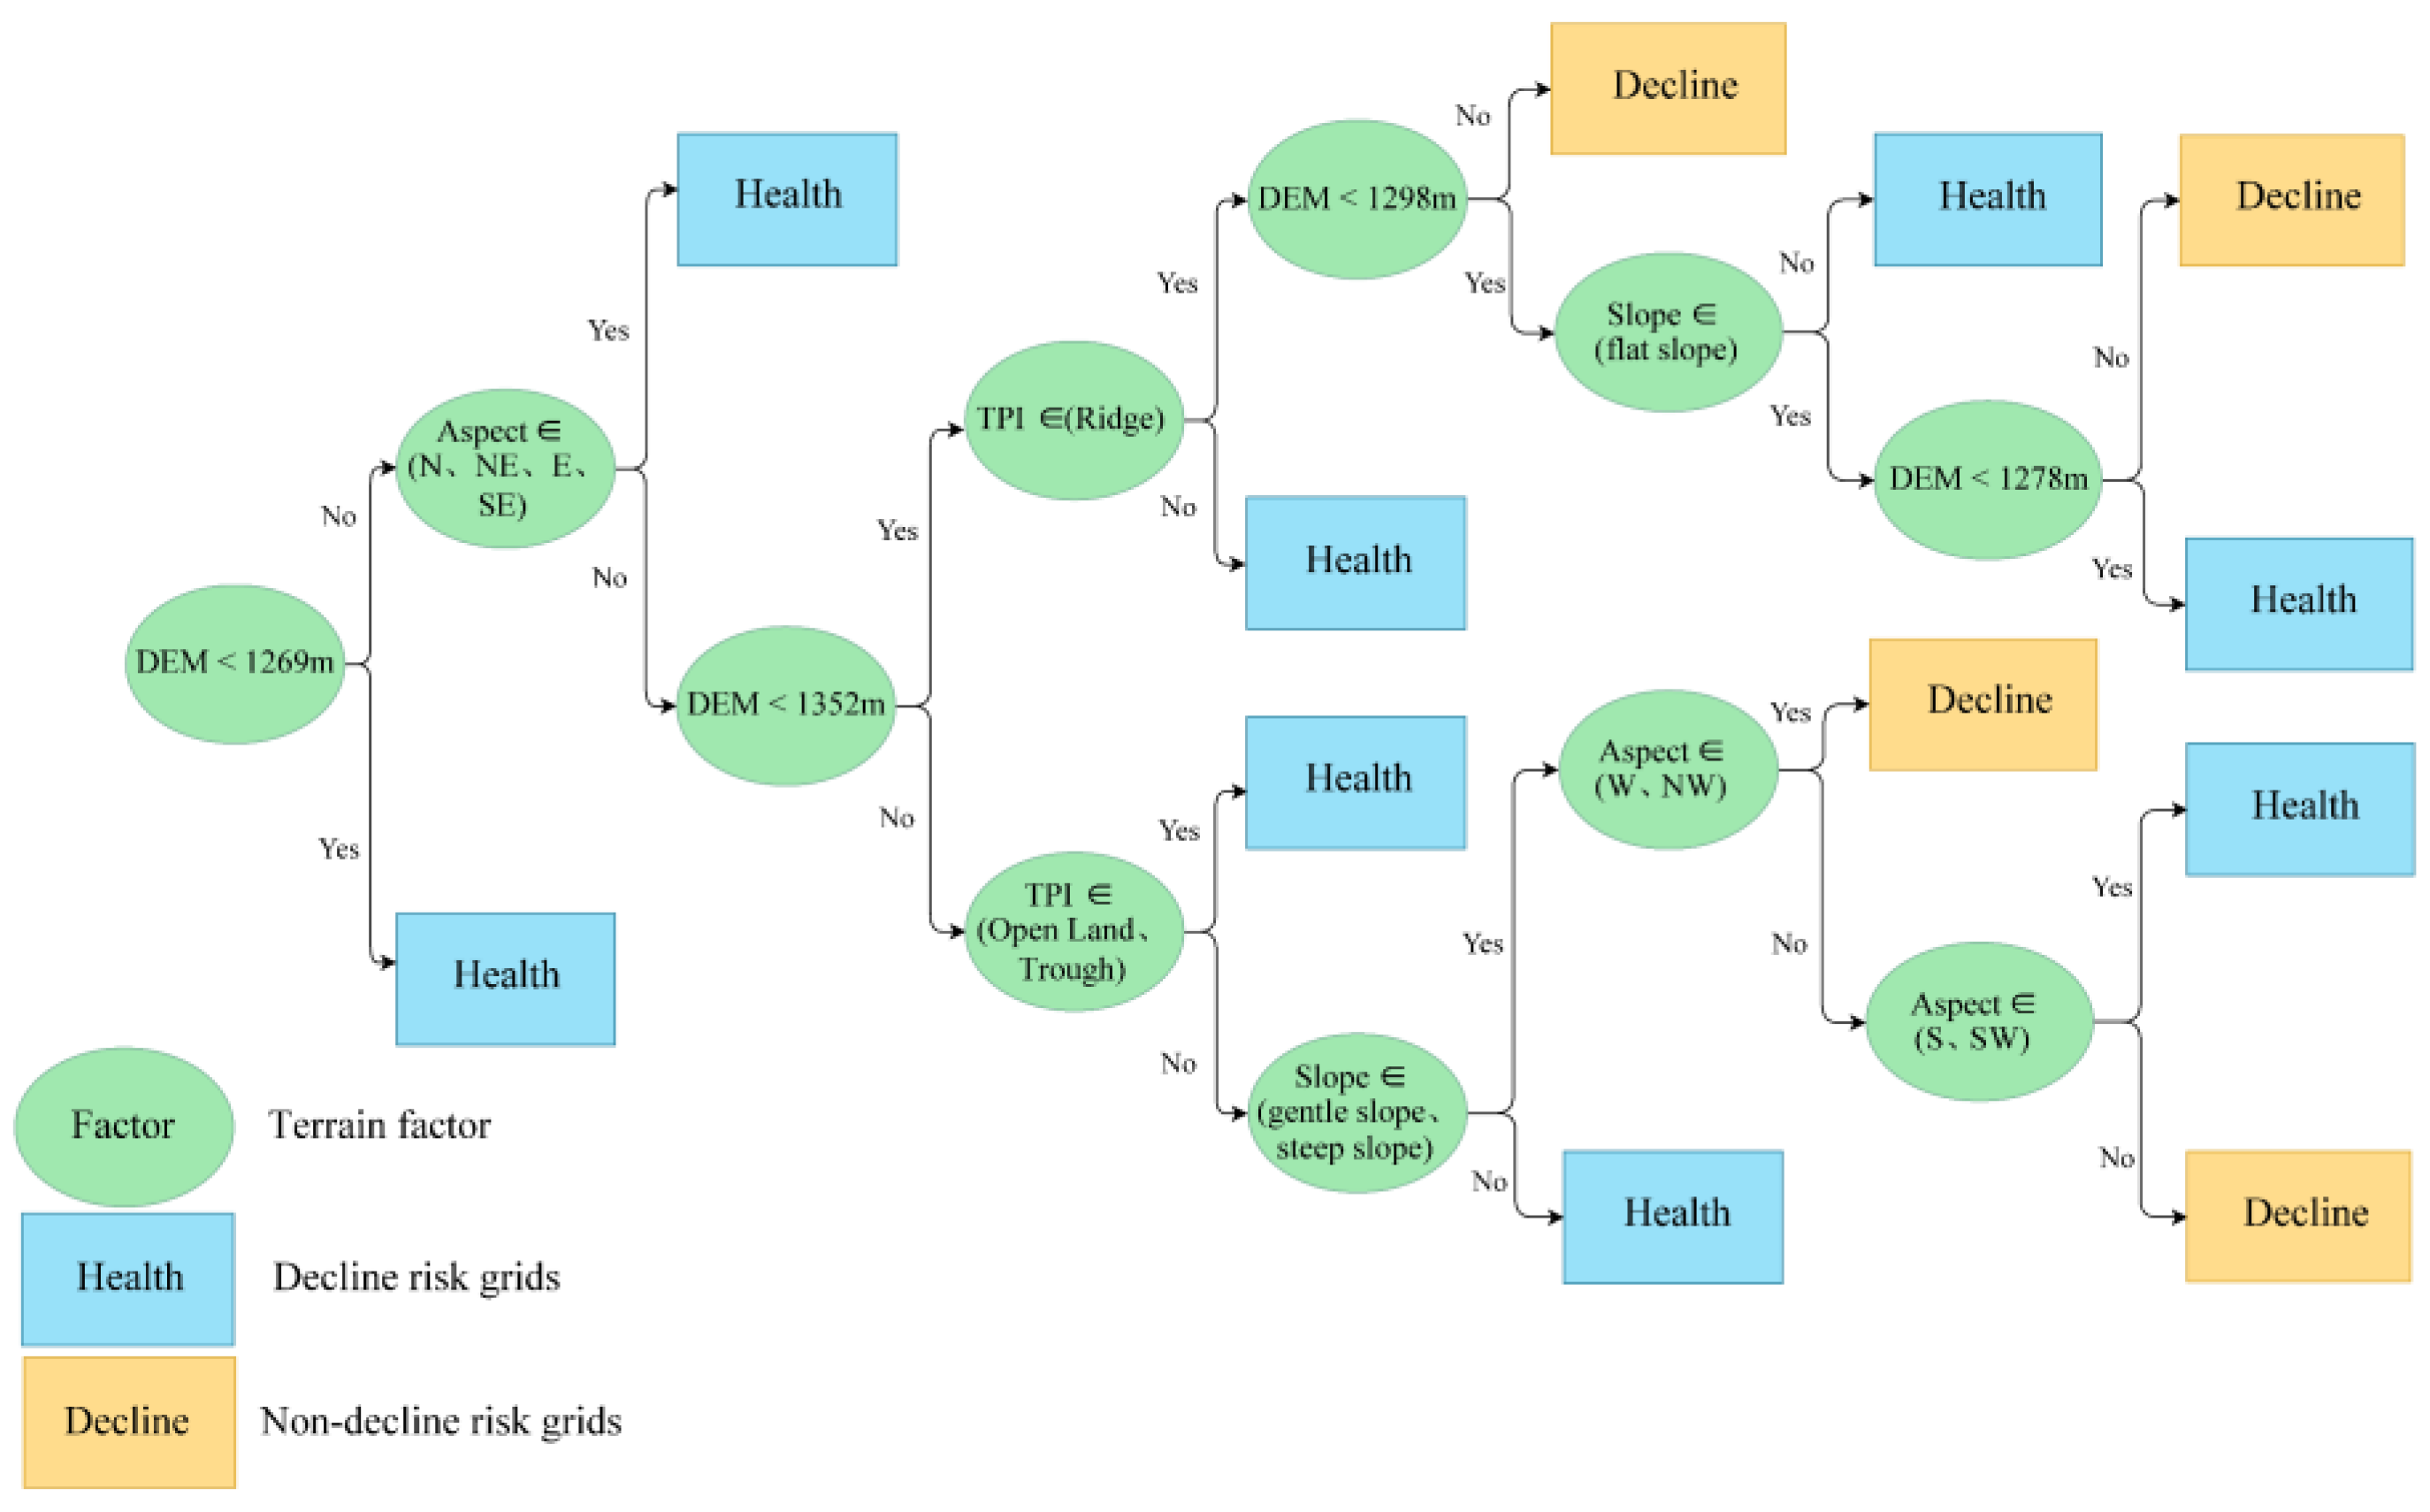
2.4.4. C5.0 Decision Trees

The month with the strongest correlation between tree-ring data and NDVI was used to explore the effect of topographic conditions on vegetation growth. The raster data were analyzed using a pixel-by-pixel approach. According to the MODIS image quality field, the correlation between NDVI and tree-ring information, and trend breakpoints, June 2003, was determined to be the optimal period for exploring the effects of topographic factors on tree growth decline. A value of 0.6 for NDVI was used as the threshold for growth decline based on the percentage of growth decline (9%). The terrain component was used as a factor for identifying terrain patterns of forest growth decline using a decision tree model interpreted by Boolean logic [28,37]. Due to the small percentage of tree growth decline, the C5.0 decision tree, which has higher performance for unbalanced data, was used for analysis [38,39,40]. The boosting method was used to iterate the model and improve the robustness and recognition rate [41,42]. Model performance was assessed by 5-fold cross-validation with three repetitions and area under the subject operating curve (AUC) [43]. To ameliorate imbalances in the data, enhance accuracy, and prevent the overfitting of decision trees, the decision tree model was used with a cost matrix to increase the weight of the true value of the growth decline being misclassified.

3. Results

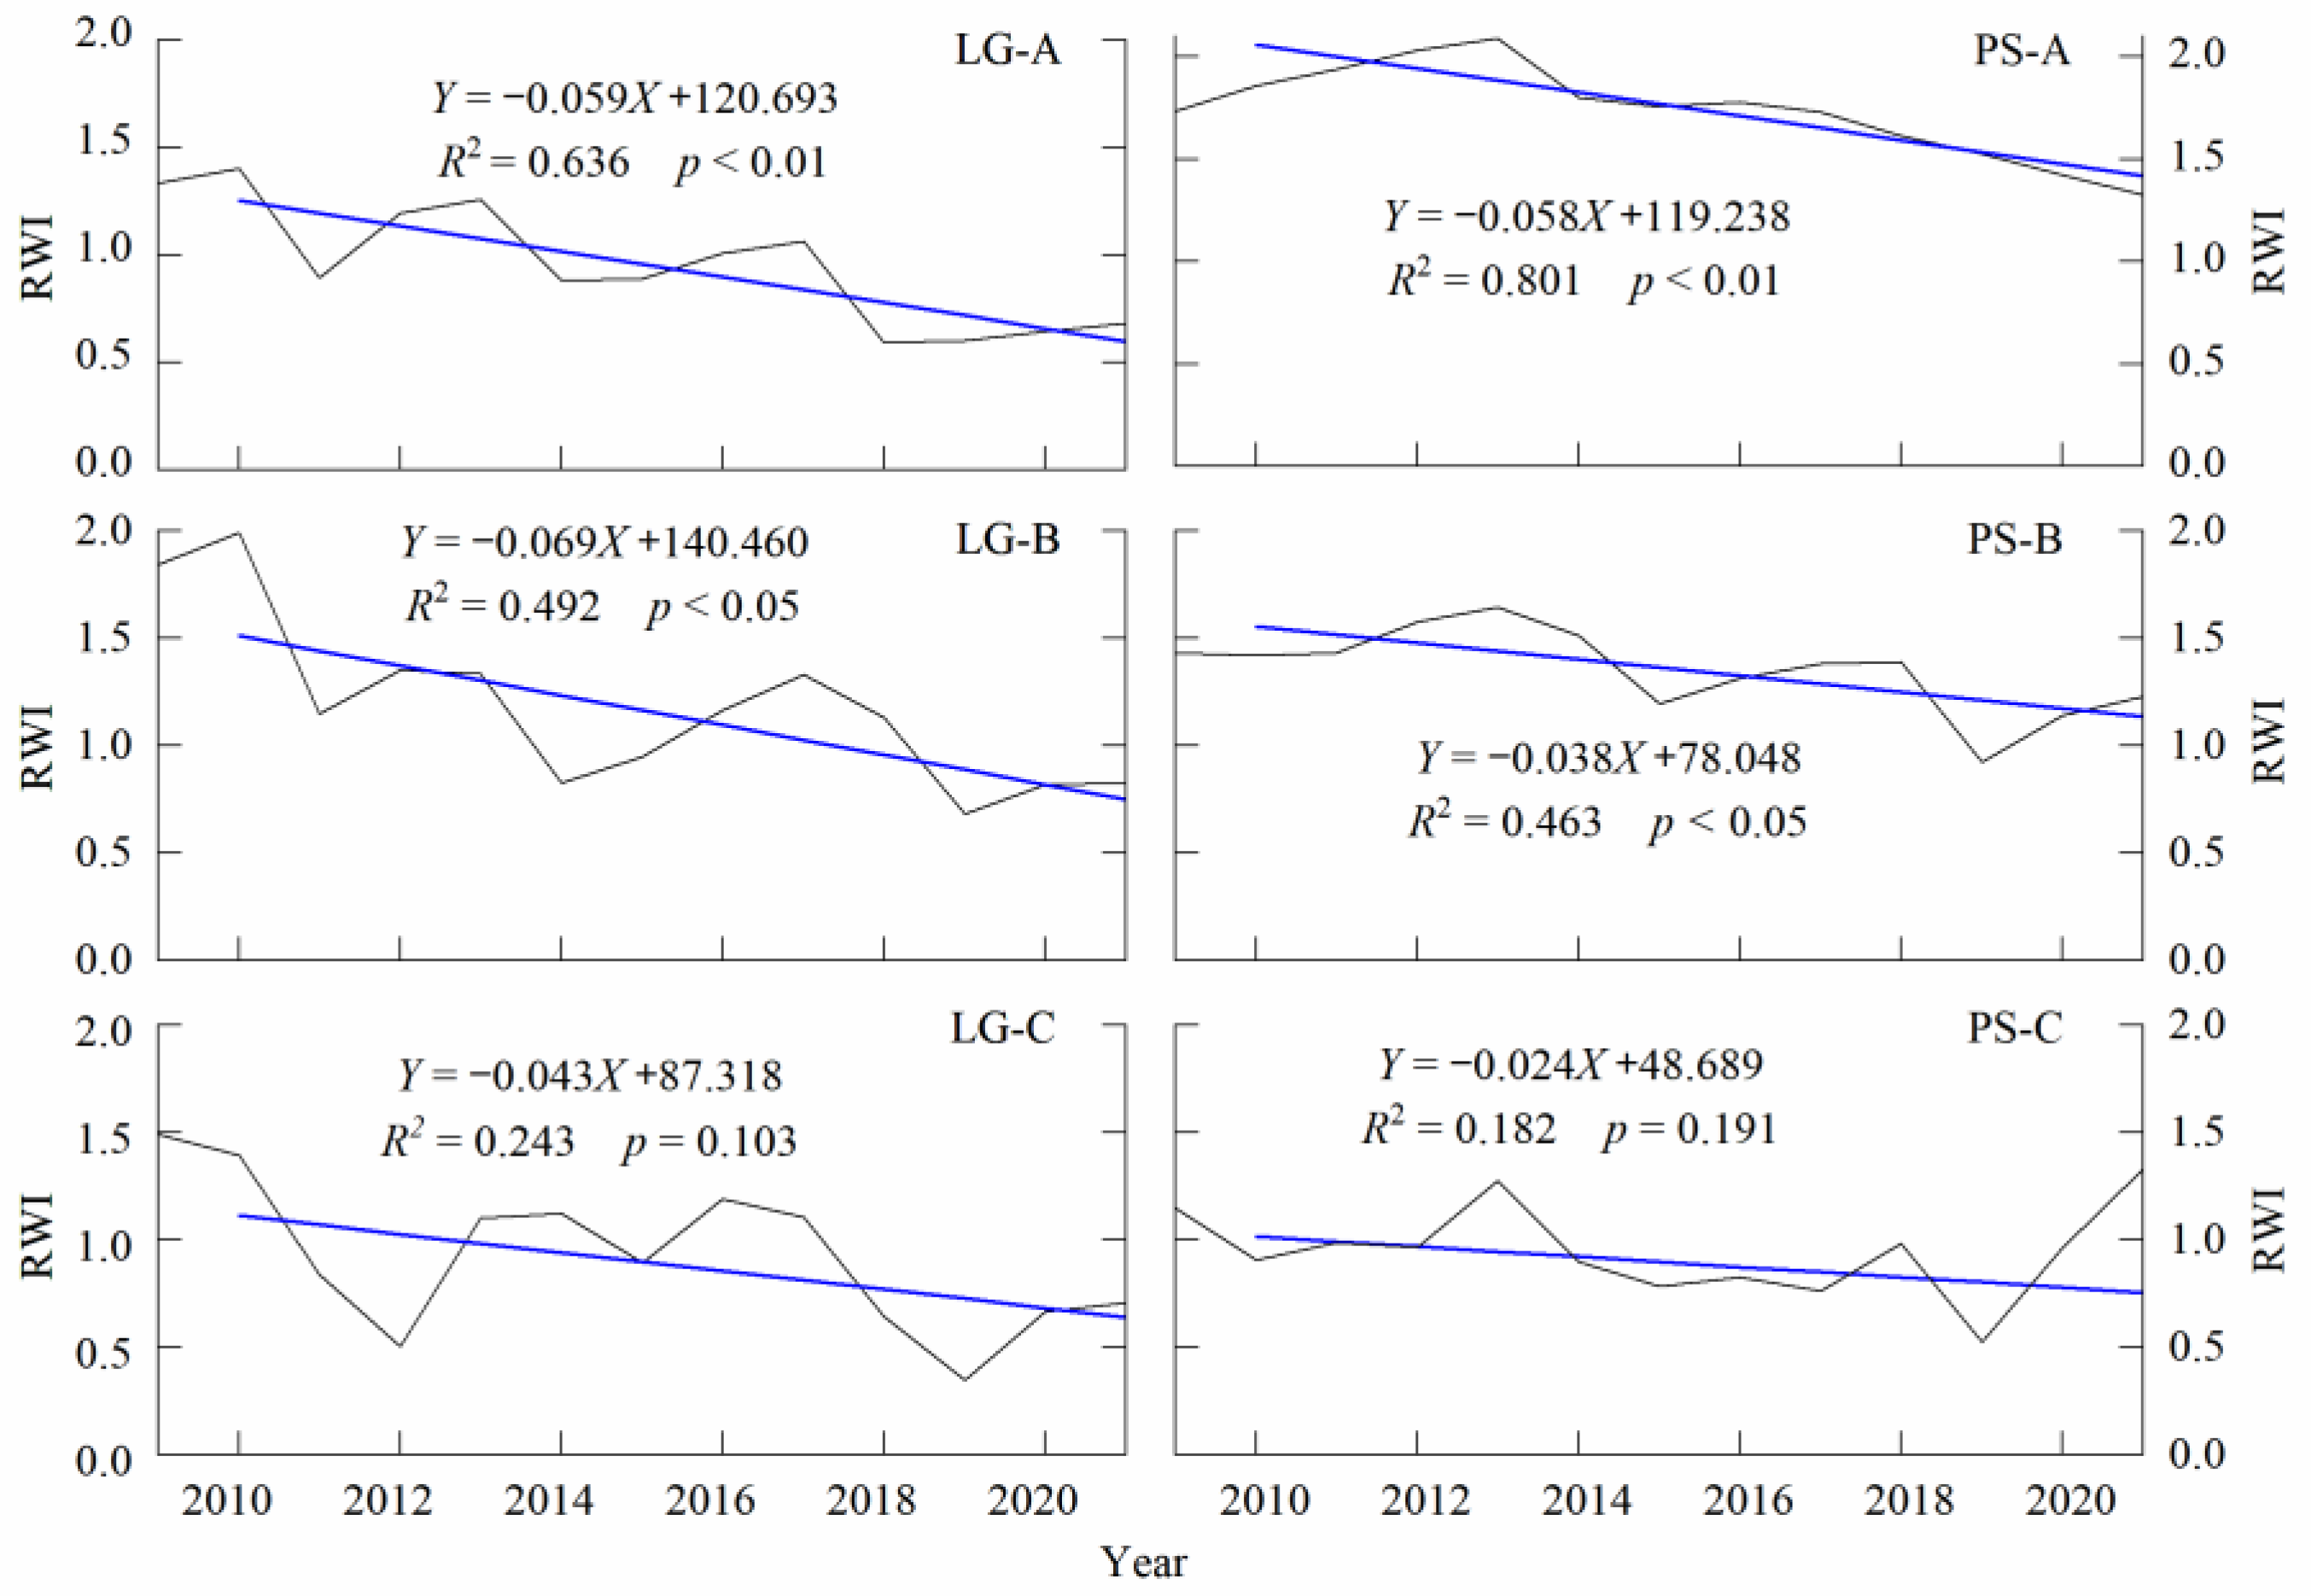
3.1. Standardized Chronological Characteristics of Tree Rings

The chronological characteristics of the six sampling sites showed (Table 1) that the first-order autocorrelation coefficients of the camphor P. sylvestris var. mongolica were greater than those of the L. gmelinii at the same elevation, and the first-order autocorrelation coefficients of the PS-A chronology were the highest (0.957). This indicates that the radial growth of trees in the region was affected by changes in climatic factors in the previous year, and P. sylvestris var. mongolica was strongly affected by climatic factors in the previous year. Both tree species showed higher signal-to-noise ratios at higher elevations, suggesting that tree-ring data at higher elevations may contain more climatic information. The high-elevation sample site PS-A had the largest signal-to-noise ratio, the lowest average sensitivity, and the shortest chronology length (112 years). The mid-elevation sample site LG-B had the longest reliable chronology length (263 years). All chronologies satisfied the standard threshold of reliability for an expressed population signal greater than 0.85.

3.2. Decline in Tree Growth

Growth decline at the six sampling sites was determined based on tree growth decline indicators (Figure 3). An analysis of the overall regional change shows a significant growth decline event in the time series from 1878 to 1893 and a significant growth decline period from 1935 to 1943.
The periods of growth decline in P. sylvestris var. mongolica were not consistent at different elevations. Figure 3 shows growth declines for the periods 1936–1940, 1979–1988, and 1870–1892 (which had a maximum percentage of 0.630). The most pronounced growth decline event was observed at the PS-A sample site; significant growth declines at this site were observed for the periods 1935–1945, 1958–1968, and 1974–1991, and the peak proportions of declines were all greater than 0.4, with a maximum of 0.79. L. gmelinii growth declines were more consistent at different elevations, but the extent to which the declines occurred varied. L. gmelinii showed two significant growth declines in 1879–1889 and 1934–1943. After 1950, a growth decline in larch was detected in 1993–1998. Sample site LG-B exhibited the greatest decline, and the most severe growth decline event occurred from 1879 to 1892, with a peak growth decline ratio of 0.92. However, the decline in the 1934–1943 period was weaker at site LYB than at sites LG-A and LG-C.
The BFAST method was used for the separation of the NDVI time series; no seasonal breaks were detected, but four trend breaks were detected (Figure 4b). The NDVI de-seasonalized trend series exhibited one trend break each at 1991, 1997, 2003, and 2008, and the trend breaks were all characterized by an abrupt decline; the most significant decline was observed in 2003, followed by a downward trend after 2008. A plot of the KDE curves of STRI (Figure 4a) revealed a clear bimodal distribution of STRI in 2003. The slopes of the simple linear regression equations for the RWI for the period 2010–2022 is negative (Figure 5).

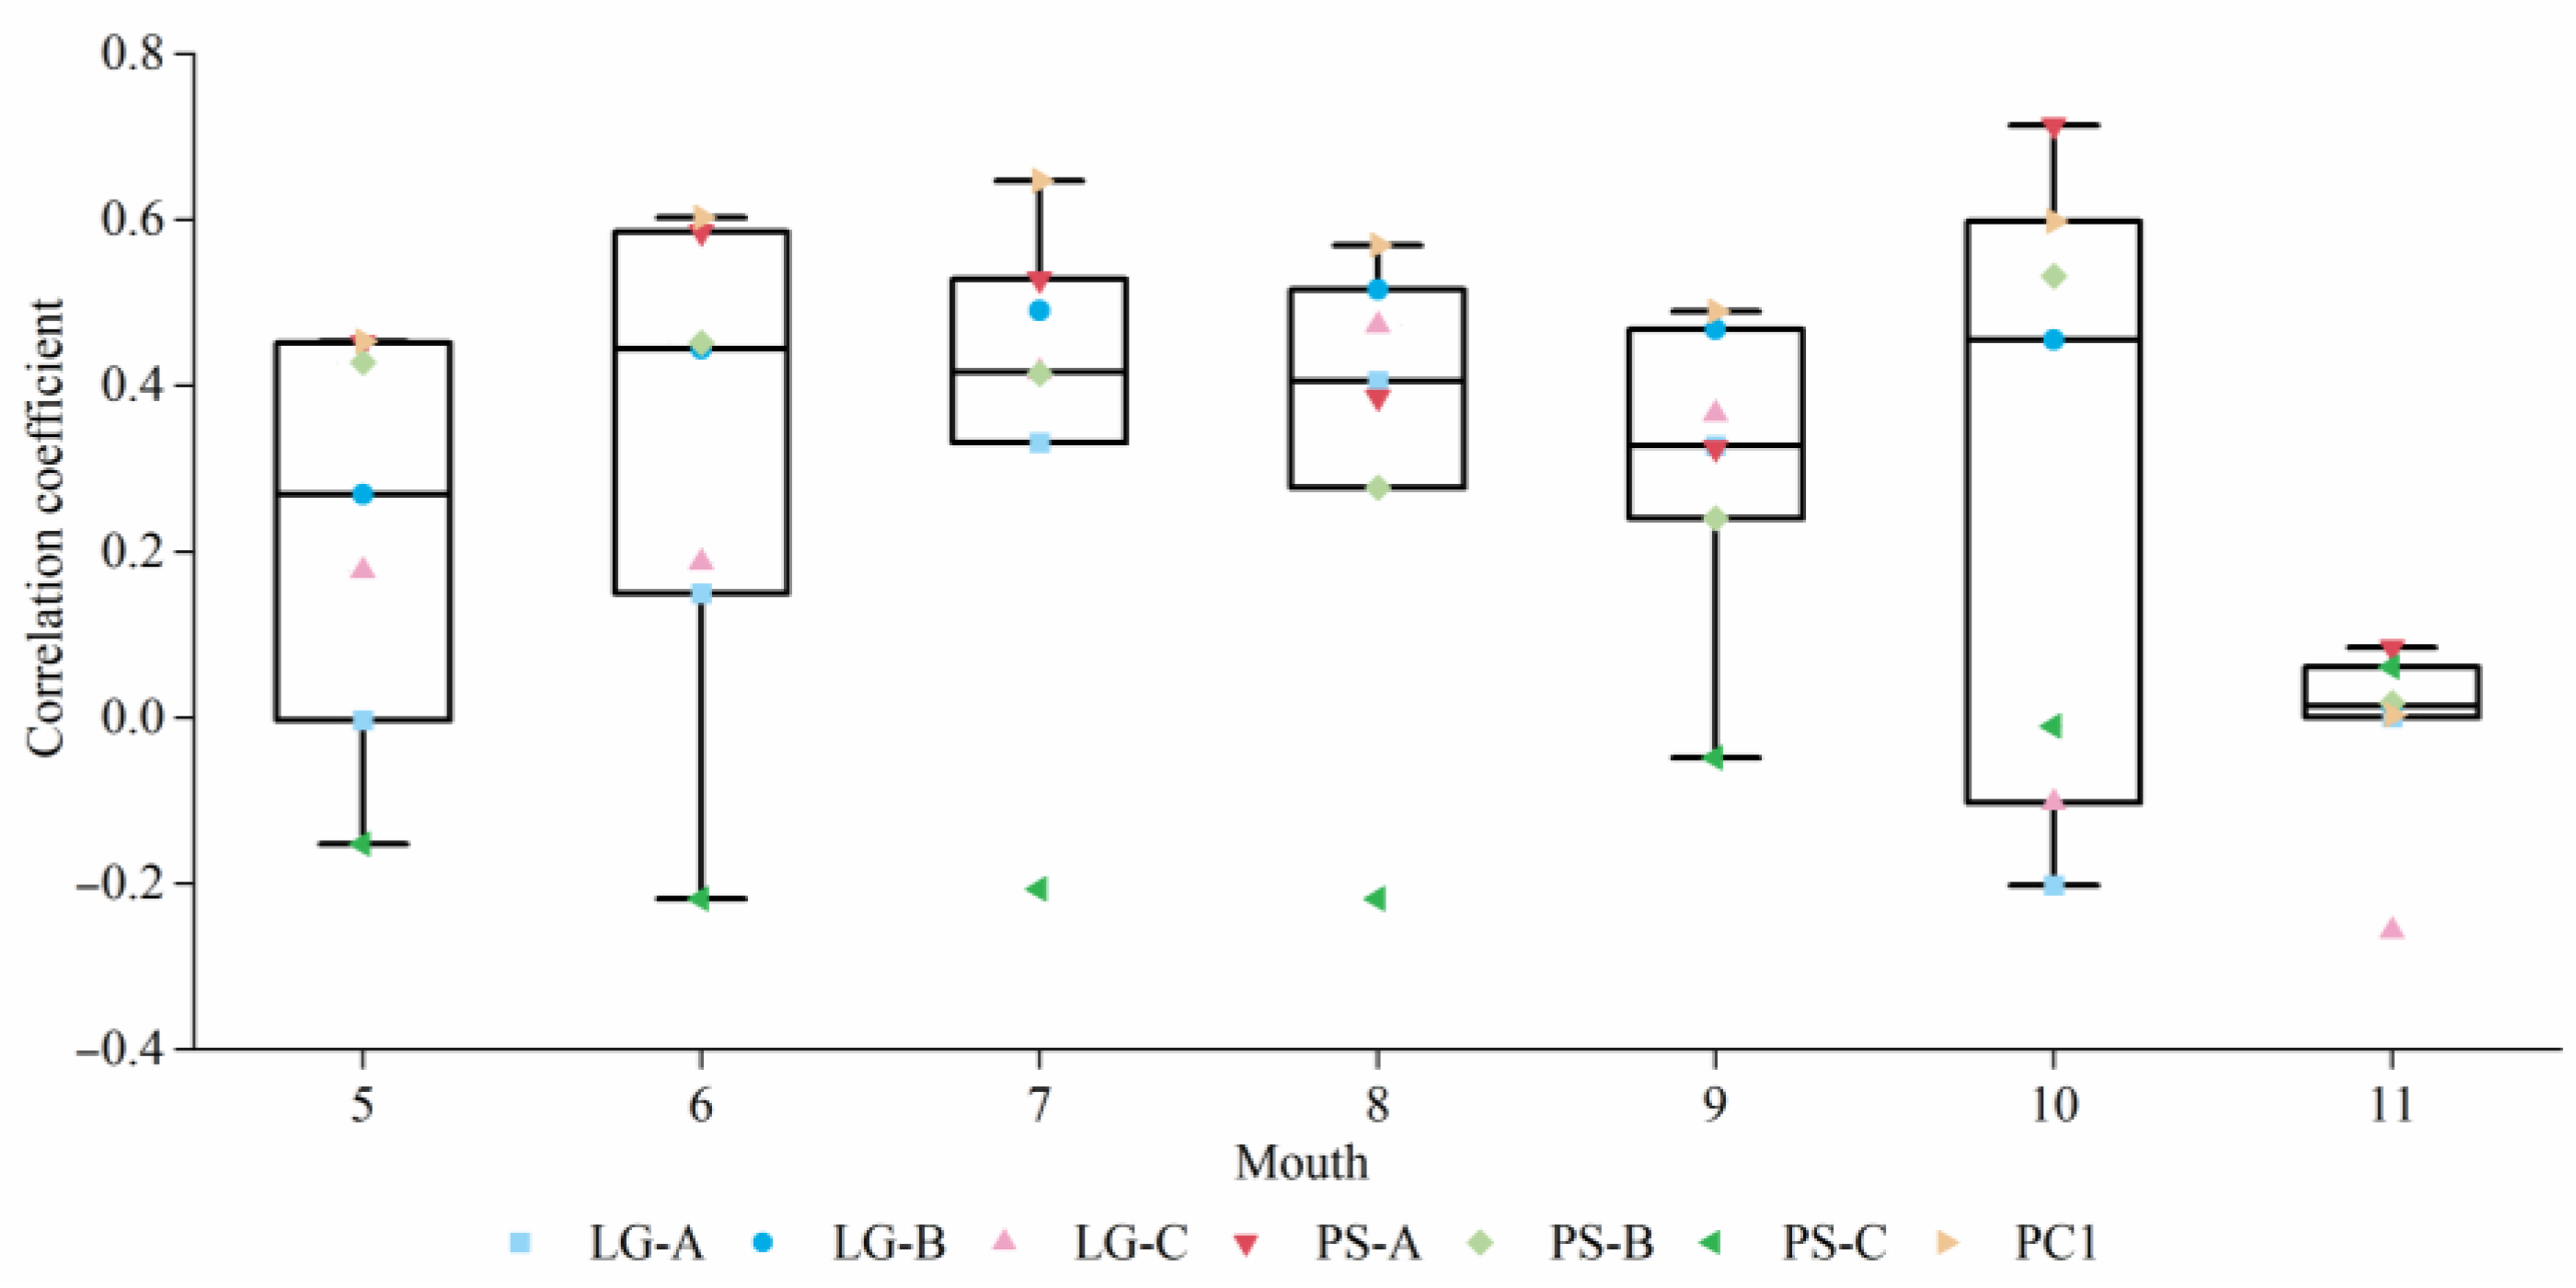
3.3. Principal Component Analysis and Correlation between NDVI and RWI

The results of the principal component analysis showed that the first principal component explained approximately 37.7% of the variance. The first three principal components explained 90% of the variance, indicating that the chronological data contained some common regional information. PC1 was highly significantly positively correlated (p < 0.01) with all sample sites between 800 and 1200 m above sea level (Table 2).
The results of the standardized chronological Pearson correlation analysis (Table 3) for the six sampling sites for the period 1982–2019 showed that the chronologies of the three sampling sites for L. gmelinii species were highly significantly positively correlated with one another (p < 0.01). In addition to this, sample point PS-A was highly significantly positively correlated with PS-B (p < 0.01) and significantly positively correlated with LG-B (p < 0.05). Correlation analysis (Figure 6) with monthly values of the NDVI series from May to November showed that PC1 was significantly and positively correlated (p < 0.05) with NDVI from May to October. PC1 was most strongly correlated with NDVI in July (p < 0.01, R = 0.647), followed by June (p < 0.01, R = 0.603). The highest correlation coefficient (p < 0.01, R = 0.714) was observed between the single sample point PS-A and October NDVI. The correlation between the PS-C sample sites and NDVI from May to November was not significant.

3.4. Growth Decline Risks

The proportion of forest land pixels in the land use types within the study area reached 97.89%, and a total of 6,334,235 pixels were extracted as forest land and categorized by the model. The resulting tree generated by the algorithm is shown in Figure 7, and the depth of the decision tree was eight. Elevation served as the first node of the classification and was the most important variable, with a relative influence of 58.41%. The relative influence of topography, slope direction, and slope gradient was 17.70%, 16.81%, and 7.08%, respectively. Estimation based on the confusion matrix resulted in an accuracy of 0.9 for the decision tree model results. The mean AUC of the three five-fold cross-validation reached 0.797. After using the cost matrix to improve the performance of the model, the accuracy of the confusion matrix-based calculations reached 0.816 (Table 4). According to the classification results, image elements with weak tree growth were mostly present in high-elevation terrain. The logical relationship comprised two main terrain patterns: higher elevation valleys and open spaces, and high ridges facing southwest.

4. Discussion

4.1. Decline in Tree Growth

The tree-ring width chronology shows that the growth decline indicator was effective for characterizing the continual decrease in the RWI. Changes in growth decline trends for both species pre-1975 and post-2003 were generally consistent, suggesting that growth suppression in L. gmelinii and P. sylvestris var. mongolica is affected by climate change in the region. The decline of L. gmelinii was generally more pronounced than the decline in P. sylvestris var. mongolica during the two periods. L. gmelinii at the same elevation is more sensitive to temperature changes than P. sylvestris var. mongolica, which tends to be more sensitive to moisture [44,45]. The available reconstructions show that this decline coincided with cold periods or cooling [44,46,47], suggesting that this phase of the growth decline was more constrained by temperature conditions. Climate change around the 1990s led to changes in the response of trees to climate in the boreal forest [48,49,50,51,52]. Prior to this time, there was a general positive correlation between radial growth and temperature for both camphor pine and larch in the Mangui region of the Daxing’an Mountains [47,53]. Lower temperatures result in later growth and slower cell division in trees, which makes them susceptible to the formation of narrow tree rings, and extreme low temperatures can inhibit growth.
The decline of the two tree species differed between 1975 and 2000. The size of the tree rings of P. sylvestris var. mongolica significantly decreased during 1975–1987. Narrower tree rings of P. sylvestris var. mongolica were observed at sample site PS-A, where the percentage of growth decline reached 79.0, and significant growth declines were not observed at the other two sample sites. This suggests that the decline in the growth at sample site PS-A during this period is attributable to local microclimatic and topographic conditions, such as elevation and slope. The growth decline in L. gmelinii occurred from 1990 to 2000 and differed from that of P. sylvestris var. mongolica, which exhibited a similar proportion of growth decline (0.33–0.26) at all three sample sites. This suggests that the decline in L. gmelinii growth during this period is attributable to the effects of climate or widespread insect infestations on a large regional scale. Meteorological data show that drought was severe from 1986 to 1987, and the drought provided suitable conditions for the subsequent spread of larch pests and diseases such as Coleophora dahurica Falkovitsh, Eurytoma laricis Yano, and Larch Seed Peak in the Daxing’an Mountains from 1996 to 2000 [54,55].
This might stem from the dehydration tolerance mechanism of trees, which produces a carbon deficit and limits the metabolism of L. gmelinii during drought years. This reduces the ability of trees to resist biological hazards, and the constant warmth promotes insect growth, which can inhibit the growth of trees [6,56]. The Hulun Buir region experienced severe insect infestations during this period [55]. The NDVI time series also indicated that there was a sudden decrease in vegetation greenness after 1991 and faster recovery compared with the tree-ring xylem. This is because when crowns, trunks, and root systems are damaged by disasters, organic matter in the plant is preferentially used to replace damaged root systems and crowns to ensure survival. This results in the faster recovery of damaged canopy foliage compared with the radial growth of trees after disasters.

4.2. Trends in Vegetation Canopy Dynamics

In this study, trees located in the interior of the forest and on the upper and lower growth lines of the stand were sampled. Therefore, these are representative samples. Remote sensing captures information on the vegetation canopy in a homogeneous and dense stand. The vegetation canopy NDVI is spatially homogeneous, and the mean NDVI ignores spatial differences caused by stand density. Thus, the NDVI time series provides a robust representation of forest growth levels. Temporal changes in NDVI were consistent with changes in the proportion of tree radial growth decline, which indicates that there is an indirect link between the trunk and canopy in tree growth and development. This is consistent with the results of Berner et al. [17], indicating that there is a loose coupling between spatially based measures of canopy greenness and xylem yield at high latitudes. Prior to 2008, NDVI slowly increased, and the warming driven by climate change extended the growth cycle of vegetation, which favored greening. All three mutation sites extracted during this period indicated a disruption in the increase, which suggests that the growth of the forest was negatively affected by climatic factors such as drought, leading to its transient degradation; the high resistance of the trees promoted the gradual recovery of the forest. The point with the largest abrupt change in the NDVI time series was observed in 2003, and this period was characterized by high temperatures and little rain (Figure 2). The distribution of RWI for this year also indicated an anomaly in stand health in 2003, and decreases in growth in the Daxing’an Mountain region have also been observed in this period in other studies [11]. Lambert et al. suggested that high temperatures had negative effects on forest stands in 2003 through remote sensing monitoring and other evidence [14,57]. An abrupt increase in the magnitude of the decrease in NDVI in 2008 was observed (Figure 4b), and this coincided with a trend of decreasing greenness of the vegetation canopy in the study area. This decreasing trend was also reflected in the RWI of the six sampling sites (Figure 5), which is not consistent with what would be expected from a warmer climate with a longer plant growth period. This suggests that the declining trend in forest growth is not a result of warming, but may be due to short-term climate extremes and human disturbances, among other things. Climate change brings not only an increase in temperature, but also more frequent extremes of cold or heat. For example, extreme precipitation indices can provide negative impacts on cold-temperate forests [58]. Furthermore, high-altitude forests are generally less resilient and may therefore find it more difficult to recover from the effects of extreme weather [59]. In addition, the study area has been affected by tourism development in the last decade or so, and human activities may be closely related to the trend of forest decline. Some studies have shown that negative impacts of human activities on vegetation are also significant in protected forests and primary forests that are less disturbed by humans [60]. Protective measures will need to be implemented in light of the risk of vegetation degradation. Several studies using tree-ring and remote sensing data have indicated that there is a potential risk of forest degradation [17,28,61]. The forests in Daxing’an Mountains are mostly composed of cold- and drought-resistant tree species, which makes the forests more resistant and resilient. Under the influence of the concept of sustainability, forestry management in the region has continued to carry out scientific and artificial restoration of degraded forests. Therefore, despite the downward trend in forest growth, this threat may not lead to changes in vegetation types.

4.3. Relationship between NDVI and RWI

The Daxing’an Mountains region experiences a cold-temperate continental monsoon climate, and the surface is covered by snow in winter. This resulted in a high number of invalid NDVI values in the winter remote sensing data; thus, the May–November NDVI data were extracted and used for analysis. The increase in tree-ring width tends to reflect the accumulation of forest biomass, and NDVI is related to leaf photosynthesis; the effects of these two variables on tree growth differ. NDVI reflects the state of plant growth and the spatial distribution of plant leaves from a macroscopic perspective [62,63]; it is an important indicator for analyzing the plant growth process. Analysis of seasonal variation in NDVI can provide insights into the effects of NDVI on tree growth [15]. Higher summer temperatures lead to denser foliage growth, which results in the increased absorption of light by plants at a microtopographical scale. This makes the effect of NDVI on tree growth more spatially consistent [62]. NDVI during the growing season reflects the light received by plants and their growth capacity, and the organic matter accumulated by photosynthesis provides the material basis for plant respiration and cell growth. Thus, growing-season NDVI can be used to estimate interannual variability in tree-ring growth in boreal forest communities [14,20,64,65,66]. Because the sampling sites were in mixed forest, we conducted a principal component analysis of tree-ring width chronologies, which provided a regional measure of tree growth. We observed a strong correlation between the principal components of the tree-ring width chronologies and NDVI compared with a single chronology. This suggests that NDVI responds to overall forest growth trends [14]. The results of the principal component analysis indicate that linkages can be feasibly established among the existing tree-ring width chronologies in various regions, and this will aid future studies employing tree-ring width information at different spatial scales.

4.4. Effects of Topographic Factors on Tree Growth

The results of spatial analyses indicate that in addition to the effect of large-scale climate change on tree growth, microclimatic differences at microtopographical scales can affect spatial variation in tree growth [24,28,29]. The results of this study revealed differences in the growth decline of both P. sylvestris var. mongolica and L. gmelinii at different elevations. The results of the spatial analysis showed that elevation had the greatest relative effect on forest degradation. The intensity of the decline in both species increased with elevation within the same periods. This might stem from the fact that temperature plays a major role in affecting the total growth rate early and late in the growing season [67]. As the temperature decreases with altitude, the growth period of trees starts later, and the growth rate decreases when the growing season is shorter [27]. That is, global warming has not altered changes in P. sylvestris var. mongolica growth with elevation. Although cold temperature limitations at higher elevations may have been mitigated, poorer soil nutrient and moisture conditions will still limit tree growth. The radial growth of P. sylvestris var. mongolica became more strongly correlated with the vegetation index as elevation increased. Therefore, spatial analyses can be conducted on the radial growth of P. sylvestris var. mongolica at high altitudes. Patterns in the radial growth in L. gmelinii at different elevations were consistent with those of P. sylvestris var. mongolica. However, this trend was not observed in the performance of the mid-elevation L. gmelinii sample site (LG-B), which was less correlated with the vegetation index. This stems from the fact that the trees in the LG-B sample site are much older, especially at high altitude; these trees are thus more susceptible to environmental stresses and have lower cambium activity compared with younger trees, which are prone to having narrow or missing tree rings [34]. Topography and slope orientation affect the distribution of water, nutrients, and heat in the region. Southward-facing sunny slopes experience higher intensities of solar radiation and more sunshine hours. This leads to high evapotranspiration and greater soil weathering, which leaves the soil devoid of organic matter and susceptible to moisture limitation [29]. P. sylvestris var. mongolica and L. gmelinii are shade-tolerant and moisture-loving species [68], and south-facing slopes are likely to exacerbate the adverse effects of drought. The relative effect of slope is 7.08%. Soils on steep slopes are more susceptible to erosion and water loss, and this results in a low nutrient content and water deficits [29]. This is similar to the effects of elevation and slope orientation on growth observed in other studies of tree rings. For example, Kermavnar et al. [25] conducted isotopic studies of Fagus sylvatica and found that trees growing on southwestern slopes experienced greater environmental stress compared with trees on slopes with different orientations, and this was attributed to differences in the strength of water evapotranspiration on slopes of different orientations. Kooch et al. [69] explored the effects of soil conditions and altitude on silvicultural systems, and high altitude had an adverse effect on soil function and fertility. Overall, topography affects the distribution of environmental factors, and the responses of trees to environmental factors vary among regions. Thus, the climatic environment of the region has a strong effect on the topographic patterns of recession. Climatic and environmental factors require consideration when analyzing the effects of topographic factors on tree growth.

5. Conclusions

In this study, tree-ring data and remote sensing information were used to analyze the decline of forests in the Mangui region of the western Daxing’an Mountains. The results suggest that forests in the northern Daxing’an Mountains are more resistant to climatic extremes, but at the cost of longer periods of low-value growth. However, forest growth decreased after 2010 due to the effects of climate warming, and the risk of decline was greater at higher elevations; given that climate extremes are expected to become more frequent, future forests are likely to face increased risks.
The consistency of tree-ring information with NDVI indicates that it can be used to characterize the physiological performance of dominant trees with satellite-acquired stand productivity information, which aids the use of tree-ring information for spatial analysis. The link between NDVI and radial growth is closely related to carbon sinks; thus, cumulative growing-season NDVI values might be more strongly correlated with tree-ring information and thus provide a more robust indicator of forest growth. The decision tree classification method used in the spatial analysis can provide explanations for the significant forest decline. These results provide useful information for evaluating future forest growth trends. The research in this paper utilized tree-ring data to conduct the study, and in the future it is pending for scholars to conduct more extensive research using other tree species. The selected terrain model is unfolded at the microtopographic scale. To better clarify the importance of topographic changes on tree growth, tree-ring data from the east and west slopes of Daxing’an Mountains could be analyzed in the future in a fine-grained comparative manner. Our results help determine the optimal scale for spatial and temporal analysis of tree-ring data with NDVI.

Author Contributions

Conceptualization, B.W. and Z.W.; methodology, B.W.; software, L.L.; validation, B.W. and Y.Z.; formal analysis, X.W.; investigation, T.L.; resources, Y.Z.; data curation, Y.Z.; writing—original draft preparation, B.W.; writing—review and editing, Z.W. and D.Z.; visualization, B.W.; supervision, Z.W.; project administration, Z.W.; funding acquisition, D.Z. All authors have read and agreed to the published version of the manuscript.

Funding

This research was funded by the National Natural Science Foundation of China (41671064), and the Natural Science Foundation of Heilongjiang Province of China (LH2021D012).

Data Availability Statement

All data relevant to the study are included in the article.

Acknowledgments

We are grateful to the Mangui Forestry Bureau of Daxing’an Mountains for its support in the collection of the tree-ring samples. We sincerely thank Rui Sun, Jingwen Huang, Xiangyou Li, Shubing Zhong, Xi Zhang, Xuan Liu, and Xiaohan Zhang of the Faculty of Geographic Sciences, Harbin Normal University, for their contributions to the processing and measurement of the tree rings. We want to thank the anonymous reviewers for their thoughtful comments and efforts towards improving the manuscript.

Conflicts of Interest

The authors declare no conflict of interest.

References

  1. Yang, Y.H.; Shi, Y.; Sun, W.J.; Chang, J.F. Terrestrial carbon sinks in China and around the world and their contribution to carbon neutrality. Sci. Sin. 2022, 52, 534–574. [Google Scholar]
  2. Speizer, S.; Raymond, C.; Ivanovich, C.C.; Horton, R.M. Concentrated and Intensifying Humid Heat Extremes in the IPCC AR6 Regions. Geophys. Res. Lett. 2022, 49, e2021GL097261. [Google Scholar] [CrossRef]
  3. Orgogozo, L.; Prokushkin, A.; Pokrovsky, O.; Grenier, C.; Quintard, M.; Viers, J.; Audry, S. Water and energy transfer modeling in a permafrost-dominated, forested catchment of Central Siberia: The key role of rooting depth. Permafr. Periglac. Process. 2019, 30, 75–89. [Google Scholar] [CrossRef]
  4. Liu, H.B.; Mu, M.; Mu, C.C.; Wu, X.D. Interpretation of IPCC Sixth Assessment Report: Observations and Predictions of Permafrost Carbon in the Northern Hemisphere. J. Glaciol. Geocryol. 2023, 45, 318–326. [Google Scholar]
  5. Prăvălie, R. Major perturbations in the Earth’s forest ecosystems. Possible implications for global warming. Earth Sci. Rev. 2018, 185, 544–571. [Google Scholar] [CrossRef]
  6. Allen, C.D.; Macalady, A.K.; Chenchouni, H.; Bachelet, D.; McDowell, N.; Vennetier, M.; Kitzberger, T.; Rigling, A.; Breshears, D.D.; Hogg, E.H.; et al. A global overview of drought and heat-induced tree mortality reveals emerging climate change risks for forests. For. Ecol. Manag. 2010, 259, 660–684. [Google Scholar] [CrossRef]
  7. Rafał, P. Variability in radial increment can predict an abrupt decrease in tree growth during forest decline: Tree-ring patterns of Abies alba Mill. in near-natural forests. For. Ecol. Manag. 2021, 479, 118579. [Google Scholar] [CrossRef]
  8. Li, Y.; Zhang, Q.B. History of Tree Growth Declines Recorded in Old Trees at Two Sacred Sites in Northern China. Front. Plant Sci. 2017, 8, 1779. [Google Scholar] [CrossRef]
  9. Liu, H.Y.; Park Williams, A.; Allen, C.D.; Guo, D.L.; Wu, X.C.; Anenkhonov, O.A.; Liang, E.; Sandanov, D.V.; Yin, Y.; Qi, Z.H.; et al. Rapid warming accelerates tree growth decline in semi-arid forests of Inner Asia. Glob. Chang. Biol. 2013, 19, 2500–2510. [Google Scholar] [CrossRef]
  10. Takahashi, M.; Feng, Z.Z.; Mikhailova, T.A.; Kalugina, O.V.; Shergina, O.V.; Afanasieva, L.V.; Heng, R.K.J.; Majid, N.M.A.; Sase, H. Air pollution monitoring and tree and forest decline in East Asia: A review. Sci. Total Environ. 2020, 742, 140288. [Google Scholar] [CrossRef]
  11. Tian, Y.H.; Liu, Y.Q.; Wu, X.C.; Yan, M.X.; Liu, F.H.; Luan, J.Y. The Status Quo of Forest Decline and The Impact of Population Competition on Its Growth in The Northeast of The Inner Mongolia. Acta Ecol. Sin. 2022, 42, 7222–7233. [Google Scholar]
  12. Wu, X.D.; Shao, X.M. Status of dendroclimatological study and its prospects in China. Adv. Earth Sci. 1993, 8, 31–35. [Google Scholar]
  13. Wang, T.; Bao, A.M.; Xu, W.Q.; Zheng, G.X.; Nzabarinda, V.; Yu, T.; Huang, X.R.; Long, G.; Naibi, S. Dynamics of forest net primary productivity based on tree ring reconstruction in the Tianshan Mountains. Ecol. Indic. 2023, 146, 109713. [Google Scholar] [CrossRef]
  14. Lambert, J.; Drenou, C.; Denux, J.-P.; Balent, G.; Cheret, V. Monitoring forest decline through remote sensing time series analysis. GIScience Remote Sens. 2013, 50, 437–457. [Google Scholar] [CrossRef]
  15. Wei, Y.Y.; Sun, S.G.; Liang, D.; Jia, Z.H. Spatial–temporal variations of NDVI and its response to climate in China from 2001 to 2020. Int. J. Digit. Earth 2022, 15, 1463–1484. [Google Scholar] [CrossRef]
  16. Carnicer, J.; Coll, M.; Ninyerola, M.; Pons, X.; Sanchez, G.; Penuelas, J. Widespread crown condition decline, food web disruption, and amplified tree mortality with increased climate change-type drought. Proc. Natl. Acad. Sci. USA 2011, 108, 1474–1478. [Google Scholar] [CrossRef]
  17. Berner, L.T.; Beck, P.S.A.; Bunn, A.G.; Lloyd, A.H.; Goetz, S.J. High-latitude tree growth and satellite vegetation indices: Correlations and trends in Russia and Canada (1982–2008). J. Geophys. Res. Biogeosci. 2011, 116. [Google Scholar] [CrossRef]
  18. Vicente-Serrano, S.M.; Camarero, J.J.; Olano, J.M.; Martín-Hernández, N.; Peña-Gallardo, M.; Tomás-Burguera, M.; Gazol, A.; Azorin-Molina, C.; Bhuyan, U.; El Kenawy, A. Diverse relationships between forest growth and the Normalized Difference Vegetation Index at a global scale. Remote Sens. Environ. 2016, 187, 14–29. [Google Scholar] [CrossRef]
  19. D’Andrea, G.; Šimůnek, V.; Castellaneta, M.; Vacek, Z.; Vacek, S.; Pericolo, O.; Zito, R.G.; Ripullone, F. Mismatch between Annual Tree-Ring Width Growth and NDVI Index in Norway Spruce Stands of Central Europe. Forests 2022, 13, 1417. [Google Scholar] [CrossRef]
  20. Bunn, A.; Hughes, M.; Kirdyanov, A.V.; Losleben, M.; Shishov, V.; Berner, L.; Olchev, A.; Vaganov, E.A. Comparing forest measurements from tree rings and a space-based index of vegetation activity in Siberia. Environ. Res. Lett. 2013, 8, 035034. [Google Scholar] [CrossRef]
  21. Coulthard, B.L.; Touchan, R.; Anchukaitis, K.J.; Meko, D.M.; Sivrikaya, F. Tree growth and vegetation activity at the ecosystem-scale in the eastern Mediterranean. Environ. Res. Lett. 2017, 12, 084008. [Google Scholar] [CrossRef]
  22. Zhang, T.W.; Zhang, R.B.; Lu, B.; Mambetov, B.; Kelgenbayev, N.; Dosmanbetov, D.; Maisupova, B.; Chen, F.; Yu, S.L.; Shang, H.M.; et al. Picea schrenkiana tree-ring chronologies development and vegetation index reconstruction for the Alatau Mountains, Central Asia. Geochronometria 2018, 45, 107–118. [Google Scholar] [CrossRef]
  23. Zhirnova, D.; Belokopytova, L.; Barabantsova, A.; Babushkina, E.; Vaganov, E. What prevails in climatic response of Pinus sylvestris in-between its range limits in mountains: Slope aspect or elevation? Int. J. Biometeorol. 2019, 6, 333–344. [Google Scholar] [CrossRef]
  24. Correa-Díaz, A.; Silva, L.; Horwath, W.R.; Gomez-Guerrero, A.; Vargas-Hernández, J.; Villanueva-Díaz, J.; Suárez-Espinoza, J.; Velázquez-Martínez, A. From Trees to Ecosystems: Spatiotemporal Scaling of Climatic Impacts on Montane Landscapes Using Dendrochronological, Isotopic, and Remotely Sensed Data. Glob. Biogeochem. Cycles 2020, 34, e2019GB006325. [Google Scholar] [CrossRef]
  25. Kermavnar, J.; Levanič, T.; Kutnar, L. Stable isotope composition in tree rings of Fagus sylvatica L. saplings reflects environmental variation induced by silviculture and microsite factors. For. Ecol. Manag. 2023, 537, 120949. [Google Scholar] [CrossRef]
  26. Chen, S.S.; Ma, M.H.; Wu, S.J.; Tang, Q.Q.; Wen, Z.F. Topography intensifies variations in the effect of human activities on forest NPP across altitude and slope gradients. Environ. Dev. 2023, 45, 100826. [Google Scholar] [CrossRef]
  27. Deng, C.H.; Bai, H.Y.; Gao, S.; Zhao, T.; Ma, X.P. Differences and variations in the elevation-dependent climatic growing season of the northern and southern slopes of the Qinling Mountains of China from 1985 to 2015. Theor. Appl. Climatol. 2019, 137, 1159–1169. [Google Scholar] [CrossRef]
  28. Wang, Z.; Lyu, L.; Liu, W.; Liang, H.; Huang, J.; Zhang, Q.-B. Topographic patterns of forest decline as detected from tree rings and NDVI. Catena 2021, 198, 105011. [Google Scholar] [CrossRef]
  29. Wu, X.D. Tree Rings and Climate Change; Meteorological Press: Beijing, China, 1990. [Google Scholar]
  30. Stokes, M.A.; Smiley, T.L. An Introduction to Tree-Ring Dating; University of Arizona Press: Tucson, AZ, USA, 1996. [Google Scholar]
  31. Schweingruber, F.H. Morphological, Anatomical, and Tree-Ring Analytical Characteristics of Trees Frequently Used in Dendrochronology. In Trees and Wood in Dendrochronology; Springer: Berlin/Heidelberg, Germany, 1993. [Google Scholar]
  32. Cook, E.R. A Time Series Analysis Approach to Tree-Ring Standardization; University of Arizona: Tucson, AZ, USA, 1985. [Google Scholar]
  33. Vermote, E.; NOAA CDR Program. NOAA Climate Data Record (CDR) of AVHRR Normalized Difference Vegetation Index (NDVI), Version 5; NOAA National Centers for Environmental Information: Boulder, CO, USA, 2019. [Google Scholar] [CrossRef]
  34. Correa-Díaz, A.; Silva, L.; Horwath, W.; Gomez-Guerrero, A.; Vargas-Hernández, J.; Villanueva-Díaz, J.; Velázquez-Martínez, A.; Suárez-Espinoza, J. Linking Remote Sensing and Dendrochronology to Quantify Climate-Induced Shifts in High-Elevation Forests Over Space and Time. J. Geophys. Res. Biogeosci. 2019, 124, 166–183. [Google Scholar] [CrossRef]
  35. Karra, K.; Kontgis, C.; Statman-Weil, Z.; Mazzariello, J.C.; Mathis, M.; Brumby, S.P. Global land use/land cover with Sentinel 2 and deep learning. In Proceedings of the 2021 IEEE International Geoscience and Remote Sensing Symposium IGARSS, Brussels, Belgium, 11–16 July 2021; pp. 4704–4707. [Google Scholar]
  36. Singh, R.; Kumar, P.; Pandey, R.; Bala, N. Forest disturbance detection in Garhwal Himalayas using MODIS NDVI time-series and BFAST model. Geocarto Int. 2022, 37, 12689–12708. [Google Scholar] [CrossRef]
  37. Li, M.Q.; Im, J.H.; Beier, C.L. Machine learning approaches for forest classification and change analysis using multi-temporal Landsat TM images over Huntington Wildlife Forest. GIScience Remote Sens. 2013, 50, 361–384. [Google Scholar] [CrossRef]
  38. Saito, H.; Nakayama, D.; Matsuyama, H. Comparison of landslide susceptibility based on a decision-tree model and actual landslide occurrence: The Akaishi Mountains, Japan. Geomorphology 2009, 109, 108–121. [Google Scholar] [CrossRef]
  39. Febriantono, M.; Hadi Pramono, S.; Rahmadwati, R.; Naghdy, G. Classification of multiclass imbalanced data using cost-sensitive decision tree C5.0. IAES Int. J. Artif. Intell. 2020, 9, 65. [Google Scholar] [CrossRef]
  40. Tanyu, B.F.; Abbaspour, A.; Alimohammadlou, Y.; Tecuci, G. Landslide susceptibility analyses using Random Forest, C4.5, and C5.0 with balanced and unbalanced datasets. Catena 2021, 203, 105355. [Google Scholar] [CrossRef]
  41. Salzberg, S.L. C4.5: Programs for Machine Learning by J. Ross Quinlan. Morgan Kaufmann Publishers, Inc., 1993. Mach. Learn. 1994, 16, 235–240. [Google Scholar] [CrossRef]
  42. Yu, L.; Wu, T.J. Assemble learning: A survey of boosting algorithms. Pattern Recognit. Artif. Intell. 2004, 17, 52–59. [Google Scholar]
  43. Lantz, B. Machine Learning with R; Packt Pub Ltd.: Birmingham, UK, 2013. [Google Scholar]
  44. Sun, Y.; Wang, L.L.; Chen, J.; Duan, J.P. Reconstructing mean maximum temperatures of May–August from tree-ring maximum density in North DaXing’an Mountains, China. Chin. Sci. Bull. 2012, 57, 1791–1799. [Google Scholar] [CrossRef]
  45. Farooq, T.; Yasmeen, S.; Shakoor, A.; Nawaz, M.; Rashid, M.; Ahmad, S.; Rasheed, M.; Li, H.; Li, Q. Xylem anatomical responses of Larix Gmelinii and Pinus Sylvestris influenced by the climate of Daxing’an mountains in Northeastern China. Front. Plant Sci. 2023, 14, 1095888. [Google Scholar] [CrossRef]
  46. Wang, S.W.; Ye, J.L.; Gong, D.Y.; Zhu, J.H.; Yao, T.D.; Zhu, J.H.; Yao, T.D. Establishment of annual temperature series in China in the last 100 years. Q. J. Appl. Meteorol. 1998, 9, 392–401. [Google Scholar]
  47. Jiang, Y.; Liu, C.; Zhang, J.; Han, S.; Coombs, C.; Wang, X.; Wang, J.; Hao, L.; Dong, S. Tree ring width-based January–March mean minimum temperature reconstruction from Larix gmelinii in the Greater Khingan Mountains, China since A.D. 1765. Int. J. Climatol. 2020, 41, E842–E854. [Google Scholar] [CrossRef]
  48. Gai, X.R.; Yu, D.P.; Wang, S.L.; Jia, X.; Wu, J.; Zhou, W.M.; Zhou, L.; Dai, L.M. A review of formation mechanism on the ‘divergence problem’ of tree growth-climate relationship. Chin. J. Ecol. 2017, 36, 3273–3280. [Google Scholar] [CrossRef]
  49. Yasmeen, S.; Wang, X.; Zhao, H.; Zhu, L.; Yuan, D.; Li, Z.; Zhang, Y.; Ahmad, S.; Han, S. Contrasting climate-growth relationship between Larix gmelinii and Pinus sylvestris var. mongolica along a latitudinal gradient in Daxing’an Mountains, China. Dendrochronologia 2019, 58, 125645. [Google Scholar] [CrossRef]
  50. Li, Y.; Liu, H.; Zhu, X.; Yue, Y.; Xue, J.; Shi, L. How permafrost degradation threatens boreal forest growth on its southern margin? Sci. Total Environ. 2021, 762, 143154. [Google Scholar] [CrossRef]
  51. Jing, M.; Zhu, L.; Cherubini, P.; Yuan, D.; Li, Z.; Wang, X.; Liu, S. Responses of radial growth of Pinus massoniana and Castanopsis eyrei to climate change at different elevations in south China. Ecol. Indic. 2022, 145, 109602. [Google Scholar] [CrossRef]
  52. Zheng, P.F.; Wang, D.D.; Jia, G.D.; Yu, X.X.; Liu, Z.Q.; Wang, Y.S.; Zhang, Y. Variation in water supply leads to different responses of tree growth to warming. For. Ecosyst. 2022, 9, 100003. [Google Scholar] [CrossRef]
  53. Guo, X.M.; Wang, Z.P.; Zhang, N.; Zhang, D.Y. Responses of radial growth of Pinus sylvestris var. mongolica and Larix gmelinii to climate change. Chin. J. Appl. Ecol. 2021, 32, 3405–3414. [Google Scholar] [CrossRef]
  54. Zhang, J.S.; Lun, B.P.; Shen, J.; Cao, Y. The characteristics of forest diseases, insects and rodents in forest areas and their mitigation countermeasures were analyzed. Inn. Mong. For. Sci. Technol. 2001, 46–48+50. [Google Scholar]
  55. Sun, Y.F.; Piao, Z.H.; Zhang, Y.W.; Ha, S.B.G. Hazards of Forest Pests and Diseases in Hulunbuir City and Countermeasures for Prevention and Control. Inn. Mong. For. 2003, 33–34. [Google Scholar]
  56. Koprowski, M.; Duncker, P. Tree ring width and wood density as the indicators of climatic factors and insect outbreaks affecting spruce growth. Ecol. Indic. 2012, 23, 332–337. [Google Scholar] [CrossRef]
  57. Rennenberg, H.; Loreto, F.; Polle, A.; Brilli, F.; Fares, S.; Beniwal, R.; Gessler, A. Physiological Responses of Forest Trees to Heat and Drought. Plant Biol. 2006, 8, 556–571. [Google Scholar] [CrossRef] [PubMed]
  58. Wu, X.Y.; Zhu, X.F. Differential analysis of vegetation response to extreme climate in different vegetation regions of China. Acta Ecol. Sin. 2023, 43, 10202–10215. [Google Scholar] [CrossRef]
  59. Davis, T.S.; Meddens, A.J.H.; Stevens-Rumann, C.S.; Jansen, V.S.; Sibold, J.S.; Battaglia, M.A. Monitoring resistance and resilience using carbon trajectories: Analysis of forest management-disturbance interactions. Ecol. Appl. A Publ. Ecol. Soc. Am. 2022, 32, e2704. [Google Scholar] [CrossRef] [PubMed]
  60. Wang, L.; Yong, G.W.; Maya, P.; Zheng, N.; Li, W.; Fang, C.; Chu, Q.Y.; Christian, S.J. Human fingerprint on structural density of forests globally. Nat. Sustain. 2023, 6, 368–379. [Google Scholar] [CrossRef]
  61. Matskovsky, V.; Venegas-González, A.; Garreaud, R.; Roig, F.A.; Gutiérrez, A.G.; Muñoz, A.A.; Le Quesne, C.; Klock, K.; Canales, C. Tree growth decline as a response to projected climate change in the 21st century in Mediterranean mountain forests of Chile. Glob. Planet. Chang. 2021, 198, 103406. [Google Scholar] [CrossRef]
  62. Wang, H.; Muller, J.D.; Tatarinov, F.; Yakir, D.; Rotenberg, E. Disentangling Soil, Shade, and Tree Canopy Contributions to Mixed Satellite Vegetation Indices in a Sparse Dry Forest. Remote Sens. 2022, 14, 681. [Google Scholar] [CrossRef]
  63. Wang, Y.K.; Song, J. Field-Measured Hydraulic Traits and Remotely Sensed NDVI of Four Subtropical Tree Species Showed Transient Declines during the Drought–Heatwave Event. Forests 2023, 14, 1420. [Google Scholar] [CrossRef]
  64. Qi, Y. The effect of climate change on vegetation at high latitudes of the northern Hemisphere: Afunctional analysis. Acta Ecol. Sin. 1999, 151, 474–477. [Google Scholar]
  65. Ma, J.N.; Zhang, C.; Hao, G.; Chen, W.L.; Yun, W.J.; Gao, L.L.; Wang, H. Analyzing Ecological Vulnerability and Vegetation Phenology Response Using NDVI Time Series Data and the BFAST Algorithm. Remote Sens. 2020, 12, 3371. [Google Scholar] [CrossRef]
  66. Vicente-Serrano, S.M.; Martín-Hernández, N.; Camarero, J.J.; Gazol, A.; Sánchez-Salguero, R.; Peña-Gallardo, M.; El Kenawy, A.; Domínguez-Castro, F.; Tomas-Burguera, M.; Gutiérrez, E.; et al. Linking tree-ring growth and satellite-derived gross primary growth in multiple forest biomes. Temporal-scale matters. Ecol. Indic. 2020, 108, 105753. [Google Scholar] [CrossRef]
  67. Bao, G.; Liu, Z.Y.; Liu, N.; Wu, M.L. Simulation analysis of the radial growth characteristics of Pinus sylvestris var. mongolica inHulunbuir Sandy Land by Vaganov-Shashkin Model. Chin. J. Appl. Ecol. 2021, 32, 3448–3458. [Google Scholar] [CrossRef]
  68. Feng, Y.L.; Wang, W.Z.; Ao, H. Drought Resistance of Larix olgensis Henry and Pinus sylvestris var. mongolica etc. J. Northeast. For. Univ. 1998, 26, 16–20. [Google Scholar]
  69. Kooch, Y.; Parsapour, M.K.; Nouraei, A.; Kartalaei, Z.M.; Wu, D.; Gómez-Brandón, M.; Lucas-Borja, M.E. The effect of silvicultural systems on soil function depends on bedrock geology and altitude. J. Environ. Manag. 2023, 345, 118657. [Google Scholar] [CrossRef] [PubMed]
Figure 1. Location of the research area and sampling sites. (a) Location of the study area in the Daxing’an Mountains. (b) Overview of the study area and location of tree-ring data and NDVI. (c) Distribution of sampling points for tree-ring data.
Forests 15 00317 g001
Figure 2. Climatic characteristics of the northern Daxing’an Mountain region from 1901 to 2021. The left panel (a) shows average monthly temperature and average monthly precipitation; the right panel (b) shows average annual temperature and total annual precipitation.
Forests 15 00317 g002
Figure 3. Number of samples (right axis) and proportion of declined trees (left axis) in Pinus sylvestris var. mongolica (PS-A, PS-B, and PS-C) and Larix gmelinii (LG-A, LG-B, and LG-C) sample sites.
Forests 15 00317 g003
Figure 4. (a) STRI kernel density estimation curves for 2003 and 2009, with 2003 representing a mutation year and 2009 a normal year. (b) NDVI breakpoint plots from 1982 to 2019; 2003 serves as the year with the largest drop in mutation.
Forests 15 00317 g004
Figure 5. Simple linear regression of tree-ring width index (RWI) for standardized chronologies of Larix gmelinii (LG) and Pinus sylvestris var. mongolica (PS), 2010–2021.
Forests 15 00317 g005
Figure 6. Tree-ring chronology and correlation coefficient of PC1 with monthly NDVI.
Forests 15 00317 g006
Figure 7. Based on the decision tree classification algorithm of C5.0, the four terrain factors are altitude, slope, aspect, and terrain index. The slope is divided into three levels from small to large, followed by flat slope, gentle slope, and steep slope. The slope direction is divided into nine levels: plane, north (N), northeast (NE), east (E), southeast (SE), south (S), southwest (SW), west (W), and northwest (NW). The topographic index is divided into three levels: trough, open land, and ridge.
Forests 15 00317 g007
Table 1. The main characteristic parameters of the tree-ring width standardized chronology for Pinus sylvestris var. mongolica (PS) and Larix gmelinii (LG) sampling sites.
LocationAltitude/mConfidence YearMean SensitivityStandard DeviationWithin-Trees RbarFirst-Order AutocorrelationSignal-to-Noise Ratio
PS-A1100–12001910–20210.1150.2140.8440.957101.910
PS-B800–9001814–20210.1230.2790.6700.80225.359
PS-C700–8001809–20210.2320.1690.6590.50232.300
LG-A1200–13001905–20210.1970.1720.6630.60431.225
LG-B1100–12001759–20210.1550.2110.6260.77026.870
LG-C800–9001904–20210.1910.2110.6490.37922.950
Table 2. Principal component analysis of the standardized chronology for each sampling point.
Principal
Component
Initial Eigenvalue Variance (%)Cumulative (%)LG-ALG-BLG-CPS-APS-BPS-C
PC137.70637.7060.3200.8390.5480.6850.8230.100
PC233.56671.2720.8870.2380.6950.6260.5050.202
PC318.75190.0230.0550.1720.2580.2580.1460.961
Table 3. Pearson correlation analysis between 1982 and 2019 chronologies.
LocationLG-ALG-BLG-CPS-APS-BPS-C
LG-A10.438 **0.710 **−0.29−0.165−0.18
LG-B 10.472 **0.393 *0.485 **−0.081
LG-C 1−0.0950.1490.108
PS-A 10.836 **−0.084
PS-B 10.305
PS-C 1
Significance levels are indicated as follows: (*, p < 0.05; **, p < 0.01).
Table 4. Confusion matrix for evaluating the decision model.
PredictError
Decline RiskNon-Decline Risk
ActualDecline risk75,77642,8480.36
Non-Decline risk189,894958,3290.13
Error0.710.040.16
Disclaimer/Publisher’s Note: The statements, opinions and data contained in all publications are solely those of the individual author(s) and contributor(s) and not of MDPI and/or the editor(s). MDPI and/or the editor(s) disclaim responsibility for any injury to people or property resulting from any ideas, methods, instructions or products referred to in the content.

