Article

Insights into the Root Sprouts of Toona fargesii in a Natural Forest: From the Morphology, Physiology, and Transcriptome Levels

1
Jiangxi Provincial Key Laboratory of Silviculture, 2011 Collaboration Innovation Center of Jiangxi Typical Trees Cultivation and Utilization, Jiangxi Agricultural University, Nanchang 330045, China
2
Modern Center of Plant Tissue Culture and Breeding, Jiangxi Academy of Forestry, Nanchang 330032, China
3
Co-Innovation Center for Sustainable Forestry in Southern China, Nanjing Forestry University, Nanjing 210037, China
*
Author to whom correspondence should be addressed.
These authors contributed equally to this work.
Forests 2024, 15(2), 335; https://doi.org/10.3390/f15020335
Submission received: 29 December 2023 / Revised: 23 January 2024 / Accepted: 26 January 2024 / Published: 8 February 2024

Abstract

:
Toona fargesii (T. fargesii) is a deciduous tree of the Meliaceae family which is utilized for high-value timber. Interestingly, root sprouting is a typical reproductive pattern in T. fargesii. Nevertheless, the genetics underlying this phenomenon are still unclear. Here, three type of roots of T. fargesii were used for histological observation, plant endogenous hormone determination, non-structural carbohydrate (NSC) determination, and sequencing using the Illumina next-generation and PacBio SMRT platforms. Our results indicated that root sprouts originated from cork cambiums. Furthermore, indole-3-acetic acid (IAA), zeatin riboside (ZR), gibberellic acid 3 (GA3), and abscisic acid (ABA) content was significantly increased, while soluble sugar content was significantly decreased in the root sprouts. In addition, transcriptomic analysis suggested a total of 36.19 G of raw data from which 210 differentially expressed genes (DEGs) of were identified in RS vs. SR. Of these, the candidate DEGs were largely enriched in the citrate cycle, gluconeogenesis, starch and sucrose metabolism, and plant hormone signal transduction pathways. We therefore speculated that the accumulation of cytokinin and auxin might be induced by ATP-binding cassette-B 19 (ABCB19) and ABCG14, which were necessary for root sprouting. Additionally, transcription factors SQUAMOSA promoter binding protein-like 18 (SPL18) and NAM, ATAF1/2, and CUC2-14 (NAC14) were found in response to environmental water and epigenetic modification in RS. Overall, this study was to unravel the physiological and transcriptomic levels of the development of root sprouting in T. fargesii.

1. Introduction

Roots play essential roles in growth by absorbing, storing, and transporting nutrients from the soil and by synthesizing substances [1]. Root sprouting is conducive to competition in the plantation persistence niche or living space. It is crucial for forest community regeneration [2,3,4,5]. Root sprouting has been found in various ecosystems, including rainforests [6], desert shrublands [7], conifer forests [8], Mediterranean-type ecosystems [9], and savannas [10]. It is particularly prevalent in tropical and temperate montane rainforests [11,12]. Only 10% of Central European flora consists of root sprout species, while the percentages are 34% in Jamaica and 21% in New Zealand [13]. In addition, they are primarily found in angiosperms (mostly dicotyledons) and are very rare in gymnosperms. Compared to herbs and shrubs, woody plant species have higher root sprouting possibilities [14,15].
However, numerous studies have indicated that disturbance plays a significant role in the formation of root sprouts [16,17,18]. They typically occur on roots located in close proximity to the surface of the soil, and the ability to form root sprouts is considered non-conservative, meaning that it can be easily gained or lost during evolutionary processes [19]. Generally, underground buds can differentiate into at least six different types of tissues, including roots, root crowns, rhizomes, woody burls, flight swellings, and below-ground caudexes [18]. However, root-sprouting seedlings are oftentimes developed by root buds. The origin of root buds is believed to initiate from two distinct modes: reparative buds, which have an exogenous initiation and develop from pericycle cells or cambium without a vascular connection to the mother root (these buds often die in later stages) [3,5,20]; and adventitious buds, which have an endogenous origin and spontaneously develop from the primary xylem without causing any damage. These buds both connect to the vascular system of the mother root, eventually leading to the formation of a new individual plant [3].
Nonetheless, so far, there is little information about the genes involved in root sprouting. Several physiological studies have demonstrated that the initiation of root buds is regulated by apical dominance, with auxin transporters [21,22]. On one hand, auxin is synthesized in young leaves and shoot apices and transported to the roots, where it inhibits root sprouting [23,24]. On the other hand, cytokinins, which are produced at the root tips, are known to promote root sprouting [25]. In the process of root sprouting, auxin is considered a negative regulator, while cytokinin is perceived as a positive regulator. These two groups of hormones work together in coordinating the initiation of root buds [26].
The removal of the aboveground portion of a tree halts auxin production, leading to an increase in the cytokinin-to-auxin ratio in the roots, consequently initiating root sprouting [22,27]. On one hand, the use of an auxin inhibitor called N-1-naphthylphthalamic acid (NPA) can promote root bud development [22] and artificial root injury can also enhance the ability of root sprouts by increasing the cytokinin-to-auxin ratio [4]. On the other hand, the specific expression of cytokinin oxidase (CKX2) in the roots of transgenic poplar can inhibit the initiation of root sprouting [28]. Furthermore, the ability of root sprouting is generally higher in spring, when the content of auxin and cytokinin is higher compared to other seasons [4]. Moreover, the ability of root cuttings to sprout is negatively correlated with seasonal changes in auxin levels [2].
The influence of apical dominance on root buds may originate from two patterns. The first pattern involves a signal produced in the shoot apices, which includes young expanding leaves and meristems, and is likely connected to auxin perception. Generally, both auxins and cytokinins are considered to play pivotal roles in this process. In addition to plant hormones, sugar is also an important factor in the occurrence of plant adventitious buds. The second pattern is likely related to sugar transport and it is believed that root sprouting is closely associated with apical dominance. Studies conducted in fire ecosystems have found that root-sprouting plants have higher levels of non-structural carbohydrates compared to non-root-sprouting plants [29,30,31]. Moreover, previous studies demonstrate the presence of crosstalk between phytohormone signaling and sugar sensing in higher plants, which regulates developmental processes at transcriptional, posttranscriptional, and posttranslational levels. Sugars can also impact the response of phytohormone levels by influencing the localization and/or transport of various phytohormones [32,33,34]. In addition, trees that are more robust have larger root systems and greater stores of carbohydrates, enabling them to produce a larger number of root sprouts. For instance, in the case of aspen, root cutting experiments have revealed that the occurrence of root sprouts is determined by the initial mass or concentration of starch in the roots [35].
Toona fargesii is a fast-growing, broad-leaved tree belonging to the Toona genus of the Meliaceae family. This species is predominantly distributed in the mountainous regions of the tropical and subtropical east of Asia but sometimes is mistakenly identified as T. ciliata var. pubescens. Intriguingly, T. fargesii exhibits two modes of reproduction: seed reproduction and root sprouting. Nevertheless, the genes involving in the root sprouting have been largely unknown. Here, we would like to primarily investigate this phenomenon through different levels including morphological and anatomical observations, physical measurements, and transcriptomic analysis. Collectively, the findings might provide novel insights into the root sprouting pattern in T. fargesii.

2. Materials and Methods

2.1. Materials

Root samples were collected from a community of T. far in the Jiulianshan National Nature Reserve, located at the coordinates 24°29′–24°38′ N, 114°22′–114°31′ E. The Jiulianshan National Nature Reserve experiences a typical subtropical monsoon climate, with an average annual temperature of 16.8 °C, precipitation of 1927.7 mm, and an annual average relative humidity of 86%. T. fargesii was scattered near valleys or streams in this area, where there were many root sprouts (Figure S1). In April 2020, we conducted investigations on the number of root buds and the diameters of the mother roots within the natural community. Accordingly, we categorized the roots in the natural secondary forest of T. fargesii into three types, namely root sprouting parts (RS), non-root sprouting parts (NRS), and soil roots (SR). RS refers to the portion where the root sprouts are just protruding from the epidermis; NRS refers to tissue located 1 cm next to the root sprouts, ensuring that both the NRS and RS are in the same environment; SR refers to the same roots extended into depth of 5–10 cm in the soil. All samples were collected and stored in dry ice on the same day before being transferred to the laboratory and stored at −80 °C.
To obtain these samples, we dissected the RS along the cross-sectional diameter of the mother root using a single-sided blade based on the size of the root buds. The same approach was used to collect NRS and SR samples. Prior to dissection, the root materials were cleaned with sterile water. Four areas with a higher number of root sprouts were chosen, with four biological duplications.

2.2. Endogenous Hormones Measurements

The samples in the field were collected and used to measure the content of endogenous hormones. The extraction, purification, and determination of indole-3-acetic acid (IAA), zeatin riboside (ZR), gibberellic acid 3 (GA3), and abscisic acid (ABA) content were performed using the enzyme linked immunosorbent assay (ELISA) technique as described by Yang et al. in 2001 and He in 1993 [36,37]. Approximately, 0.5 g of root samples were homogenized in an ice bath, followed by centrifugation at 3500× g for 8 min at 4 °C. Then, the supernatant was filtered using a C-18 solid-phase column and collected into a 10-mL plastic centrifuge tube. The hormone fractions were eluted with 10 mL 100% (v/v) methanol and 10 mL ether from the columns, and then dried under liquid nitrogen, and dissolved in 2 mL phosphate-buffered saline (PBS) containing 0.1% (v/v) Tween 20 and 0.1% (w/v) gelatin (pH 7.5) for analysis by ELISA. The mouse monoclonal antigens, antibodies, and IgG horseradish peroxidase used in ELISA were produced at the Phytohormones Research Institute (China Agricultural University; see He, 1993). The color development in each well was detected using an ELISA Reader (model EL310, Bio-TEK, Winooski, VT, USA) at an optical density of A490. Twelve samples of RS, NRS, and SR with four independent replicates were analyzed for the content of endogenous hormones (IAA, ZR, GA3, and ABA).

2.3. Soluble Sugar, Starch, Non-Structural Carbohydrate Measurements

Similarly, the soluble sugar and starch content of the samples was determined. Twelve samples of RS, NRS, and SR with four independent replicates were used for analysis. The anthrone method [38] was employed to estimate the soluble sugar and starch content. Specifically, 1.00 g of root tissue from the field material was accurately weighed and ground to a crushed state using liquid nitrogen. After that, the supernatant obtained was utilized to estimate the starch content following the anthrone method, with a conversion factor of 0.9 applied to derive the starch volume. Then, the total non-structural carbohydrates (NSCs) were defined as the combined sum of the soluble sugar and starch contents.

2.4. Histological Observation

The segments of RS, NRS, and SR roots were dissected into 0.5 cm samples. The samples were then fixed with FAA (a solution containing 70% ethanol, 5% formalin, and 5% acetic acid, v/v/v) for seven days, with the solution changed twice during this period. After fixation, the samples were stored in a 70% ethanol solution. To prepare the samples for microscopy, they were dehydrated using a series of ethyl alcohol solutions with increasing concentrations (80%, 90%, 95%, and 100%). The samples were sequentially transferred into a solution of 1/2 ethyl alcohol and 1/2 xylene for 1 h, followed by immersion in xylene for another hour. The samples were then saturated with a mixture of xylene and paraffin for 12 h before being embedded in paraffin at a temperature of 60 °C. Using a LEICA RM2235 paraffin tissue slicer, the embedded samples were sliced into serial sections of 10 μm thickness. The sections were then dewaxed, stained with a 1% safranin O-fast green solution, decolorized, and sealed. Finally, the images of the samples were acquired using the Olympus SZX10 microscope ((Olympus, Center Valley, PA, USA) camera system.

2.5. Illumina and PacBio SMRT Sequencing

Total RNA was extracted from 0.5 g of root tissue using the CTAB method. The precipitated RNA was then further purified using the RNeasy Mini kit according to the manufacturer’s protocol. The concentration and purity of the RNA were measured using a NanoDrop 2000 spectrophotometer (NanoDrop Technologies, Wilmington, DE, USA). To elucidate the molecular basis of root sprouting in T. far roots, two experiments were conducted using the Illumina HiSeq and PacBio SMRT RNA-seq platforms. In the first experiment, twelve mRNA samples were obtained separately using RNA HiSeq. The libraries of the three types of roots were sequenced to generate raw data. Furthermore, the quality of the sequencing data was assessed using Sanger quality values (Phred Quality Score), with higher scores denoting better sequencing quality (ranging from Q20 to Q30). After filtering the raw data, clean data were obtained. Additionally, a mixture of RS_2, NRS_4, and SR_4 tissues was collected for the PacBio SMRT Iso-Seq assay. Then, the raw data obtained were initially processed using the official PacBio software package SMRTlink 5.0. Subsequently, the full-length sequences were sorted. Clustering of full-length transcripts and PacBio calibration were performed using SMRTlink 5.0.

2.6. The Annotation, Enrichment, and Analysis of DEGs

To correct the PacBio full-length sequences with Illumina data, the LoRDEC 0.6 software [39] was utilized. Then, cluster database at high identity with tolerance (CD-HIT) was employed to obtain non-redundant full-length transcripts [40]. For comprehensive gene function information, gene function annotation was performed on the non-redundant sequences using the CD-HIT v4.8.1 software, including the non-redundant protein sequence database (NR), nucleotide sequence database, with entries from all traditional divisions (NT), Pfam, Clusters of Orthologous Genes (COG/KOG), Swiss-Prot, Kyoto Encyclopedia of Genes and Genomes (KEGG), and Gene Ontology (GO) databases. Plant transcription factors were predicted using the iTAK v 18.12 software [41]. The coding potential of the PacBio sequencing data was predicted using Chittaranjan National Cancer Institute (CNCI) [42], plek [43], cpc2 [44] software (http://cpc2.cbi.pku.edu.cn), and the Pfam database [45]. All the genes obtained using PacBio sequencing were used as reference genes. The clean reads obtained from twelve samples were generated by Illumina sequencing. In addition, RSEM v1.3.2 software was used to statistically analyze the comparison results of Bowtie2. This allowed us to obtain the read count value of each sample for each gene, which was then converted to FPKM (fragments per kilobase of transcript per million mapped reads) to analyze the gene expression level. DEG analysis was conducted using DEseq2 [46], with a significance threshold set at |Log2 (FoldChange)| > 1 and Padj < 0.05. Furthermore, hierarchical clustering analysis was employed using the FPKM values of DEGs under RS, NRS, and SR conditions to assess the expression levels. For GO enrichment analysis, we utilized the GO-seq software (https://geneontology.org). To perform pathway enrichment analysis, the Kyoto Encyclopedia of Genes and Genomes (KEGG) database was employed along with KOBAS (3.0).

2.7. The Validation of Candidate Genes by qPCR

Total RNA was extracted from three types of roots using the Plant RNA Extraction Kit (Sangon, Shanghai, China). Referring to relevant studies on adventitious bud regeneration and speculation related to hormone transport, we therefore selected these genes from transcription factors related to bud regeneration for quantitative verification. To validate the DEGs, a total of 20 genes was selected for quantitative real-time PCR (qRT-PCR) analysis, following previously described methods [47]. Primers for qRT-PCR were designed using primer 3.0 (http://bioinfo.ut.ee/primer3-0.4.0, accessed on 17 March 2021) (Table S1). The actin7 gene was used as a housekeeping gene in the experiment [48]. The qRT-PCR reactions were implemented using the iTaq Universal SYBR Green Supermix and Bio-Rad Real-Time PCR System. The general protocol included a denaturation step at 95 °C for 2 min, followed by 40 cycles of amplification with a melting temperature of 95 °C for 10 s, an annealing temperature of 60 °C for 30 s, and an extension temperature of 72 °C for 30 s. The relative expression levels of the target genes were calculated using the 2−ΔΔCt method [49].

2.8. Statistical Analysis

The concentrations of physiological substances were statistically analyzed using SPSS software (version 19.0) through one-way analysis of variance (ANOVA) and t-tests. The experimental data were presented as the mean value ± standard deviation (SD) of four replicated experiments. The gene heatmaps were visualized by TB-tools v1.120.

3. Results

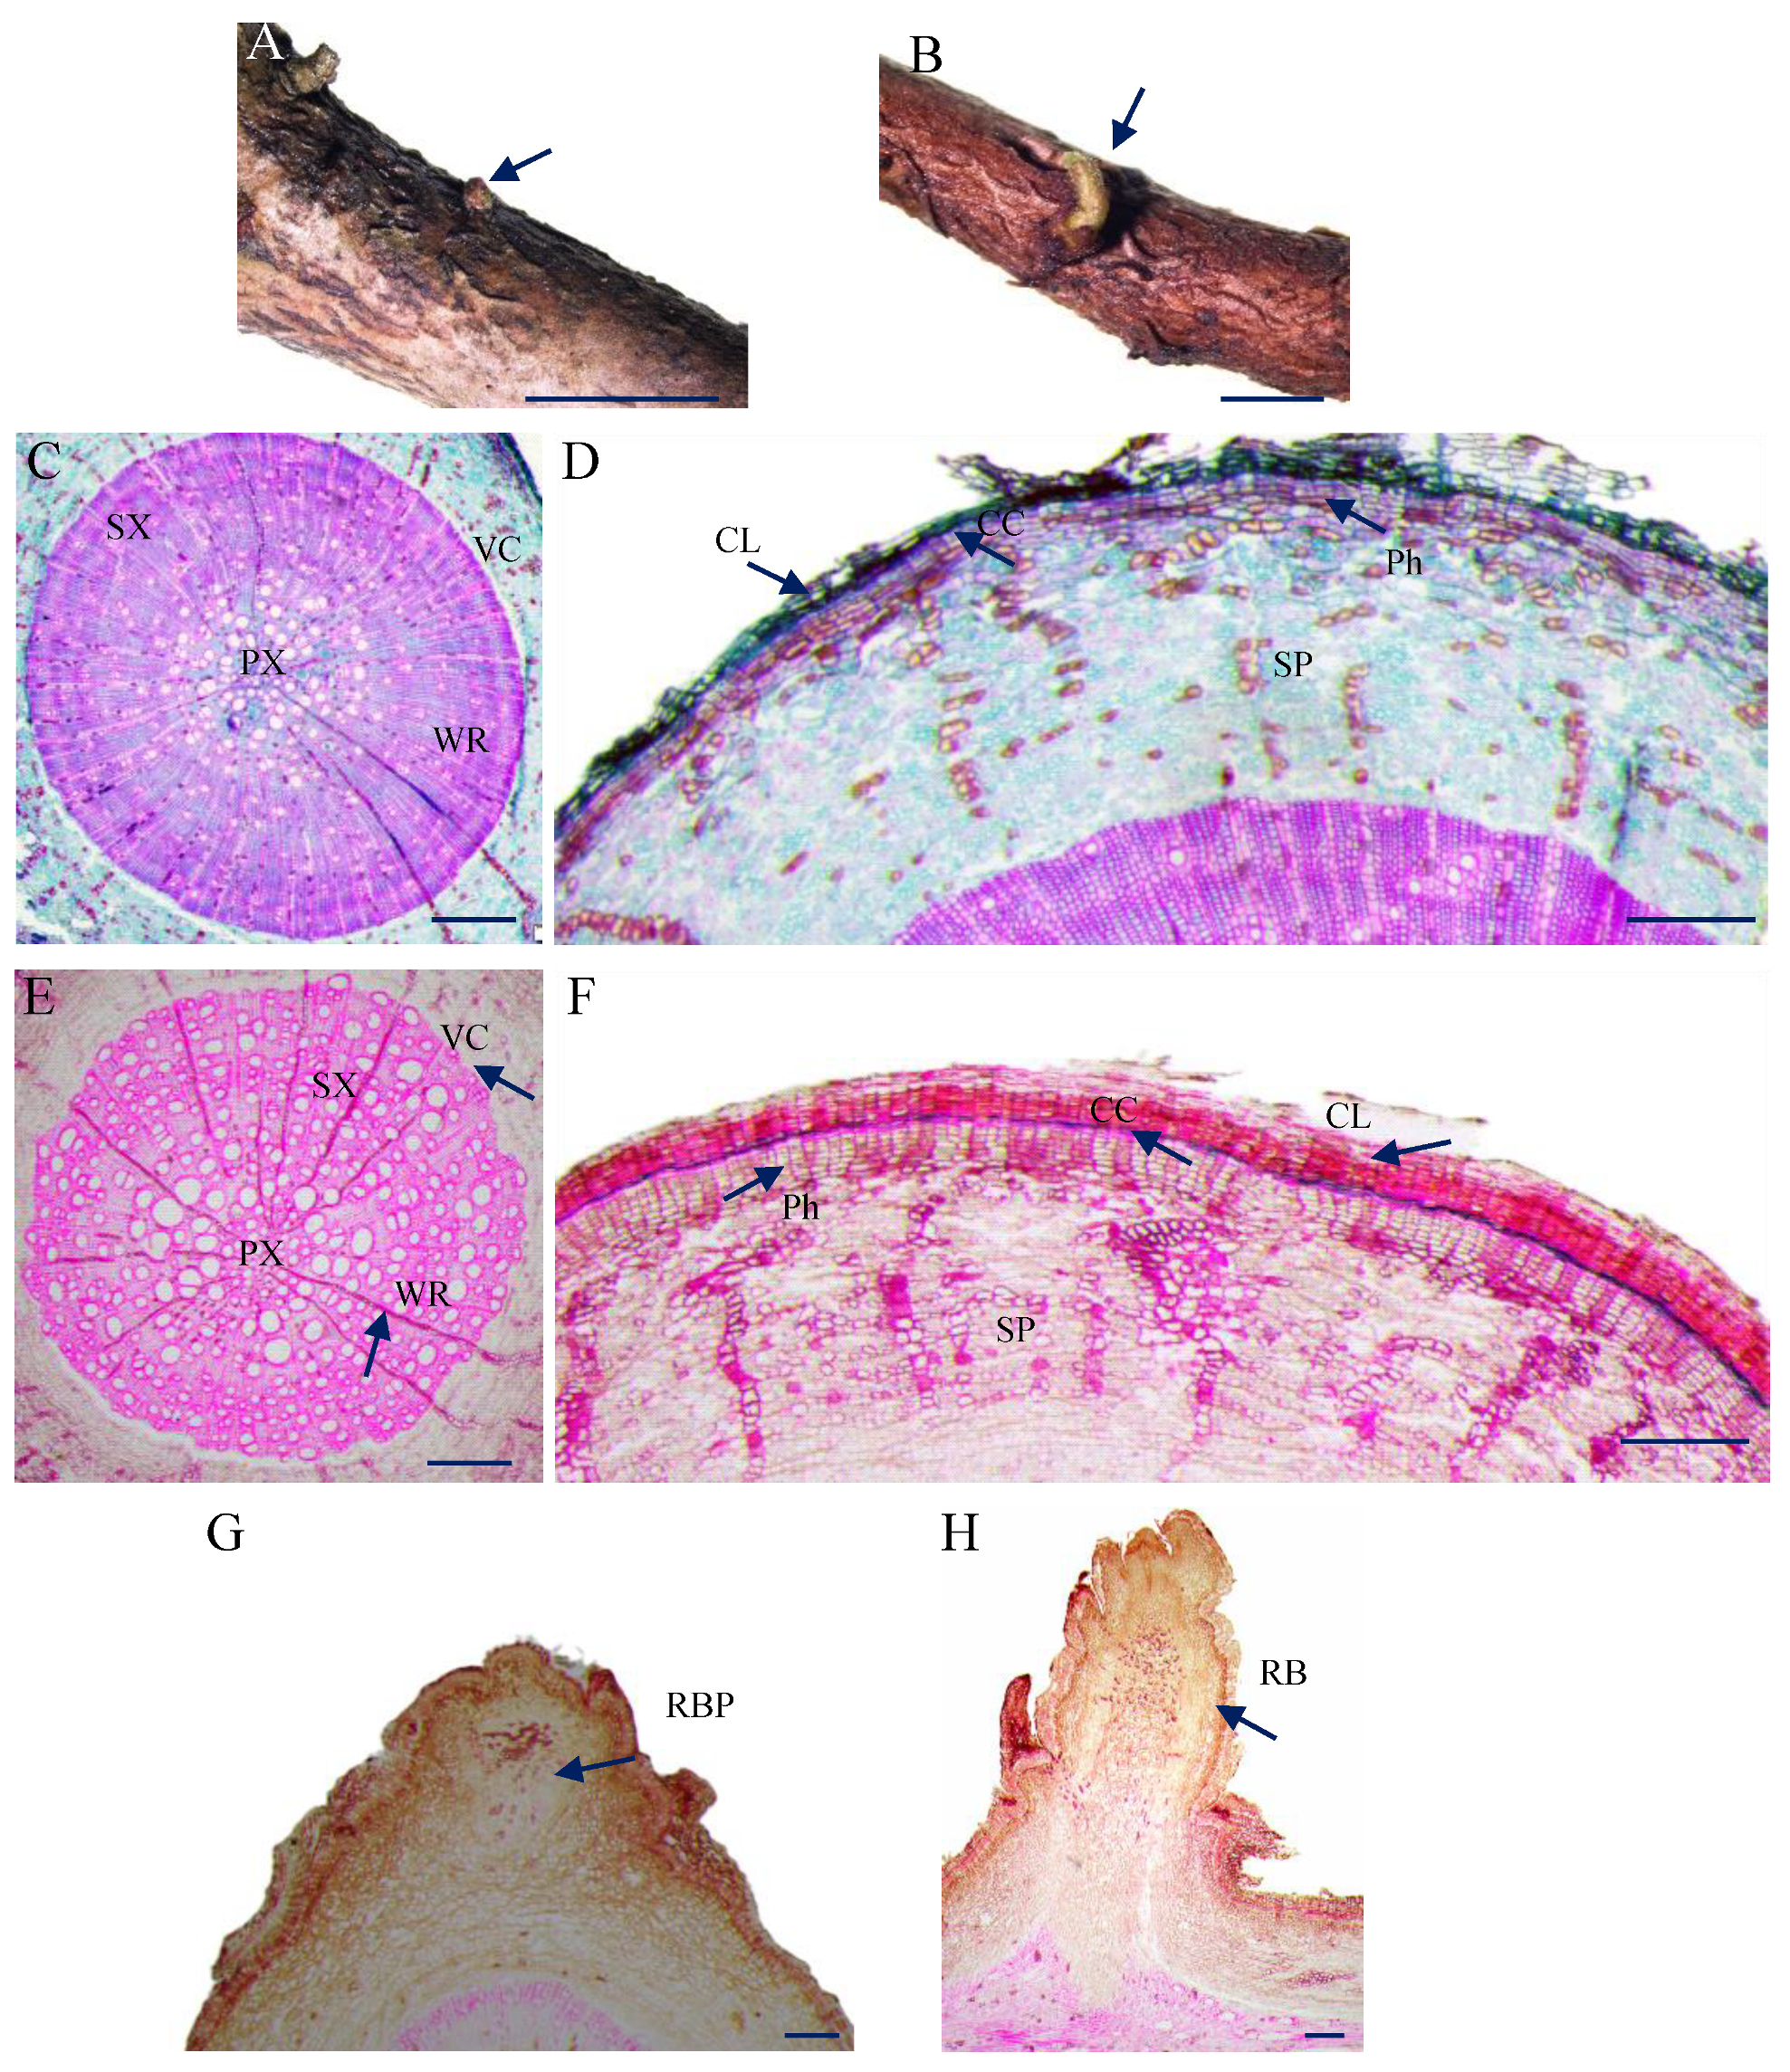
3.1. Morphology and Anatomical Observation

To explore the morphological differences between aboveground roots and underground roots in natural conditions, we conducted morphological observations. To obtain the samples, we dissected the RS along the cross-sectional diameter of the mother root using a single-sided blade based on the size of the root buds. The same approach was used to collect NRS and SR samples. Prior to dissection, the root materials were cleaned with sterile water. Four areas with a higher number of root sprouts were chosen with four biological duplications. Notably, the majority of root buds, accounting for 97.11%, were found on aboveground roots. Of these, 88.71% occurred on mother roots with a diameter less than 8.00 mm, while 35.96% and 28.87% of root buds were found on 2.00–4.00 mm and 4.00–6.00 mm diameter roots, respectively (Figure S2). We therefore selected root diameters ranging from 4.00 mm to 6.00 mm, where most of the root sprouts were often observed. The root buds appeared as either individual buds or clusters of multiple buds (Figure 1A,B).
The inner side of the vascular cambium in the root exhibited a well-developed secondary xylem, which comprises a significant portion. This secondary xylem was composed of vessels, wood parenchyma cells, and wood rays. Vessel elements were the predominant component within the secondary xylem, with a tightly arranged configuration despite variable vessel diameters. Numerous wood rays were also present, each consisting of a radial arrangement of parenchyma cells. In comparison, aboveground roots displayed a higher abundance of vessel elements and greater development of the secondary xylem compared to underground roots (Figure 1C,D). Furthermore, anatomical analysis revealed that the underground roots possessed a cork layer comprising four cell layers, a cork cambium with two cell layers, and a periderm with 4–5 cell layers. In contrast, the aboveground roots had a cork layer consisting of 8–9 cell layers, a cork cambium with two cell layers, and a periderm with 4–5 cell layers. This implied that the thickening of the periderm in aboveground roots might serve as a protective adaptation against the exposed environment (Figure 1E,F). In aboveground roots, the formation of root buds originated from the cork cambium, extending upwards through the cork layer. Meanwhile, the lower tissue grew inward into the phelloderm. The bud primordium subsequently breached the epidermis, with its base penetrating into the inner parenchyma layer and secondary phloem (Figure 1G). Eventually, the buds developed their complete shape outward and established a connection with the xylem of the mother root (Figure 1H).

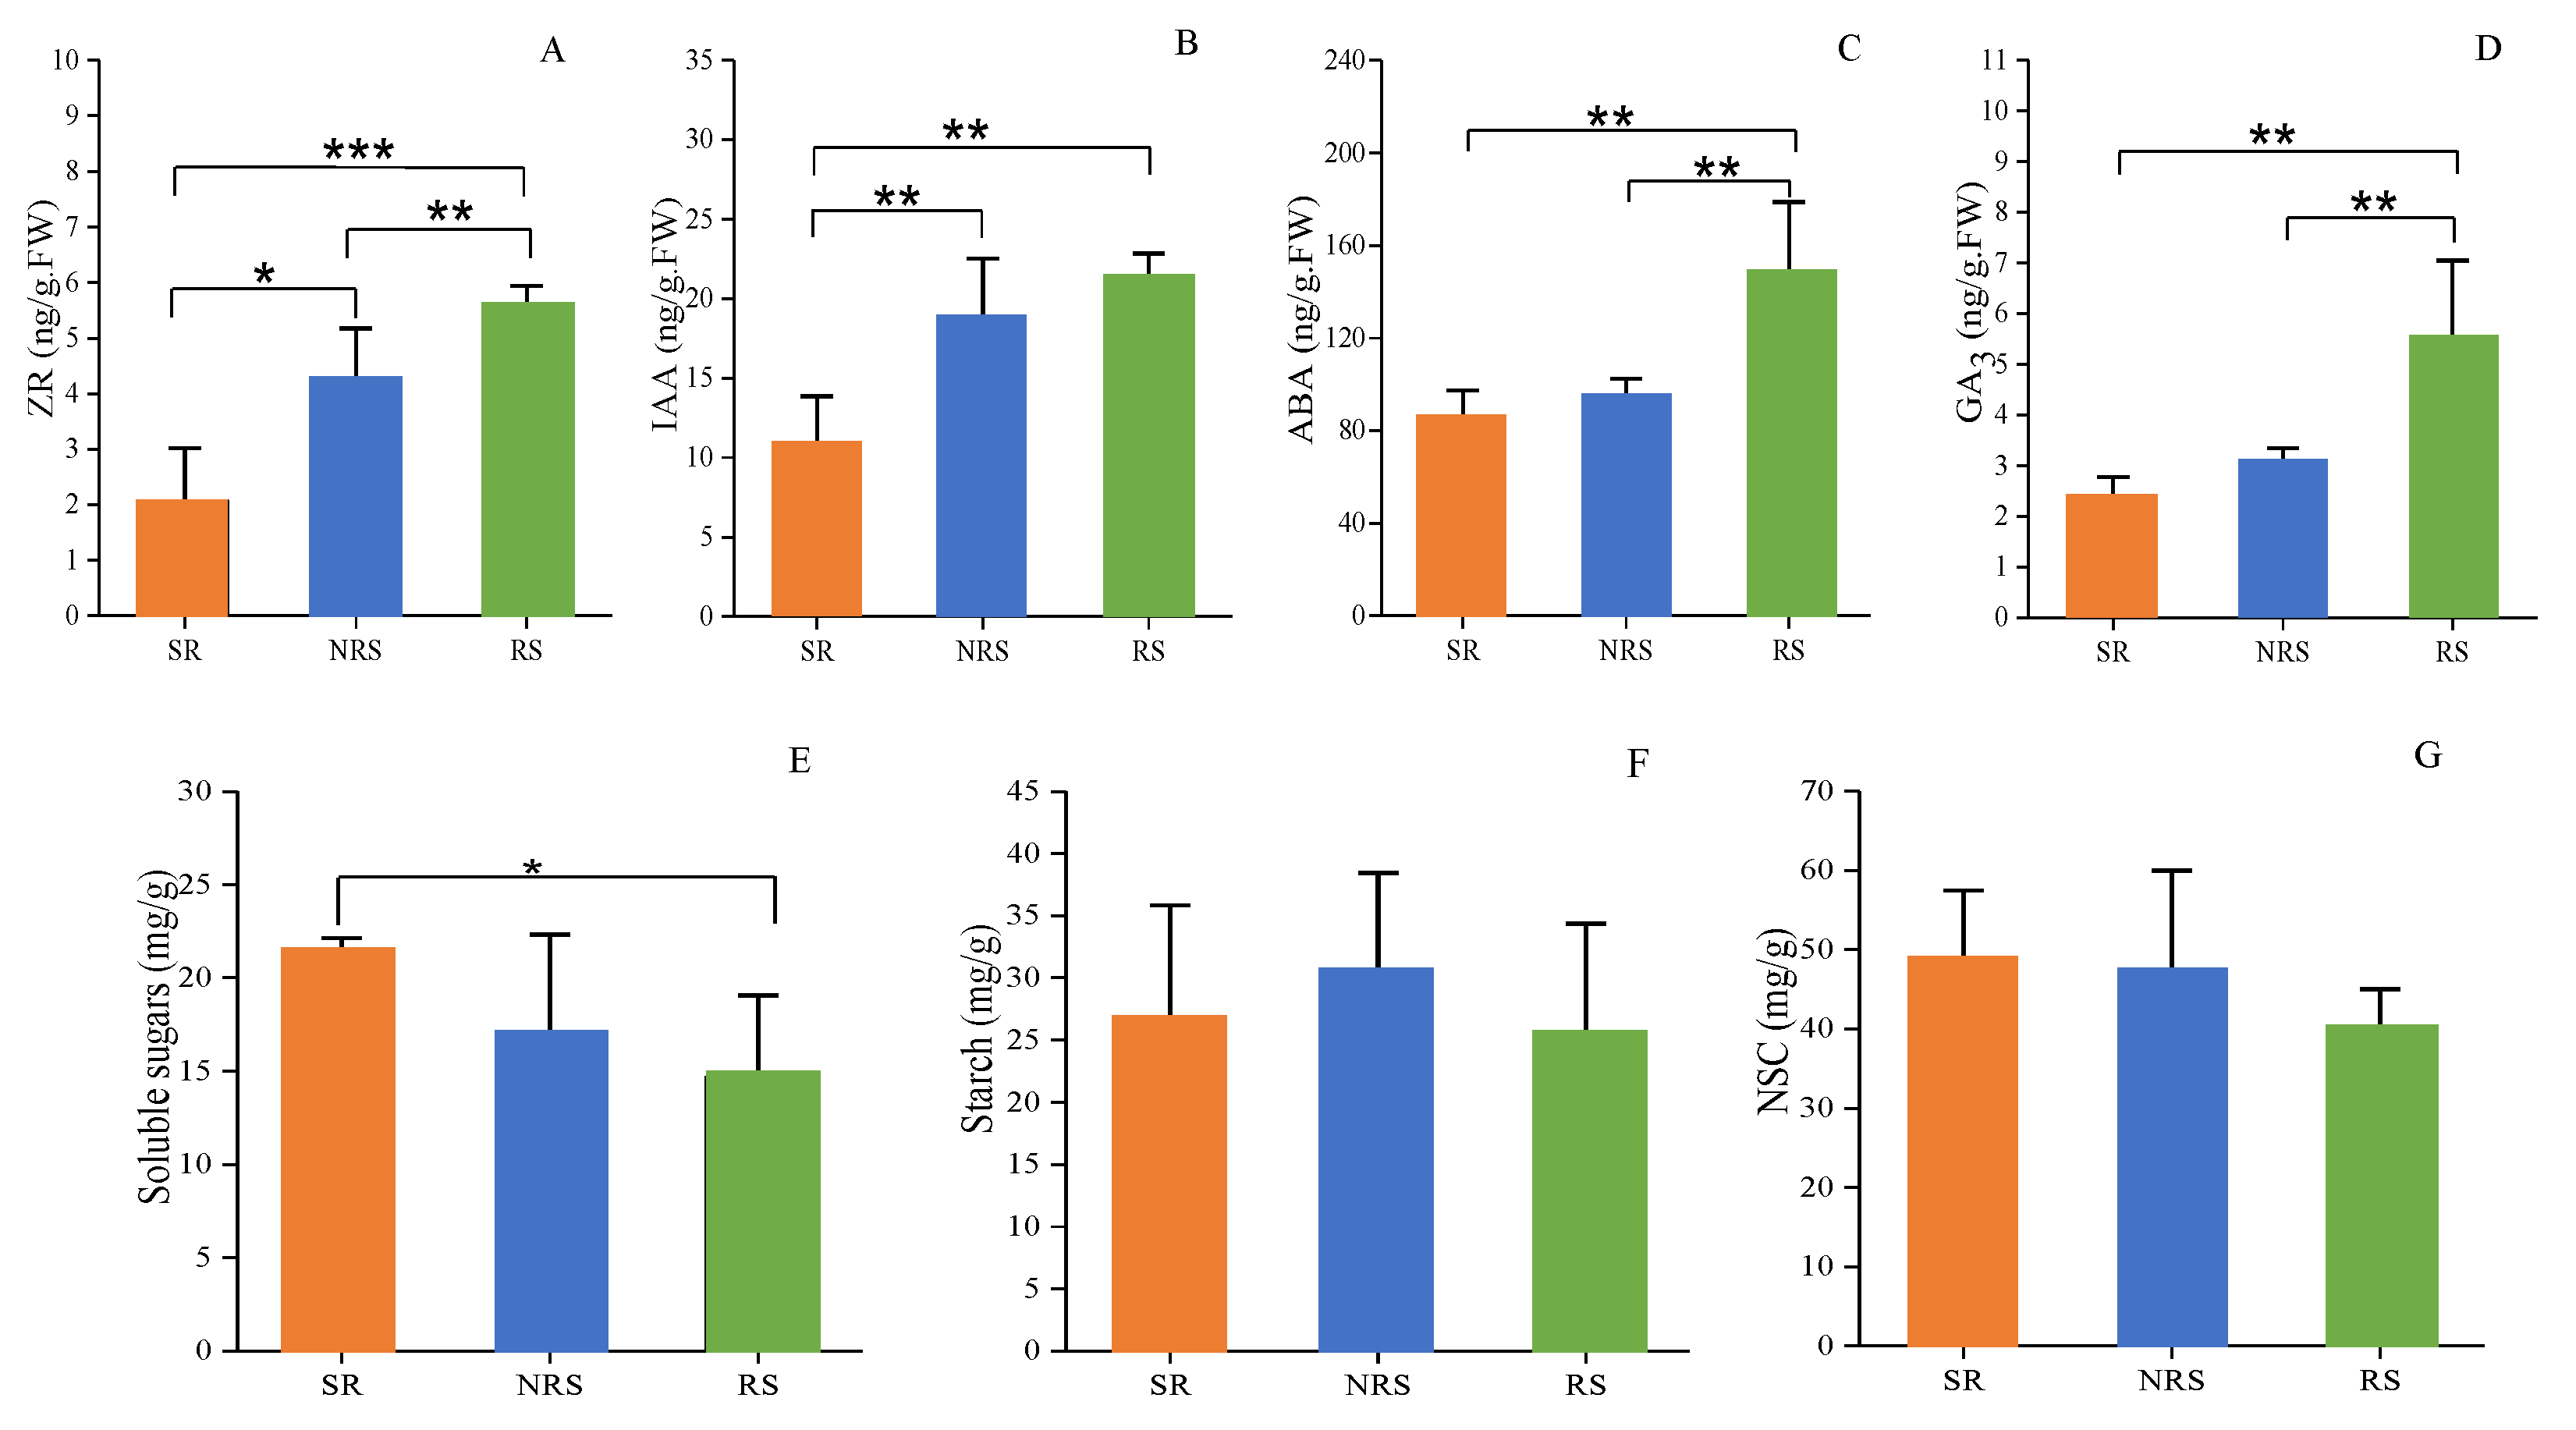
3.2. Phytohormone Levels in RS, NRS and SR

The levels of ZR, IAA, ABA, and GA3 were measured using the ELISA method in the sample tissues of underground root (SR) and aboveground root (RS and NRS). This was performed to assess the levels of auxin, cytokinin, abscisic acid, and gibberellin in the samples. Compared to the underground samples (SR), the concentrations of ZR and IAA were significantly higher in the aboveground samples (RS and NRS). Meanwhile, no significant difference was observed in the levels of ABA and GA3. This suggested that environmental exposure positively influences the content of auxin and cytokinin, but seldom effected on abscisic acid and gibberellin.
In terms of ZR levels, on one hand, the RSs showed significantly higher concentrations compared to the NRS (p < 0.01). This indicated that there might be a different process of cytokinin accumulation in the two types of roots. There was no significant difference observed in auxin levels between the aboveground roots (RS and NRS). On the other hand, ABA and GA3 showed a significant increase in root bud tissue, suggesting that abscisic acid and gibberellin might be involved in root bud development (Figure 2A–D).

3.3. Non-Structural Carbohydrate Levels in RS, NRS and SR

The root is a critical carbohydrate storage organ, and the formation of adventitious buds relies on the important role of carbohydrates. Here, the soluble sugar content in aboveground roots was found to be lower than that in underground roots. Furthermore, the soluble sugar content in the RS group was significantly lower compared to the NRS group, indicating that RS exhibited a higher capacity for cell division and metabolism, by faster usage of shoot-derived sucrose for cell wall building, etc. (Figure 2E). Moreover, starch serves as an important form of carbon storage. The starch content showed no significant difference among RS, NRS, and SR, but there were slight increases in NRS (Figure 2F). We speculated that the increase in starch content in NRS might be attributed to enhanced photosynthesis in aboveground roots, which promotes starch synthesis. Conversely, the decrease in starch content in RS might be owing to the degradation of starch to provide energy for the development of root buds. Additionally, the NSC content did not show a significant difference, but there was a slight decrease in RS, indicating that root sprouting involves the consumption of non-structural carbohydrates (Figure 2G).

3.4. Transcriptome Assembly and Annotation

A total of 287,137,744 paired-end raw reads were generated from Illumina RNA-seq. After filtering these raw reads, we obtained a total of 278,348,919 high-quality clean reads. Specifically, the RSs, NRSs, and SRs samples generated 90,429,138 reads, 93,752,503 reads, and 94,167,258 reads, respectively (Table S2). For PacBio SMRT sequencing, full-length cDNAs from 3 poly(A) RNA samples (a mixture of RS_2, NRS_4, and SR_4) were pooled. We obtained 629,163 polymerase reads (36.19 G) with a mean length of 57,526 nt and an N50 length of 118,137 nt using PacBio SMRT Iso-seq. Next, we detected sequence adapters and filtered out polymerase reads shorter than 50 bp. Then, they output 15,022,678 subreads with a mean length of 2335 nt and an N50 length of 2617 nt. We generated CCS (circular consensus sequences) from the subread BAM files and obtained 538,668 multi-pass consensus reads.
In total, we identified 490,601 full-length reads by detecting the poly(A) tail, as well as the 5′ and 3′ primer sequences. To correct the high error rates of the SMRT subreads, we used LoRDEC 0.6 software and obtained 52,148 transcripts. After filtering using CD-HIT, we retained 28,725 non-redundant reads. In addition, the number of unigenes produced by SMRT sequencing varied based on transcript length intervals: <0.5 kb (23 unigenes), 0.5–1 kb (801 unigenes), 1–2 kb (9498 unigenes), 2–3 kb (9982 unigenes), and >3 kb (8421 unigenes) (Table S3). To achieve the putative functional annotation of the transcriptome, the unigenes were examined against NR, NT, PFAM, GO, KEGG, KOG/COG, and SWISS-PROT databases. In total, 28,561 (99.43%) of the unigenes were annotated using at least one database. Among these, 14,510 (50.51%) of the unigenes could be assigned to a homolog in the mentioned four databases. Specifically, 28,341 (98.66%) and 27,657 (96.28%) unigenes were annotated according to the NR and NT databases. Moreover, 21,086 (73.41%) and 25,118 (87.44%) unigenes were annotated using the PFAM and SWISS-PROT protein databases. Furthermore, 21,086 (73.41%), 28,233 (98.29%), and 27,927 (97.22%) unigenes could be annotated with biological functions according to the GO, KEGG, and KOG/COG databases, respectively.
A total of 28,725 unigenes were categorized into three GO categories: cellular component (CC), biological process (BP), and molecular function (MF). These unigenes were further divided into 51 major functional groups. Among all the GO term categories, binding (GO: 0005488), catalytic activity (GO: 0003824), and metabolic process (GO: 0008152) were the highest-ranking in the three mentioned GO categories, respectively. A total of 28,233 unigenes were mapped in terms of KEGG pathways, where carbon metabolism (ko01200, 526 unigenes), spliceosome (ko03040, 505 unigenes), and biosynthesis of amino acids (ko01230, 448 unigenes) were the top three slots. Also, the 27,927 unigenes were grouped into 26 KOG classifications. Group R (general function prediction only), T (signal transduction mechanisms), and O (posttranslational modification, protein turnover, chaperones) occupied the top three slots with a high percentage of genes. Moreover, group N (cell motility groups) and group W (extracellular structures) exhibited the least number of annotated genes.

3.5. Analysis of Differentially Expressed Genes (DEGs)

After read filtering, we mapped clean reads to the Pacbio annotation unigenes. On average, 80.13% reads were mapped (Table S4). Additionally, gene expression levels based on FPKM value were evaluated, and the gene expression distribution of each sample was measured. After combining all DEGs of each comparison group, RSs vs. NRSs found fewer DEGs including 18 genes (12 upregulated and 6 downregulated) than RSs vs. SRs which had 210 DEGs (180 upregulated and 30 downregulated), and NRS vs. SR group with 793 DEGs (743 upregulated and 50 downregulated) (Figure S3).
KEGG pathway analysis was employed to further identify the biological behavior in which the DEGs were involved. The pathway included citrate cycle (TCA cycle), carbon fixation in photosynthetic organisms, pyruvate metabolism, glycolysis/gluconeogenesis, starch and sucrose metabolism, plant hormone signal transduction, regulation of autophagy, oxidative phosphorylation, spliceosome, endocytosis, and plant–pathogen interaction. Among them, six pathways were significantly different (p < 0.05) in comparisons of RS vs. NRS, NRS vs. SR and RS vs. SR including citrate cycle (TCA cycle), carbon fixation in photosynthetic organisms, pyruvate metabolism, glycolysis/gluconeogenesis, starch and sucrose metabolism, plant hormone signal transduction and plant–pathogen interaction (Figure S4). These findings indicated that these seven pathways were probably related to root sprouting.

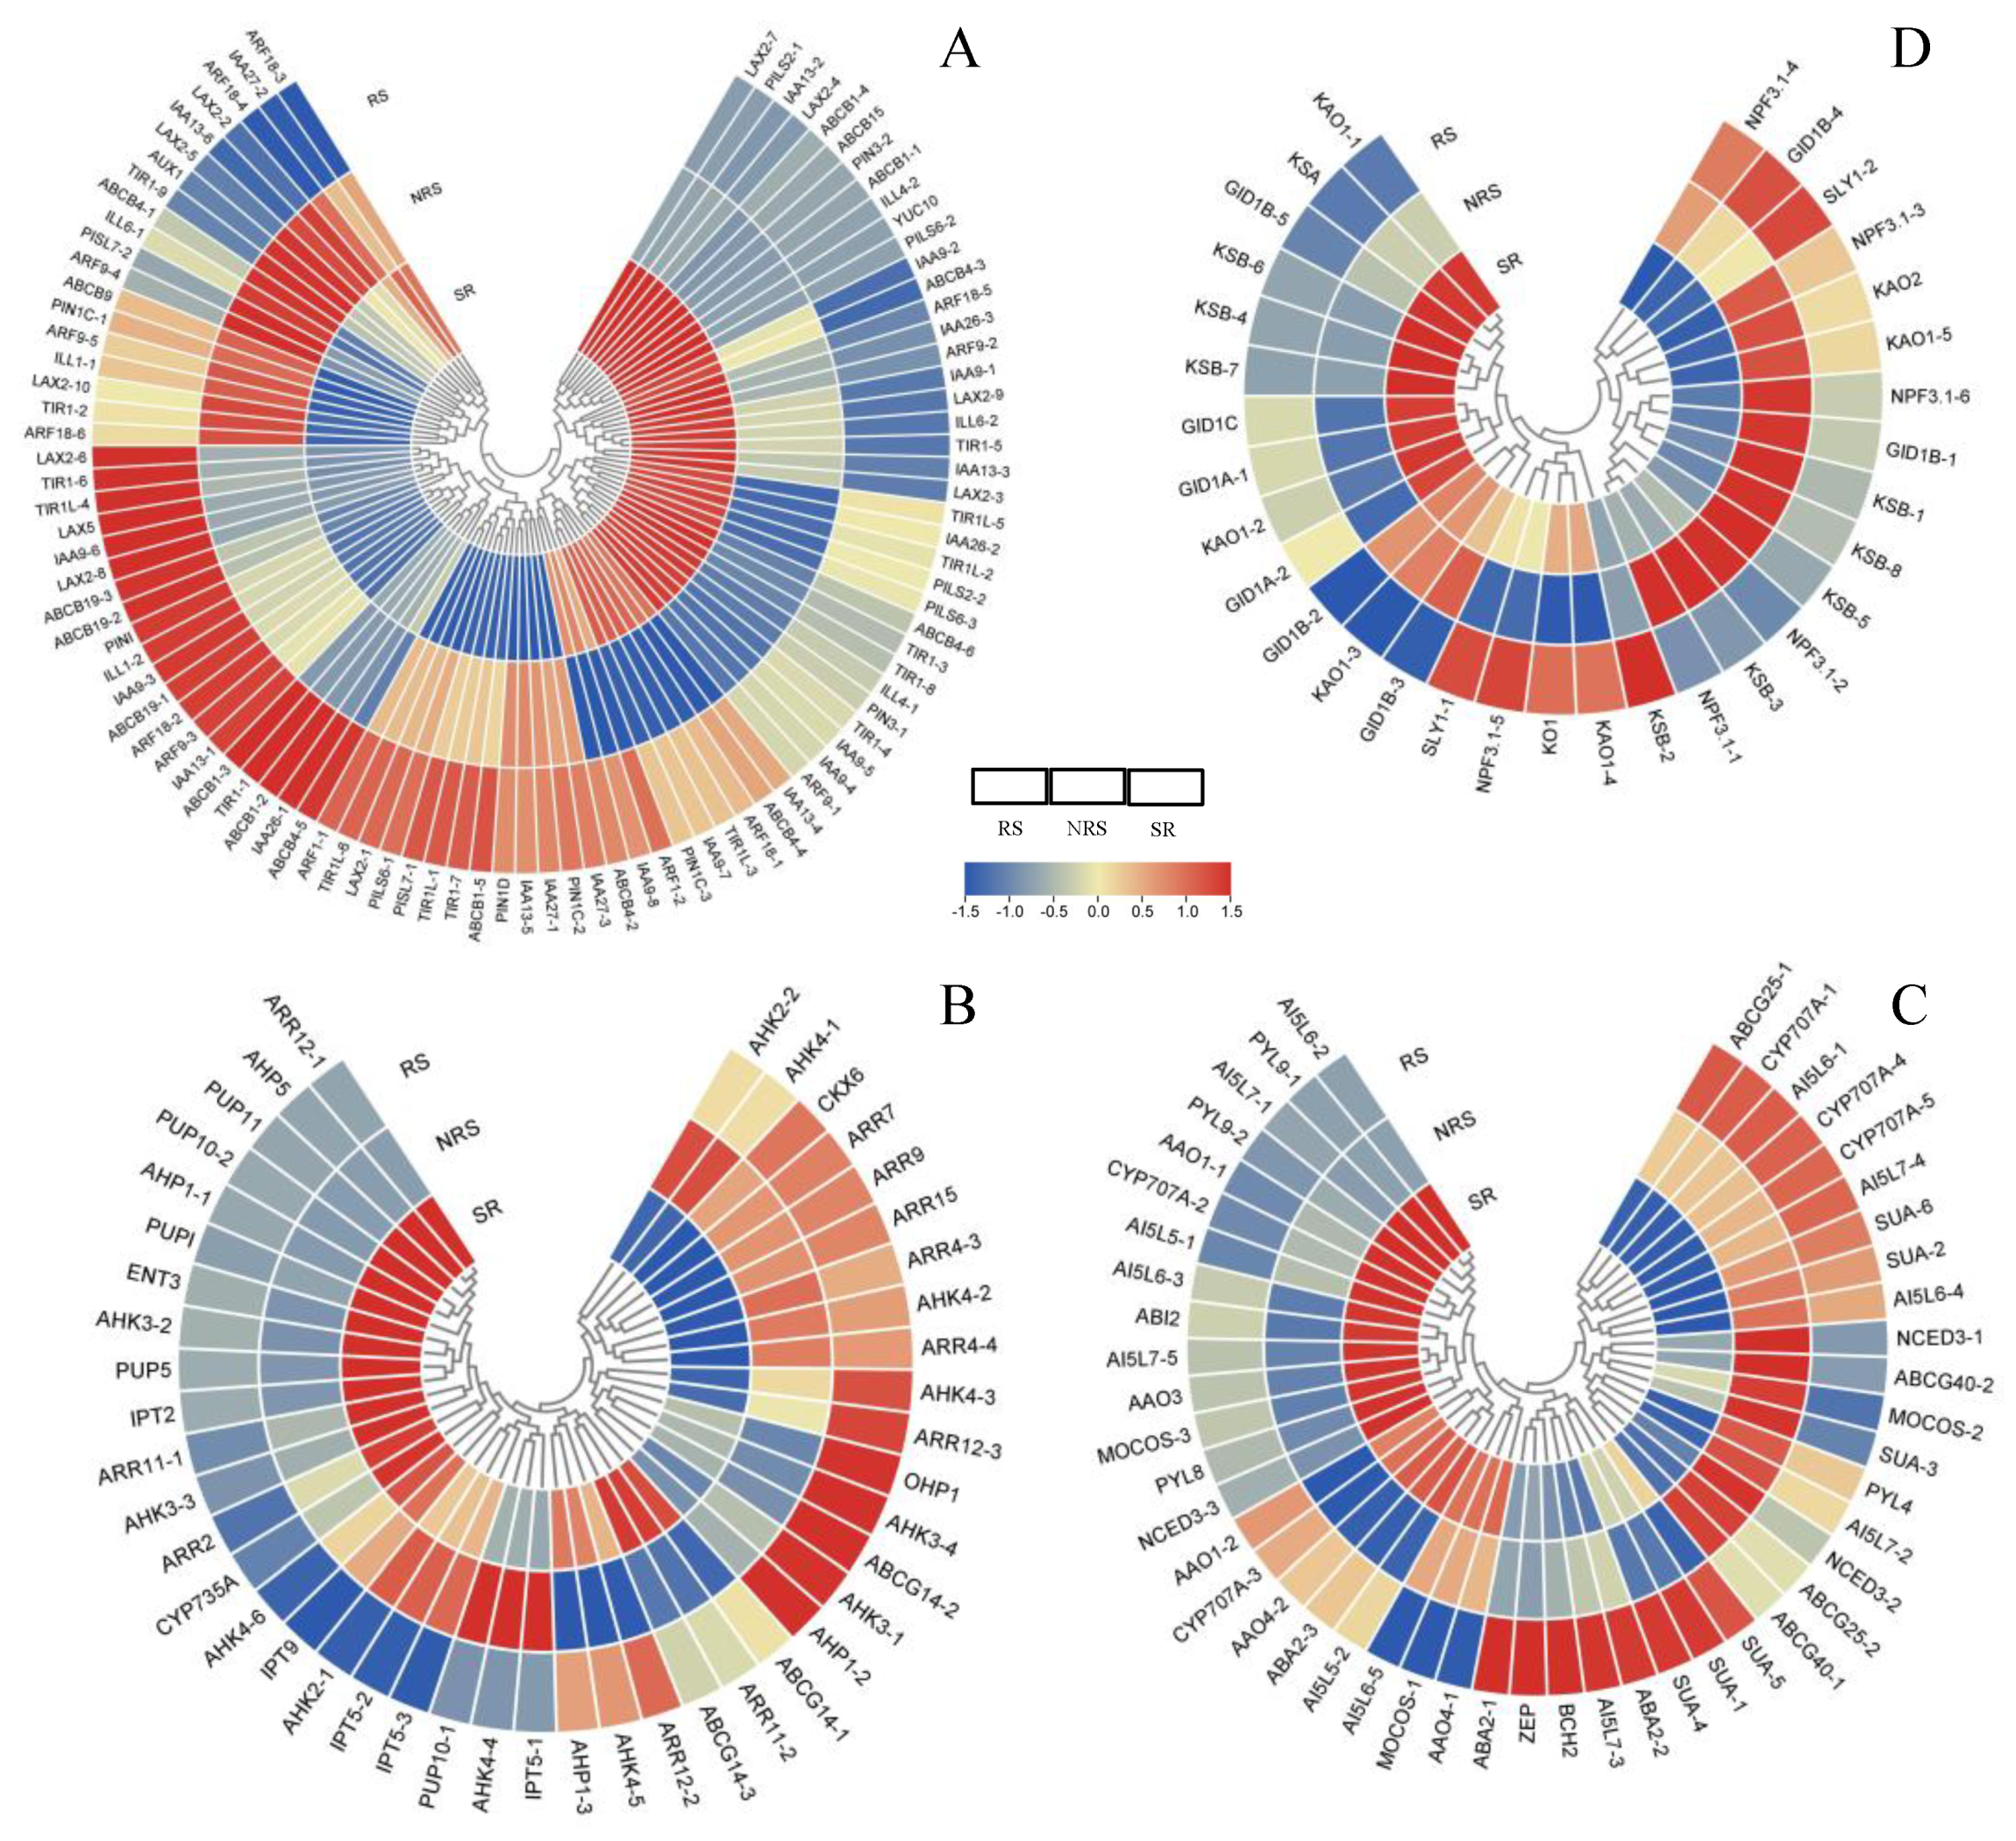
3.6. Hormone Pathways in Response to Root Sprouts

Plant endogenous hormones play crucial roles in regulating responses to environmental disturbances, which are essential for the regeneration of adventitious buds. Here, KEGG enrichment analysis indicated that several DEGs were involved in the RS, NRS, and SR. We performed an analysis of the synthesis, catabolism, transport, and signal transduction pathways of auxins, cytokinins, gibberellins, and abscisic acid, and their relation to the expression levels of all unigenes (include gene name number respective different transcript) in RS, NRS, and SR (Table S5). Regarding auxins, YUC10 (TF_R_46066/f3p0/1343) involved in synthesis, and ABCB19 (TF_R_2833/f7p0/4366, TF_R_3023/f3p0/4317, TF_R_13738/f2p0/3119) involved in transport, exhibited increased expression levels in SR (Figure 3A). In terms of cytokinins, IPT2 (TF_R_42128/f3p0/1635) and CYP735A (TF_R_38470/f5p0/1801) involved in synthesis, and ABCG14 (TF_R_24655/f3p0/2462) involved in transport, showed increased expression levels in SR (Figure 3B). As to abscisic acid, CYP707A (TF_R_33847/f4p0/2012, TF_R_37948/f7p0/1822) participated in catabolism, BCH2 (TF_R_46090/f4p0/1423), ZEP (TF_R_46090/f4p0/1423), and ABA2 (TF_R_20783/f2p0/2679, TF_R_27357/f3p0/2331) involved in synthesis, exhibited increased expression levels in RS (Figure 3C). For gibberellins, KBS (TF_R_13414/f3p0/3151) involved in synthesis, and NPF3.1 (TF_R_38269/f3p0/1800) involved in transport, showed increased expression levels in RS (Figure 3D). Interestingly, the significant differences in the synthesis and degradation of the three major root hormones were mainly reflected in the transport pathway genes, with ABCB19 being significantly upregulated in relation to auxins, and ABCG14 being significantly upregulated in relation to cytokinins. According to our previous studies, we therefore hypothesized that the accumulation of auxin and cytokinin in the RS group might be associated with long-distance hormone transport.

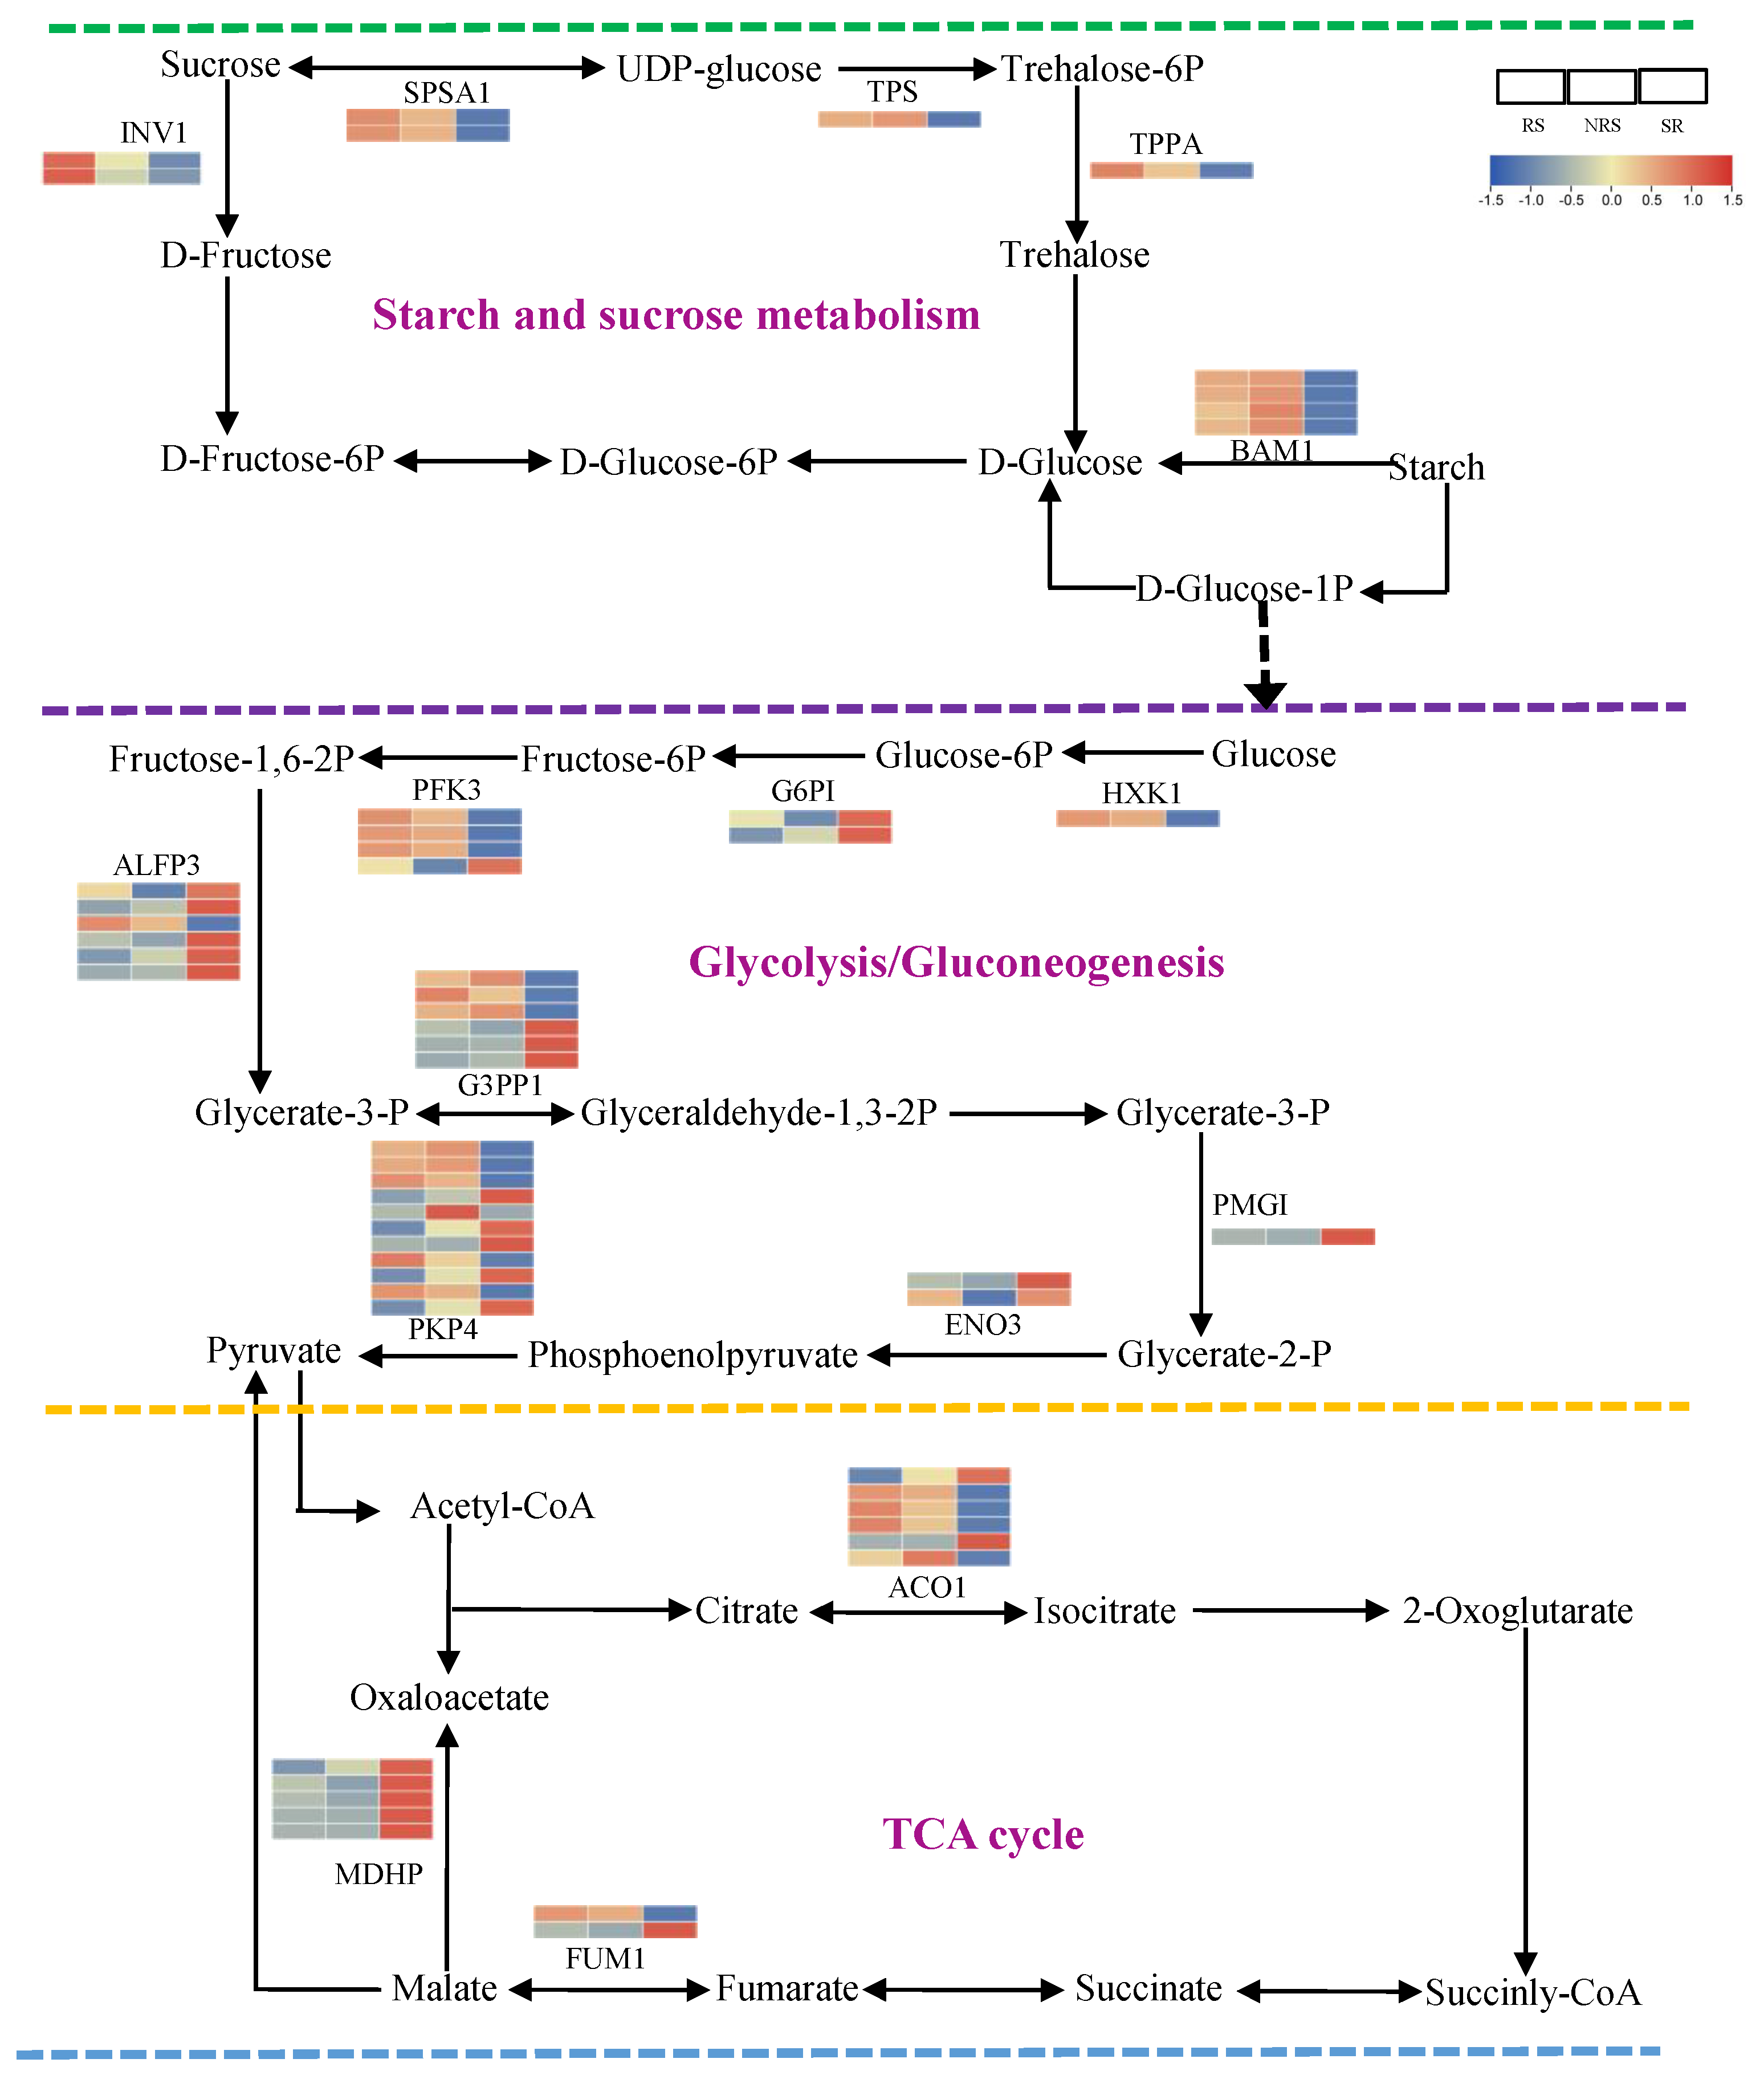
3.7. Nonstructural Carbohydrate Metabolism in Response to Root Sprouts

The KEGG enrichment analysis indicated that many of the DEGs with RS, NRS, and SR were associated with glycolysis/gluconeogenesis, citrate cycle, and starch and sucrose metabolism. The expression of genes with respect to non-structural carbohydrate metabolism was significantly different in aboveground roots, particularly in soluble sugars. The related genes included: (i) in the glycolysis/gluconeogenesis pathway: hexokinase (HKX1), glucose-6-phosphate isomerase (G3PP1), 6-phosphofructokinase 1 (PFK3), fructose-bisphosphate aldolase, class I (AFLP3), glyceraldehyde 3-phosphate dehydrogenase (G3PP1), 2,3-bisphosphoglycerate-independent phosphoglycerate mutase (PMGI), enolase (ENO3), and pyruvate kinase (PKP4); (ii) in the citrate cycle: aconitate hydratase (ACON), fumarate hydratase (FUM1), and malate dehydrogenase MDH2 (MDPH); and (iii) in starch and sucrose metabolism: beta-amylase 1 (BAM1), alpha, alpha-trehalose-phosphate synthase (TPS9), sucrose-phosphate synthase 1 (SPSA1), beta-fructofuranosidase (INV1), and trehalose-phosphate phosphatase A (TPPA) (Table S6, Figure 4).

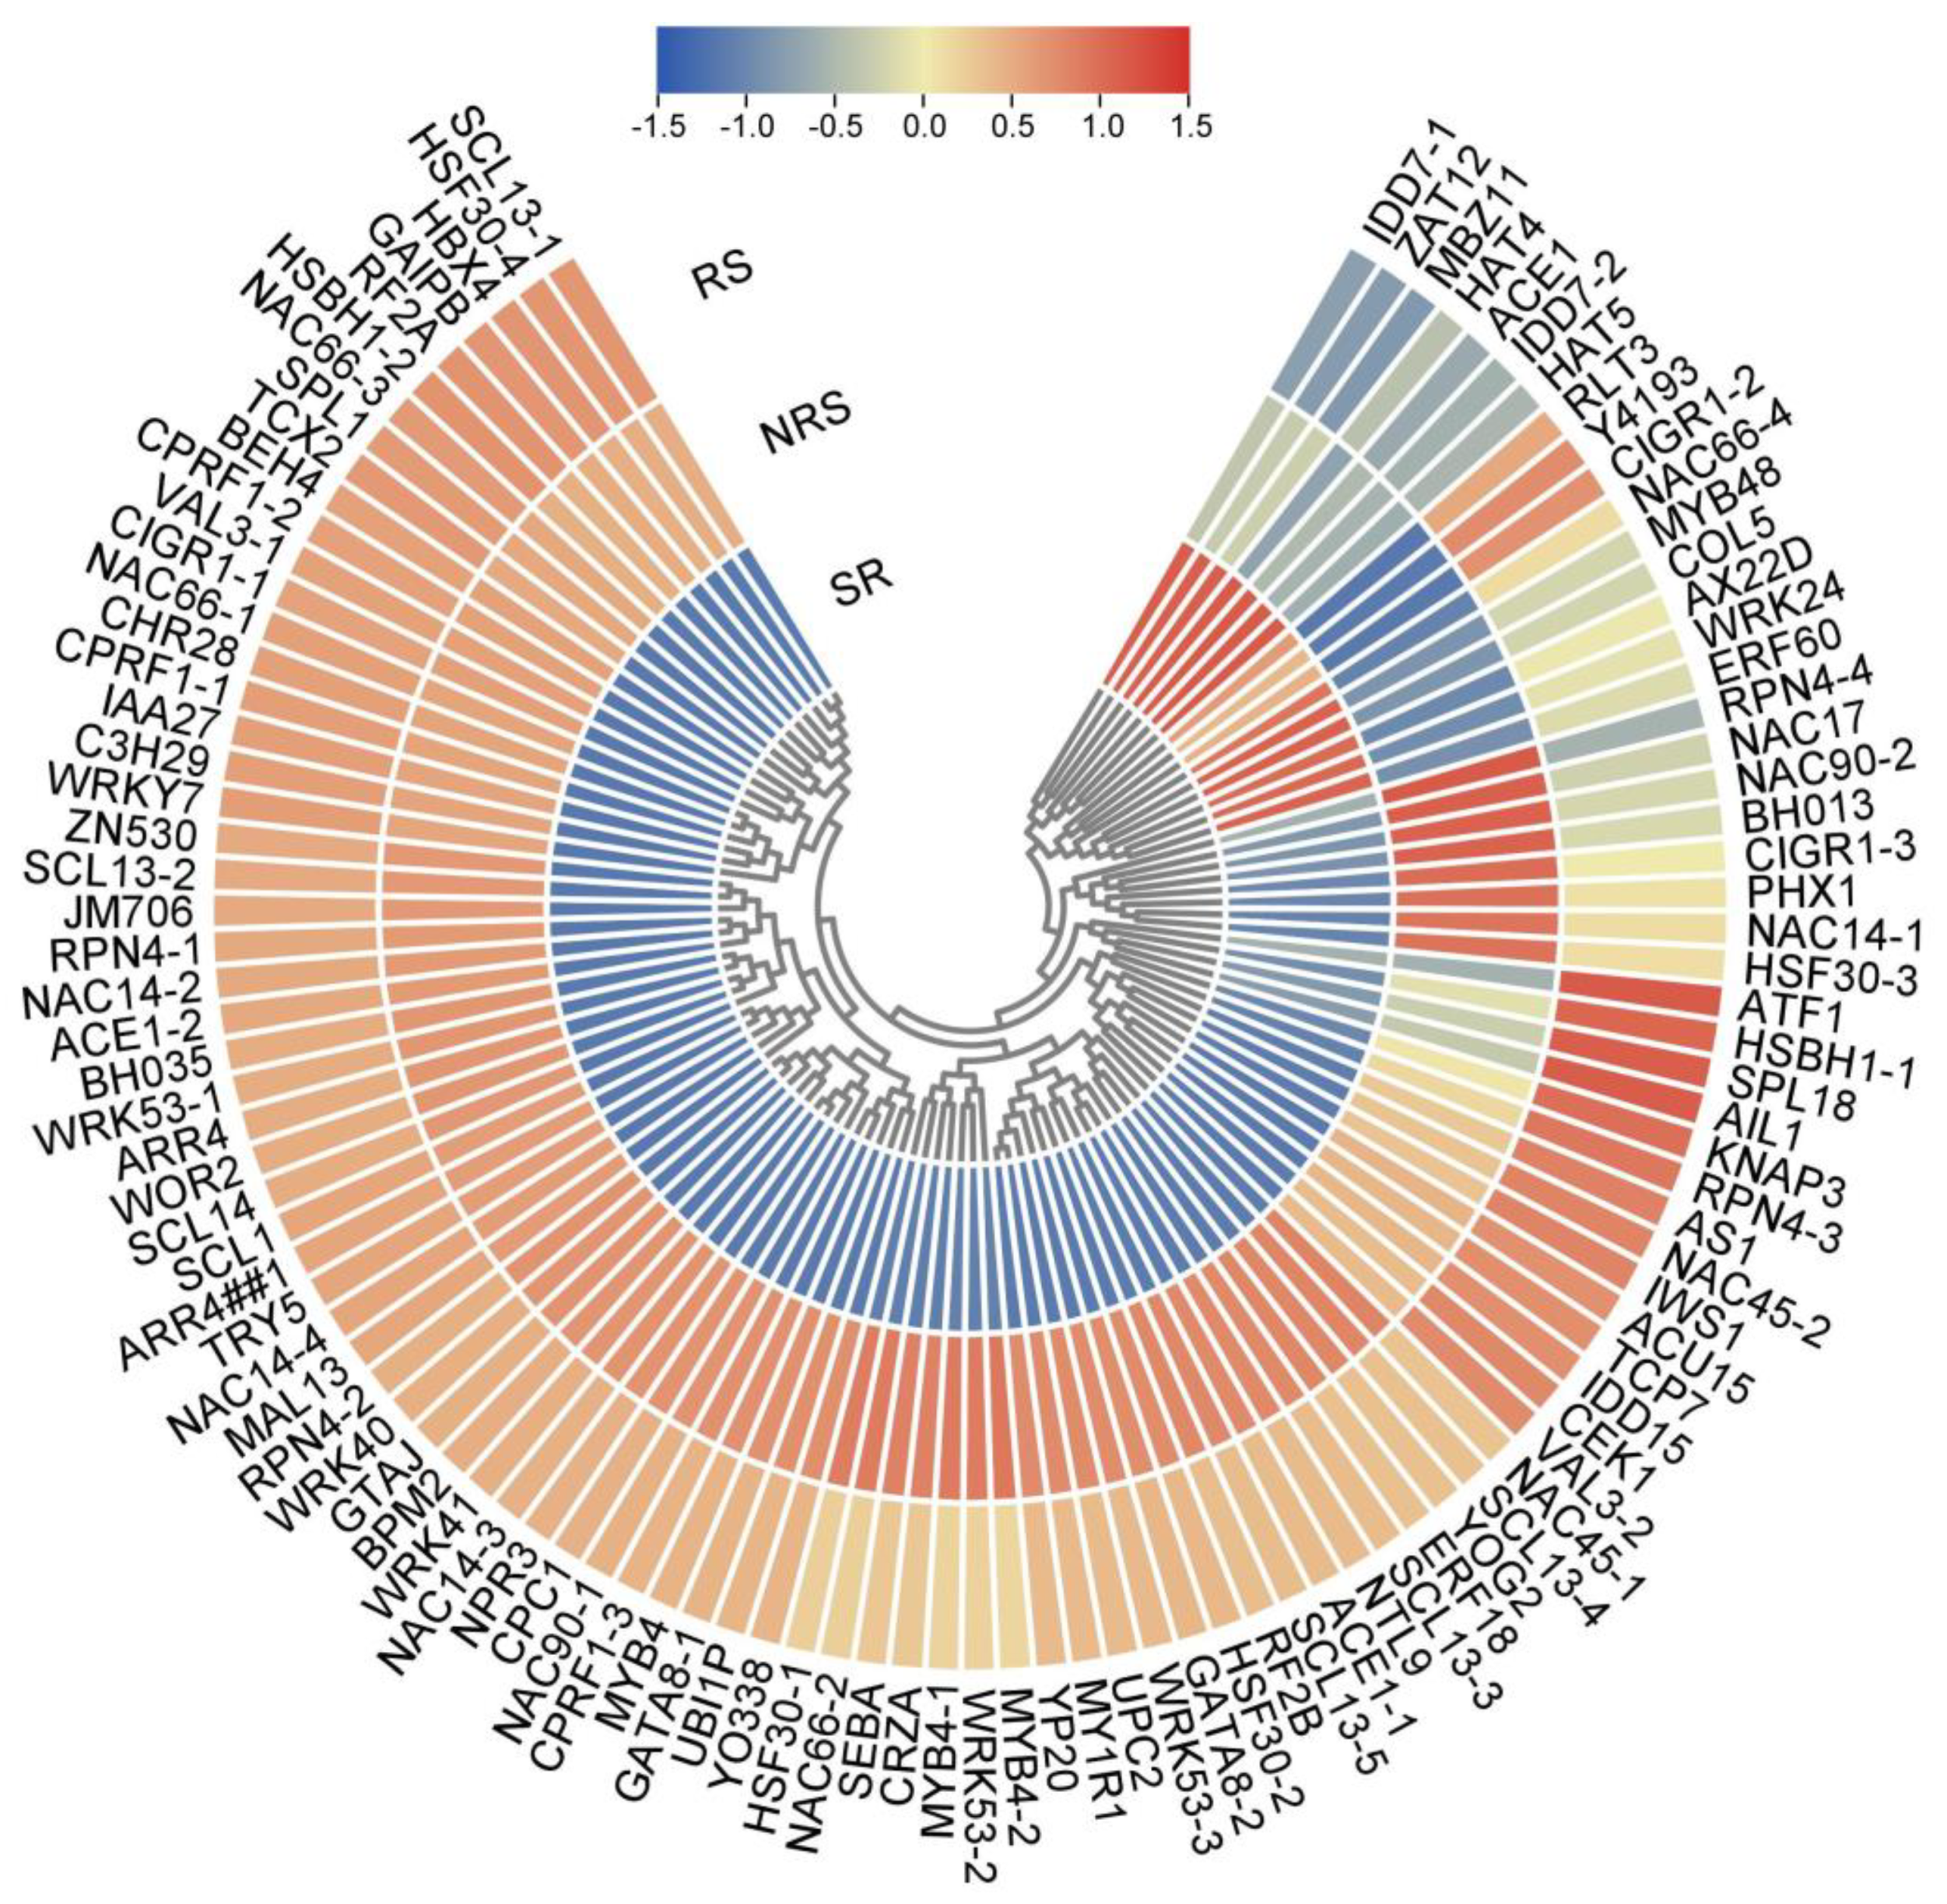
3.8. Transcription Factors of DEGs Involved in Root Sprouts

The prediction of transcription factors generated 2863 transcription factors from 88 families by iTAK. Of these, we found 109 transcription factors in 31 families displaying expression level differences in RS, NRS and SR. Except for WRKY 7 (TF_R_41626/f4p0/1561), NAC17 (TF_R_31200/f4p0/2129), MYB48 (TF_R_47522/f2p0/1329), HAT4 (TF_R_45686/f3p0/1445), RPN4 (TF_R_10123/f20p0/3395), IDD (TF_R_20202/f4p0/2711, TF_R_26699/f5p0/2350), ACE1 (TF_R_14217/f6p0/3058), HAT5 (TF_R_44442/f2p0/1421), COL5 (TF_R_44417/f4p0/1528), MBZ11 (TF_R_28182/f3p0/2245), AX22D (TF_R_50263/f8p0/1050), ERF60 (TF_R_35954/f2p0/1915), the other 103 genes encoding transcription factors were increased in RS and NRS. Compared to NRS or SR, SPL18 (TF_R_19586/f2p0/2758), NAC14 (TF_R_27061/f12p0/2295), AS1 (TF_R_43744/f3p0/1553), IWS1 (TF_R_19799/f2p0/2739), HSF30 (TF_R_30960/f3p0/2157), KNAP3 (TF_R_28335/f13p0/2221), HSBH1 (TF_R_34172/f3p0/2001), RPN4 (TF_R_11256/f2p0/3319), CPRF1 (TF_R_33104/f8p0/1965), VAL3 (TF_R_3966/f2p0/4134), AIL1(TF_R_28798/f3p0/2247) had increased significantly (Figure 5, Table S7). Indeed, OsSPL18 was regulated by miR529a to control plant height and tiller number in rice [50].

3.9. Validation by qRT-PCR

Based on the annotation of DEGs, twenty DEGs were selected for qRT-PCR analysis to verify the reliability of the RNA-seq data. Firstly, the expressions of these DEGs in RSs, NRSs, and SRs were analyzed using qRT-PCR. The expression patterns of the DEGs obtained from both RNA-seq and qRT-PCR methods displayed similar trends (Figure S5), indicating that the RNA-seq profiles were accurate and credible. However, there were slight differences in the expression levels of five genes (i.e., ABBC2-1, CISIN1, ARR12, SIZ1, and ABCB18).

4. Discussion

4.1. The Phenomenon and Characteristics of Root Sprouting

In this study, we discovered that the root buds of T. fargesii were exclusively found on aboveground roots while they were barely observed on underground roots compared to other species, such as Populus tremuloides Michx [26], Sassafras albidum [3], Emmenopterys henryi [4], and Aspidosperma spp. [5], where root buds were both found on the underground roots. The occurrence of root buds on underground roots is likely attributed to the higher level of disturbance in the aboveground environment, which serves as a critical cue for root bud formation [19]. Our investigation into the origin of root buds revealed that the root sprouts originated from the cork cambiums of the pericarp and were then connected to the vascular tissue of the mother root. This indicates that the natural root buds belong to the category of additional buds rather than repetitive buds, suggesting an endogenous mechanism of bud generation [3,5]. These root buds are not formed in response to physical injury, dieback, or perception [20,51].
The cues driving root sprouting involve the regulation of plant endogenous hormones, particularly auxin and cytokinin. These hormones play essential roles in determining the formation of root buds. Nonetheless, the precise mechanisms by which these hormones are enriched at the site of root bud formation and how they respond to environmental disturbances remain unclear. In the natural environment state, the roots of a mother tree rarely produce root sprouts unless there is a disturbance. However, adventitious buds emerge on roots that extend above the soil owing to obstacles, such as stones or rain runoff. Once the buds are formed, some of them encounter a period of dormancy, while others continue to elongate and develop into new sprouts, known as ramets.

4.2. The Regulation Underlying Root Sprouting in T. fargesii

Numerous external environmental factors can influence root bud development, including hormones, carbohydrates, light, soil moisture, temperature, nutrient availability, root injury/severance, microbial interactions, competition with other vegetation, pre-disturbance stand conditions, and genetic variations [27]. Plant hormones are perceived as the primary determinants for root bud establishment [22,26,28]. Auxin influx and efflux mediate the polar auxin transport to establish the differential distribution of auxin across various tissues, and the perception and signaling of auxin can regulate many aspects of plant development [52]. Notably, the ratio of cytokinins to auxins is crucial for organ regeneration, with a higher ratio promoting shoot regeneration from a cultured callus. In our study, we examined the levels of ZR, IAA, ABA, and GA3 in the three types of root samples. The results demonstrated significantly higher levels of ZR and IAA in RS and NRS compared to SR. These findings suggest that environmental factors influence the accumulation of ZR in aboveground roots, which may be a key factor contributing to the occurrence of root buds in T. fargesii. Furthermore, we investigated the synthesis, metabolism, and signaling pathways of auxins and cytokinins in the three different root tissue samples. In the auxin synthesis pathway, YUCCA10, which regulates the development of flower organs and seeds was found. Moreover, comparative analysis showed that the expression of ABCB1 and ABCB19 was only upregulated in RS vs. SR. ABCB1 and ABCB19 primarily localized to polar cells, with partial apical localization [53,54]. ABCBs play a key role in long-distance auxin transport, and ABCB1 and ABCB19 facilitate the transport of auxin produced by aboveground stems, leaves, and other tissues to the roots [55,56,57]. In addition, the activity of the MdABCB19 promoter is higher in light conditions compared to dark, indicating that MdABCB19 may be involved in auxin transport under light conditions [58].We speculated that the accumulation of auxin in root sprout might be attributed to polar auxin transport [22]. Additionally, we observed the presence of PTR6 in NRS vs. SR and high expression of PTR1 in RSs vs. SRs, suggesting that the accumulation of auxin in NRS and RSs might depend on PTR. Several studies also demonstrate that NRT contributes to auxin influx in plant tissues and cells [59,60].
Compared with the three types of roots, we found no significant differences in the levels of GA3 and ABA between NRS and SR. However, in RS, the concentrations of GA3 and ABA were significantly different. This suggested that the environment possibly was a predominant cue contributing to the significantly higher concentrations of GA3 and ABA. Generally, bioactive GAs is found in actively growing organs, such as expanding internodes and developing flowers [61,62]. ABA is a crucial hormone for plants to respond to abiotic stress. When plants experience stress due to cues such as drought, low temperature, or high salt concentrations, ABA can rapidly accumulate to improve plants stress resistance. Moreover, the concentration of ABA decreases when the stress is relieved [63,64]. In this study, the expression of CYP707A1 was significantly higher in RS compared to SR. CYP707A1 is involved in the oxidative degradation of abscisic acid and plays a vital role in determining ABA levels in dry seeds and controlling post-germination growth. The results indicated that as the ABA level increases, the tissue is also accelerating the degradation of ABA. In addition to that, CYP707A4 showed a significant increase in NRS compared to SR. Regarding the GA signaling pathway, DELLA was not expressed in SRs, suggesting that the GA pathway was activated in aboveground roots. In addition, the DELLA protein is a crucial factor in the GA signaling pathway. Its main function is to facilitate the recognition of the substrate DELLA protein by the SCF-E3-ubiquitin ligase complex, with the assistance of the receptor GID1 (GIB-BERELLIN-INSENSITIVE DWARF1) and F-box protein. This leads to the ubiquitination and subsequent degradation of DELLA protein mediated by the 26S proteasome, thereby releasing the inhibited GA effect, and promoting plant growth.
Carbohydrates are vital energy sources and carbon reservoirs for plant growth and metabolism. Apart from plant hormones, non-structural carbohydrates (NSC) are also crucial for the formation of adventitious buds. Research conducted in fire ecosystems has revealed that plants that regenerate from roots have higher NSC levels compared to plants that seldom regenerate from roots [29,30,31]. The findings indicated that there was no significant difference in NSC content between RS and SR, but the soluble sugar content decreased significantly in RS than SR. Starch levels initially showed a slight increase and then decreased in the SR, NRS and RS samples. This observation may be attributed to the suspicion that the exposed roots underwent photosynthesis, resulting in the production of sugars. As a result of continuous growth and cell division in root buds, a portion of the old starch from the parent root and the carbohydrates produced through photosynthesis was consumed. This suggested that the generation of root buds consumes more soluble sugars, implying that root respiration prioritizes the use of newly synthesized carbon sources before utilizing stored carbon sources [65]. Remarkably, we discovered that SR had a higher gene expression related to carbon energy metabolism than RS. For instance, the expression of genes such as pckA, maeB, ACSS, PYK, GAPDH, gapA, ACSS, PK, and TCA cycle in pyruvate metabolism were upregulated, whereas only the expression of ALDH in glycolysis/gluconeogenesis was downregulated. These findings indicated that aboveground roots exhibited higher energy metabolism and respiratory utilization. We hypothesized that the occurrence of root buds near the surface might be advantageous for efficient root respiration, possibly due to the availability of sufficient oxygen in that region [4,5,18].
Disturbance plays a critical role in root sprouting. Our study therefore focused on how environmental disturbances such as water stress, light, and microbial activity affect the growth of aboveground roots. First, we particularly investigated the response of MSL (mechanosensitive channel of small conductance-like) proteins to these disturbances. MSL proteins are non-selective ion channels that are activated by membrane tension to regulate osmotic balance during hypoosmolality in organelles, as well as hydration and germination in pollen. They also act a role in close responses in roots and cell swelling [66,67,68]. In our study, we detected a significant increase in the expression of MSL6 in RS. The average FPKM for MSL6 was 11.54 in RS, whereas it was 2.21 in SR. These results implied that the development of exposed roots and buds in RS might be affected by water regulation. Second, in addition to water stress, the presence of pathogenic microorganisms in the environment also displayed a significant impact on root stress. Plant resistance against these pathogens is facilitated by two major components: PAMP-triggered immunity and effector-triggered immunity. In this study, we compared the immune responses in root tissues of RS, NRS, and SRs and found that the genes giving rise to immune mechanisms showed high expression levels in exposed root tissues, including FLS2, CIPK9, MLO, MLO8, CB60A, FRL3, TAO1, CNGC4, LRK10, NHL10, SPL1, and SPL18. In contrast, their expression levels were low in SR and also indicated that the immune defense mechanism in exposed roots was significantly activated in response to the presence of pathogenic microorganisms (Table S8). However, the expression level of CIPK7 in SRs was higher compared to RS, suggesting a potentially different immune response pattern in these roots. Third, plant–pathogen interactions can induce the clustering of buds, as observed in cases such as Paulownia Witches’ broom (PaWB) [69], Jujube witches’ broom [70], and Melia witches’ broom [71]. Genome sequencing of PaWB phytoplasma, combined with functional analysis, demonstrates that the effector PaWB-SAP54 directly interacts with PfSPLa, and the interaction leads to the ubiquitin-mediated degradation of PfSPLa, resulting in witches’ broom formation [69]. In rice, miRNA156/529-SPLs-NL1-PLA1 module regulation is necessary for the transition from vegetative branches to reproductive branches [72]. Here, the significant expression of SPL1 and SPL18 was upregulated in aboveground roots, implying the control of root bud development in response to environmental factors, and further study is needed in the future. Recent studies have shown that a basal level of reactive oxygen species (ROS) is essential for cellular proliferation and differentiation [73,74]. The induction of somatic embryogenesis by H2O2 treatment implies the involvement of ROS regulation in this process [75]. Furthermore, the comparison of RS vs. SR of DEGs revealed significant differences in genes related to plant pathogen interaction. In NRS vs. SR, the upregulation of CNGC, CDPK, and RbOH indicated that exogenous microorganisms in environment might trigger increased ROS production in plants.

5. Conclusions

Root sprouting can be triggered by a low ratio of auxin to cytokinin. However, the morphology, physiology, and genetics underlying the production of root buds in response to environmental disturbances have remained unclear. This study aimed to primarily investigate this phenomenon by combining phytohormones, NSC, and transcriptome profiles in three different states of roots, namely RS, NRS, and soil roots. Our findings suggested that the root sprouting parts exhibited relatively higher levels of IAA, ZR, ABA, and an increased ratio of ZR:IAA in RS. Hence, we inferred that the accumulation of ZR and IAA in roots might be attributed to long-distance transport mechanisms. Furthermore, improved environmental conditions, such as enhanced root respiration and glucose metabolism due to water stress, might contribute to increased activity in root tissues. Accordingly, these pathways were analyzed, and candidate DEGs were obtained, such as ABCB19, ABCG14, SPL18, NAC14 and so forth. In summary, these findings provided a few novel insights into the genetics behind the root sprouting phenomenon.

Supplementary Materials

The following supporting information can be downloaded at: https://www.mdpi.com/article/10.3390/f15020335/s1, Figure S1: Morphology and root sprouting regeneration process of T. fargesii. (A) Large-diameter timber morphology in Jiulianshan nature reserve natural forest. The growth period of new leaves in spring (March). (B) Formation of root buds on aboveground root. (C) Root sprouting seedling. (D) The ramets is connected by the mother root in root sprouts forest. The yellow circular dotted line shows the root buds; the red dotted line shows the seedlings or ramet; the black dotted line shows the mother root; The yellow dotted line shows the lateral roots with ramets; Figure S2: The mother roots (lateral roots) diameter and soil location of root bud formation was investigated in the natural secondary forest of T. fargesii to April. (A) Number of root buds with different mother root diameter; (B) Number of roots buds between aboveground roots and underground roots; Figure S3: The venn diagram of DEGs between RS, NRS and SR; KEGG pathway enrichment of the annotated DEGs. a, RSs vs NRSs. b, NRSs vs SRs. c, RSs vs SRs. The Y-axis indicates the KEGG pathway, the X-axis indicates the rich factor; Figure S4: The dot size indicates the number of DEGs of the pathway, and the dot color indicates the q-value; Figure S5: Heat map diagram showing changes in gene expression obtained by RNA-seq versus RT-qPCR analysis. Each column represents a root status (RS, NRS, and SR). The FPKM value of RNA-seq and gene relative normalized expression value of RT-qPCR is designated as log2 which is the average of three biological replicates. Red color indicated up-regulated genes and blue color indicates down-regulated genes as compared to control; Table S1: The primers of qRT-PCR; Table S2: Summary of Illumina RNA transcript sequencing data; Table S3: Summary of Pacbio RNA transcript sequencing data; Table S4: 12sample mapped with Pacbio unigenes; Table S5: Hormone pathway response relation unigenes; Table S6: Nonstructural carbohydrate metabolism relation unigenes; Table S7: Tran-scription factors of DEGs; Table S8: DEGs of RSs, NRSs and SRs that involved in Plant-microorganisms interactions.

Author Contributions

L.Z. supervised the manuscript; Q.C. and J.M. conceived and designed the experiments; Q.C. conducted most of the experiments; W.Y. and T.J. participated in the determination of hormones; Q.Z. performed the validation of qRT-PCR experiment; Q.C. wrote the original draft; J.M., C.G. and W.Y. reviewed and edited the manuscript; L.Z. and J.M. got the fundings acquisition. All authors have read and agreed to the published version of the manuscript.

Funding

This work was supported by the National Natural Science Foundation of China (31860202, 32101515) and Jiangxi Provincial Department of Education in Science and Technology project (GJJ200447). The funders had no role in the design of the study and collection, analysis, and interpretation of data and in writing the manuscript.

Data Availability Statement

The transcriptomic data of CRA014747 was available at https://ngdc.cncb.ac.cn/gsub/submit/biosample (accessed on 28 December 2023).

Conflicts of Interest

The authors declare that they have no known competing financial interests or personal relationships that could have appeared to influence the work reported in this paper.

References

  1. Olsthoorn, A.; Keltjens, W.; Van Baren, B.; Hopman, M. Influence of ammonium on fine root development and rhizosphere pH of Douglas-fir seedlings in sand. Plant Soil 1991, 133, 75–81. [Google Scholar] [CrossRef]
  2. Schier, G.A. Seasonal variation in sucker production from excised roots of Populus tremuloides and the role of endogenous auxin. Can. J. For. Res. 1973, 3, 459–461. [Google Scholar] [CrossRef]
  3. Bosela, M.J.; Ewers, F.W. The mode of origin of root buds and root sprouts in the clonal tree Sassafras albidum (Lauraceae). Am. J. Bot. 1997, 84, 1466–1481. [Google Scholar] [CrossRef] [PubMed]
  4. Guo, L.; Shao, X.; Xue, P.; Tian, Y.; Xiao, Z.; Wu, Y. Root sprouting ability and growth dynamics of the rootsuckers of Emmenopterys henryi, a rare and endangered plant endemic to China. For. Ecol. Manag. 2017, 389, 35–45. [Google Scholar] [CrossRef]
  5. Kataoka, E.Y.; Alves, D.M.; Koch, I.; Souto, L.S. Are there buds in the roots of Aspidosperma spp. (Apocynaceae)? A comparative morphoanatomical study of underground organs. Flora 2019, 256, 92–99. [Google Scholar] [CrossRef]
  6. Poorter, L.; Kitajima, K.; Mercado, P.; CHUBIna, J.; Melgar, I.; Prins, H.H. Resprouting as a persistence strategy of tropical forest trees: Relations with carbohydrate storage and shade tolerance. Ecology 2010, 91, 2613–2627. [Google Scholar] [CrossRef] [PubMed]
  7. Nano, C.E.; Clarke, P.J. How do drought and fire influence the patterns of resprouting in Australian deserts? Plant Ecol. 2011, 212, 2095–2110. [Google Scholar] [CrossRef]
  8. Dietze, M.C.; Clark, J.S. Changing the gap dynamics paradigm: Vegetative regeneration control on forest response to disturbance. Ecol. Monogr. 2008, 78, 331–347. [Google Scholar] [CrossRef]
  9. Keeley, J.E.; Bond, W.J.; Bradstock, R.A.; Pausas, J.G.; Rundel, P.W. Fire in Mediterranean Ecosystems: Ecology, Evolution and Management; Cambridge University Press: Cambridge, UK, 2011. [Google Scholar]
  10. Lawes, M.J.; Adie, H.; Russell-Smith, J.; Murphy, B.; Midgley, J.J. How do small savanna trees avoid stem mortality by fire? The roles of stem diameter, height and bark thickness. Ecosphere 2011, 2, 1–13. [Google Scholar] [CrossRef]
  11. Midgley, J.; Cowling, R. Regeneration patterns in Cape subtropical transitional thicket; where are all the seedlings? S. Afr. J. Bot. 1993, 59, 496–499. [Google Scholar]
  12. Bellingham, P.J.; Sparrow, A.D. Multi-stemmed trees in montane rain forests: Their frequency and demography in relation to elevation, soil nutrients and disturbance. J. Ecol. 2009, 97, 472–483. [Google Scholar] [CrossRef]
  13. Klimešová, J.; Martínková, J. Intermediate growth forms as a model for the study of plant clonality functioning: An example with root sprouters. Evol. Ecol. 2004, 18, 669–681. [Google Scholar] [CrossRef]
  14. Klimešová, J.; Klimeš, L. Resprouting of herbs in disturbed habitats: Is it adequately described by Bellingham-Sparrow’s model? Oikos 2003, 103, 225–229. [Google Scholar] [CrossRef]
  15. Bartušková, A.; Malíková, L.; Klimešová, J. Checklist of root-sprouters in the Czech flora: Mapping the gaps in our knowledge. Folia Geobot. 2017, 52, 337–343. [Google Scholar] [CrossRef]
  16. Clarke, P.J.; Lawes, M.; Midgley, J.J.; Lamont, B.; Ojeda, F.; Burrows, G.; Enright, N.; Knox, K. Resprouting as a key functional trait: How buds, protection and resources drive persistence after fire. New Phytol. 2013, 197, 19–35. [Google Scholar] [CrossRef]
  17. De Moraes, M.G.; de Carvalho, M.A.M.; Franco, A.C.; Pollock, C.J.; Figueiredo-Ribeiro, R.d.C.L. Fire and drought: Soluble carbohydrate storage and survival mechanisms in herbaceous plants from the Cerrado. Bioscience 2016, 66, 107–117. [Google Scholar] [CrossRef]
  18. Pausas, J.G.; Lamont, B.B.; Paula, S.; Appezzato-da-Glória, B.; Fidelis, A. Unearthing belowground bud banks in fire-prone ecosystems. New Phytol. 2018, 217, 1435–1448. [Google Scholar] [CrossRef] [PubMed]
  19. Klimešová, J.; Herben, T.; Martínková, J. Disturbance is an important factor in the evolution and distribution of root-sprouting species. Evol. Ecol. 2017, 31, 387–399. [Google Scholar] [CrossRef]
  20. Hissae Hayashi, A.; Appezzato-da-Glória, B. Resprouting from roots in four Brazilian tree species. Rev. De Biol. Trop. 2009, 57, 789–800. [Google Scholar] [CrossRef] [PubMed]
  21. Cline, M.G. Apical dominance. Bot. Rev. 1991, 57, 318–358. [Google Scholar] [CrossRef]
  22. Wan, X.; Landhäusser, S.M.; Lieffers, V.J.; Zwiazek, J.J. Signals controlling root suckering and adventitious shoot formation in aspen (Populus tremuloides). Tree Physiol. 2006, 26, 681–687. [Google Scholar] [CrossRef] [PubMed]
  23. Eliasson, L. Growth regulators in Populus tremula IV. Apical dominance and suckering in young plants. Physiol. Plant. 1971, 25, 263–267. [Google Scholar] [CrossRef]
  24. Schier, G.A. Apical Dominance in Multishoot Cultures from Aspen Roots; Oxford University Press: Oxford, UK, 1972. [Google Scholar]
  25. Van Staden, J.; Davey, J. The synthesis, transport and metabolism of endogenous cytokinins. Plant Cell Environ. 1979, 2, 93–106. [Google Scholar] [CrossRef]
  26. Jean, S.A.; Pinno, B.D.; Nielsen, S.E. Trembling aspen root suckering and stump sprouting response to above ground disturbance on a reclaimed boreal oil sands site in Alberta, Canada. New For. 2019, 50, 771–784. [Google Scholar] [CrossRef]
  27. Frey, B.R.; Lieffers, V.J.; Landhäusser, S.M.; Comeau, P.G.; Greenway, K.J. An analysis of sucker regeneration of trembling aspen. Can. J. For. Res. 2003, 33, 1169–1179. [Google Scholar] [CrossRef]
  28. Li, W.; Zhai, L.; Strauss, S.H.; Yer, H.; Merewitz, E.; Chen, J.; Wang, X.; Zhuang, W.; Fang, C.; Chen, Y. Transgenic reduction of cytokinin levels in roots inhibits root-sprouting in Populus. Plant Physiol. 2019, 180, 1788–1792. [Google Scholar] [CrossRef] [PubMed]
  29. Bell, T.L.; Ojeda, F. Underground starch storage in Erica species of the Cape Floristic Region–differences between seeders and resprouters. New Phytol. 1999, 144, 143–152. [Google Scholar] [CrossRef]
  30. Bell, D.T. Ecological response syndromes in the flora of southwestern Western Australia: Fire resprouters versus reseeders. Bot. Rev. 2001, 67, 417–440. [Google Scholar] [CrossRef]
  31. Knox, K.; Clarke, P. Nutrient availability induces contrasting allocation and starch formation in resprouting and obligate seeding shrubs. Funct. Ecol. 2005, 19, 690–698. [Google Scholar] [CrossRef]
  32. Kushwah, S.; Laxmi, A. The interaction between glucose and cytokinin signaling in controlling Arabidopsis thaliana seedling root growth and development. Plant Signal. Behav. 2017, 12, e1312241. [Google Scholar] [CrossRef]
  33. Sakr, S.; Wang, M.; Dédaldéchamp, F.; Perez-Garcia, M.-D.; Ogé, L.; Hamama, L.; Atanassova, R. The sugar-signaling hub: Overview of regulators and interaction with the hormonal and metabolic network. Int. J. Mol. Sci. 2018, 19, 2506. [Google Scholar] [CrossRef] [PubMed]
  34. Kotov, A.A.; Kotova, L.M.; Romanov, G.A. Signaling network regulating plant branching: Recent advances and new challenges. Plant Sci. 2021, 307, 110880. [Google Scholar] [CrossRef] [PubMed]
  35. Wiley, E.; King, C.M.; Landhäusser, S.M. Identifying the relevant carbohydrate storage pools available for remobilization in aspen roots. Tree Physiol. 2019, 39, 1109–1120. [Google Scholar] [CrossRef]
  36. Yang, J.; Zhang, J.; Wang, Z.; Zhu, Q.; Wang, W. Hormonal changes in the grains of rice subjected to water stress during grain filling. Plant Physiol. 2001, 127, 315–323. [Google Scholar] [CrossRef]
  37. He, Z. Guidance to Experiment on Chemical Control in Crop Plants; Beijing Agricultural University Press: Beijing, China, 1993; pp. 60–68. [Google Scholar]
  38. Loewus, F.A. Improvement in anthrone method for determination of carbohydrates. Anal. Chem. 1952, 24, 219. [Google Scholar] [CrossRef]
  39. Salmela, L.; Rivals, E. LoRDEC: Accurate and efficient long read error correction. Bioinformatics 2014, 30, 3506–3514. [Google Scholar] [CrossRef] [PubMed]
  40. Fu, L.; Niu, B.; Zhu, Z.; Wu, S.; Li, W. CD-HIT: Accelerated for clustering the next-generation sequencing data. Bioinformatics 2012, 28, 3150–3152. [Google Scholar] [CrossRef]
  41. Zheng, Y.; Jiao, C.; Sun, H.; Rosli, H.G.; Pombo, M.A.; Zhang, P.; Banf, M.; Dai, X.; Martin, G.B.; Giovannoni, J.J. iTAK: A program for genome-wide prediction and classification of plant transcription factors, transcriptional regulators, and protein kinases. Mol. Plant 2016, 9, 1667–1670. [Google Scholar] [CrossRef]
  42. Sun, L.; Luo, H.; Bu, D.; Zhao, G.; Yu, K.; Zhang, C.; Liu, Y.; Chen, R.; Zhao, Y. Utilizing sequence intrinsic composition to classify protein-coding and long non-coding transcripts. Nucleic Acids Res. 2013, 41, e166. [Google Scholar] [CrossRef]
  43. Li, A.; Zhang, J.; Zhou, Z. PLEK: A tool for predicting long non-coding RNAs and messenger RNAs based on an improved k-mer scheme. BMC Bioinform. 2014, 15, 311. [Google Scholar] [CrossRef]
  44. Kang, Y.-J.; Yang, D.-C.; Kong, L.; Hou, M.; Meng, Y.-Q.; Wei, L.; Gao, G. CPC2: A fast and accurate coding potential calculator based on sequence intrinsic features. Nucleic Acids Res. 2017, 45, W12–W16. [Google Scholar] [CrossRef] [PubMed]
  45. Finn, R.D.; Coggill, P.; Eberhardt, R.Y.; Eddy, S.R.; Mistry, J.; Mitchell, A.L.; Potter, S.C.; Punta, M.; Qureshi, M.; Sangrador-Vegas, A. The Pfam protein families database: Towards a more sustainable future. Nucleic Acids Res. 2016, 44, D279–D285. [Google Scholar] [CrossRef] [PubMed]
  46. Love, M.I.; Huber, W.; Anders, S. Moderated estimation of fold change and dispersion for RNA-seq data with DESeq2. Genome Biol. 2014, 15, 550. [Google Scholar] [CrossRef] [PubMed]
  47. Wu, P.; Wang, M.; Zhang, T.; Tong, X.; Xiang, T. Mammalian CYP2E1 gene triggered changes of relative ions fluxes, CaM content and genes expression profiles in Petunia hybrida cells to enhance resistance to formaldehyde. Plant Cell Tissue Organ Cult. 2018, 135, 433–444. [Google Scholar] [CrossRef]
  48. Song, H.; Mao, W.; Duan, Z.; Que, Q.; Zhou, W.; Chen, X.; Li, P. Selection and validation of reference genes for measuring gene expression in Toona ciliata under different experimental conditions by quantitative real-time PCR analysis. BMC Plant Biol. 2020, 20, 450. [Google Scholar] [CrossRef] [PubMed]
  49. Schmittgen, T.D.; Livak, K.J. Analyzing real-time PCR data by the comparative CT method. Nat. Protoc. 2008, 3, 1101–1108. [Google Scholar] [CrossRef]
  50. Yan, Y.; Wei, M.; Li, Y.; Tao, H.; Wu, H.; Chen, Z.; Li, C.; Xu, J.-H. MiR529a controls plant height, tiller number, panicle architecture and grain size by regulating SPL target genes in rice (Oryza sativa L.). Plant Sci. 2021, 302, 110728. [Google Scholar] [CrossRef]
  51. Hayashi, A.; Penha, A.; Rodrigues, R.R.; Appezzato-da-Glória, B. Anatomical studies of shoot bud-forming roots of Brazilian tree species. Aust. J. Bot. 2001, 49, 745–751. [Google Scholar] [CrossRef]
  52. Kondhare, K.R.; Patil, A.B.; Giri, A.P. Auxin: An emerging regulator of tuber and storage root development. Plant Sci. 2021, 306, 110854. [Google Scholar] [CrossRef]
  53. Terasaka, K.; Blakeslee, J.J.; Titapiwatanakun, B.; Peer, W.A.; Bandyopadhyay, A.; Makam, S.N.; Lee, O.R.; Richards, E.L.; Murphy, A.S.; Sato, F. PGP4, an ATP binding cassette P-glycoprotein, catalyzes auxin transport in Arabidopsis thaliana roots. Plant Cell 2005, 17, 2922–2939. [Google Scholar] [CrossRef] [PubMed]
  54. Cho, M.; Lee, S.H.; Cho, H.-T. P-Glycoprotein4 displays auxin efflux transporter–like action in Arabidopsis root hair cells and tobacco cells. Plant Cell 2007, 19, 3930–3943. [Google Scholar] [CrossRef]
  55. Geisler, M.; Aryal, B.; Di Donato, M.; Hao, P. A critical view on ABC transporters and their interacting partners in auxin transport. Plant Cell Physiol. 2017, 58, 1601–1614. [Google Scholar] [CrossRef]
  56. Blakeslee, J.J.; Bandyopadhyay, A.; Lee, O.R.; Mravec, J.; Titapiwatanakun, B.; Sauer, M.; Makam, S.N.; Cheng, Y.; Bouchard, R.; Adamec, J. Interactions among PIN-FORMED and P-glycoprotein auxin transporters in Arabidopsis. Plant Cell 2007, 19, 131–147. [Google Scholar] [CrossRef]
  57. Bailly, A.; Sovero, V.; Vincenzetti, V.; Santelia, D.; Bartnik, D.; Koenig, B.W.; Mancuso, S.; Martinoia, E.; Geisler, M. Modulation of P-glycoproteins by auxin transport inhibitors is mediated by interaction with immunophilins. J. Biol. Chem. 2008, 283, 21817–21826. [Google Scholar] [CrossRef]
  58. Yang, H.; Murphy, A.S. Functional expression and characterization of Arabidopsis ABCB, AUX 1 and PIN auxin transporters in Schizosaccharomyces pombe. Plant J. 2009, 59, 179–191. [Google Scholar] [CrossRef] [PubMed]
  59. Krouk, G.; Lacombe, B.; Bielach, A.; Perrine-Walker, F.; Malinska, K.; Mounier, E.; Hoyerova, K.; Tillard, P.; Leon, S.; Ljung, K. Nitrate-regulated auxin transport by NRT1. 1 defines a mechanism for nutrient sensing in plants. Dev. Cell 2010, 18, 927–937. [Google Scholar] [CrossRef] [PubMed]
  60. Bouguyon, E.; Brun, F.; Meynard, D.; Kubeš, M.; Pervent, M.; Leran, S.; Lacombe, B.; Krouk, G.; Guiderdoni, E.; Zažímalová, E. Multiple mechanisms of nitrate sensing by Arabidopsis nitrate transceptor NRT1. 1. Nat. Plants 2015, 1, 15015. [Google Scholar] [CrossRef] [PubMed]
  61. Hu, J.; Mitchum, M.G.; Barnaby, N.; Ayele, B.T.; Ogawa, M.; Nam, E.; Lai, W.-C.; Hanada, A.; Alonso, J.M.; Ecker, J.R. Potential sites of bioactive gibberellin production during reproductive growth in Arabidopsis. Plant Cell 2008, 20, 320–336. [Google Scholar] [CrossRef] [PubMed]
  62. Silverstone, A.L.; Jung, H.-S.; Dill, A.; Kawaide, H.; Kamiya, Y.; Sun, T.-P. Repressing a repressor: Gibberellin-induced rapid reduction of the RGA protein in Arabidopsis. Plant Cell 2001, 13, 1555–1566. [Google Scholar] [CrossRef]
  63. Qin, F.; Shinozaki, K.; Yamaguchi-Shinozaki, K. Achievements and challenges in understanding plant abiotic stress responses and tolerance. Plant Cell Physiol. 2011, 52, 1569–1582. [Google Scholar] [CrossRef]
  64. Zeevaart, J.A. Changes in the levels of abscisic acid and its metabolites in excised leaf blades of Xanthium strumarium during and after water stress. Plant Physiol. 1980, 66, 672–678. [Google Scholar] [CrossRef] [PubMed]
  65. Dietze, M.C.; Sala, A.; Carbone, M.S.; Czimczik, C.I.; Mantooth, J.A.; Richardson, A.D.; Vargas, R. Nonstructural carbon in woody plants. Annu. Rev. Plant Biol. 2014, 65, 667–687. [Google Scholar] [CrossRef] [PubMed]
  66. Hamilton, E.S.; Jensen, G.S.; Maksaev, G.; Katims, A.; Sherp, A.M.; Haswell, E.S. Mechanosensitive channel MSL8 regulates osmotic forces during pollen hydration and germination. Science 2015, 350, 438–441. [Google Scholar] [CrossRef] [PubMed]
  67. Lee, C.P.; Maksaev, G.; Jensen, G.S.; Murcha, M.W.; Wilson, M.E.; Fricker, M.; Hell, R.; Haswell, E.S.; Millar, A.H.; Sweetlove, L.J. MSL 1 is a mechanosensitive ion channel that dissipates mitochondrial membrane potential and maintains redox homeostasis in mitochondria during abiotic stress. Plant J. 2016, 88, 809–825. [Google Scholar] [CrossRef] [PubMed]
  68. Basu, D.; Haswell, E.S. The mechanosensitive ion channel MSL10 potentiates responses to cell swelling in Arabidopsis seedlings. Curr. Biol. 2020, 30, 2716–2728.e6. [Google Scholar] [CrossRef] [PubMed]
  69. Cao, Y.; Sun, G.; Zhai, X.; Xu, P.; Ma, L.; Deng, M.; Zhao, Z.; Yang, H.; Dong, Y.; Shang, Z. Genomic insights into the fast growth of paulownias and the formation of Paulownia witches’ broom. Mol. Plant 2021, 14, 1668–1682. [Google Scholar] [CrossRef]
  70. Zhou, J.; Ma, F.; Yao, Y.; Deng, M.; Chen, M.; Zhang, S.; Li, Y.; Yang, J.; Zhang, N.; Huang, J. Jujube witches’ broom phytoplasma effectors SJP1 and SJP2 induce lateral bud outgrowth by repressing the ZjBRC1-controlled auxin efflux channel. Plant Cell Environ. 2021, 44, 3257–3272. [Google Scholar] [CrossRef]
  71. Han, S.S.; Baek, S.J.; Lee, S.H.; Seo, S.T.; Seralathan, K.K. First Report of Aster Yellows Phytoplasma (16SrI-B) Associated with Witches’ Broom Disease of Melia azedarach var. japonica in Korea. J. Phytopathol. 2015, 163, 1055–1058. [Google Scholar] [CrossRef]
  72. Wang, L.; Ming, L.; Liao, K.; Xia, C.; Sun, S.; Chang, Y.; Wang, H.; Fu, D.; Xu, C.; Wang, Z. Bract suppression regulated by the miR156/529-SPLs-NL1-PLA1 module is required for the transition from vegetative to reproductive branching in rice. Mol. Plant 2021, 14, 1168–1184. [Google Scholar] [CrossRef]
  73. Schmidt, R.; Schippers, J.H. ROS-mediated redox signaling during cell differentiation in plants. Biochim. Biophys. Acta-Gen. Subj. 2015, 1850, 1497–1508. [Google Scholar] [CrossRef]
  74. Mittler, R. ROS Are Good. Trends Plant Sci. 2017, 22, 11–19. [Google Scholar] [CrossRef] [PubMed]
  75. Zavattieri, M.A.; Frederico, A.M.; Lima, M.; Sabino, R.; Arnholdt-Schmitt, B. Induction of somatic embryogenesis as an example of stress-related plant reactions. Electron. J. Biotechnol. 2010, 13, 12–13. [Google Scholar] [CrossRef]
Figure 1. Morphology and anatomical structure of three types of roots and root bud development of T. fargesii. (A), RSs, a new root bud protrudes the epidermis; (B), root buds grow and the complete adventitious bud structure. (C), Transverse lateral roots secondary structure cross-sections in SRs, showing periderm, vascular cambium, secondary xylem, primary xylem, xylem ray. (D), Transverse lateral roots secondary structure cross-sections in SRs, showing periderm, vascular cambium, secondary xylem, primary xylem, xylem ray. (E), Transverse lateral roots secondary structure cross-sections in RSs, showing periderm, vascular cambium, secondary xylem, primary xylem, xylem ray. (F), Transverse lateral roots secondary structure cross-sections in SRs, showing periderm, vascular cambium, secondary xylem, primary xylem, xylem ray. (G), Root buds elongate, and the shoot appears. (H), Root bud primordium polarity growth was established toward the root microtubules. Primary xylem (PX), Secondary xylem (SX), Vascular cambium (VC), Secondary phloem (SP), Phelloderm (Ph), Cork cambium (CC), Cork layer (CL), Root bud primordium (RBP), Root bud (RB). A–B bar = 1 cm; C–H bar = 200 μm.
Forests 15 00335 g001
Figure 2. The root tissue physiological content of NSC and endogenous hormones on RSs, NRSs, and SRs. (A) ZR, (B) IAA, (C) ABA, (D) GA3 (E) soluble sugars, (F) starch, and (G) NSC. * indicates p < 0.05, ** indicates p < 0.01, *** indicates p < 0.001 with two group.
Forests 15 00335 g002
Figure 3. Profile of Auxin (A), cytokinins (B), abscisic acid (C) and gibberellins (D) synthesis, catabolism, transport, and signal transduction pathways related transcripts obtained from RS, NRS, and SR. Each column represents a treatment starting from four replications means. Red color indicates upregulated genes and blue color indicates downregulated genes. The transcripts corresponding to the genes are listed in Table S5.
Forests 15 00335 g003
Figure 4. KEGG pathway for the starch and sucrose metabolism pathway, glycolysis/gluconeogenesis and TCA cycle pathway of DEGs. The transcripts corresponding to the genes are listed in Table S6.
Forests 15 00335 g004
Figure 5. Profile of DEG transcription factors obtained from RS, NRS, and SR of T. far. Each column represents a treatment starting from 4 replicates. The FPKM in gene expression is designated as heatmap with normalized and log2. Red color indicates upregulated genes and blue color indicates downregulated genes as compared. To distinguish between different transcripts of the same unigene, we named the genes. The transcription factors belong to different gene families, zn-clus (YOG2, UPC2, WOR2, MAL13, ACU15), WRKY (WRK53-1, WRK53-2, WRK53-3, WRK41, WRK40, WRK24, WRKY7), TRAF (NPR3, BPM2), TCP (TCP7), SWI/SNF-SWI3 (YO338), SNF2 (CHR28), SBP (SPL18, SPL1), PHD (Y4193), Others (ARR4-1, ARR4, CEK1), NAC (NAC14-1, NAC14-2, NAC14-3, NAC14-4, NAC66-1, NAC66-2, NAC66-3, NAC66-4, NAC90-1, NAC90-2, NAC17, NAC45-1, NAC45-2, NTL9), MYB-related (MY1R1, MYB4-1, MYB4-2, MYB48), MYB (MYB4, AS1), Jumonji (JM706), IWS1 (IWS1), HSF (HSF30-1, HSF30-2, HSF30-3, HSF30-4), HB-other (PHX1, RLT3), HB-KNOX (KNAP3, HSBH1-1, HSBH1-2), HB-HD-ZIP (HAT4), GRAS (SCL1, SCL13-1, SCL13-2, SCL13-3, SCL13-4, SCL13-5, SCL14, CIGR1-1, CIGR1-2, CIGR1-3, GAIPB), GNAT (YP20), CPP (TCX2), C3H (C3H9), C2H2 (CRZA, ACE1-1, ACE1-2, RPN4-1, RPN4-2, RPN4-3, RPN4-4, TRY5, ZN530, IDD15, SEBA, HBX4, UBI1P, ZAT12, IDD7-1, IDD7-2, ACE1), C2C2-GATA (GATA8-1, GATA8-2, GTAJ, HAT5), C2C2-CO-like (COL5), bZIP (CPC1, CPRF1-1, CPRF1-2, CPRF1-3, RF2B, RF2A, ATF1, MBZ11), bHLH (BH035, BH013), BES1 (BEH4), B3 (VAL3-1, VAL3-2), AUX/IAA (AX22D, IAA27), AP2/ERF-ERF (ERF60, ERF18), AP2/ERF-AP2 (AIL1).
Forests 15 00335 g005
Disclaimer/Publisher’s Note: The statements, opinions and data contained in all publications are solely those of the individual author(s) and contributor(s) and not of MDPI and/or the editor(s). MDPI and/or the editor(s) disclaim responsibility for any injury to people or property resulting from any ideas, methods, instructions or products referred to in the content.

