Article

Responses of Soil Phosphorus Cycling-Related Microbial Genes to Thinning Intensity in Cunninghamia lanceolata Plantations

1
College of Forestry, Fujian A & F University, Fuzhou 350002, China
2
China Fir Engineering Technology Research Center, State Forestry and Grassland Administration, Fuzhou 350002, China
*
Author to whom correspondence should be addressed.
Forests 2024, 15(3), 440; https://doi.org/10.3390/f15030440
Submission received: 4 January 2024 / Revised: 6 February 2024 / Accepted: 23 February 2024 / Published: 26 February 2024
(This article belongs to the Special Issue Adaptive Mechanisms of Tree Seedlings to Adapt to Stress)

Abstract

:
Background: Microorganisms are important regulators of soil phosphorus cycling and phosphorus availability in Chinese fir (Cunninghamia lanceolata (Lamb.) Hook) plantations. However, the effects of thinning on soil phosphorus cycling by microbes in C. lanceolata plantations remain unclear. Methods: We performed a metagenomic sequencing analysis to investigate how thinning intensities (weak, moderate, and heavy) alter phosphorus cycling related microbial genes and their regulatory effects on soil phosphorus availability in C. lanceolata plantations. Results: Following heavy thinning, the contents of available and labile phosphorus increased by 13.8% and 36.9%, respectively, compared to moderate and weak thinning. Moreover, the relative abundance of genes associated with inorganic phosphorus solubilization increased significantly with the increase in thinning intensity, whereas genes associated with phosphorus uptake and transport significantly decreased. The metagenomic analysis results indicate that Acidobacteria (47.6%–53.5%), Proteobacteria (17.9%–19.1%), and Actinobacteria (11.7%–12.8%) are the major contributors to the functional phosphorus cycling genes in the soil. The random forest analysis results suggested that gcd, plc, phoN, ugpA, and phoR were the critical genes involved in the transformation and use of phosphorus, which in turn increased soil phosphorus availability. Structural equation modeling revealed that soil pH was the primary factor influencing changes in functional genes associated with phosphorus cycling in C. lanceolata plantations. Specifically, soil pH (ranging from 4.3 to 4.9) were positively correlated with genes involved in inorganic phosphate solubilization and organic phosphate mineralization, while negatively correlated with genes related to phosphorus uptake and transport. Conclusions: Taken together, our results demonstrate that the enhanced microbe-mediated mineralization of organic phosphorus and solubilization of inorganic phosphorus are suppressed when uptake and transportation are the mechanisms responsible for the increased soil phosphorus availability under appropriate thinning intensities. Changes in the soil microbial community and phosphorus cycling genes in response to different thinning intensities may maintain soil functionality and nutrient balance in C. lanceolata plantations. These findings contribute to a better understanding of the mechanisms underlying the microbial mediation of phosphorus cycling in the soil of C. lanceolata plantations.

1. Introduction

Phosphorus is a significant nutrient element for plant and soil microbial growth and development [1,2]. Phosphorus in soils exists in both organic and inorganic forms, with organic phosphorus mainly comprising a mixture of phosphomonoesters, phosphodiesters, phosphonates, and organic polyphosphates. Organic phosphorus is converted to inorganic phosphorus before it is absorbed and used by plants [3]. Additionally, phosphorus in soil is usually present as labile phosphorus, moderately labile phosphorus, and stable phosphorus [1]. Although the labile phosphorus content is relatively low, it is readily available for plant uptake [4,5]. When labile phosphorus is depleted, it must be replenished via the conversion of other components, especially moderately labile phosphorus [6,7]. Low phosphorus availability has long been considered a limiting factor in subtropical forest ecosystems. Even if the total phosphorus content in soil is relatively high, if a significant portion of the phosphorus is mainly fixed or trapped in soil matrices consisting of metal oxides or clay minerals, only limited amounts of available phosphorus (AP) can be readily taken up and used by trees [8,9]. Low soil phosphorus availability can impact the productivity of subtropical forest ecosystems and critical ecological processes, such as carbon sequestration, nitrogen fixation, and the conservation of biodiversity [6,8]. Thus, it is imperative to investigate the factors that regulate the bioavailability of soil phosphorus in forest ecosystems.
Soil microorganisms play a significant role in promoting the phosphorus cycle. It has been discovered that Acidobacteria, Actinobacteria, and Proteobacteria phyla are essential microbial groups that dominate the soil phosphorus cycle in forest ecosystems [10]. These groups primarily influence the bioavailability of soil phosphorus through four key processes: inorganic phosphorus solubilization, organic phosphorus mineralization, phosphorus starvation response, and phosphorus uptake and transport [10,11]. When labile phosphorus levels in the soil are low, microorganisms (especially phosphate-solubilizing microorganisms) dissolve mineral-bound inorganic phosphorus by secreting organic acids, including citric acid, acetic acid, tartaric acid, and gluconic acid, of which gluconic acid is the most common solubilizer of mineral-bound inorganic phosphorus [12,13]. The gcd gene encoding the enzyme pyrroloquinoline quinone-dependent glucose dehydrogenase (PQQ-GDH) controls the formation of gluconic acid [11,14]. The mineralization of organic phosphorus by soil microorganisms primarily involves the secretion of enzymes that hydrolyze organic phosphorus [11], converting it to bioavailable orthophosphate forms that are accessible to plants [13]. The most common enzymes involved in this process are alkaline and acid phosphatases (encoded by phoN and phoD), with acid phosphatase positively influencing the bioavailability of phosphorus on a large spatial scale [15]. At small spatial scales, alkaline phosphatase is the major factor effecting the bioavailability of phosphorus in soils [16]. Additionally, diverse enzymes, such as pyrophosphatase (ugp), phytase (appA), and the multienzyme complex C-P lyase (phn), participate in the breakdown of various organic phosphate compounds through the phosphate metabolic pathway [13,17]. The phosphorus use efficiency of microorganisms can be enhanced by genes associated with phosphorus uptake and transport [18], including genes encoding high-affinity and low-affinity transporters that facilitate the uptake of inorganic phosphorus under low or high phosphorus conditions (pst, pit), respectively. Phosphorus starvation response regulatory genes, which mainly include phoR, phoB, and phoU, allow soil microorganisms to effectively use external or alternative phosphorus sources under phosphorus starvation conditions [10,19]. There is a close relationship among phosphorus uptake and transport genes, starvation response regulatory genes, and the controlled expression of alkaline phosphatase genes [10]. Specifically, the microbial balance between phosphorus activation and uptake largely determines whether the soil phosphorus is available to trees [20]. In order to adequately use phosphorus and maintain the stability of C. lanceolata plantation ecosystems, the genetic potential of soil microorganisms mediating phosphorus cycling must be fully explored.
C. lanceolata, which is one of the main afforestation tree species in China, is known for its fast growth, high productivity, and excellent wood quality [21]. However, in recent years, the productivity of C. lanceolata plantations has declined because of the overemphasis on fast growth, monoculturing, and the continuous replanting over multiple generations [22]. Moreover, the high iron and aluminum contents and excessive leaching of southern soils have resulted in the fixation and inactivation of phosphorus, leading to limited phosphorus use, with detrimental effects on the follow-up management of C. lanceolata plantations [8]. Therefore, methods for enhancing soil phosphorus availability in C. lanceolata plantations should be developed. Thinning is an important management practice that can improve the productivity of C. lanceolata plantations (i.e., high-yield cultivation) [23]. It reduces stand density and alleviates competition among trees for soil nutrients, thereby improving forest productivity [2,24]. The impact of thinning on soil phosphorus cycling has been extensively studied, with mechanisms including changes in soil microclimate, variations in the quantity and quality of litter input, and alterations in the activity of soil microorganisms [25,26]. For instance, Hu et al. [2] reported that gaps formed by thinning could improve soil moisture, organic matter, microbial biomass, and phosphatase activity, leading to a significant increase in soil NaHCO3-P content. Fang et al. [7] found that thinning could influence soil microbial activity and phosphatase activity by redistributing light, water, and temperature within the forest, thereby enhancing internal phosphorus cycling in C. lanceolata plantations under phosphorus limitations. Zhou et al. [27], in an analysis of 1228 observational datasets from 115 global studies, concluded that thinning could significantly affect the stand structure and microclimate, which in turn impacts soil microbial activity and promotes the phosphorus cycle in forest soils. However, soil phosphorus cycling is largely driven by microbial functional genes [20,28]. The extent and direction of gene changes in response to thinning intensities, as well as their impact on soil phosphorus transformation, remain unclear. This uncertainty hampers our understanding of the genetic mechanisms by which microorganisms contribute to soil phosphorus metabolism under thinning conditions. In this study, we focused on the soil of C. lanceolata plantations under large-diameter timber cultivation, employing metagenomics technology to explore the genetic mechanisms of soil microbial phosphorus cycling post-thinning. We aimed to evaluate the dominant microbial communities and key functional genes responsible for soil phosphorus availability under thinning conditions. The findings provide a scientific basis for the sustainable management of large-diameter timber cultivation techniques in C. lanceolata plantations. We hypothesized that appropriately increasing the thinning intensity can improve soil phosphorus effectiveness by adjusting the relative abundance of phosphorus cycling microbial functional genes and the composition of phosphorus cycling microbial communities, thereby mobilizing phosphorus transformation in the soil.

2. Materials and Methods

2.1. Research Site

This study was completed in a Guanzhuang state-owned forest farm in Chicun village, Sanming city, Fujian province, China (117°43′15″–117°43′18″ E, 26°32′61″–26°32′67″ N). The experimental forest, which is located between the Wuyi and Daiyun Mountains, is characterized by a subtropical monsoon climate. The average elevation ranges from 150 to 350 m above sea level, with an average annual temperature of 18 °C and an average annual precipitation of 1700 mm. The dominant soil types in the region (e.g., yellow–red soil) were derived from volcanic rock and sedimentary rock and were rich in organic matter. The forest site index was approximately 18. The understory vegetation mainly consisted of Maesa japonica, Oreocnide frutescens, Ficus hirta, Callicarpa bodinieri, Pteris fauriei, Ilex cornuta, Cyclosorus parasiticus, Carex chinensis, and other species.

2.2. Experimental Design and Sample Collection

The experimental forest was an 8-year-old artificial C. lanceolata plantation, with an initial planting density of 3250 trees hm−2 in 2009. In November 2017, the plantation was thinned according to the requirements for cultivating large-diameter timber. Three replicates of the following thinning treatments were completed for a total of nine plots (20 m × 20 m) on the downhill slope: low (2250 trees hm−2; WT), medium (1800 trees hm−2; MT), and high (1200 trees hm−2; HT). The thinned trees and residues, such as branches, were removed to prevent them from affecting the study results. In March 2023, soil samples were collected (0–20 cm depth) from nine points that formed an “S” shape within each plot and then combined to obtain one composite sample per plot (i.e., nine composite samples). All samples were stored in a portable insulated box and immediately transported to the laboratory. After removing plant roots and other impurities, the soil samples were divided into two parts. One part was air-dried and filtered through a 100-mesh sieve for the analyses of the phosphorus fractions and physicochemical properties, whereas the other part was stored at −80 °C for the subsequent extraction of DNA.

2.3. Physical and Chemical Measurements

The pH of soil samples (1:2.5 soil:water ratio) filtered through a 20-mesh sieve was measured using a pH meter. The water content (WC) was calculated as the difference in the weight of the soil sample before and after drying at 105 °C. Nitrate nitrogen (NO3-N) and ammonium nitrogen (NH4+-N) were extracted using a KCl solution (2 M), then analyzed using a flow analyzer (Skala San++, Breda, The Netherlands). After a digestion with HClO4–HF, the total potassium (TK) and the total phosphorus (TP) contents were determined using the ICP-OES system (Perkin Elmer, Waltham, MA, USA). Available phosphorus (AP) content was gauged using an acid dissolution and the molybdenum antimony anti-colorimetric. Nitrogen (TN) and soil organic carbon (SOC) contents were gauged using an elemental analyzer method (Vario Macro Cube, Elementar, Germany). Available potassium (AK) content was gauged according to the ammonium acetate extraction. Microbial biomass phosphorus (MBP) was analyzed using chloroform fumigation [29,30].

2.4. Sequential Fractionation of Phosphorus

We used an improved Hedley phosphorus fractionation method to analyze the forms and availability of phosphorus. Samples (0.1 g) were added to a 50 mL tube; distilled water, 0.5 mol L−1 of NaHCO3, 0.1 mol L−1 of NaOH, and 1 mol L−1 of HCl solutions (30 mL each) were added sequentially to the sample, which was then shaken for 16 h for the subsequent extraction of phosphorus. The residual soil sample was treated with H2SO4–H2O2 at 270 °C for the high-temperature digestion prior to determining the residual phosphorus (residual-P) content. The molybdenum antimony anti-colorimetric method and a standard curve were used to calculate the contents of all phosphorus forms. On the basis of how easily they were taken up and used by plants and microbes, the phosphorus forms were categorized as soil labile phosphorus (water-extractable phosphorus (H2O-P = H2O-Pi + H2O-Po) and NaHCO3-extractable phosphorus (NaHCO3-P = NaHCO3-Pi + NaHCO3-Po)), moderately labile phosphorus (NaOH-extractable phosphorus (NaOH-P = NaOH-Pi + NaOH-Po)), and stable phosphorus (HCl-extractable phosphorus (HCl-P = HCl-Pi + HCl-Po), and residual-phosphorus) (Pi: inorganic phosphorus; Po: organic phosphorus) [31,32].

2.5. Genomic DNA Extraction and Metagenomic Sequencing Data Analysis

Genomic DNA was extracted from soil samples in the range of 0.5–1.0 g using the PowerSoil DNA Isolation Kit (MoBio Laboratories Inc., Carlsbad, CA USA). The degradation and purity of the isolated DNA were assessed using the NanoDrop 2000 spectrophotometer (Thermo Scientific, Waltham, MA, USA). The DNA concentration was measured using the PicoGreen dsDNA Assay Kit and the Qubit 4.0 fluorometer. Metagenomic shotgun sequencing libraries (insert size of 400 bp) were constructed using the Illumina TruSeq Nano DNA LT Library Preparation Kit and then sequenced by Nanjing Aowei Sen-Genetech Co., Ltd. (Nanjing, China) using the Illumina NovaSeq2500 platform (PE150 sequencing). For each sample, the low-quality reads were removed from the metagenomic sequencing data using FASTP (version 0.20.0). The remaining reads for all samples were combined to assemble the genome using MEGAHIT (or IDBA_UD) according to the De-Bruijn graph principle. Overlapping contigs (≥800 bp) were selected to predict and annotate genes. Approximately 805,000,000 high-quality sequences were obtained for the nine metagenomes, with 80,000,000–99,000,000 sequences per sample (Table S1).

2.6. Gene Prediction and Taxonomic and Functional Annotations

The Prodigal software (version 2.6.3) was used to examine the assembled contig sequences to predict open reading frames (ORFs), which were then translated into amino acid sequences. The predicted ORFs for each sample and the mixed assembly were analyzed using CD-HIT (version 4.6.1) to eliminate redundancies and obtain the initial non-redundant gene catalog. To classify and provide functional annotations for non-redundant genes, we compared representative sequences with those in the NCBI-nr and KEGG databases using DIAMOND (version 0.8.35).
For the genome’s functional analysis, we focused on functional genes associated with the phosphorus cycling in the soil. These genes were selected using the KEGG database for soil phosphorus cycling genes and from previous research [11,29]; the 125 genes were chosen and classified into four groups according to their functions in soil phosphoruse cycling: inorganic phosphorus solubilization, organic phosphorus mineralization, phosphorus uptake and transport, and phosphorus starvation response regulation (Table S2). The relative contributions of microbial groups to phosphorus cycling-related pathways were determined by comparing the relative abundance of the functional categories connected to phosphorus cycling with the total abundance of all functional categories [10,33].

2.7. Statistical Analysis

A Pearson correlation analysis and a one-way ANOVA with a post hoc Tukey’s test as well as Duncan’s multiple comparisons test were performed using SPSS (version 22.0) to analyze the differences in soil phosphorus fractions, phosphorus cycling functional genes, and relative abundances of microbial populations among the thinning intensities. The heatmap illustrating the relationships between soil properties and phosphorus cycling functional genes, which were determined on the basis of Pearson rank correlations, was drawn using the “Correlation Plot” software package in Origin 2022. To further explore how phosphorus cycling functional genes influence soil phosphorus availability, 42 phosphorus cycling functional genes influencing the AP and labile phosphorus contents were ranked in terms of importance using the random forest algorithm from the “randomforest” package in R (version 4.0.3). Genes with a MeanDecreaseAccuracy > 0 were selected as the key genes for the microbial transformation and use of the soil AP content. The linear regression analysis, non-metric multidimensional scaling (NMDS), and principal component analysis (PCA) were performed using Origin 2022. The redundancy analysis was conducted using Canoco (version 4.5). Finally, SPSS AMOS (version 25) was used to examine the direct and indirect effects of thinning on soil microbial phosphorus cycling functional genes and soil phosphorus availability.

3. Results

3.1. Impacts of Thinning on Soil Properties and Phosphorus Fractions

There were significant differences in the TN content (1.2–1.5 g kg−1), SOC content (15.5–20.0 g kg−1), soil pH (4.3–4.9), NH4+-N content (12.2–19.7 mg kg−1), NO3-N content (2.9–5.4 mg kg−1), and TK content (15.8–21.6 g kg−1) among the thinning intensities (p < 0.05). With the exception of pH, the values for the heavy thinning were significantly higher than those for the moderate and weak thinning intensities (Table S4). The phosphorus content, including the TP (682.8–816.4 mg kg−1), AP (3.0–3.5 mg kg−1), and MBP (20.3–33.2 mg kg−1) contents, increased significantly as the thinning intensity increased (p < 0.05). The organic phosphorus content after moderate thinning (262.5–362.3 mg kg−1) was significantly higher than that following weak thinning (p < 0.05). Regardless of the thinning intensity, the main forms of soil phosphorus were HCl-P and residual-P. The H2O-Pi and NaOH-Pi contents were significantly higher after heavy thinning than after weak thinning (p < 0.05). The NaHCO3-Pi and NaOH-Po contents were significantly higher after moderate thinning than after heavy or weak thinning (p < 0.05). The rank-order of phosphorus availability following the three thinning treatments was as follows: stable phosphorus > moderately labile phosphorus > labile phosphorus. The labile phosphorus (especially H2O-Pi and NaHCO3-Pi) levels were significantly higher after heavy thinning intensities than after moderate or weak thinning intensities (p < 0.05). Additionally, the moderately labile phosphorus content was significantly higher following moderate thinning intensities than following weak thinning intensities (p < 0.05).

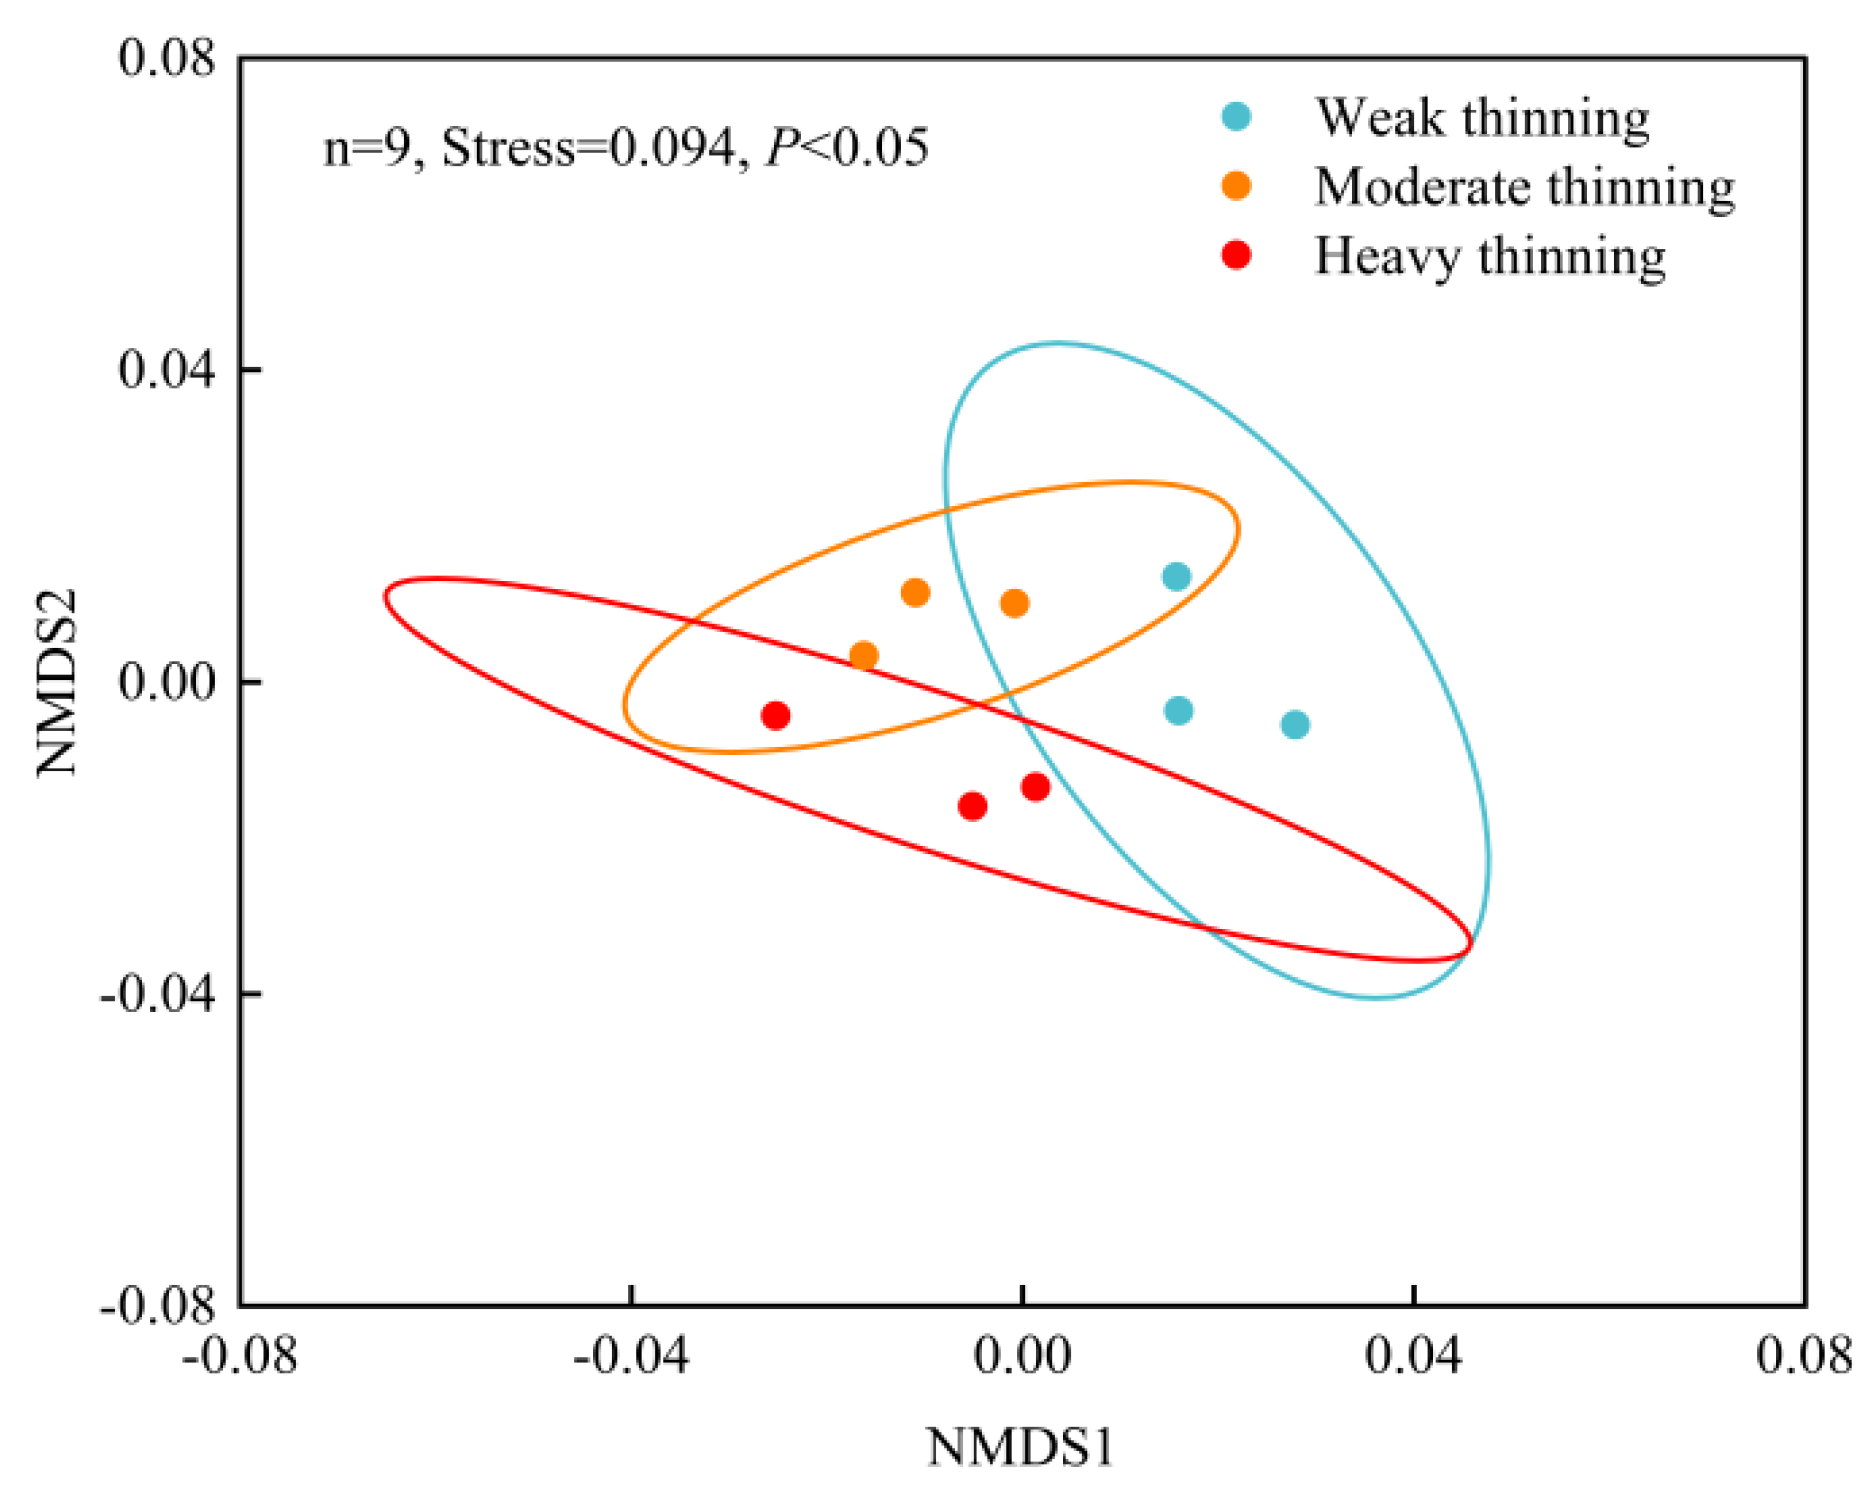
3.2. Composition of Soil Phosphorus Cycling-Related Genes

We analyzed 42 phosphorus cycling functional genes with relative abundances greater than 0.5%. There were significant differences in 14 of these genes among the thinning intensities (p < 0.05). The relative abundances of gcd, plc, and ldh were significantly higher under heavy thinning conditions than under moderate or weak thinning conditions. The relative abundances of E3.5.1.49, ppx, aldh2, and phoN were significantly higher under moderate thinning conditions than under weak thinning conditions. The relative abundances of EC:1.1.2.4, phoR, rne, ugpB, phnC, phnE, and phnD were significantly higher under weak thinning conditions than under moderate or heavy thinning conditions (Figure S1). The significant disparities in gene compositions between the three thinning intensities were confirmed by the NMDS plot (Figure 1). The analysis of the genes classified in four phosphorus cycling categories indicated the relative abundances of the inorganic phosphorus solubilization genes were significantly higher after heavy or moderate thinning intensities than after weak thinning intensities (30.8%–31.9%). Conversely, the relative abundances of the phosphorus uptake and transport genes were significantly higher under weak thinning conditions than under moderate or heavy thinning conditions (14.6%–15.8%). Similarly, the relative abundances of the genes linked to phosphorus deficiency response regulation were higher after weak thinning than after heavy or moderate thinning (4.9%–5.2%; Figure 2a). The genes associated with organic acid formation had the greatest contribution to the solubilization of inorganic phosphorus and the mineralization of organic phosphorus, but there were no significant differences among the three thinning intensities. However, the relative abundance of the genes linked to gluconic acid formation (17.7%–19.4%) was significantly higher under heavy thinning conditions than under weak or moderate thinning conditions. The relative abundance of the genes linked to acetic acid formation (35.9%–36.7%) was significantly higher after moderate thinning conditions than after weak thinning conditions (Figure 2b). Additionally, the relative abundance of acid phosphatase encoding genes (0.4%–0.5%) was significantly higher under moderate thinning conditions than under weak thinning conditions. Finally, inorganic phosphate transporter genes (11.4%–11.6%) were the main genes related to phosphate uptake and transport system, with no significant differences among the three thinning intensities. The abundances of the phosphoric ester transporter genes (1.1%–1.5%) and phosphonate transporter genes (2.0%–2.7%) were significantly higher following weak thinning than following heavy or moderate thinning (p < 0.05; Figure 2c).

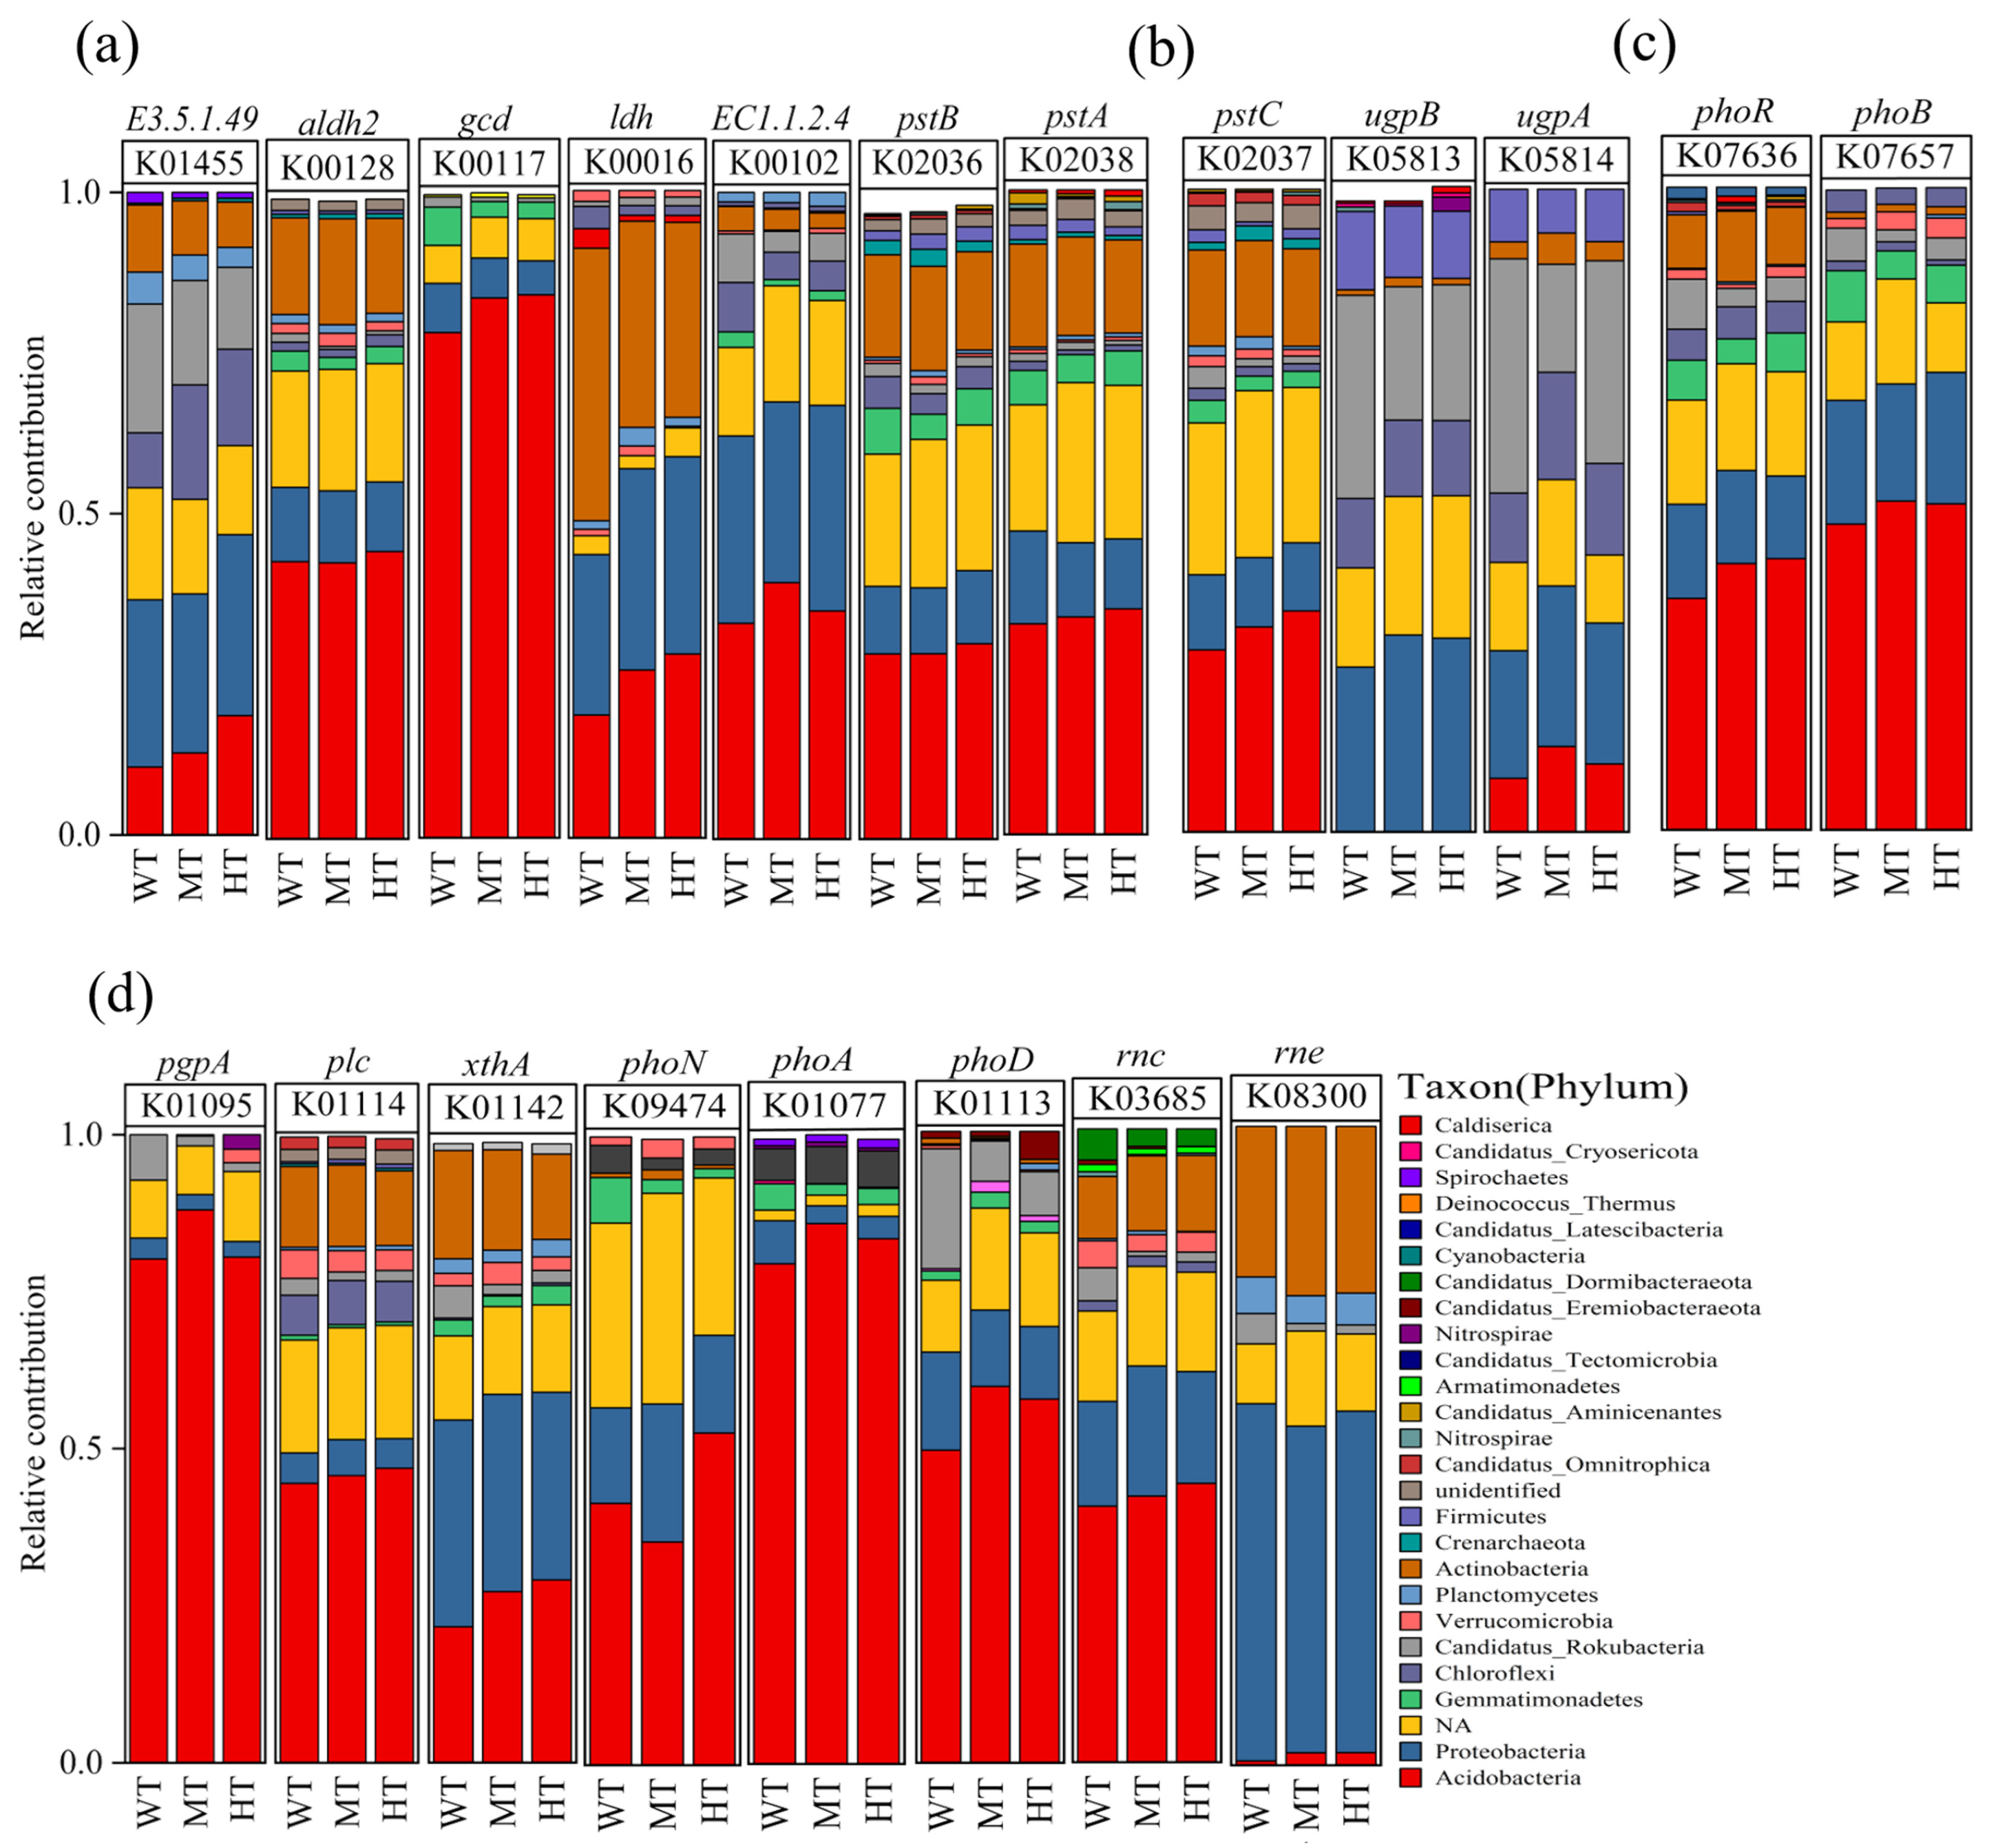
3.3. Microbial Composition and Contribution to the Genes Included in Phosphorus Cycling

A total of 26 phyla and 1292 genera associated with soil phosphorus cycling were detected in this study. Acidobacteria (47.6%–53.5%), Proteobacteria (17.9%–19.1%), Actinobacteria (11.7%–13.4%), Chloroflexi (3.6%–4.0%), and Gemmatimonadetes (2.2%–3.7%) were the dominant phyla that contributed to the processes of soil phosphorus cycling (Figure S2). The relative abundance of Acidobacteria was significantly higher under heavy thinning conditions than under moderate or weak thinning conditions, whereas the relative abundance of Actinobacteria was significantly higher under moderate thinning conditions than under heavy thinning conditions. The relative abundances of Verrucomicrobia, Chlorophyta, and Gemmatimonadetes were significantly higher after weak thinning than after heavy or moderate thinning (p < 0.05; Figure S2). The PCA results revealed differences in the community compositions among the three thinning intensities (p < 0.05; Figure S3). We focused on 23 functional genes, of which 14 genes differed among the thinning intensities and 17 genes were related to the microbial use of soil AP. According to the random forest model, the principal genes involved in inorganic phosphorus solubilization and organic phosphorus mineralization (e.g., gcd, plc, and phoN), phosphorus deficiency response regulation (e.g., phoR), and phosphorus uptake and transport (e.g., ugpA) were the major genes associated with microbial phosphorus transformation and use in C. lanceolata plantations (Figure S4). Among these genes, gcd, plc, and phoN were significantly positively correlated with the AP and labile phosphorus contents, whereas phoR and ugpA were significantly negatively correlated with the labile phosphorus and AP contents (Figure S5). Acidobacteria, Gemmatimonadetes, and Actinobacteria contributed more to the five principal genes related to soil phosphorus cycling under heavy thinning conditions than under moderate or weak thinning conditions. Acidobacteria, Gemmatimonadetes, and Actinobacteria contributed more to the EC:1.1.2.4, ugpA, pgpA, and phoD genes under moderate thinning conditions than under weak or heavy thinning conditions (Figure 3). Moreover, the contributions of Acidobacteria, Gemmatimonadetes, and Actinobacteria to most of the soil phosphorus cycling functional genes increased as the thinning intensity increased.

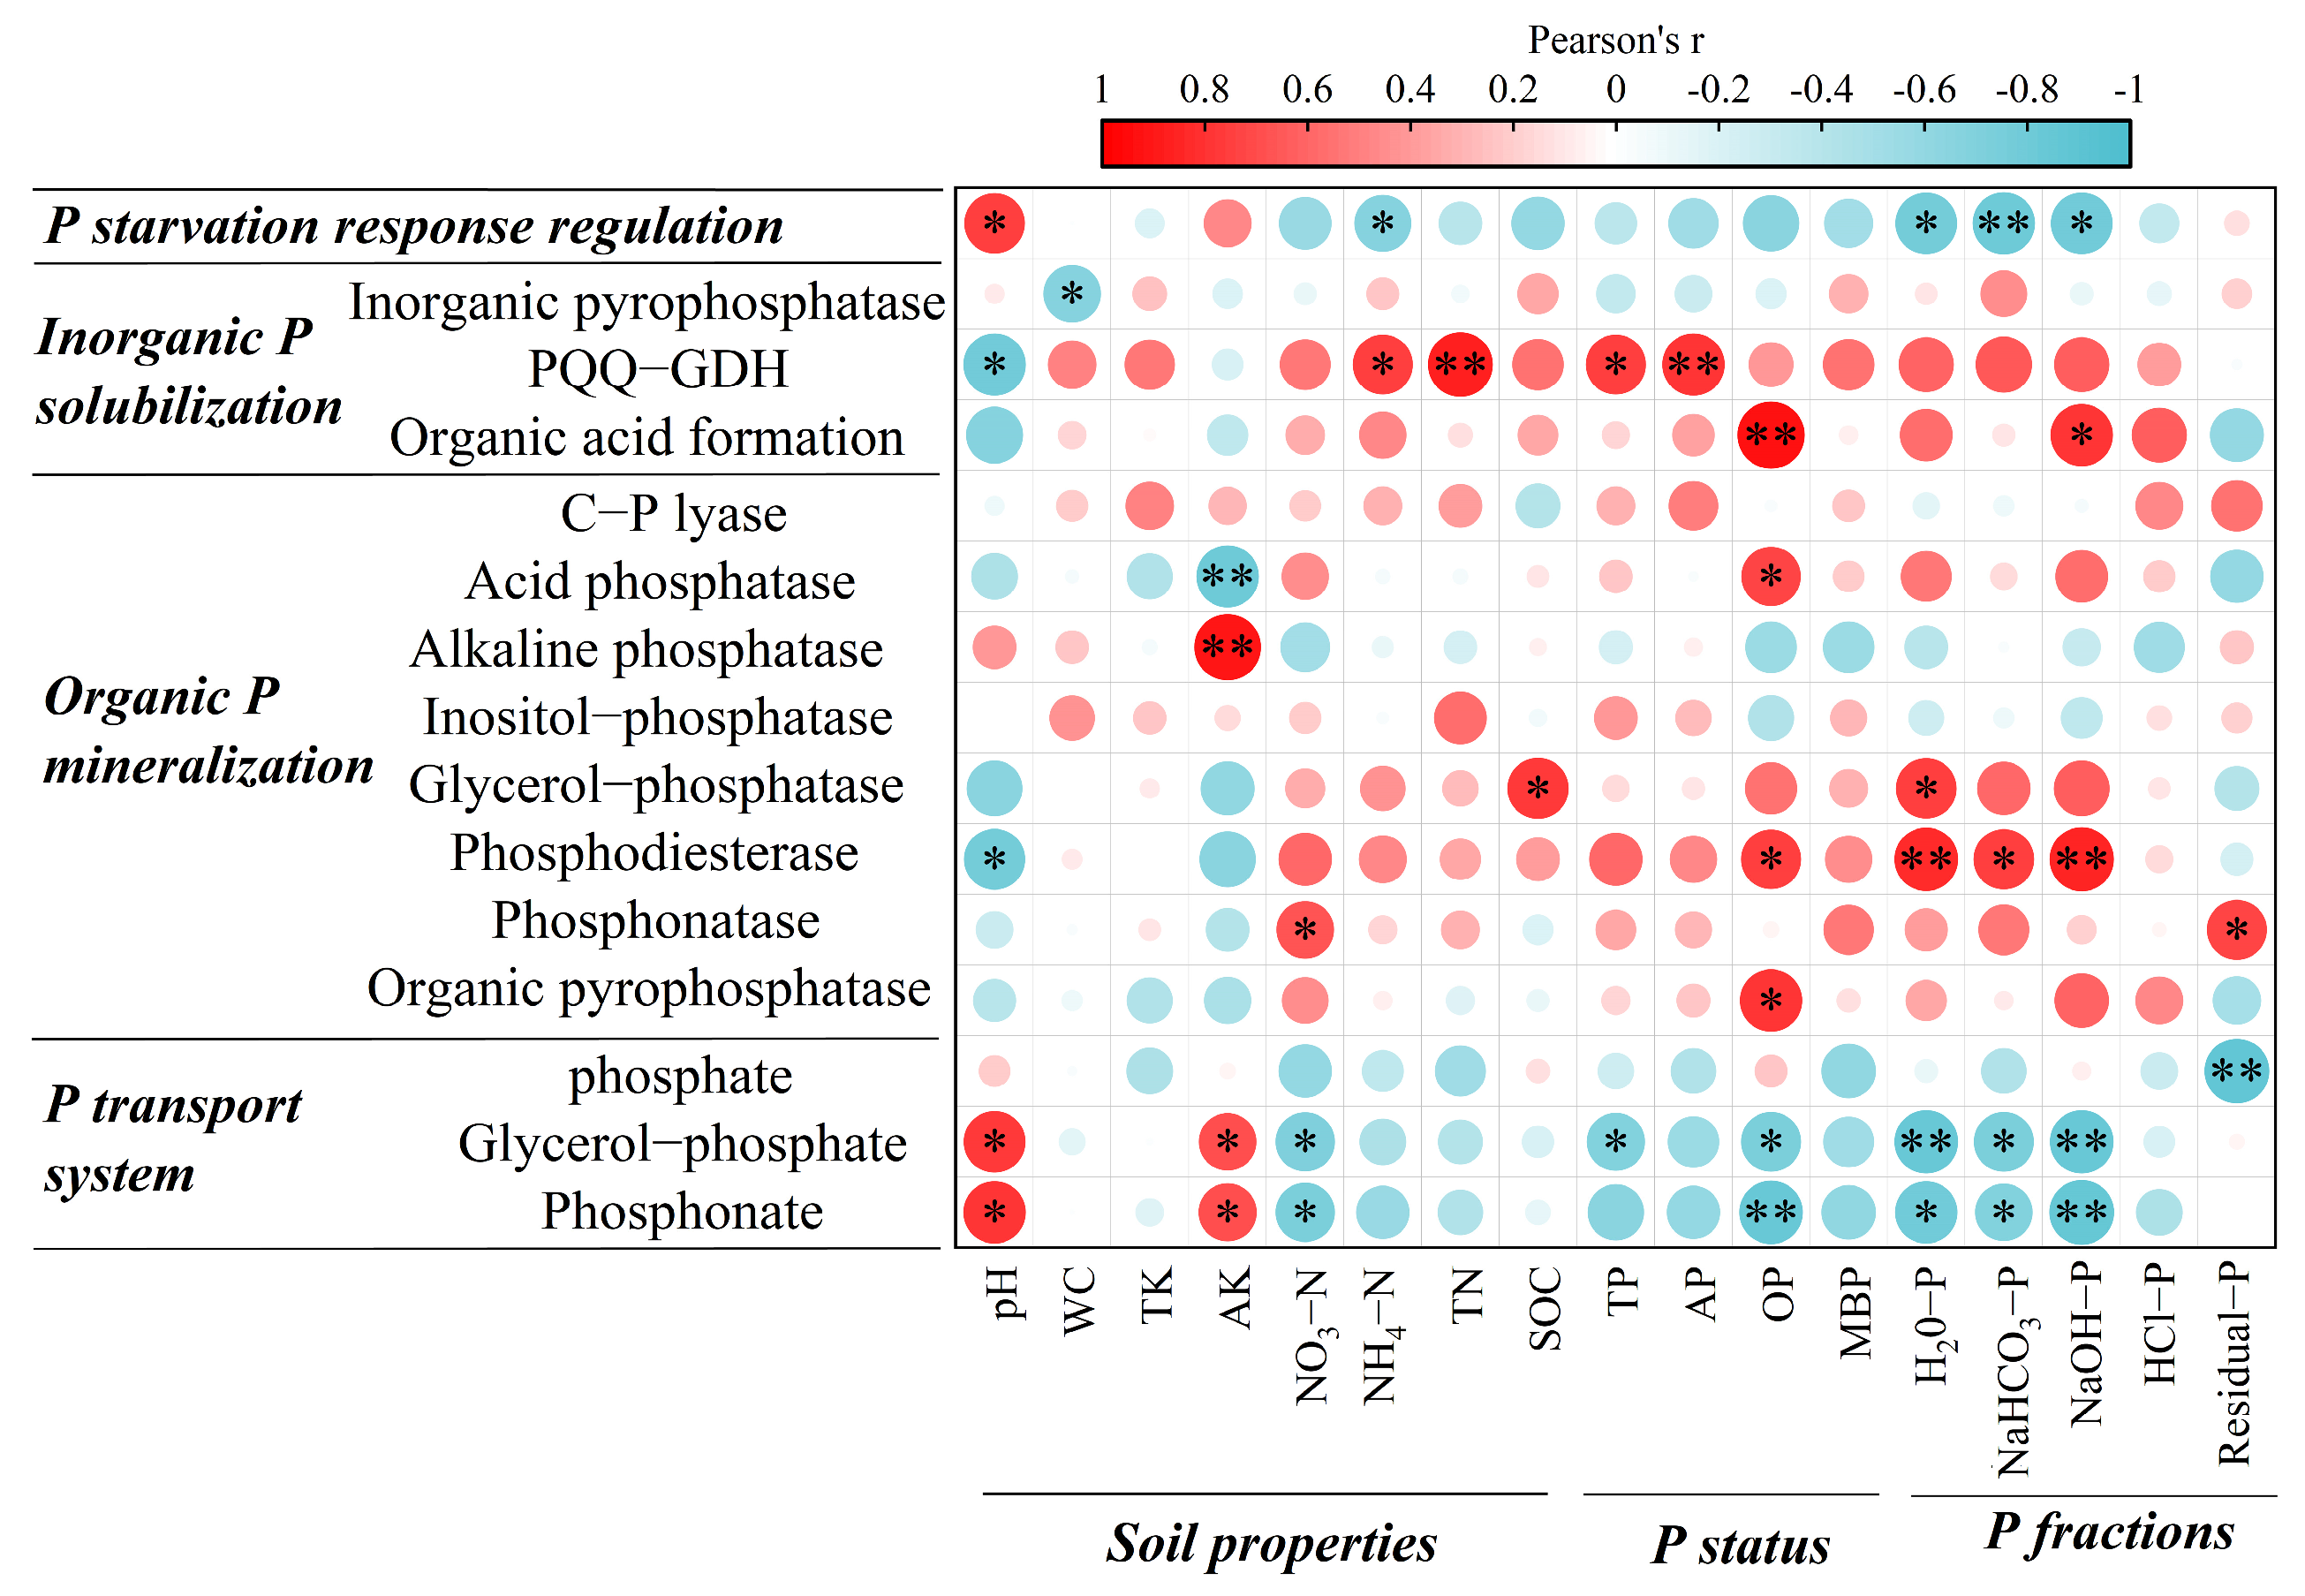
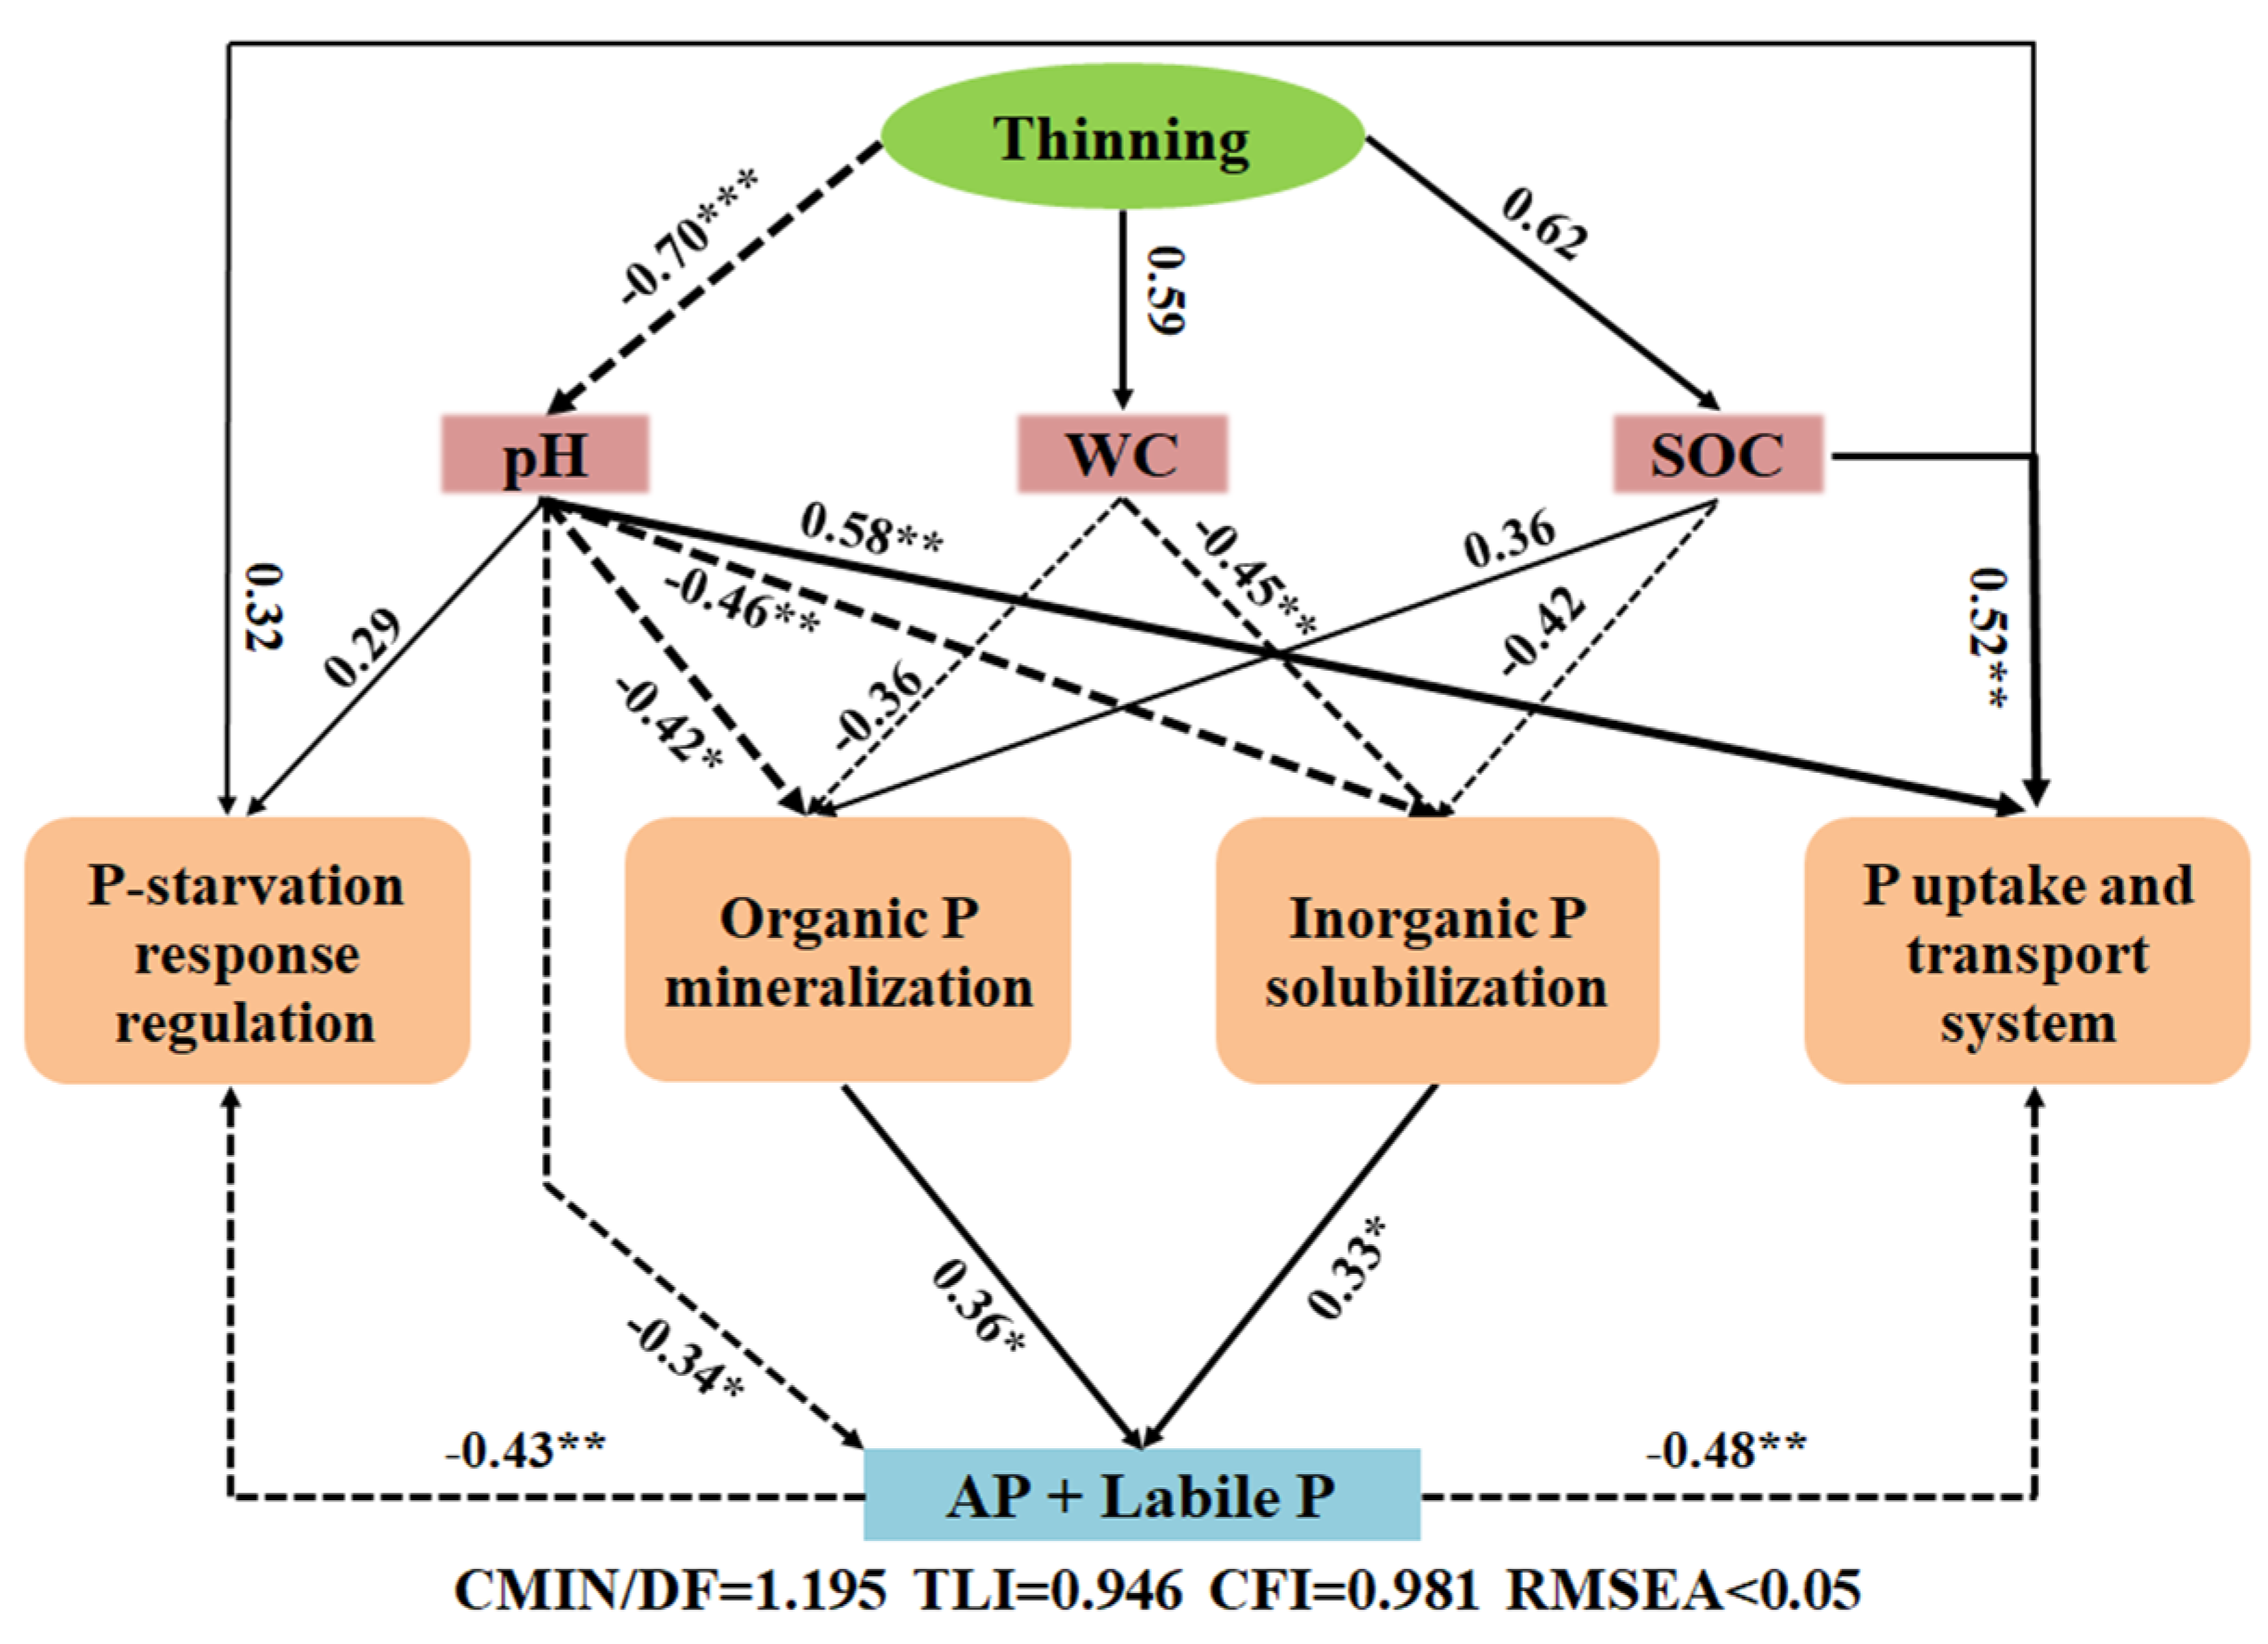
3.4. Correlations among Phosphorus Status, Soil Properties, and Functional Genes

There were significant correlations between the soil pH and the AP, OP, H2O-P, NaHCO3-P, and NaOH-P (p < 0.05). Significant correlations were also detected between the NH4+-N content and the AP, H2O-P, NaHCO3-P, and NaOH-P contents (p < 0.05). In addition, the TN content was significantly corrected with the TP, AP, and MBP contents (p < 0.05), which was contrasted with the lack of significant correlations among WC, SOC, NO3-N, AK, TK, and phosphorus fractions (Table S5). The redundancy analysis indicated that the decrease in soil pH was the primary factor driving the changes in soil microbial phosphorus cycling functional genes (Table S6).
The heatmap presenting the correlations between soil properties and functional genes revealed that soil pH was significantly positively correlated with genes associated with organic phosphate transport, phosphatase transport, and the response to phosphorus starvation, but it was significantly negatively correlated with PQQ-GDH and phosphodiesterase genes (linear relationship; p < 0.05; Figure 4 and Figure S6). According to the structural equation model (SEM), 62.3% of the genes in the four phosphorus cycling functional groups were directly or indirectly influenced by soil properties in C. lanceolata plantations after thinning (Figure 5). The SEM was consistent with the total variance, with an explanatory power of 92.3%. Soil nutrients, including TP, OP, AK, TK, NO3-N, and NH4+-N, did not significantly affect the functional genes involved in phosphorus cycling. Thinning negatively affected the soil pH (coefficient = −0.7; p < 0.05), whereas it positively affected the WC (coefficient = 0.6; p > 0.05) and SOC content (coefficient = 0.6; p > 0.05). The soil pH directly and indirectly affected the AP content and labile phosphorus level by influencing the genes included in the mineralization of organic phosphorus and the solubilization of inorganic phosphorus. The WC and SOC content also indirectly influenced the AP and labile phosphorus contents. Genes contributing to phosphorus uptake and transport were positively influenced by the soil pH (coefficient = 0.6; p < 0.05) and SOC content (coefficient = 0.5; p < 0.05). In addition, similar to the genes related to the regulation of the phosphorus starvation response, they were negatively affected by the AP and labile phosphorus contents (coefficients = −0.5 and −0.4, respectively; p < 0.05).

4. Discussion

4.1. Effects of Different Thinning Intensities on Soil Phosphorus Fractions and Availabilities

Following the Hedley phosphorus fractionation, the H2O-P fraction mainly comprises the orthophosphate (HPO42−) bound to potassium and sodium [34], whereas NaHCO3-P includes inorganic phosphorus adsorbed on crystalline compounds and organic phosphorus in unstable organic compounds. Both forms of active phosphorus can be directly absorbed and used by plants and soil microorganisms [35]. Our findings suggest that the active phosphorus fraction is significantly higher in heavy thinning as compared with weak thinning, which can be attributed to a higher soil organic matter (SOM) content, since SOM is one of the most crucial factors affecting the active phosphorus pool, and a closely positive relationship between SOM and active phosphorus in soils was found in previous studies [36,37]. Indeed, our results also show a higher SOM content in heavy thinning when compared with weak thinning. Moreover, Fang et al. [7] reported that humic substances in the soil organic matter of C. lanceolata plantations exhibit a high affinity for iron and aluminum ions, which compete with phosphorus for adsorption sites. This competition reduces the adsorption of phosphorus by these metal ions, thereby increasing the availability of phosphorus in the soil. In their study on the impact of thinning on the phosphorus fractions in spruce forest soils, Hu et al. [2] found that soil organic carbon (SOC) could play a significant role in promoting the increase in the active phosphorus content.
In addition, our findings suggest that the increase in ammonium nitrogen content can also be associated with an increase in soil nitrogen availability (Table S5). For instance, Wang et al. [38] reported that ammonium nitrogen could genetically enhance the mineralization of organic phosphorus, thereby affecting soil phosphorus effectiveness, through long-term nitrogen additions in temperate forests. Khan et al. [39] also observed that an increase in soil NH4+ could lead to an increase in soil H+ content by rapid oxidation to HNO3 via nitrification and by competing with cationic ions for adsorption sites. Therefore, an increase in ammonium nitrogen content can contribute to the release of phosphorus from the soil [40]. NaOH-P is classified as moderately active phosphorus and can serve as a significant contributor to active phosphorus under conditions of severe phosphorus limitation [6,41]. Compared with weak thinning, heavy thinning and moderate thinning had higher moderately labile phosphorus levels. However, most studies suggest that an increase in active phosphorus content is typically accompanied by a decrease in the content of moderately active phosphorus, with active phosphorus primarily derived from the transformation of moderately active phosphorus [2,7]. We speculate that this trend may not be evident in our study due to the high total phosphorus content in the soil of the C. lanceolata plantations, where the proportion of moderately active phosphorus is relatively large [7,27]. Stable phosphorus, which includes HCl-P and residual-P, remains relatively stable under the experimental conditions of this study. In summary, appropriately increasing the intensity of thinning may aid in regulating the composition and bioavailability of soil phosphorus.

4.2. Shifts in the Functional Genes of Soil Phosphorus Cycling after Different Thinning Treatments

Microbial functional genes are the primary drivers of phosphorus cycling in soils [11,13]. In the present study, the three thinning treatments resulted in significant differences in the soil phosphorus cycling functional genes in C. lanceolata plantations. Specifically, the abundance of inorganic phosphorus solubilization genes was significantly higher after heavy thinning compared to moderate or weak thinning, whereas the abundance of phosphorus uptake and transport genes was significantly higher under weak thinning compared to heavy or moderate thinning. According to the results of the correlation and redundancy analyses as well as the SEM, the soil pH (ranging from 4.3 to 4.9) was the dominant environmental factor influencing the phosphorus cycling functional gene composition. This finding is consistent with the results of Dai et al.’s [10] research on agricultural ecosystems, where they found that soil pH played a more significant role in determining the functional genes involved in the phosphorus cycle than the stoichiometric ratios of nitrogen and phosphorus. Among the detected phosphorus cycling genes, the gene encoding PQQ-GDH enzyme (e.g., gcd) showed a significantly higher relative abundance under heavy thinning compared to moderate and weak thinning. Given that PQQ-GDH contributes significantly to the solubilization of soil inorganic phosphorus into AP [29,42], this can be one of the important pathways for enhancing soil phosphorus availability [38]. Furthermore, soil organic acid content greatly influences the solubilization of inorganic phosphorus [17,43]. In this study, genes encoding the formation of acetic acid and gluconic acid (e.g., aldh2, gcd) had a relatively high abundance, with both heavy and moderate thinning showing significant increases compared to weak thinning (p < 0.05). Therefore, we speculate that appropriately increasing the thinning intensity can favor the synthesis of organic acids, which can potentially increase the supply of soil phosphorus [38].
Interestingly, the relative abundance of genes encoding organic phosphorus mineralization was significantly higher than that of genes involved in the other three phosphorus cycling processes. Moreover, the genes encoding acid phosphatase (e.g., phoN) and phosphodiesterase (e.g., plc, rne) showed a significant increase in relative abundance under moderate thinning compared to weak thinning (p < 0.05). These enzymes play a crucial role in promoting the mineralization of soil phosphates and phosphonates [13,15]. Notably, the relative abundance of genes encoding phosphodiesterase enzymes (e.g., plc, rne) was found to be the highest among all phosphorus cycling functional groups, contradicting previous research findings by Mori et al. [44], who suggested that soil microorganisms in low phosphorus environments tend to preferentially degrade organic phosphorus monester bonds rather than diester bonds. We hypothesize that this discrepancy may be attributed to the higher contents of total and organic phosphorus (especially diester phosphorus) in the soil of the study area compared to agricultural and grassland soils. This higher content can make it more challenging for microorganisms to directly hydrolyze monester phosphorus into orthophosphates [14,44]. Moreover, the phoD gene, which plays a crucial role in the mineralization of organic phosphorus [45,46], is widely present in soils [21]. Under low soil phosphorus conditions, the expression of the phoD gene is typically enhanced to accelerate the hydrolysis of organic phosphorus in the soil [47,48]. However, in this study, there was no significant difference in the abundance of genes encoding alkaline phosphatase (phoA, phoD). Previous studies have indicated that soil pH is a primary factor affecting phoD gene expression across grassland, farmland, and forest ecosystems [48,49]. Therefore, we hypothesized that the repressive effect on phoD genes in southern China could be due to the generally weakly acidic soil [2].
The increase in the soil phosphorus supply in C. lanceolata plantations can be attributed to the decrease in the soil pH and an increase in the relative abundance of genes encoding acid phosphatase, PQQ-GDH, and enzymes associated with acetic acid and gluconic acid production. However, when the levels of AP in the soil were relatively high, the relative abundance of genes encoding phosphorus starvation response regulators (e.g., phoR) was inhibited; this inhibition became more prominent as the thinning intensity increased. This finding is consistent with previous research findings and suggests that the genes of the phosphorus starvation response are mostly controlled by the supply of phosphorus in the soil [12]. The current study’s SEM also confirmed the negative impact of soil phosphorus availability on the relative abundance of phosphorus starvation response-related genes. Additionally, genes involved in phosphorus uptake and transport are also regulated by soil phosphorus levels [50]. In this study, compared with the corresponding levels under moderate and heavy thinning conditions, the AP content was lower under weak thinning conditions, but the relative abundances of the phosphonate gene phnC and the phosphoric ester transporter gene ugpA were significantly higher. This could be due to the activation of phosphorus transport systems in response to low phosphorus conditions [51,52]. As the soil phosphorus supply levels increase, the expression of gene encoding proteins associated with the abundance and transport of phosphoric esters tends to decrease [6]. Hu et al. [20], through various fertilization experiments on black soil, confirmed that Phn and Ugp genes can be more constrained in environments with ample phosphorus. In summary, appropriately increasing the thinning intensity can promote the abundance of genes associated with the solubilization of inorganic phosphorus and the mineralization of organic phosphorus, while inhibiting the abundance of genes involved in phosphorus absorption and transport. This can lead to an enhanced accumulation of AP and active phosphorus in the soil (Table S5, Figure 5).

4.3. Microbes Involved in Phosphorus Cycling under Different Thinning Conditions

Thinning alters the stand density and forest microenvironments, changes soil physical and chemical properties, and promotes the regeneration of understory vegetation, ultimately affecting the composition and structure of microbial communities [53]. Acidobacteria, Proteobacteria, and Actinobacteria are the dominant phyla involved in the phosphorus cycling process in C. lanceolata plantations [54]. Generally, changes in the relative abundance of the dominant microbial phyla are synchronized with their corresponding contributions to phosphorus cycling functional genes [29]. In the current study, the changes in the relative abundances of Acidobacteria, Proteobacteria, and Actinobacteria were roughly similar to the changes in their contributions to 23 phosphorus-related functional genes (Figure 3). For example, an increase in the thinning intensity resulted in an enhancement in the relative abundance of Acidobacteria and the contribution of this phylum to the 23 functional genes related to phosphorus. Conversely, the contribution of Actinobacteria to these functional genes decreased as the thinning intensity increased. Acidobacteria was the dominant group, which may be related to the generally weakly acidic soil in southern C. lanceolata plantations; an acidic environment is favorable for Acidobacteria [33,55]. The increase in the relative abundance of Acidobacteria was accompanied by an increase in the AP and active phosphorus contents (Figure S2, Table 1). This was likely due to the substantial contribution of Acidobacteria to the genes encoding PQQ-GDH, acid phosphatases, and alkaline phosphatases (gcd, phoA, phoD, and phoN). Among these genes, gcd and phoN are key functional genes for inorganic phosphorus solubilization and organic phosphorus mineralization, indicating that Acidobacteria may be the primary microbial phylum mediating soil phosphorus transformation processes, especially as the thinning intensity increases. Actinobacteria contributes significantly to the genes encoding a phosphodiesterase (rne) and proteins involved in organic acid synthesis (ldh, aldh2), which are important for soil phosphorus solubilization and mineralization, thereby influencing the utility of soil phosphorus [29,56]. Wang et al. [56] also determined that Actinobacteria, which comprises common phosphorus-dissolving bacteria in soils, was significantly positively associated with the levels of AP. Moreover, Proteobacteria contribute the most to phosphorus absorption and transport genes, especially genes encoding phosphonic ester and phosphate transporters (e.g., phnC, ugpA). Li et al. [29] reported that Proteobacteria contributes the most to the genes of organic phosphorus mineralization in wetland ecosystems, indicating that soil phosphorus cycling microbe functional dominance can vary among ecosystems [42].
Considered together, the study findings suggest increasing the thinning intensity can increase the genetic potential of microbes mediating organic acid synthesis and secretion as well as the hydrolytic enzyme activities involved in mineralizing phosphates and phosphonates, ultimately promoting the conversion of stable phosphorus to labile phosphorus. More specifically, increases in the thinning intensity enhance the ability of soil microorganisms to dissolve inorganic phosphorus and mineralize organic phosphorus, while weakening their capacity to absorb and transport phosphorus. This can lead to an increase in the utility of phosphorus in soils.

5. Conclusions

According to our results, the functional genes related to soil phosphorus cycling and microbial community compositions in C. lanceolata plantations differ significantly among thinning treatments. The soil pH was identified as the principal factor driving the alterations in microbial genes linked to soil phosphorus cycling. As the thinning intensity increased, the genes associated with inorganic phosphorus solubilization accumulated, while the relative abundance of the genes linked to phosphorus uptake and transport decreased. Proteobacteria, Acidobacteria, and Actinobacteria were identified as the primary contributors to the functional genes linked to soil phosphorus cycling, making them the key microbial groups involved in the associated processes. These findings support the hypothesis that increasing the thinning intensity can effectively promote the solubilization of microbial inorganic phosphorus and the mineralization of organic phosphorus, while inhibiting microbial phosphorus uptake and transport, thereby facilitating the accumulation of AP and labile phosphorus in the soil. These results provide valuable insights for improving the management practices of C. lanceolata plantations to mitigate the decreases in soil fertility caused by phosphorus limitation and other related issues. However, considering that this study did not consider the effects of sampling locations, seasonal dynamics, plant physiological characteristics, phosphorus content in various organs, and inter-root effects on soil phosphorus cycling, the follow-up study should also combine the factors above to comprehensively explore the mechanism of soil phosphorus cycling affected by thinning.

Supplementary Materials

The following supporting information can be downloaded at: https://www.mdpi.com/article/10.3390/f15030440/s1, Table S1: Summary of the metagenomic sequencing data for nine soil samples; Table S2: KO number, function, name, and phosphorus cycling functional classification of the investigated genes according to the KEGG database; Table S3: Stand profile of the sample plots; Table S4: Basic soil properties of Cunninghamia lanceolata plantations after different thinning treatments; Table S5: Correlation between soil properties and P fractions under different thinning intensities (mean ± SD, n = 3); Table S6: Redundancy analysis results for the soil phosphorus cycling genes and soil physicochemical factors; Figure S1: Differences in the relative abundances of soil phosphorus cycling microbial genes after different thinning treatments (mean ± standard deviation; n = 3); Figure S2: Differences in the relative abundance of soil phosphorus cycling microbial communities after different thinning treatments; Figure S3: Principal coordinate analysis plot of the microbial community compositions after different thinning treatments; Figure S4: Functional genes involved in the phosphorus cycling in Cunninghamia lanceolata plantations; Figure S5: Linear fit of the relationship between AP + labile P and the abundances of the genes involved in phosphorus cycling; Figure S6: Linear fit of the relationship between the soil pH and the relative abundances of genes involved in phosphorus cycling.

Author Contributions

K.L. conceptualized the experimental question and defined the objectives and analytical tools. J.W. and K.C. carried out the field experiments. Soil sampling, lab work, data collection, and analysis were performed by D.M. and W.L. Y.Y. and X.M. guided the work of determining soil phosphorus components. X.M. supervised the project. The first draft of the manuscript was written by D.M. All authors have read and agreed to the published version of the manuscript.

Funding

This work was funded by the Density Control Technology for Cultivating Large-Diameter Unnoded Fir Timber under the National Key R&D Program of the 14th Five-Year Plan (2021YFD2201302); Research on High-Efficiency Cultivation Technology for Large-Diameter Fir Timber under the 13th Five-Year Plan of the National Key Research and Development Program (2016YFD0600301); Effects of Combined Thinning and Fertilization on Soil Microbial Residues in Cedar Plantation Forests and their Regulatory Mechanisms on Organic Carbon Accumulation (2021J01058); and Fujian Agriculture and Forestry University Forestry Peak Discipline Construction Project (72202200205).

Data Availability Statement

The data are available on request from the corresponding authors.

Conflicts of Interest

The authors declare that the research was conducted in the absence of any commercial or financial relationships that could be construed as potential conflict of interests.

References

  1. George, T.S.; Giles, C.D.; Menezes-Blackburn, D.; Condron, L.M.; Gama-Rodrigues, A.C.; Jaisi, D.; Lang, F. Organic Phosphorus in the Terrestrial Environment: A Perspective on the State of the Art and Future Priorities. Plant Soil 2017, 427, 191–208. [Google Scholar] [CrossRef]
  2. Hu, B.; Yang, B.; Pang, X.Y.; Bao, W.; Tian, G.L. Responses of Soil Phosphorus Fractions to Gap Size in a Reforested Spruce Forest. Geoderma 2016, 279, 61–69. [Google Scholar] [CrossRef]
  3. Cui, H.; Ou, Y.; Wang, L.X.; Wu, H.T.; Yan, B.X.; Li, Y.X. Distribution and Release of Phosphorus Fractions Associated with Soil Aggregate Structure in Restored Wetlands. Chemosphere 2019, 223, 319–329. [Google Scholar] [CrossRef] [PubMed]
  4. Liu, Y.; Zhang, G.H.; Luo, X.Z.; Hou, E.Q.; Zheng, M.H.; Zhang, L.L.; He, X.J.; Shen, W.J.; Wen, D.Z. Mycorrhizal Fungi and Phosphatase Involvement in Rhizosphere Phosphorus Transformations Improves Plant Nutrition During Subtropical Forest Succession. Soil Biol. Biochem. 2021, 153, 108099. [Google Scholar] [CrossRef]
  5. Rodrigues, M.; Pavinato, P.S.; Withers, P.J.; Teles, A.P.; Herrera, W.F. Legacy Phosphorus and No Tillage Agriculture in Tropical Oxisols of the Brazilian Savanna. Sci. Total Environ. 2016, 542, 1050–1061. [Google Scholar] [CrossRef] [PubMed]
  6. Zhang, X.Y.; Yang, Y.; Zhang, C.; Niu, S.L.; Yang, H.; Yu, G.R.; Wang, H.M.; Blagodatskaya, E.; Kuzyakov, Y.; Tian, D.S.; et al. Contrasting Responses of Phosphatase Kinetic Parameters to Nitrogen and Phosphorus Additions in Forest Soils. Funct. Ecol. 2018, 32, 106–116. [Google Scholar] [CrossRef]
  7. Fang, X.M.; Zhang, X.L.; Zong, Y.Y.; Zhang, Y.; Wan, S.Z.; Bu, W.S.; Chen, F.S. Soil Phosphorus Functional Fractions and Tree Tissue Nutrient Concentrations Influenced by Stand Density in Subtropical Chinese Fir Plantation Forests. PLoS ONE 2017, 12, e0186905. [Google Scholar] [CrossRef] [PubMed]
  8. Zhu, F.F.; Lu, X.K.; Mo, J.M. Phosphorus Limitation on Photosynthesis of Two Dominant Understory Species in a Lowland Tropical Forest. J. Plant Ecol. 2014, 7, 526–534. [Google Scholar] [CrossRef]
  9. Chen, F.S.; Niklas, K.J.; Liu, Y.; Fang, X.M.; Wan, S.Z.; Wang, H.M. Nitrogen and Phosphorus Additions Alter Nutrient Dynamics but Not Resorption Efficiencies of Chinese Fir Leaves and Twigs Differing in Age. Tree Physiol. 2015, 35, 1106–1117. [Google Scholar] [CrossRef]
  10. Bergkemper, F.; Schöler, A.; Engel, M.; Lang, F.; Krüger, J.; Schloter, M.; Schulz, S. Phosphorus Depletion in Forest Soils Shapes Bacterial Communities Towards Phosphorus Recycling Systems. Environ. Microbiol. 2016, 8, 2767. [Google Scholar]
  11. Dai, Z.M.; Liu, G.F.; Chen, H.H.; Chen, C.R.; Wang, J.K.; Ai, S.Y.; Wei, D.; Li, D.M.; Ma, B.; Brookes, P.C. Long-Term Nutrient Inputs Shift Soil Microbial Functional Profiles of Phosphorus Cycling in Diverse Agroecosystems. ISME J. 2020, 14, 757–770. [Google Scholar] [CrossRef]
  12. Rawat, P.; Das, S.; Shankhdhar, D.; Shankhdhar, S.C. Phosphate-Solubilizing Microorganisms: Mechanism and Their Role in Phosphate Solubilization and Uptake. J. Soil Sci. Plant Nutr. 2021, 21, 49–68. [Google Scholar] [CrossRef]
  13. Pradhan, A.; Pahari, A.; Mohapatra, S.; Mishra, B.B. Phosphate-Solubilizing Microorganisms in Sustainable Agriculture: Genetic Mechanism and Application. In Advances in Soil Microbiology: Recent Trends and Future Prospects: Volume 2: Soil-Microbe-Plant Interaction; Adhya, T.K., Mishra, B.B., Annapurna, K., Verma, D.K., Kumar, U., Eds.; Springer Singapore: Singapore, 2017; pp. 81–97. [Google Scholar]
  14. Yao, Q.M.; Li, Z.; Song, Y.; Wright, S.J.; Guo, X.; Tringe, S.G.; Tfaily, M.M.; Pasa-Tolic, L.; Hazen, T.C.; Turner, B.L.; et al. Community Proteogenomics Reveals the Systemic Impact of Phosphorus Availability on Microbial Functions in Tropical Soil. Nat. Ecol. Evol. 2018, 2, 499–509. [Google Scholar] [CrossRef]
  15. Lu, J.L.; Jia, P.; Feng, S.W.; Wang, Y.T.; Zheng, J.; Ou, S.N.; Wu, Z.H.; Liao, B.; Shu, W.S.; Liang, J.L.; et al. Remarkable Effects of Microbial Factors on Soil Phosphorus Bioavailability: A Country-Scale Study. Glob. Chang. Biol. 2022, 28, 4459–4471. [Google Scholar] [CrossRef]
  16. Wang, C.Q.; Xue, L.; Jiao, R.Z. Soil Phosphorus Fractions, Phosphatase Activity, and the Abundance of Phoc and Phod Genes Vary with Planting Density in Subtropical Chinese Fir Plantations. Soil Tillage Res. 2021, 209, 104946. [Google Scholar] [CrossRef]
  17. Richardson, A.E.; Simpson, R.J. Soil Microorganisms Mediating Phosphorus Availability Update on Microbial Phosphorus. Plant Physiol. 2011, 156, 989–996. [Google Scholar] [CrossRef] [PubMed]
  18. Grafe, M.; Goers, M.; von Tucher, S.; Baum, C.; Zimmer, D.; Leinweber, P.; Vestergaard, G. Bacterial Potentials for Uptake, Solubilization and Mineralization of Extracellular Phosphorus in Agricultural Soils Are Highly Stable under Different Fertilization Regimes. Environ. Microbiol. Rep. 2018, 10, 320–327. [Google Scholar] [CrossRef] [PubMed]
  19. Hsieh, Y.J.; Wanner Barry, L. Global Regulation by the Seven-Component Pi Signaling System. Curr. Opin. Microbiol. 2010, 13, 198–203. [Google Scholar] [CrossRef] [PubMed]
  20. Hu, X.J.; Gu, H.D.; Liu, J.J.; Wei, D.; Zhu, P.; Cui, X.A.; Zhou, B.K.; Chen, X.L.; Jin, J.; Liu, X.B.; et al. Metagenomic Strategies Uncover the Soil Bioavailable Phosphorus Improved by Organic Fertilization in Mollisols. Agric. Ecosyst. Environ. 2023, 349, 108462. [Google Scholar] [CrossRef]
  21. Chen, J.Q.; Zhao, G.Y.; Wei, Y.H.; Dong, Y.H.; Hou, L.Y.; Jiao, R.Z. Isolation and Screening of Multifunctional Phosphate Solubilizing Bacteria and Its Growth-Promoting Effect on Chinese Fir Seedlings. Sci. Rep. 2021, 11, 9081. [Google Scholar] [CrossRef]
  22. Wang, S.L.; Zhang, W.D.; Sanchez, F. Relating Net Primary Productivity to Soil Organic Matter Decomposition Rates in Pure and Mixed Chinese Fir Plantations. Plant Soil 2010, 334, 501–510. [Google Scholar] [CrossRef]
  23. Ye, Y.; Sun, X.; Zhao, J.; Chen, X.; Wang, M.; Li, J.; Guan, Q. Thinning Alters the Network Patterns and Keystone Taxa of Rhizosphere Soil Microbial Communities in Chinese Fir Plantation. Appl. Soil Ecol. 2023, 189, 104956. [Google Scholar] [CrossRef]
  24. Wic Baena, C.; Andrés-Abellán, M.; Lucas-Borja, M.E.; Martínez-García, E.; García-Morote, F.A.; Rubio, E.; López-Serrano, F.R. Thinning and Recovery Effects on Soil Properties in Two Sites of a Mediterranean Forest, in Cuenca Mountain (South-Eastern of Spain). For. Ecol. Manag. 2013, 308, 223–230. [Google Scholar] [CrossRef]
  25. Mosca, E.; Montecchio, L.; Scattolin, L.; Garbaye, J. Enzymatic Activities of Three Ectomycorrhizal Types of Quercus robur L. in Relation to Tree Decline and Thinning. Soil Biol. Biochem. 2007, 39, 2897–2904. [Google Scholar] [CrossRef]
  26. Overby, S.T.; Hart, S.C. Short-Term Belowground Responses to Thinning and Burning Treatments in Southwestern Ponderosa Pine Forests of the USA. Forests 2016, 7, 45. [Google Scholar] [CrossRef]
  27. Zhou, T.; Wang, C.K.; Zhou, Z.H. Thinning Promotes the Nitrogen and Phosphorous Cycling in Forest Soils. Agric. For. Meteorol. 2021, 311, 108665. [Google Scholar] [CrossRef]
  28. Li, Y.; Zhang, J.; Gong, Z.; Xu, W.L.; Mou, Z. Gcd Gene Diversity of Quinoprotein Glucose Dehydrogenase in the Sediment of Sancha Lake and Its Response to the Environment. Int. J. Environ. Res. Public Health 2018, 16, 1. [Google Scholar] [CrossRef] [PubMed]
  29. Li, M.; Hao, Y.B.; Yan, Z.Q.; Kang, E.; Wang, J.Z.; Zhang, K.R.; Li, Y.; Wu, H.D.; Kang, X.M. Long-Term Degradation from Marshes into Meadows Shifts Microbial Functional Diversity of Soil Phosphorus Cycling in an Alpine Wetland of the Tibetan Plateau. Land Degrad. Dev. 2022, 33, 628–637. [Google Scholar] [CrossRef]
  30. Lu, D.J.; Li, C.Z.; Sokolwski, E.; Magen, H.; Chen, X.Q.; Wang, H.Y.; Zhou, J.M. Crop Yield and Soil Available Potassium Changes as Affected by Potassium Rate in Rice–Wheat Systems. Field Crops Res. 2017, 214, 38–44. [Google Scholar] [CrossRef]
  31. Börling, K.; Otabbong, E.; Barberis, E. Phosphorus Sorption in Relation to Soil Properties in Some Cultivated Swedish Soils. Nutr. Cycl. Agroecosystems 2001, 59, 39–46. [Google Scholar] [CrossRef]
  32. Guo, F.M.; Yost Russell, S. Partitioning Soil Phosphorus into Three Discrete Pools of Differing Availability. Soil Sci. 1998, 163, 822–833. [Google Scholar] [CrossRef]
  33. Liang, J.L.; Liu, J.; Jia, P.; Yang, T.T.; Zeng, Q.W.; Zhang, S.C.; Liao, B.; Shu, W.S.; Li, J.T. Novel Phosphate-Solubilizing Bacteria Enhance Soil Phosphorus Cycling Following Ecological Restoration of Land Degraded by Mining. ISME J. 2020, 14, 1600–1613. [Google Scholar] [CrossRef]
  34. Bowman, R.A.; Cole, C.V. Anexploratory method for fractionation of organic phosphorus from grassland soils. Soil Sci. 1978, 125, 95–101. [Google Scholar] [CrossRef]
  35. Chun, X.; Zhao, Y.S.; Xin, Y.; Li, J.X.; Liang, D.Z. Soil Phosphorus Forms and Phosphorus Solubilizing Bacteria Distribution after Restoration from Seriously Burning in Greater Khingan Mountain Areas, China. Chin. J. Appl. Ecol. 2020, 31, 388–398. (In Chinese) [Google Scholar]
  36. Johnson, A.H.; Frizano, J.; Vann, D.R. Biogeochemical Implications of Labile Phosphorus in Forest Soils Determined by the Hedley Fractionation Procedure. Oecologia 2003, 135, 487–499. [Google Scholar] [CrossRef] [PubMed]
  37. De Schrijver, A.; Vesterdal, L.; Hansen, K.; De Frenne, P.; Augusto, L.; Achat, D.L.; Staelens, J.; Baeten, L.; De Keersmaeker, L.; De Neve, S.; et al. Four Decades of Post-Agricultural Forest Development Have Caused Major Redistributions of Soil Phosphorus Fractions. Oecologia 2012, 169, 221–234. [Google Scholar] [CrossRef] [PubMed]
  38. Wang, S.Q.; Song, M.H.; Wang, C.M.; Dou, X.M.; Wang, X.Q.; Li, X.Y. Mechanisms Underlying Soil Microbial Regulation of Available Phosphorus in a Temperate Forest Exposed to Long-Term Nitrogen Addition. Sci. Total Environ. 2023, 904, 166403. [Google Scholar] [CrossRef] [PubMed]
  39. Khan, M.S.; Zaidi, A.; Ahemad, M.; Oves, M.; Wani, P.A. Plant Growth Promotion by Phosphate Solubilizing Fungi—Current Perspective. Arch. Agron. Soil Sci. 2010, 56, 73–98. [Google Scholar] [CrossRef]
  40. Bai, J.H.; Ye, X.; Jia, J.; Zhang, G.; Zhao, Q.; Cui, B.; Liu, X. Phosphorus sorption-desorption and effects of temperature, pH and salinity on phosphorus sorption in marsh soils from coastal wetlands with different flooding conditions. Chemosphere 2017, 188, 677–688. [Google Scholar] [CrossRef]
  41. Reed, S.C.; Townsend, A.R.; Taylor, P.G.; Cleveland, C.C. Phosphorus Cycling in Tropical Forests Growing on Highly Weathered Soils. In Phosphorus in Action. Soil Biology; Bünemann, E., Oberson, A., Frossard, E., Eds.; Springer: Berlin/Heidelberg, Germany, 2021; Volume 26. [Google Scholar]
  42. Li, M.; Cozzolino, V.; Mazzei, P.; Drosos, M.; Monda, H.; Hu, Z.; Piccolo, A. Effects of Microbial Bioeffectors and P Amendements on P Forms in a Maize Cropped Soil as Evaluated by 31p–Nmr Spectroscopy. Plant Soil 2018, 427, 87–104. [Google Scholar] [CrossRef]
  43. Alori, E.T.; Glick, B.R.; Babalola, O. Microbial Phosphorus Solubilization and Its Potential for Use in Sustainable Agriculture. Front. Microbiol. 2017, 8, 971. [Google Scholar] [CrossRef]
  44. Mori, T.; Wang, S.H.; Wang, C.; Chen, J.; Peng, C.; Zheng, M.H.; Huang, J.; Wang, F.M.; Liu, Z.F.; Mo, J.M.; et al. Effects of Long-Term Phosphorus Addition on Soil Ratios of Phosphomonoesterase to Phosphodiesterase in Three Tropical Forests. J. Plant Ecol. 2023, 16, rtac091. [Google Scholar] [CrossRef]
  45. Ragot, S.A.; Kertesz, M.A.; Bünemann, E.K. Phod Alkaline Phosphatase Gene Diversity in Soil. Appl. Environ. Microbiol. 2015, 81, 7281–7289. [Google Scholar] [CrossRef]
  46. Wu, Z.; Haack, S.E.; Lin, W.; Li, B.; Wu, L.; Fang, C.; Zhang, Z. Soil Microbial Community Structure and Metabolic Activity of Pinus Elliottii Plantations across Different Stand Ages in a Subtropical Area. PLoS ONE 2015, 10, e0135354. [Google Scholar] [CrossRef]
  47. Zhi, R.; Deng, J.; Xu, Y.; Xu, M.; Zhang, S.; Han, X.; Yang, G.; Ren, C. Altered Microbial P Cycling Genes Drive P Availability in Soil after Afforestation. J. Environ. Manag. 2023, 328, 116998. [Google Scholar] [CrossRef] [PubMed]
  48. Tan, H.; Barret, M.; Mooij, M.J.; Rice, O.; Morrissey, J.P.; Dobson, A.; Griffiths, B.; O’Gara, F. Long-Term Phosphorus Fertilisation Increased the Diversity of the Total Bacterial Community and the Phod Phosphorus Mineraliser Group in Pasture Soils. Biol. Fertil. Soils 2013, 49, 661–672. [Google Scholar] [CrossRef]
  49. Liu, J.; Cade-Menun, B.J.; Yang, J.; Hu, Y.; Liu, C.W.; Tremblay, J.; LaForge, K. Long-Term Land Use Affects Phosphorus Speciation and the Composition of Phosphorus Cycling Genes in Agricultural Soils. Front. Microbiol. 2018, 9, 1643. [Google Scholar] [CrossRef] [PubMed]
  50. Santos-Torres, M.; Romero-Perdomo, F.; Mendoza-Labrador, J.; Gutiérrez, A.Y.; Vargas, C.; Castro-Rincon, E.; Caro-Quintero, A.; Uribe-Velez, D.; Estrada-Bonilla, G.A. Genomic and Phenotypic Analysis of Rock Phosphate-Solubilizing Rhizobacteria. Rhizosphere 2021, 17, 100290. [Google Scholar] [CrossRef]
  51. Song, K.; Wang, Z.; Du, J.; Liu, L.; Zeng, L.; Ren, C. Wetland Degradation: Its Driving Forces and Environmental Impacts in the Sanjiang Plain, China. Environ. Manag. 2014, 54, 255–271. [Google Scholar] [CrossRef] [PubMed]
  52. Teng, Z.; Zhu, Y.; Li, M.; Whelan, M.J. Microbial Community Composition and Activity Controls Phosphorus Transformation in Rhizosphere Soils of the Yeyahu Wetland in Beijing, China. Sci. Total Environ. 2018, 628–629, 1266–1277. [Google Scholar] [CrossRef] [PubMed]
  53. Pang, X.; Bao, W.; Zhu, B.; Cheng, W. Responses of Soil Respiration and Its Temperature Sensitivity to Thinning in a Pine Plantation. Agric. For. Meteorol. 2013, 171–172, 57–64. [Google Scholar] [CrossRef]
  54. Ma, B.; Stirling, E.; Liu, Y.; Zhao, K.; Zhou, J.; Singh, B.K.; Tang, C.; Dahlgren, R.A.; Xu, J. Soil Biogeochemical Cycle Couplings Inferred from a Function-Taxon Network. Research 2021, 2021, 7102769. [Google Scholar] [CrossRef] [PubMed]
  55. Huang, L.M.; Jia, X.X.; Zhang, G.L.; Shao, M.A. Soil Organic Phosphorus TransformationDuring Ecosystem Development: A Review. Plant Soil 2017, 417, 17–42. [Google Scholar] [CrossRef]
  56. Wang, H.; Teng, C.; Li, H.; Sun, X.; Jiang, C.; Lou, L.; Yue, C.; Zhang, Z. Microbial Community Shifts Trigger Loss of Orthophosphate in Wetland Soils Subjected to Experimental Warming. Plant Soil 2018, 424, 351–365. [Google Scholar] [CrossRef]
Figure 1. Non-metric multidimensional scaling (based on the Bray–Curtis distance) of phosphorus cycling functional genes in response to different thinning intensities. The solid line represents the 95% confidence interval.
Forests 15 00440 g001
Figure 2. Differences in the relative abundances of phosphorus cycling-related functional genes in response to different thinning intensities (mean ± standard deviation; n = 3). The genes were classified according to their functions. (a) Four phosphorus cycling categories. (b) Organic acid formation. (c) Fifteen phosphorus cycling functional groups. WT: weak thinning; MT: moderate thinning; HT: moderate thinning. * and ** represent significant correlations at p < 0.05 and p < 0.01, respectively.
Forests 15 00440 g002
Figure 3. Contributions of the soil microorganisms involved in phosphorus cycling to the relative abundances of 23 key phosphorus cycling genes related to (a) inorganic phosphorus solubilization, (b) phosphorus transport, (c) phosphorus starvation response regulation, and (d) organic phosphorus mineralization. WT: weak thinning; MT: moderate thinning; HT: moderate thinning.
Forests 15 00440 g003
Figure 4. Heatmap of the correlations between soil properties, phosphorus status, phosphorus fractions, and the genes involved in soil phosphorus cycling. * and ** represent significant correlations at p < 0.05 and p < 0.01, respectively.
Forests 15 00440 g004
Figure 5. Structural equation model presenting the direct and indirect effects of thinning on soil phosphorus availability. The width of the solid lines is directly proportional to the significance of the relationship between variables, with solid and dashed lines representing positive and negative correlations, respectively. CMIN/DF, chi-square minimum/degrees of freedom; TLI, Tucker–Lewis index; CFI, comparative fit index; RMSEA, root mean square error of approximation. *, **, and *** represent significant correlations at p < 0.05, p < 0.01, and p < 0.001, respectively.
Forests 15 00440 g005
Table 1. Soil phosphorus fractions in Cunninghamia lanceolata plantations under different thinning intensities.
ItemWeak ThinningModerate ThinningHeavy Thinning
TP/mg kg−1682.8 ± 39.1 b738.9 ± 41.5 ab816.4 ± 56.2 a
AP/mg kg−12.9 ± 0.12 b3.1 ± 0.2 ab3.5 ± 0.2 a
OP/mg kg−1262.5 ± 19.1 b362.3 ± 24.9 a341.1 ± 24.5 a
MBP/mg kg−120.3 ± 4.4 b25.8 ± 5.4 ab33.2 ± 7.3 a
H2O-Pi/mg kg−13.3 ± 0.9 b4.8 ± 1.0 b9.3 ± 1.7 a
H2O-Po/mg kg−115.2 ± 2.7 a22.7 ± 3.7 a21.2 ± 3.7 a
NaHCO3-Pi/mg kg−115.4 ± 2.3 ab12.2 ± 3.0 b20.1 ± 3.6 a
NaHCO3-Po/mg kg−135.7 ± 5.9 a44.4 ± 5.9 a45.4 ± 5.3 a
NaOH-Pi/mg kg−155.8 ± 8.1 a76.2 ± 9.4 b88.1 ± 11.2 b
NaOH-Po/mg kg−1100.3 ± 12.7 a154.4 ± 15.8 b138.5 ± 18.4 b
HCl-Pi/mg kg−137.9 ± 9.3 a31.7 ± 7.5 a41.0 ± 8.3 a
HCl-Po/mg kg−1111.9 ± 13.2 b139.8 ± 14.9 a133.6 ± 10.1 ab
Residual-P/mg kg−1290.9 ± 36.5 a246.4 ± 34.3 a303.5 ± 47.5 a
Note: mean ± standard deviation (mean ± SD, n = 3). Different lowercase letters (ab) indicate the significance between different thinning intensities at p < 0.05.
Disclaimer/Publisher’s Note: The statements, opinions and data contained in all publications are solely those of the individual author(s) and contributor(s) and not of MDPI and/or the editor(s). MDPI and/or the editor(s) disclaim responsibility for any injury to people or property resulting from any ideas, methods, instructions or products referred to in the content.

