Abstract
Variability in the effects of disturbances and extreme climate events can lead to changes in tree cover over time, including partial or complete loss, with diverse ecological consequences. It is therefore critical to identify in space and time the change processes that lead to tree cover change. Studies of change are often hampered by the lack of data capable of consistently detecting different types of change. Using the Landsat satellite record to create a long time-series of land cover and land cover change, the U.S. Geological Survey Land Change Monitoring Assessment and Projection (LCMAP) project has made an annual time series of land cover across the conterminous United States for the period 1985 to 2018. Multiple LCMAP products analyzed together with map validation reference plots provide a robust basis for understanding tree cover change. In LCMAP (Collection 1.2), annual change detection is based on harmonic model breaks calculated at each Landsat pixel from the Continuous Change Detection and Classification (CCDC) algorithm. The results showed that the majority of CCDC harmonic model breaks (signifying change) indicated partial tree cover loss (associated with management practices such as tree cover thinning) as compared to complete tree cover loss (associated with practices like clearcut harvest or fire disturbance). Substantially fewer occurrences of complete tree cover loss were associated with change in land cover state. The area of annual tree cover change increased after the late 1990s and stayed high for the rest of the study period. The reference data showed that tree harvest dominated across the conterminous United States. The majority of tree cover change occurred in evergreen forests. Large estimates of disturbance-related tree cover change indicated that tree cover loss may have previously been underreported due to omission of partial tree cover loss in prior studies. This has considerable implications for forest carbon accounting along with tracking ecosystem goods and services.
1. Introduction
Information on the patterns of tree cover change associated with forest disturbances and interannual climate variability is essential for the effective management and conservation of tree-dominated ecosystems [1,2] and tracking carbon stock fluxes [3,4,5,6]. Historical land use knowledge can also often be important in understanding the above contemporary ecosystems [7,8]. Depending on the type and intensity, the effects of disturbances and extreme climatic events can vary greatly [9,10,11] and hence lead to either changes in tree cover state or condition. In forested environments, the nature of change process and the accompanying type of change influence multiple ecosystem services [12,13,14], including tree-held carbon [15,16], biodiversity [12], hydrological services [17] and macro- and micro-climate regulation [18,19]. Here, we consider disturbances as events that alter the forest environment, thereby engendering changes in species composition, ecosystem structure and carbon budget. Thus, change processes are the immediate causal agents driving disturbance events, and these include fire, logging, insect outbreaks, landslides, windstorms and drought events [5,20]. In addition to altering the distribution, composition, structure and function [21,22], the nature of change process also influences the trajectory of forest responses to disturbances [23,24,25,26]. Thus, in the study of forest disturbances, identifying not only the causal agents but also where these events lead to either complete or partial loss of tree cover is important.
However, studies of change are often hampered by the lack of data products capable of detecting both types of change consistently in space and time [27]. Time-series analyses of satellite remote sensing data enable the investigation of changes in an ecosystem’s state and condition resulting from various disturbances [28,29,30,31]. For instance, methods such as the Landsat-based detection of Trends in disturbance and recovery (LandTrendr) [32] and Vegetation Change Tracker (VCT) [33] algorithms utilize annual time series Landsat-derived spectral indices to detect disturbances. Nonetheless, it is much more challenging to detect and assess change in condition because the changes are mostly muted and of lower magnitude, resulting in more subtle spectral changes [34,35,36]. What makes a remote sensing-based study of change in condition even more challenging is the paucity of reference data to validate the changes detected.
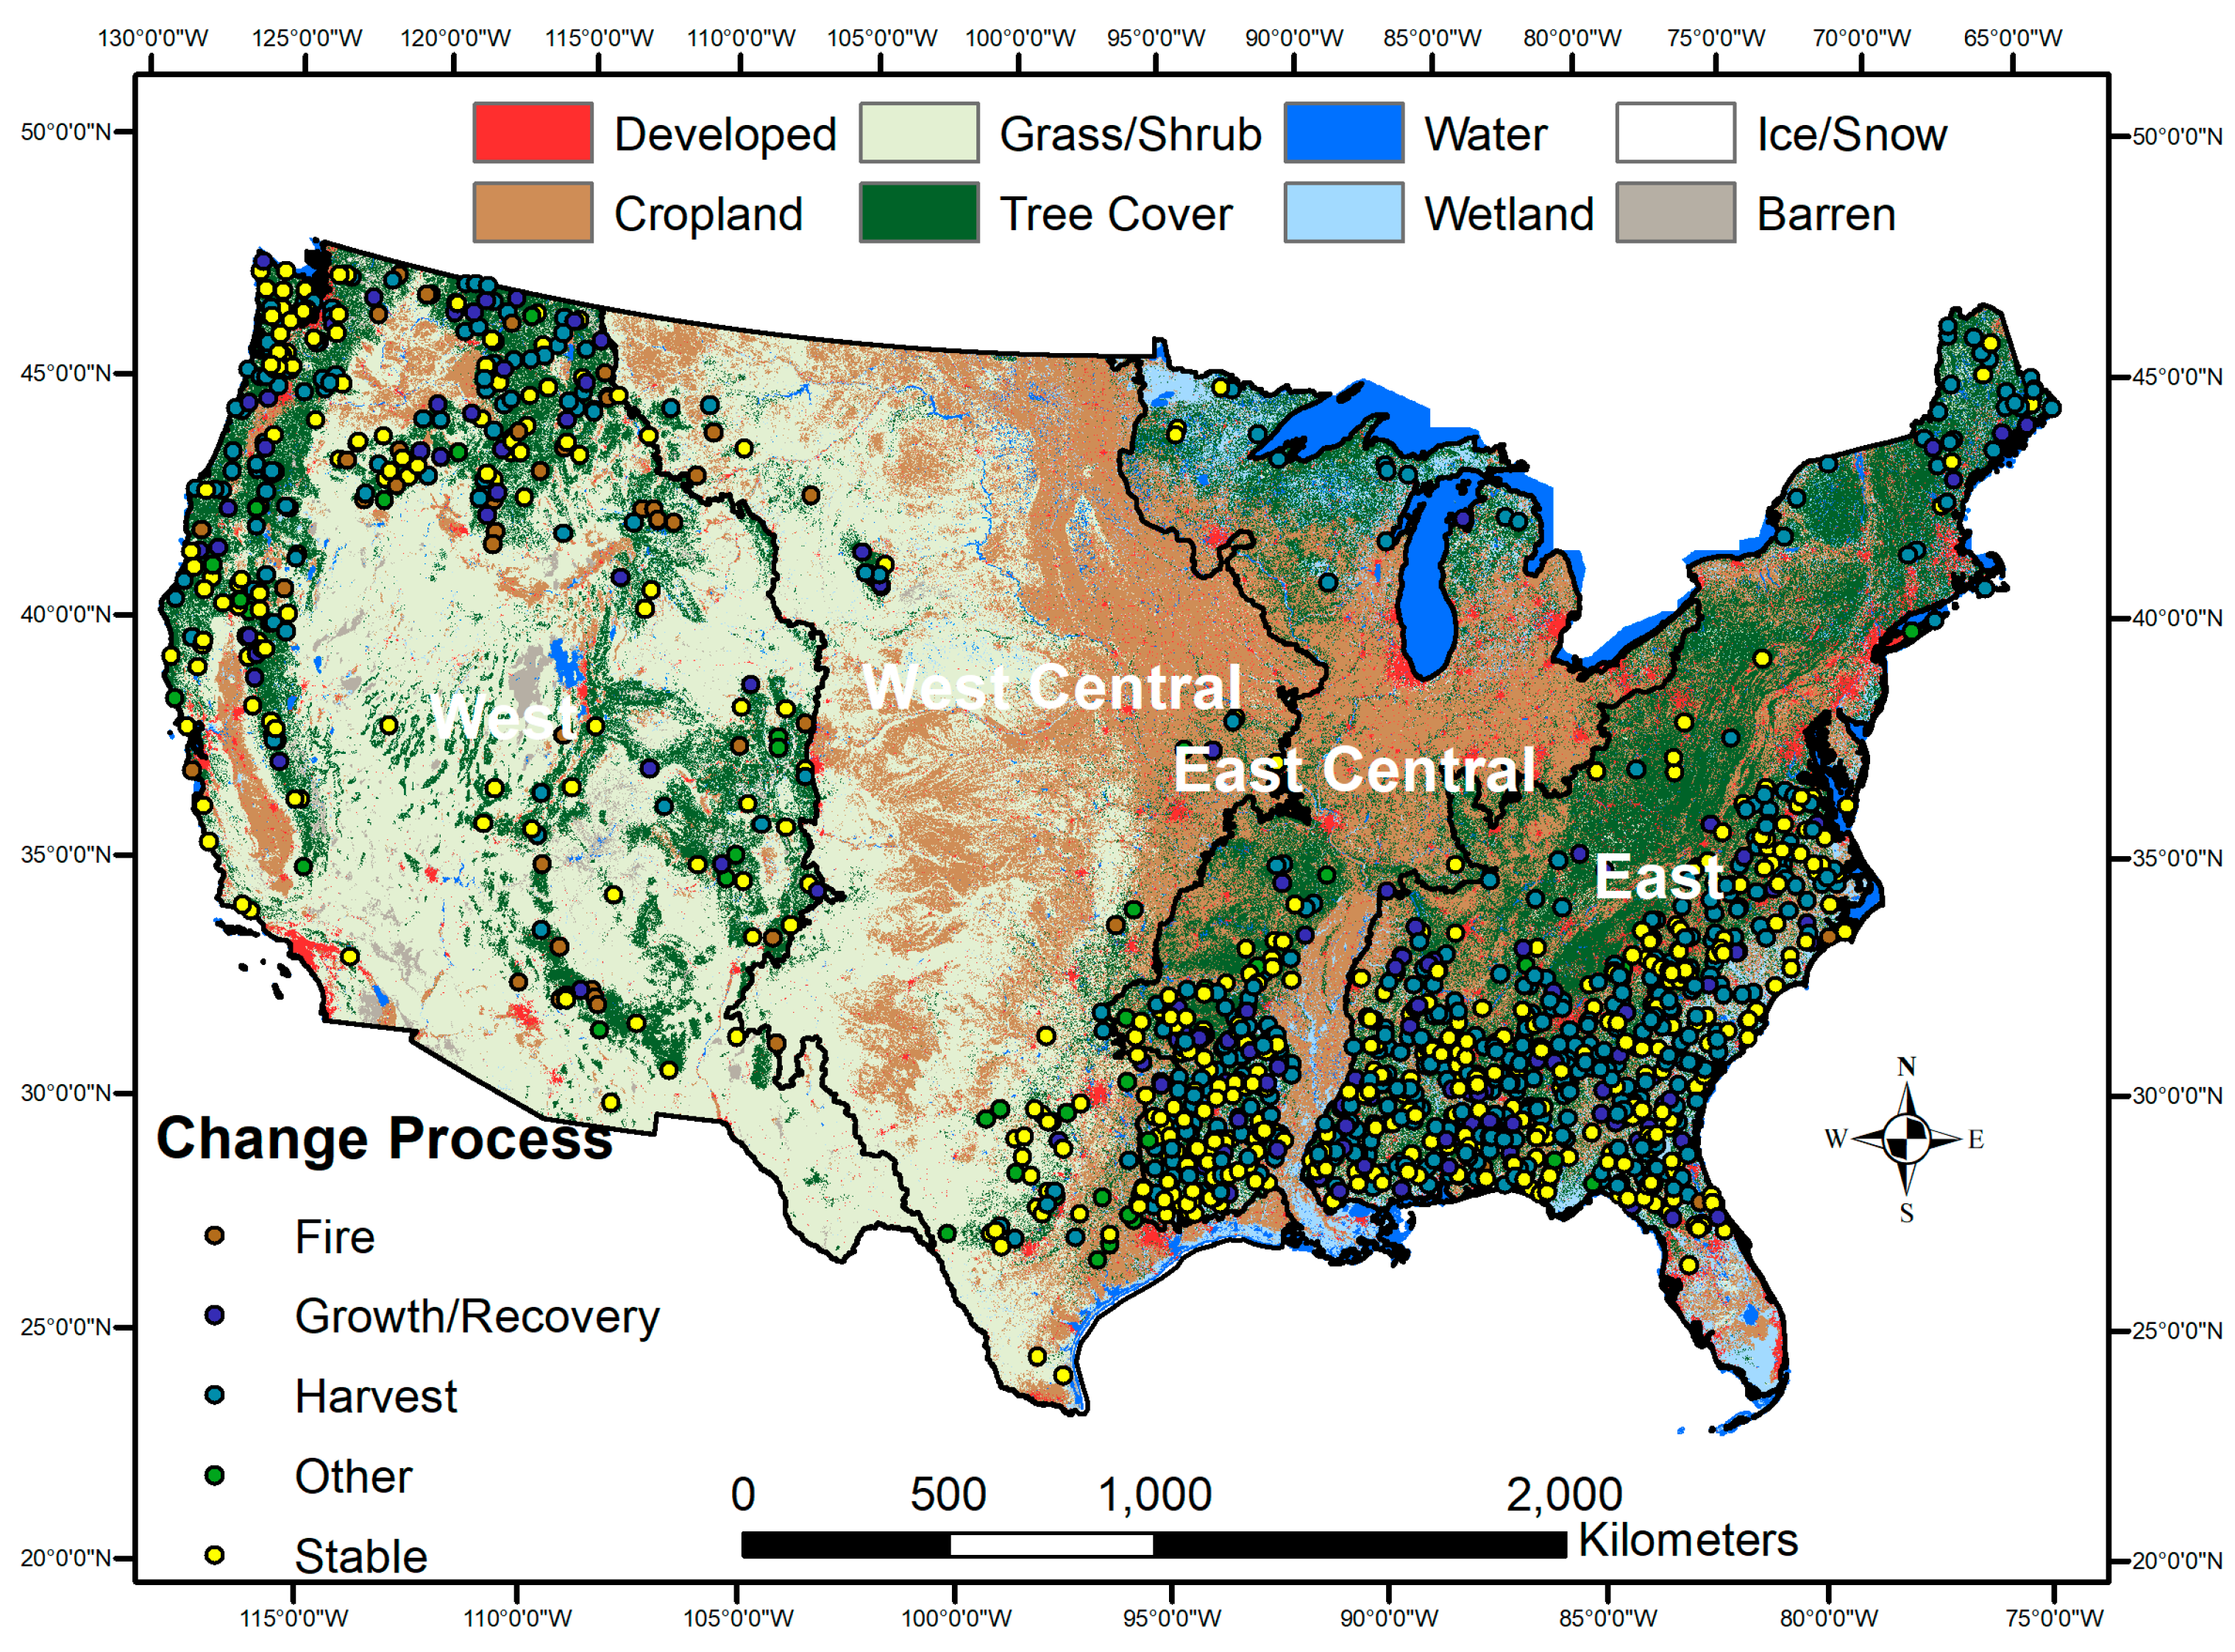
The U.S. Geological Survey (USGS) through its Land Change Monitoring, Assessment and Projection (LCMAP) project developed a suite of data products for characterizing land cover and land surface change across the United States. In particular, multiple LCMAP products can be integrated to investigate not only land cover-type change but also change in land cover condition, thus making LCMAP products suitable for investigating both types of change. In LCMAP (Collection 1.2), change detection is based on model breaks from the Continuous Change Detection and Classification (CCDC) algorithm applied to the Landsat archive [37,38]. The LCMAP project has the unique advantage of having a vast collection of high-quality map validation reference datasets sampled across the entire conterminous United States (CONUS). The availability of the reference dataset detailing annual land cover and change as well as change agents provides a unique capacity for investigating both tree cover conversion and tree cover change in condition over a multi-decadal period across the CONUS. In this study, we explored linkages among LCMAP tree cover change, spectral segment break change and reference dataset tree cover change and change processes to better understand the types and the patterns of tree cover change across the CONUS for the study period 1986–2018 (Figure 1). Our study objective was to characterize tree cover change by major change processes across the CONUS during the study period by analyzing change in both LCMAP map products and reference dataset. Our research questions were:
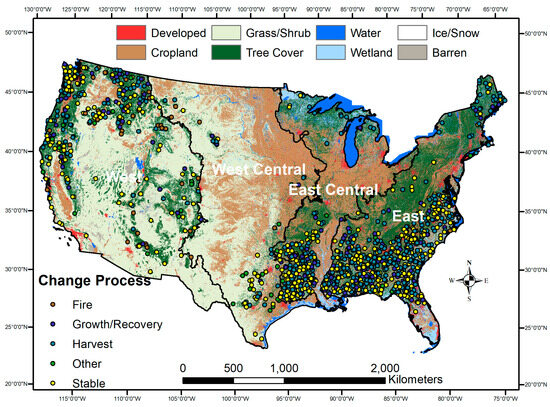
Figure 1.
LCMAP Primary Land Cover (2000) [38] indicating the four mega-regions of CONUS (black boundary). Points on map are location information from the map validation reference data showing the distribution of change processes affecting tree cover change during 1986–2018.
- What proportions of CCDC harmonic model breaks in tree cover were tree cover conversion or change in tree cover condition (partial tree cover change)?
- How accurate was the CCDC harmonic model in detecting change in tree cover over the CONUS?
- How did the CCDC harmonic model breaks differ by forest type?
- What was the distribution of different change processes affecting tree cover in the CONUS during the 1986–2018 study period?
2. Materials and Methods
2.1. Study Area
A two-step spatial scale was used for the study area. The largest geographic area is the entire conterminous United States (CONUS). This area is broken down into four “mega-regions” based on assemblies of U.S. Environmental Protection Agency Level III ecoregions (a 1999 version) that were used in the USGS’ Land Cover Trends project [39,40]. The four mega-regions are almost exactly the same as the large region assemblies used in USGS Professional Paper 1794 [41] and its sub-parts [42,43,44,45].
2.2. Data
2.2.1. Land Cover and Land Change Dataset
Land cover and land change data at an annual frequency provided the temporal specificity to explore the location and timing of change. We obtained annual land cover and land surface change products of LCMAP Collection 1.2 from the USGS Earth Resources Observation and Science (EROS) Center. Thirty-meter resolution LCMAP products are based on the USGS implementation of the Continuous Change Detection and Classification (CCDC) algorithm [29] on the Landsat archive (Collection 1) to monitor land cover and land cover change [37,38]. The LCMAP product suite has ten science products (https://www.usgs.gov/centers/eros/science/usgs-eros-archive-lcmap-continuous-change-detection-classification-v12-ccdc, accessed on 15 March 2023), comprising five spectral change and five landcover products, as shown in Table 1.

Table 1.
LCMAP products dataset. Products used in this study are shown in bold text.
More information on the LCMAP datasets as well as USGS implementation of CCDC can be found in Brown et al. [38]. In this study we used LCPRI, LCACHG, SCTIME and SCMAG (Table 1).
In this study, Tree Cover refers to one of the eight land cover classes in the land cover legend of the LCMAP annual LCPRI product, which is often called “forest” in other mapping efforts. LCMAP defines the tree-cover class as a vegetated land containing 10% or greater tree cover. The LCACHG product provides an indicator of annual land cover change by each of the eight land cover classes. The LCMAP Collection 1.2 land cover product was validated using 26,971 independently collected reference plots distributed across the CONUS. The validation was conducted for each year in the time series and summarized to obtain overall accuracy across all years. Aside from the CONUS, the validation was also conducted for the four mega regions, namely west, west central, east central and east [46,47]. The primary land cover exhibited consistently high classification accuracy throughout the time series, with 82.6% overall accuracy across all years [46].
2.2.2. LCMAP Reference Dataset
The LCMAP reference dataset was used to evaluate map-derived change in tree cover as well as to provide a summary of their associated change processes. LCMAP has a spatial database of reference dataset (https://www.sciencebase.gov/catalog/item/5e42e54be4b0edb47be84535, accessed on 15 March 2023) obtained through visual interpretation of high-resolution imagery along with an ancillary dataset by trained interpreters using a Landsat time series visualization and data collection tool called TimeSync [47,48,49]. This reference dataset consists of just under 25,000 plots (size of a Landsat pixel, 30 m × 30 m) randomly selected across CONUS for the years 1984–2018. An additional 2000 reference samples were selected from the LCACHG maps derived from leading types of change found in the reference dataset and binned into four strata of types of change. For each plot, the dataset has detailed descriptions of dominant and secondary land cover/land-use change (if any) and change processes that affect the plot area. Change processes include fire, harvest (clearcutting, thinning), mechanical, structural decline, spectral decline, wind/ice, hydrology, debris, growth/recovery, stable and others. To ensure consistency and quality data, the process for acquiring the dataset incorporates well-defined quality assurance and quality control procedures [37,47].
2.3. Methods
Detection of tree cover conversion and tree cover change in condition
To monitor tree cover change comprising both tree cover conversion and tree cover change in condition, we relied on the LCMAP data products. In this study, tree cover conversion or tree cover loss denotes complete loss of tree canopy cover resulting from change processes including harvest, fires and land use change. Thus, tree cover conversion or tree cover loss is explicitly identified in the calendar year when a reference plot of tree cover class (class 4) changed to another land cover type. Tree cover change in condition or partial tree cover change denotes partial loss of tree canopy cover resulting from various change processes, usually of a lower intensity. Thus, we use the term “tree cover change in condition” or partial tree cover change to describe a change in tree cover condition without a tree cover conversion [28]. Tree cover change in condition can result from several change processes including harvest, structural and spectral decline, fire and other disturbances that reduce tree canopy cover but not to below the 10% threshold adopted in the LCMAP classification of the tree cover class.
In LCMAP (Collection 1.2), change detection is based on time-series model breaks from the CCDC algorithm applied to the Landsat archive [37,38]. When applied to all available cloud-free surface reflectance measurements, the CCDC computes a time series model for the spectral response of each Landsat pixel and detects change based on observed divergence from the model predictions [29,50]. Divergence from the time-series model, referred to as model break, could result from abrupt change (such as logging, wildfire and land use conversions) or from gradual change in the spectral signal (such as forest regrowth, drought and insect/pest attacks) [38].
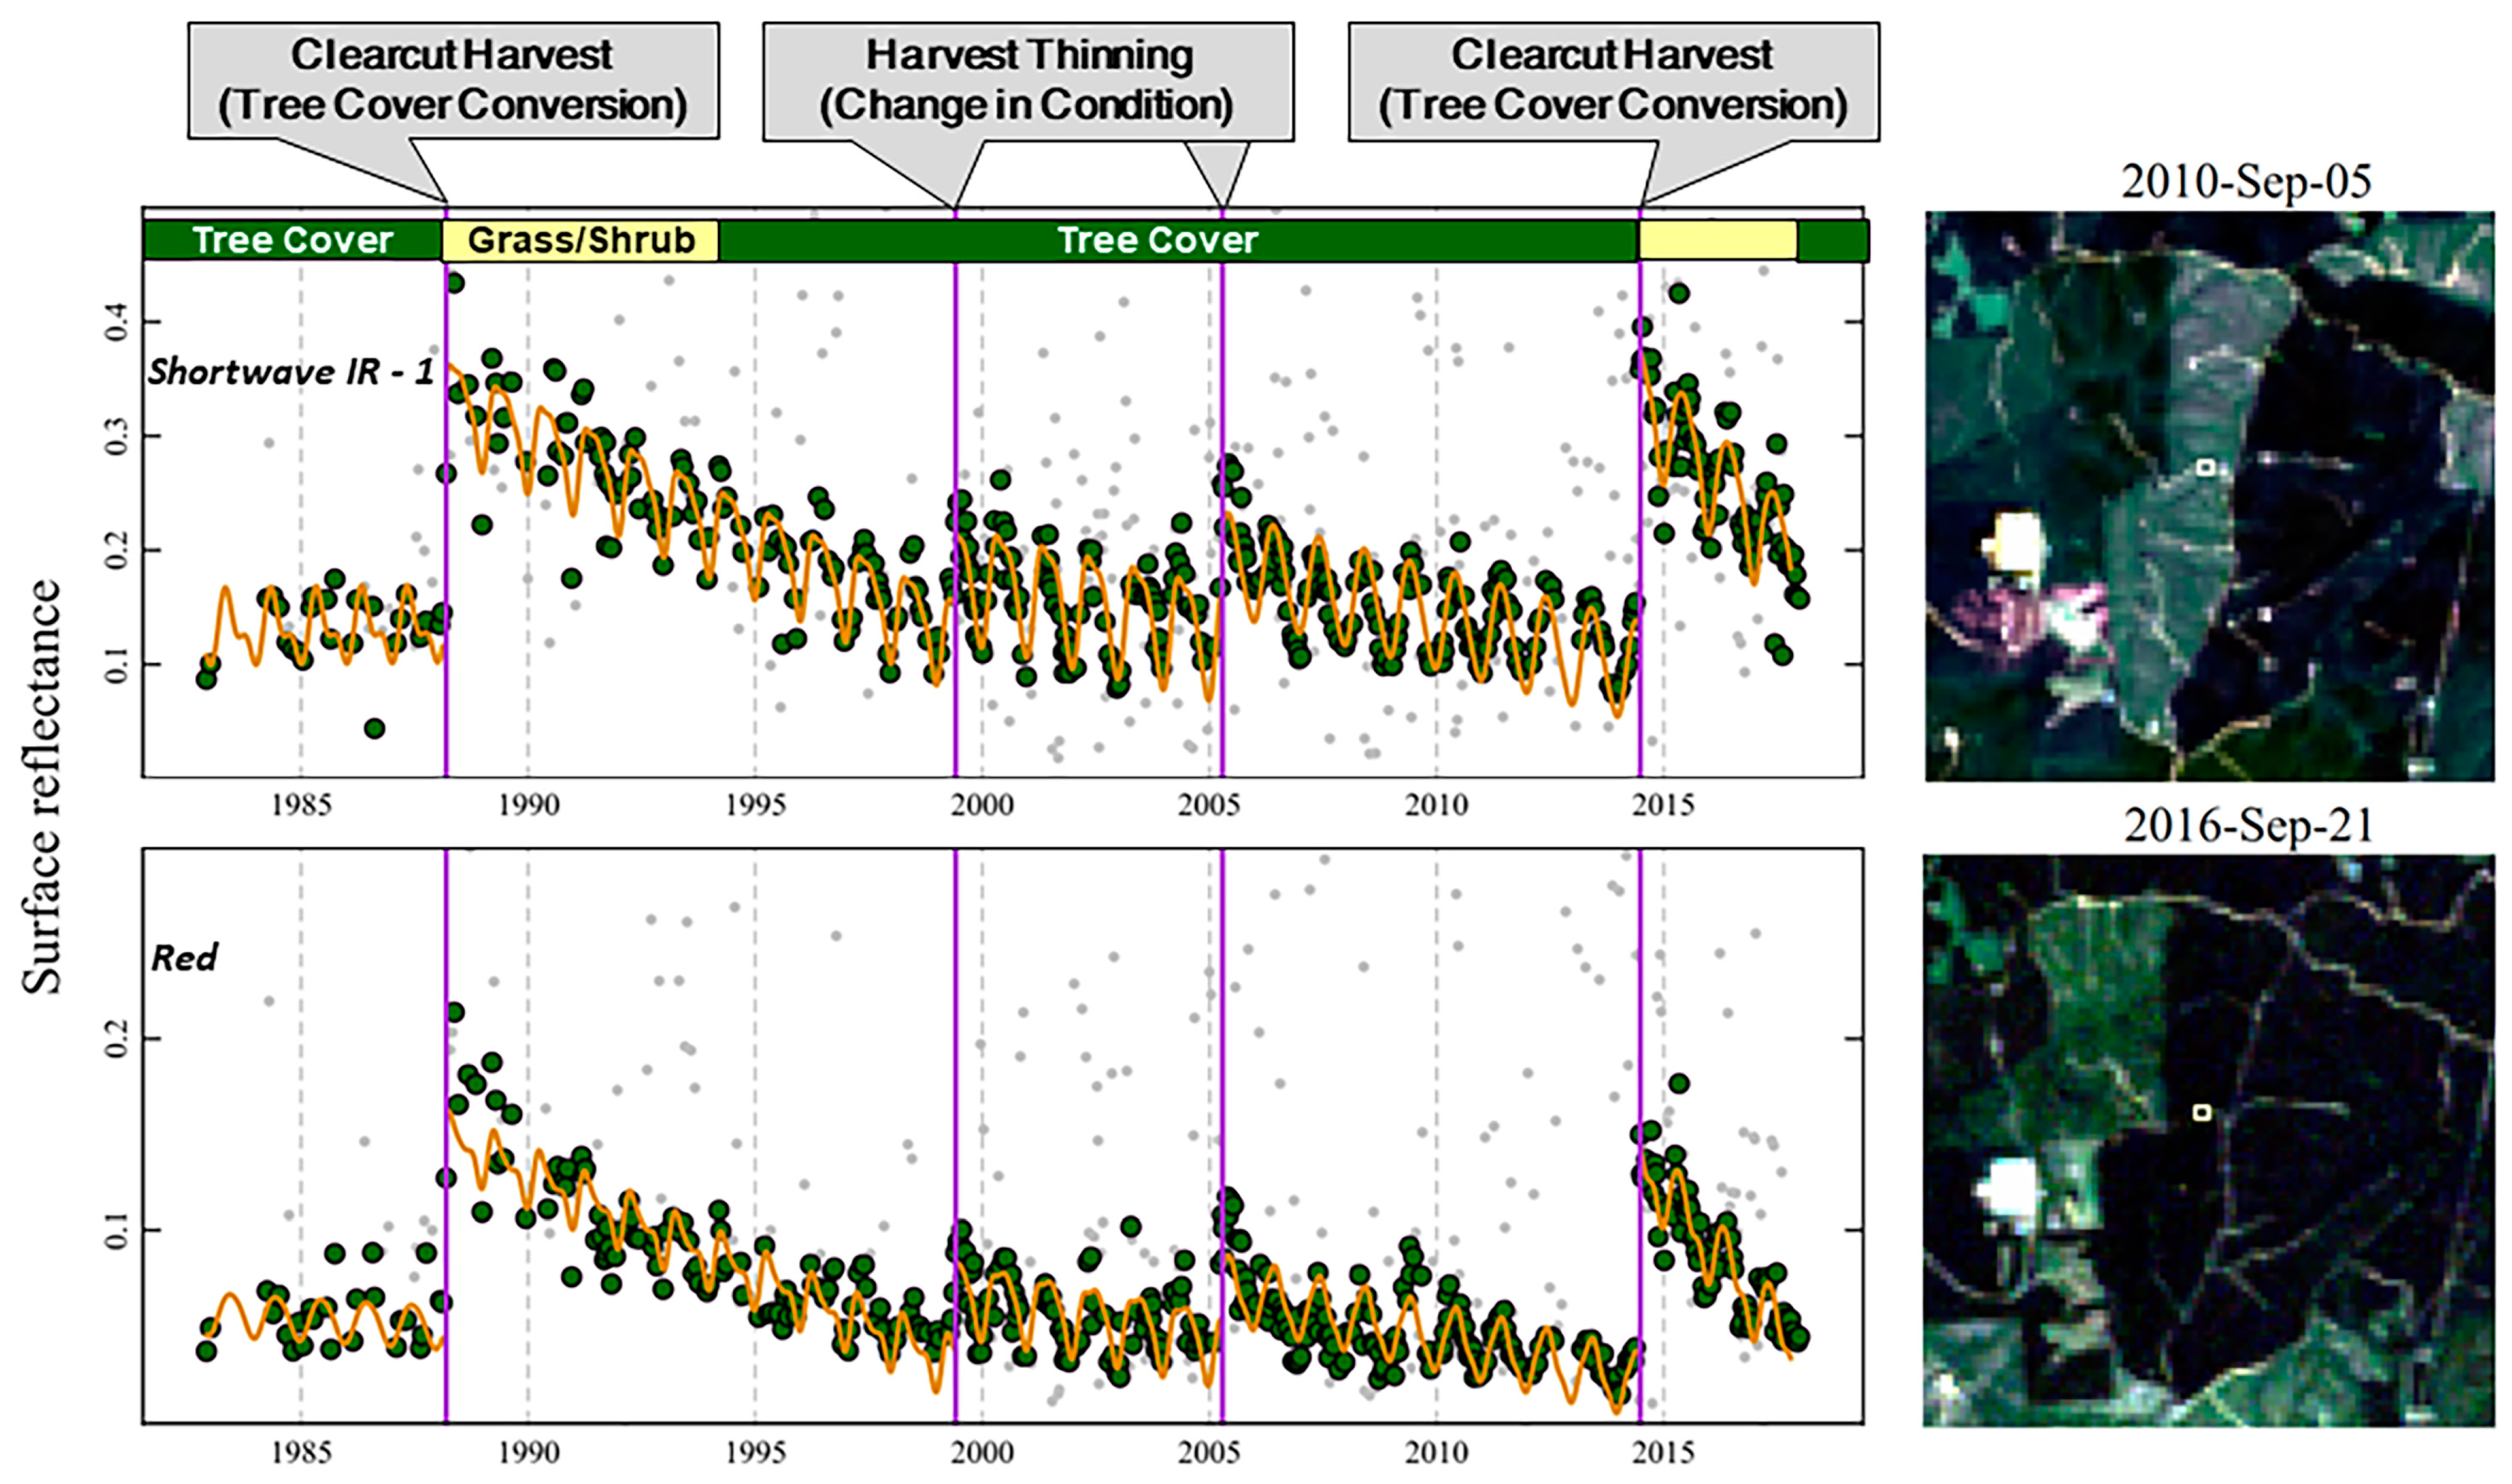
Following Brown et al., 2020 [38], Figure 2 is an illustration of CCDC change detection for a forested pixel that experienced both tree cover conversion and tree cover change in condition during the study period. In this figure, the green dots are the surface reflectance measurements from two Landsat spectral bands, the red and the short-wave infrared (SWIR) 1, used to derive the actual CCDC models. Smaller gray dots represent masked out reflectance values due to poor data quality. The orange lines represent the CCDC time series models generated by estimating the surface reflectance values. The purple vertical lines indicate dates of model breaks [38]. In this example, the pixel experienced tree cover conversion or complete tree cover loss resulting from clearcut harvest in 1988 and 2015, the latter of which is shown in the Landsat images to the right. In 1999 and 2005, the pixel also experienced tree cover change in condition or partial tree cover loss resulting from thinning harvest. For this forested pixel, the spectral discontinuities are clearly observed in both Landsat bands when the disturbance events occurred (Figure 2).

Figure 2.
Temporal profiles depicting CCDC change detection for a forested pixel (location highlighted by the white box on the Landsat images to the right, in true color composite) that experienced both tree cover conversion and tree cover change in condition during the study period. Spectral information is shown for the short-wave infrared (SWIR) 1 and red bands from Landsat 4, 5, 7 and 8 data. Figure adapted from [38].
2.3.1. Proportions of CCDC Harmonic Model Breaks That Were Tree Cover Conversion or Change in Tree Cover Condition (Partial Tree Cover Change)
For each calendar year, we identified tree cover change in condition by selecting reference plots of tree cover pixels with Spectral Change Magnitude (SCMAG) values greater than zero for which the corresponding Annual Land Cover Change (LCACHG) indicated no class change before and after the CCDC harmonic model break. We then used the Time of Spectral Change (SCTIME), which has the time of change information per the CCDC harmonic model break, to identify the day (and the year) of change for each changed reference plot. Plots with tree cover to grass/shrub transitional segments do not have day of change information in the SCTIME product because the transition is more gradual with no one specific time [37]. This analysis does not include those gradual changes, and as such, tree cover change for each calendar year consists of change identified by only the CCDC harmonic model breaks.
To obtain time-series model breaks in tree cover class, we selected CCDC harmonic model breaks (i.e., both SCMAG and SCTIME values greater than zero) in the annual time series maps matching the same type of change in the reference dataset during the study period. We summarized the total number of CCDC harmonic model breaks involving tree cover class. We then partitioned the time-series model breaks in tree cover that were either tree cover conversion or change in condition. Based on reference data change processes, change in condition was further separated into whether it was disturbance-driven, growth or recovery-related or stable. A flowchart summarizing the entire process for obtaining the CCDC harmonic model breaks that were tree cover conversion or change in tree cover condition is provided in the Supplementary Materials (SM), Figure S1.
2.3.2. Accuracy of CCDC Harmonic Model Breaks in Detecting Change in Tree Cover
The accuracy of the CCDC algorithm for detecting a type of change in tree cover was analyzed using the reference plots. We evaluated the accuracy of the LCMAP map-based tree cover change by comparing change detected by CCDC time-series model breaks with change captured in the reference dataset across CONUS during the study period. The map and reference comparisons were based on the exact location of the reference points and their correspondent pixel values. We used the confusion matrix to evaluate the change accuracy by comparing the change type of the reference plots with those found by the LCMAP map products. The overall accuracy, user’s accuracy and producer’s accuracy were used to evaluate the change results.
2.3.3. CCDC Harmonic Model Breaks by Forest Type
We relied on the USGS-led National Land Cover Database (NLCD) land cover maps [51] to identify forest types corresponding to time-series model breakpoints in tree cover class (Figure S1). The NLCD version 2019 used in this study had land cover maps for the years 2001, 2004, 2006, 2008, 2011, 2013 and 2016. Thus, our identification of forest types was based on the NLCD maps for those years. This version of NLCD has three forest types, namely deciduous, evergreen and mixed forests. To obtain the proportions by forest type, we added up time-series model breaks for all years and then expressed a final percentage of each category. We note that the NLCD forest types may change over time for a specific reference plot or that the NLCD class may not be forest at the time of the LCMAP SCMAG change because of their multi-year intervals.
2.3.4. Distribution of Change Processes Affecting Tree Cover
We used the reference data to identify change and change processes in reference and to evaluate change identified in maps.
All analyses were performed in the R programming environment (version 4.3.2, R Core Team, 2023).
3. Results
3.1. Proportions of CCDC Harmonic Model Breaks That Were Tree Cover Conversion or Change in Tree Cover Condition
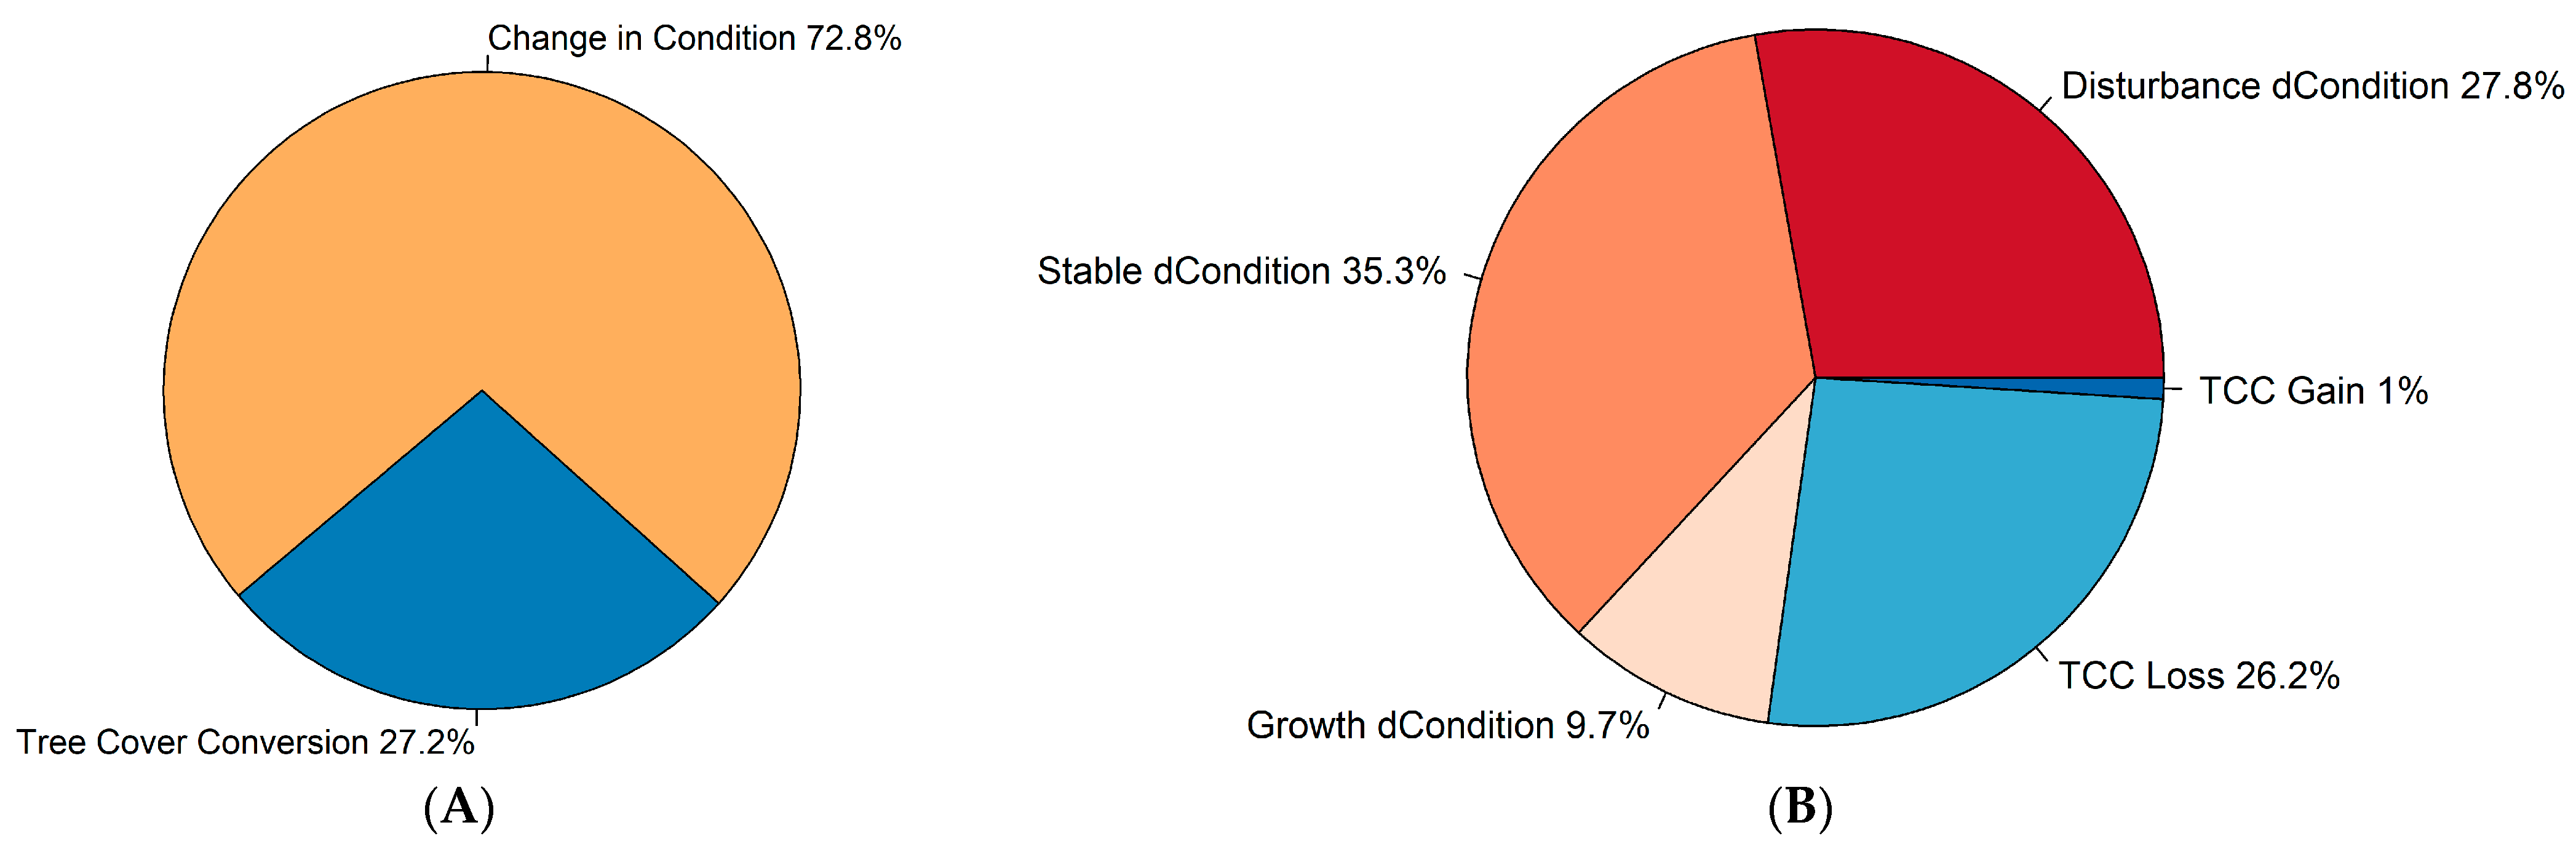
A substantially higher number of CCDC harmonic model breaks concerning tree cover were change in tree cover condition. Figure 3A shows the overall proportions of model breaks corresponding to reference plots. Out of all the reference plots indicating change in tree cover, 27.2% and 72.8% of the time-series model breaks were tree cover conversion and change in tree cover condition, respectively. Figure 3B indicates that most of the changes in tree cover condition were either stable (35.3%) or disturbance related (27.8%), and nearly 10% identified as growth or recovery related. The “stable” in the reference change processes denotes disturbance so slight that it really may not be easily seen and agreed upon as a change by the reference data analysts. In this study, because we were interested in categorizing change under only two types (tree cover conversion or tree cover change in condition), reference plots with stable change processes were considered as change in condition. We also note that individual reference plots can have more than one such time-series model break, for instance thinning early and tree cover conversion later; thus, each such change was grouped into those categories. Although a few reference plots with stable change processes indicated a class change to tree cover gain, those changes were not captured by the CCDC harmonic model breaks.
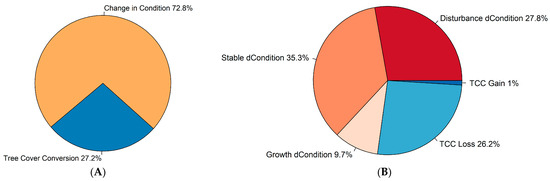
Figure 3.
(A) Overall proportion of CCDC harmonic model breaks corresponding to reference plots that were either tree cover conversion (TCC) or change in tree cover condition for 1986–2018 study period; (B) separation of identified CCDC harmonic model breaks into either disturbance related or not. Note: dCondition = change in condition; TCC Loss = tree cover conversion resulting in tree cover loss; TCC Gain = tree cover conversion resulting in tree cover gain.
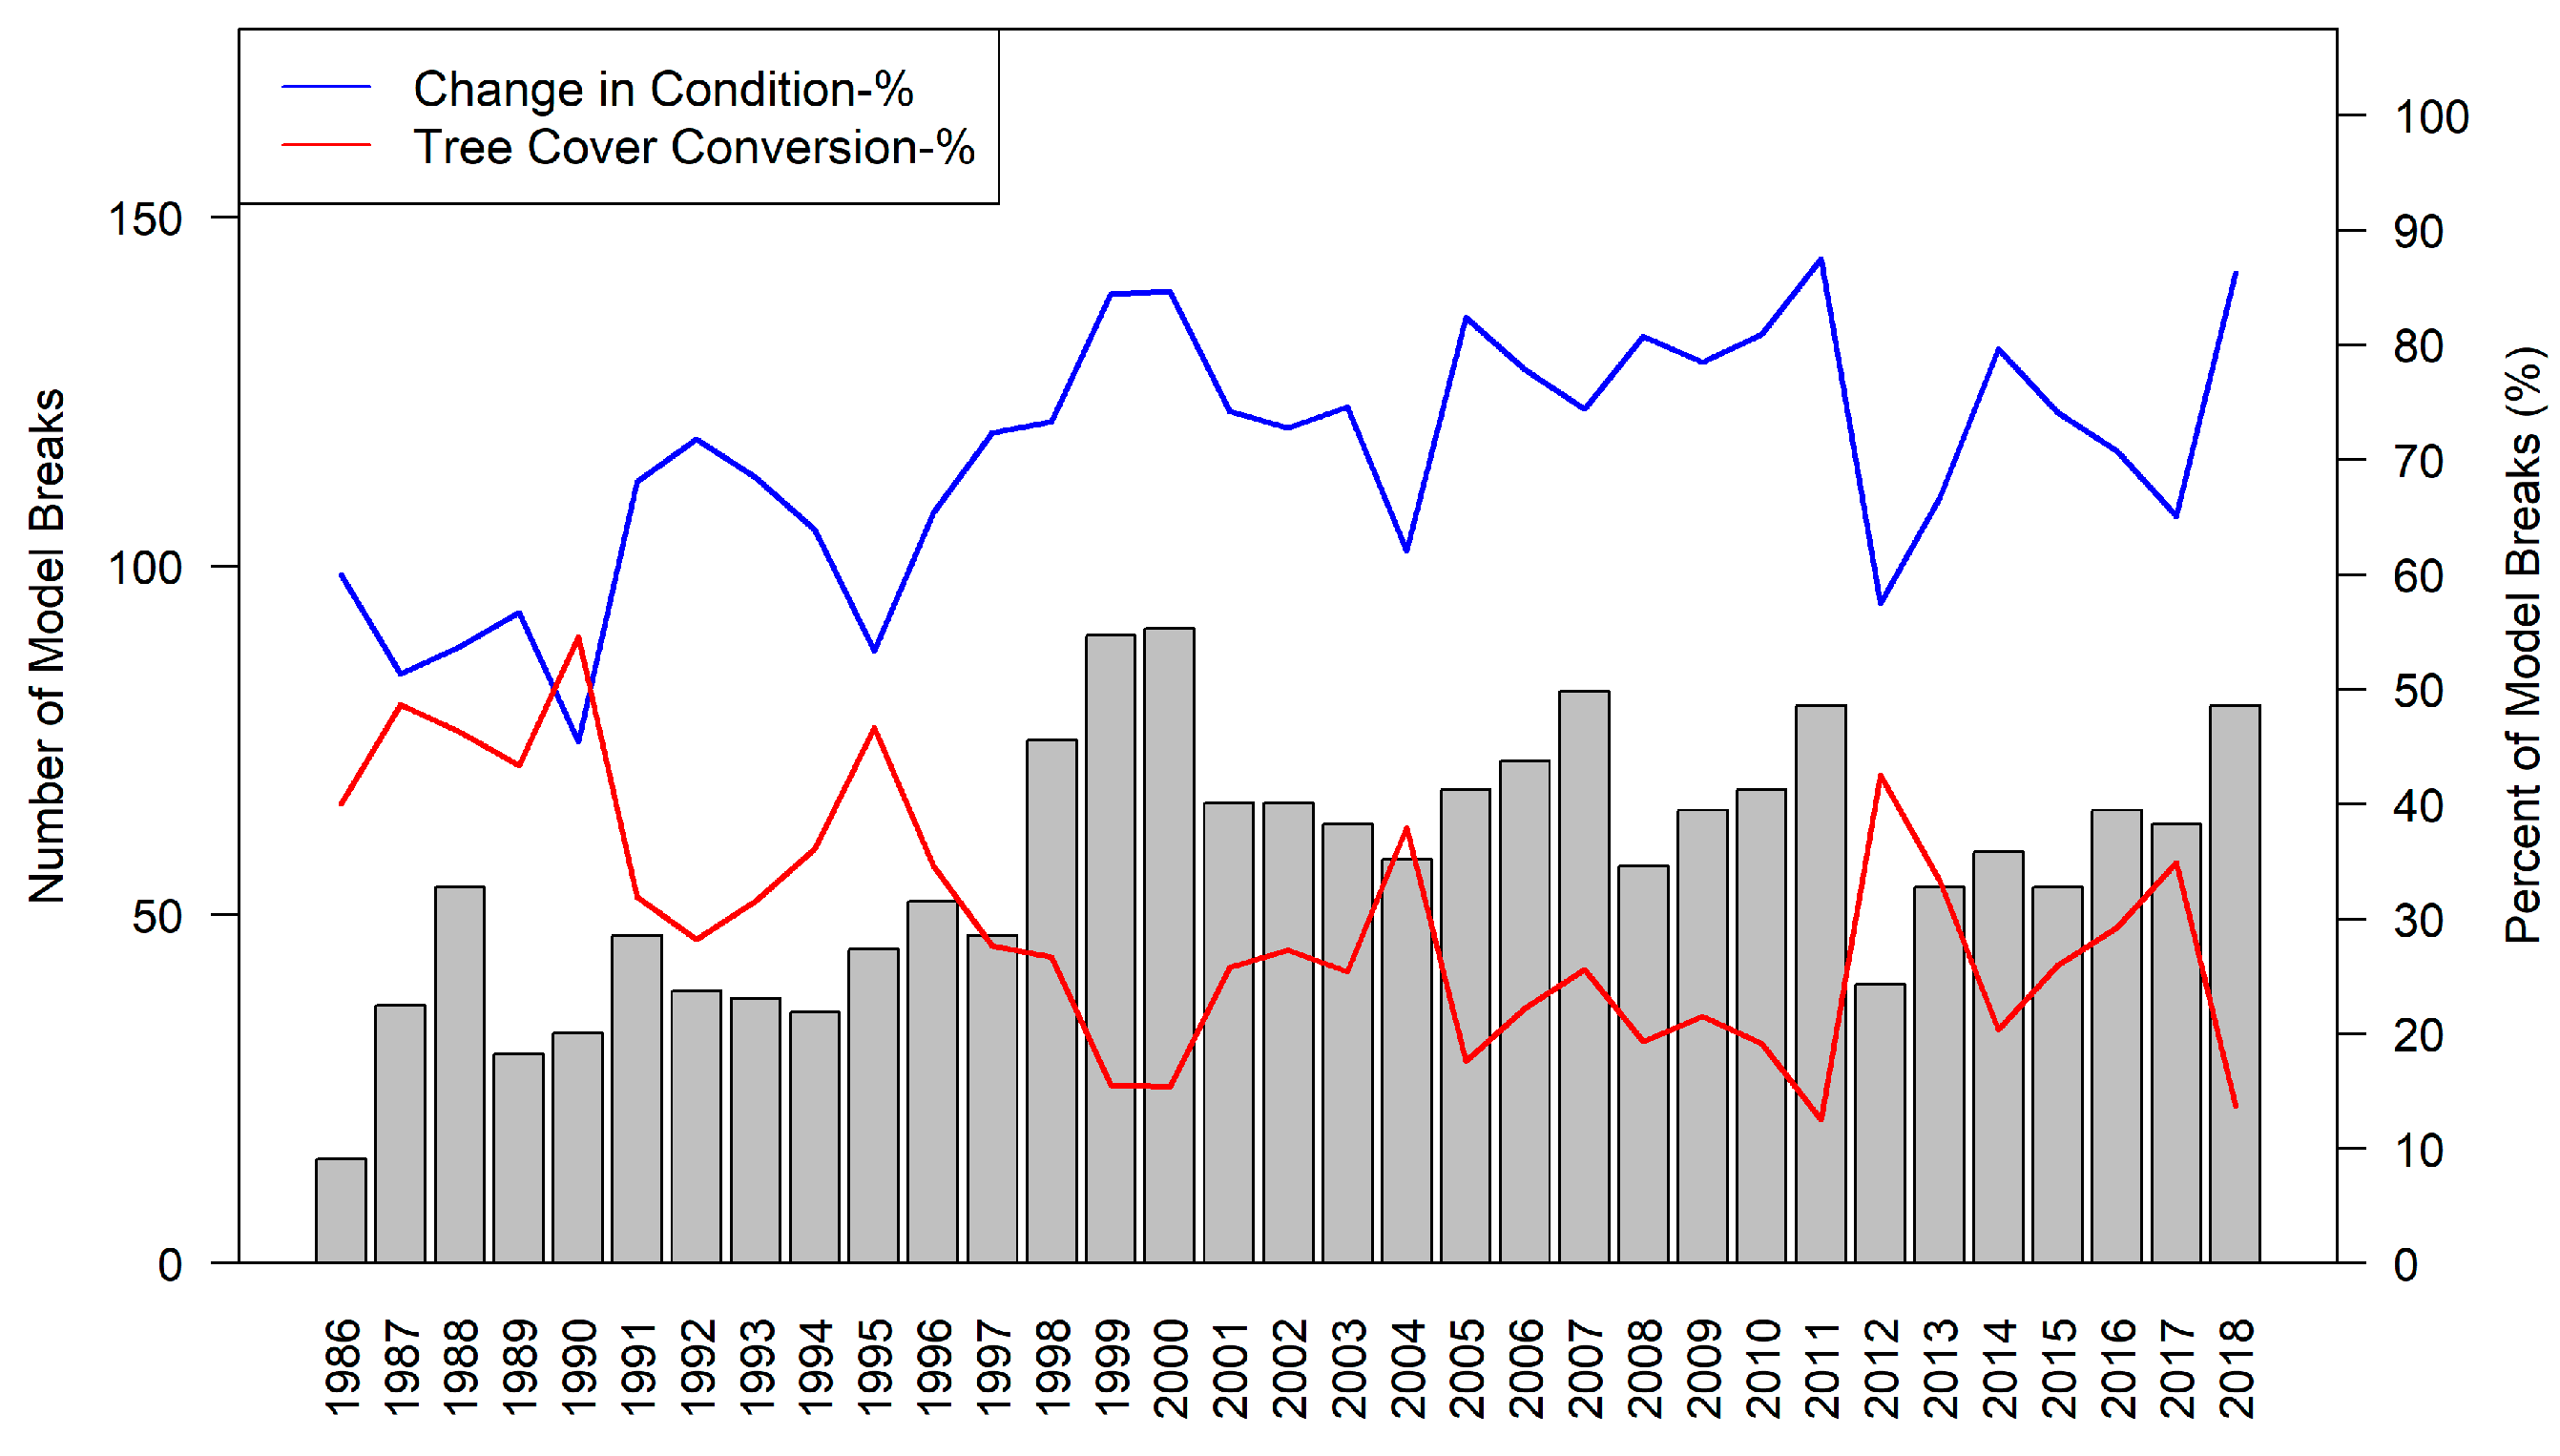
Figure 4 shows the annual number of CCDC harmonic model breaks corresponding to reference plots that were related to the tree cover conversion during the 1986–2018 study period. The number of time-series breakpoints peaked around 1999 and 2000. The number of time-series breaks was moderately high in the 2000s and ticked up again towards the end of the study period. Time-series breakpoints related to tree cover conversion were high in the early part of the study period into the mid-1990s but came down moderately and fluctuated within a narrow range in the 2000s until the end of the study period. Breakpoints related to tree cover change in condition generally increased from the beginning to the end of the study period, although there were annual fluctuations especially after the year 2000.
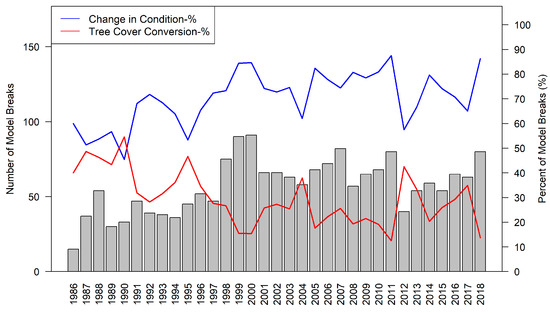
Figure 4.
Distribution of tree cover-related CCDC harmonic model breaks corresponding to change in the reference plots from 1986 to 2018 and proportions that were either tree cover conversion or change in tree cover condition.
3.2. Accuracy of LCMAP Data Products for Detecting Disturbances in Tree Cover
The overall accuracy of LCMAP for capturing either a tree cover conversion or a change in condition of tree cover was 69.44%. The user’s accuracy (UA) and producer’s accuracy (PA) were 45.61% and 82.63%, respectively, for tree cover conversion (Table 2). The UA and PA were 91.24% and 64.72%, respectively, for tree cover change in condition.
Table 2.
Confusion matrix of LCMAP-based tree cover change generated by comparing change detected by CCDC harmonic model breaks with change captured in the reference dataset.
3.3. CCDC Harmonic Model Breaks by Forest Type
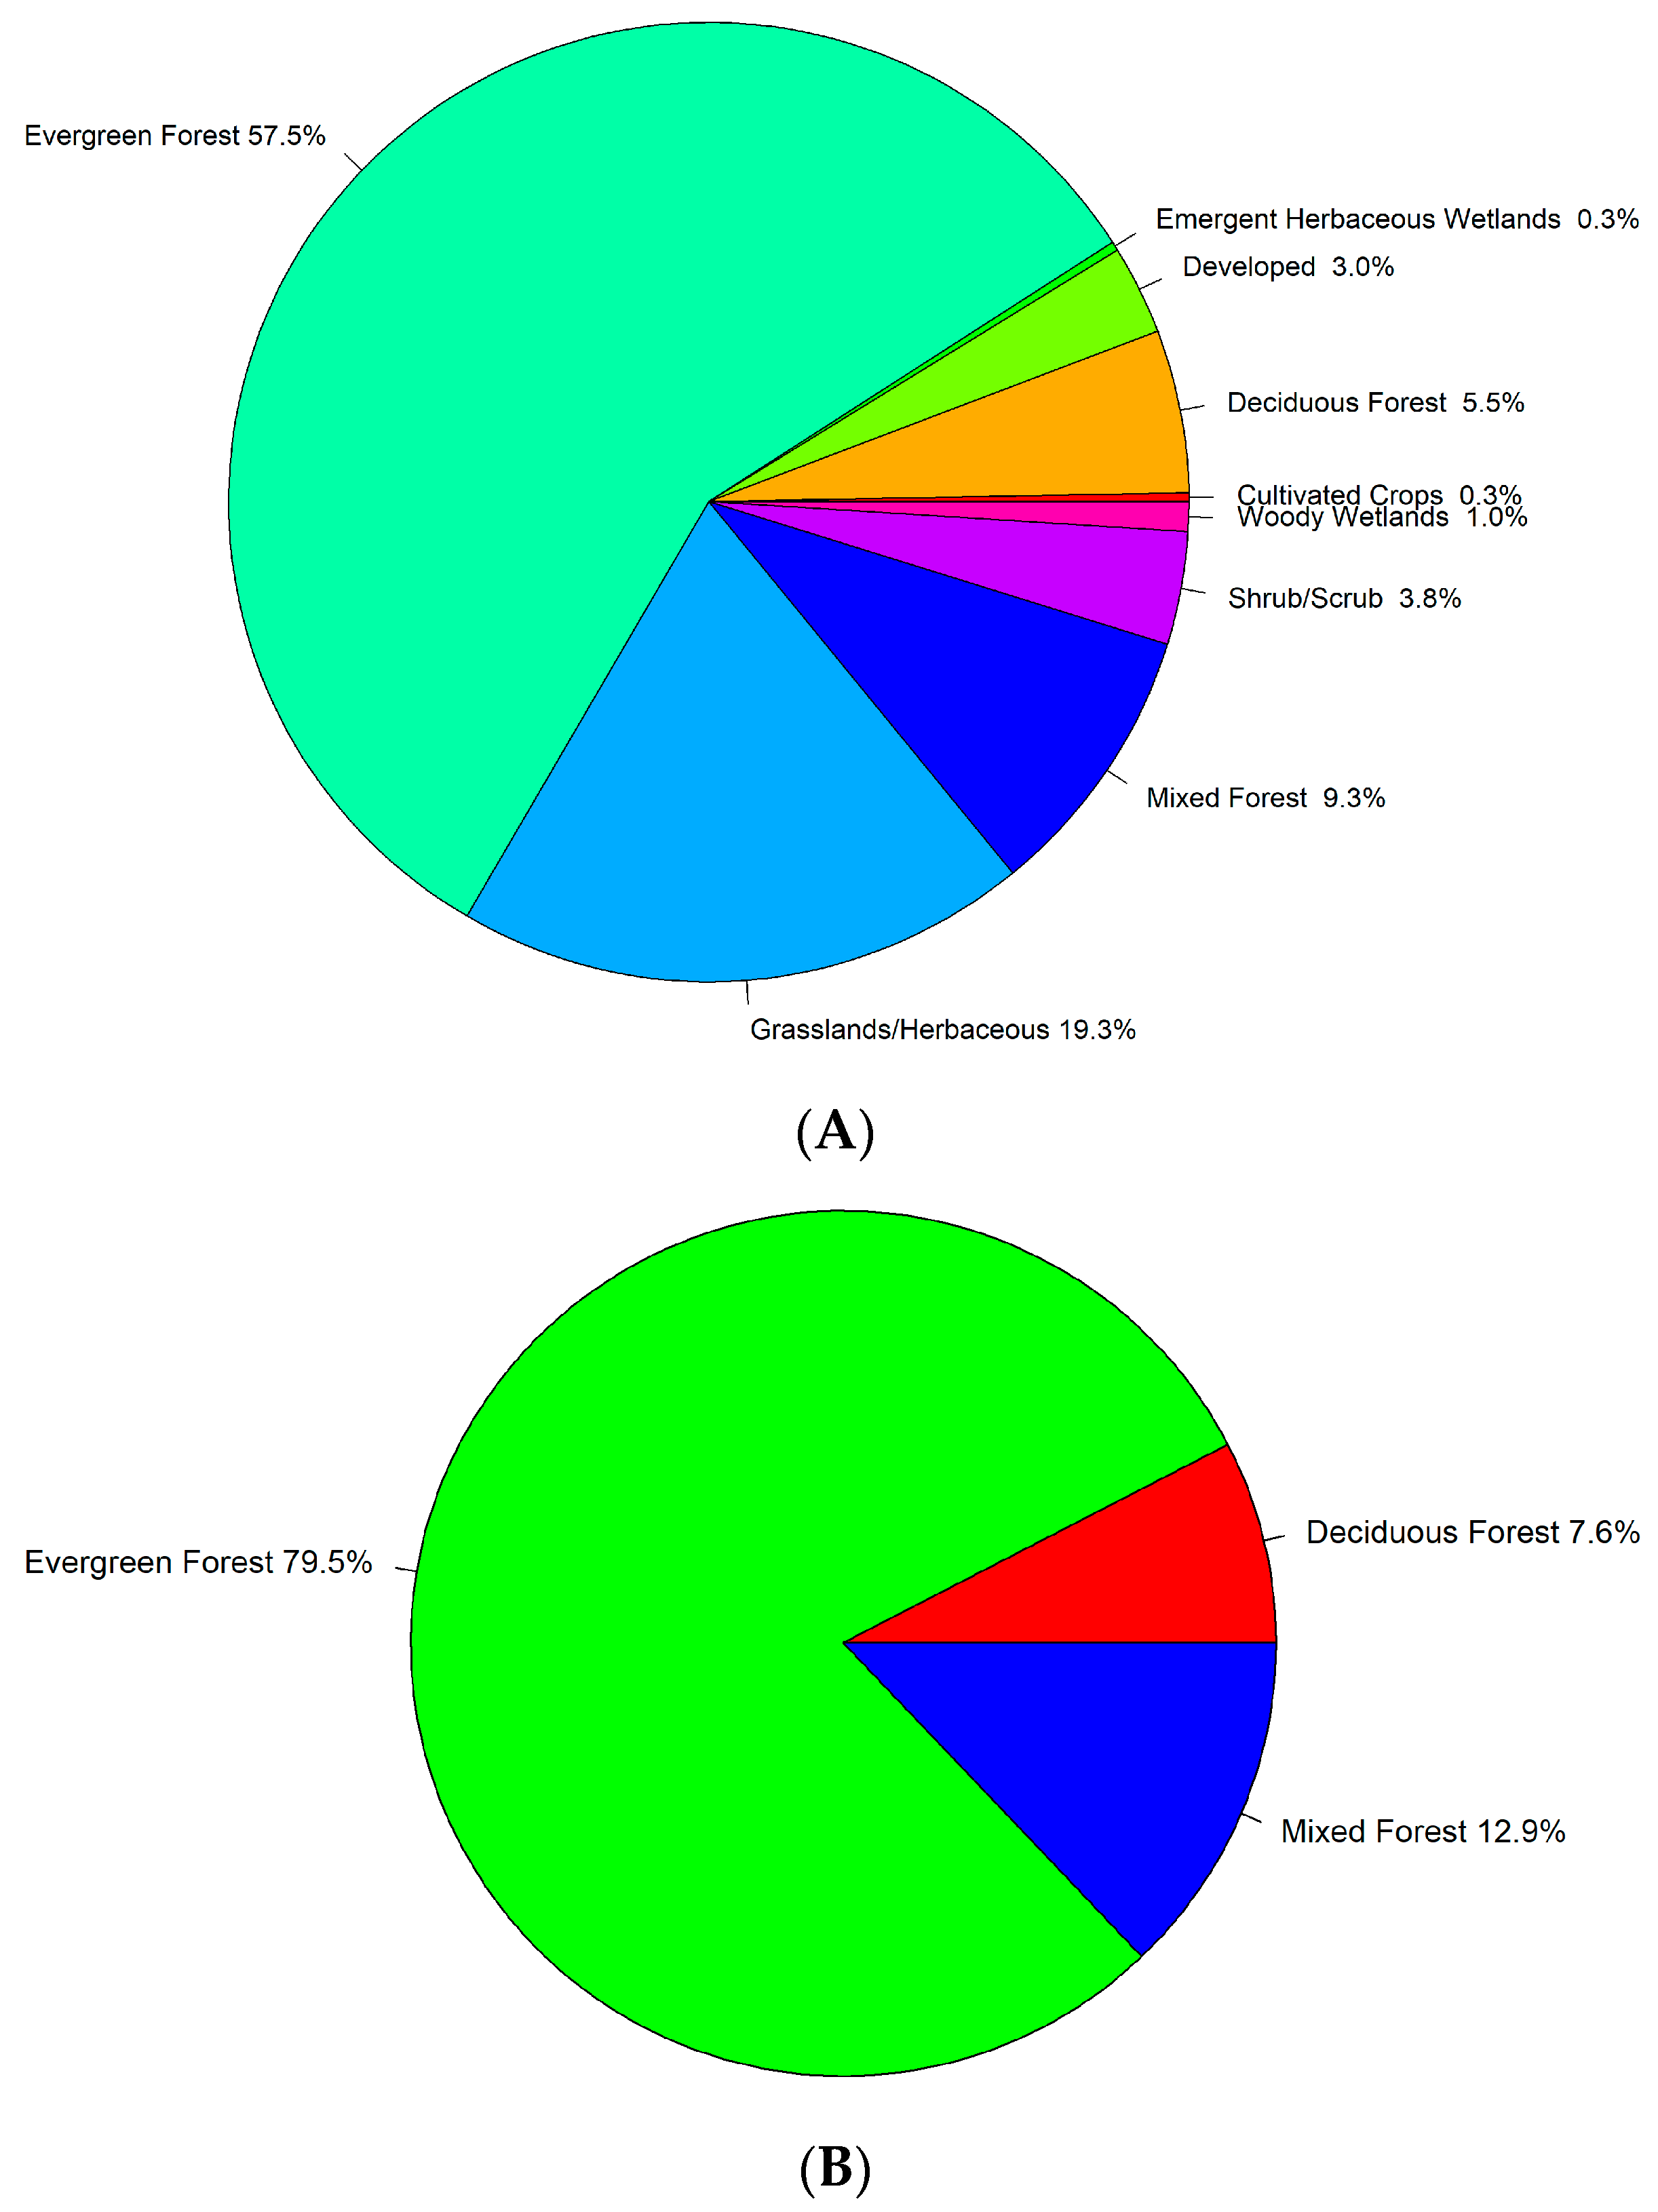
Figure 5 shows the distribution of tree cover-linked CCDC harmonic model breaks by forest type per NLCD landcover (2019 version) for the years when maps were available during the study period. As indicated in Figure 5A, most of the CCDC harmonic model breaks were detected in evergreen forest (57.5%), followed by grasslands/herbaceous (19.3%), mixed forest (9.3) and deciduous forest (5.5%). When considering the CCDC harmonic model breaks just for the three forest classes, 79.5% were detected in evergreen forest, 12.8% in mixed forest and 7.6% in deciduous forest (Figure 5B). The large number of CCDC harmonic model breaks corresponding to the grasslands/herbaceous class is likely due to errors in agreement between NLCD and LCMAP and/or mismatch in dates of tree cover changing events.
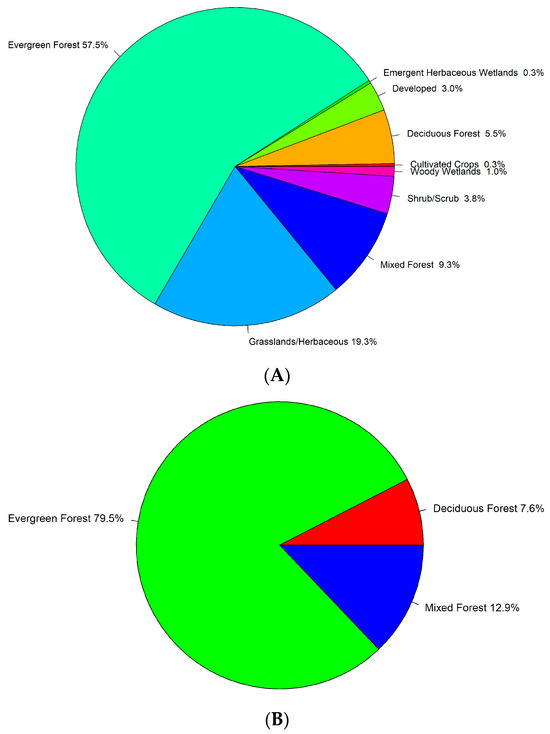
Figure 5.
(A) Distribution of tree cover-related CCDC harmonic model breaks by land cover type according to NLCD version 2019 land cover maps for the years in which the maps were available (2001, 2004, 2006, 2008, 2011, 2013 and 2016). (B) Distribution of CCDC harmonic model breaks by forest types.
3.4. Distribution of Change Processes Affecting Tree Cover
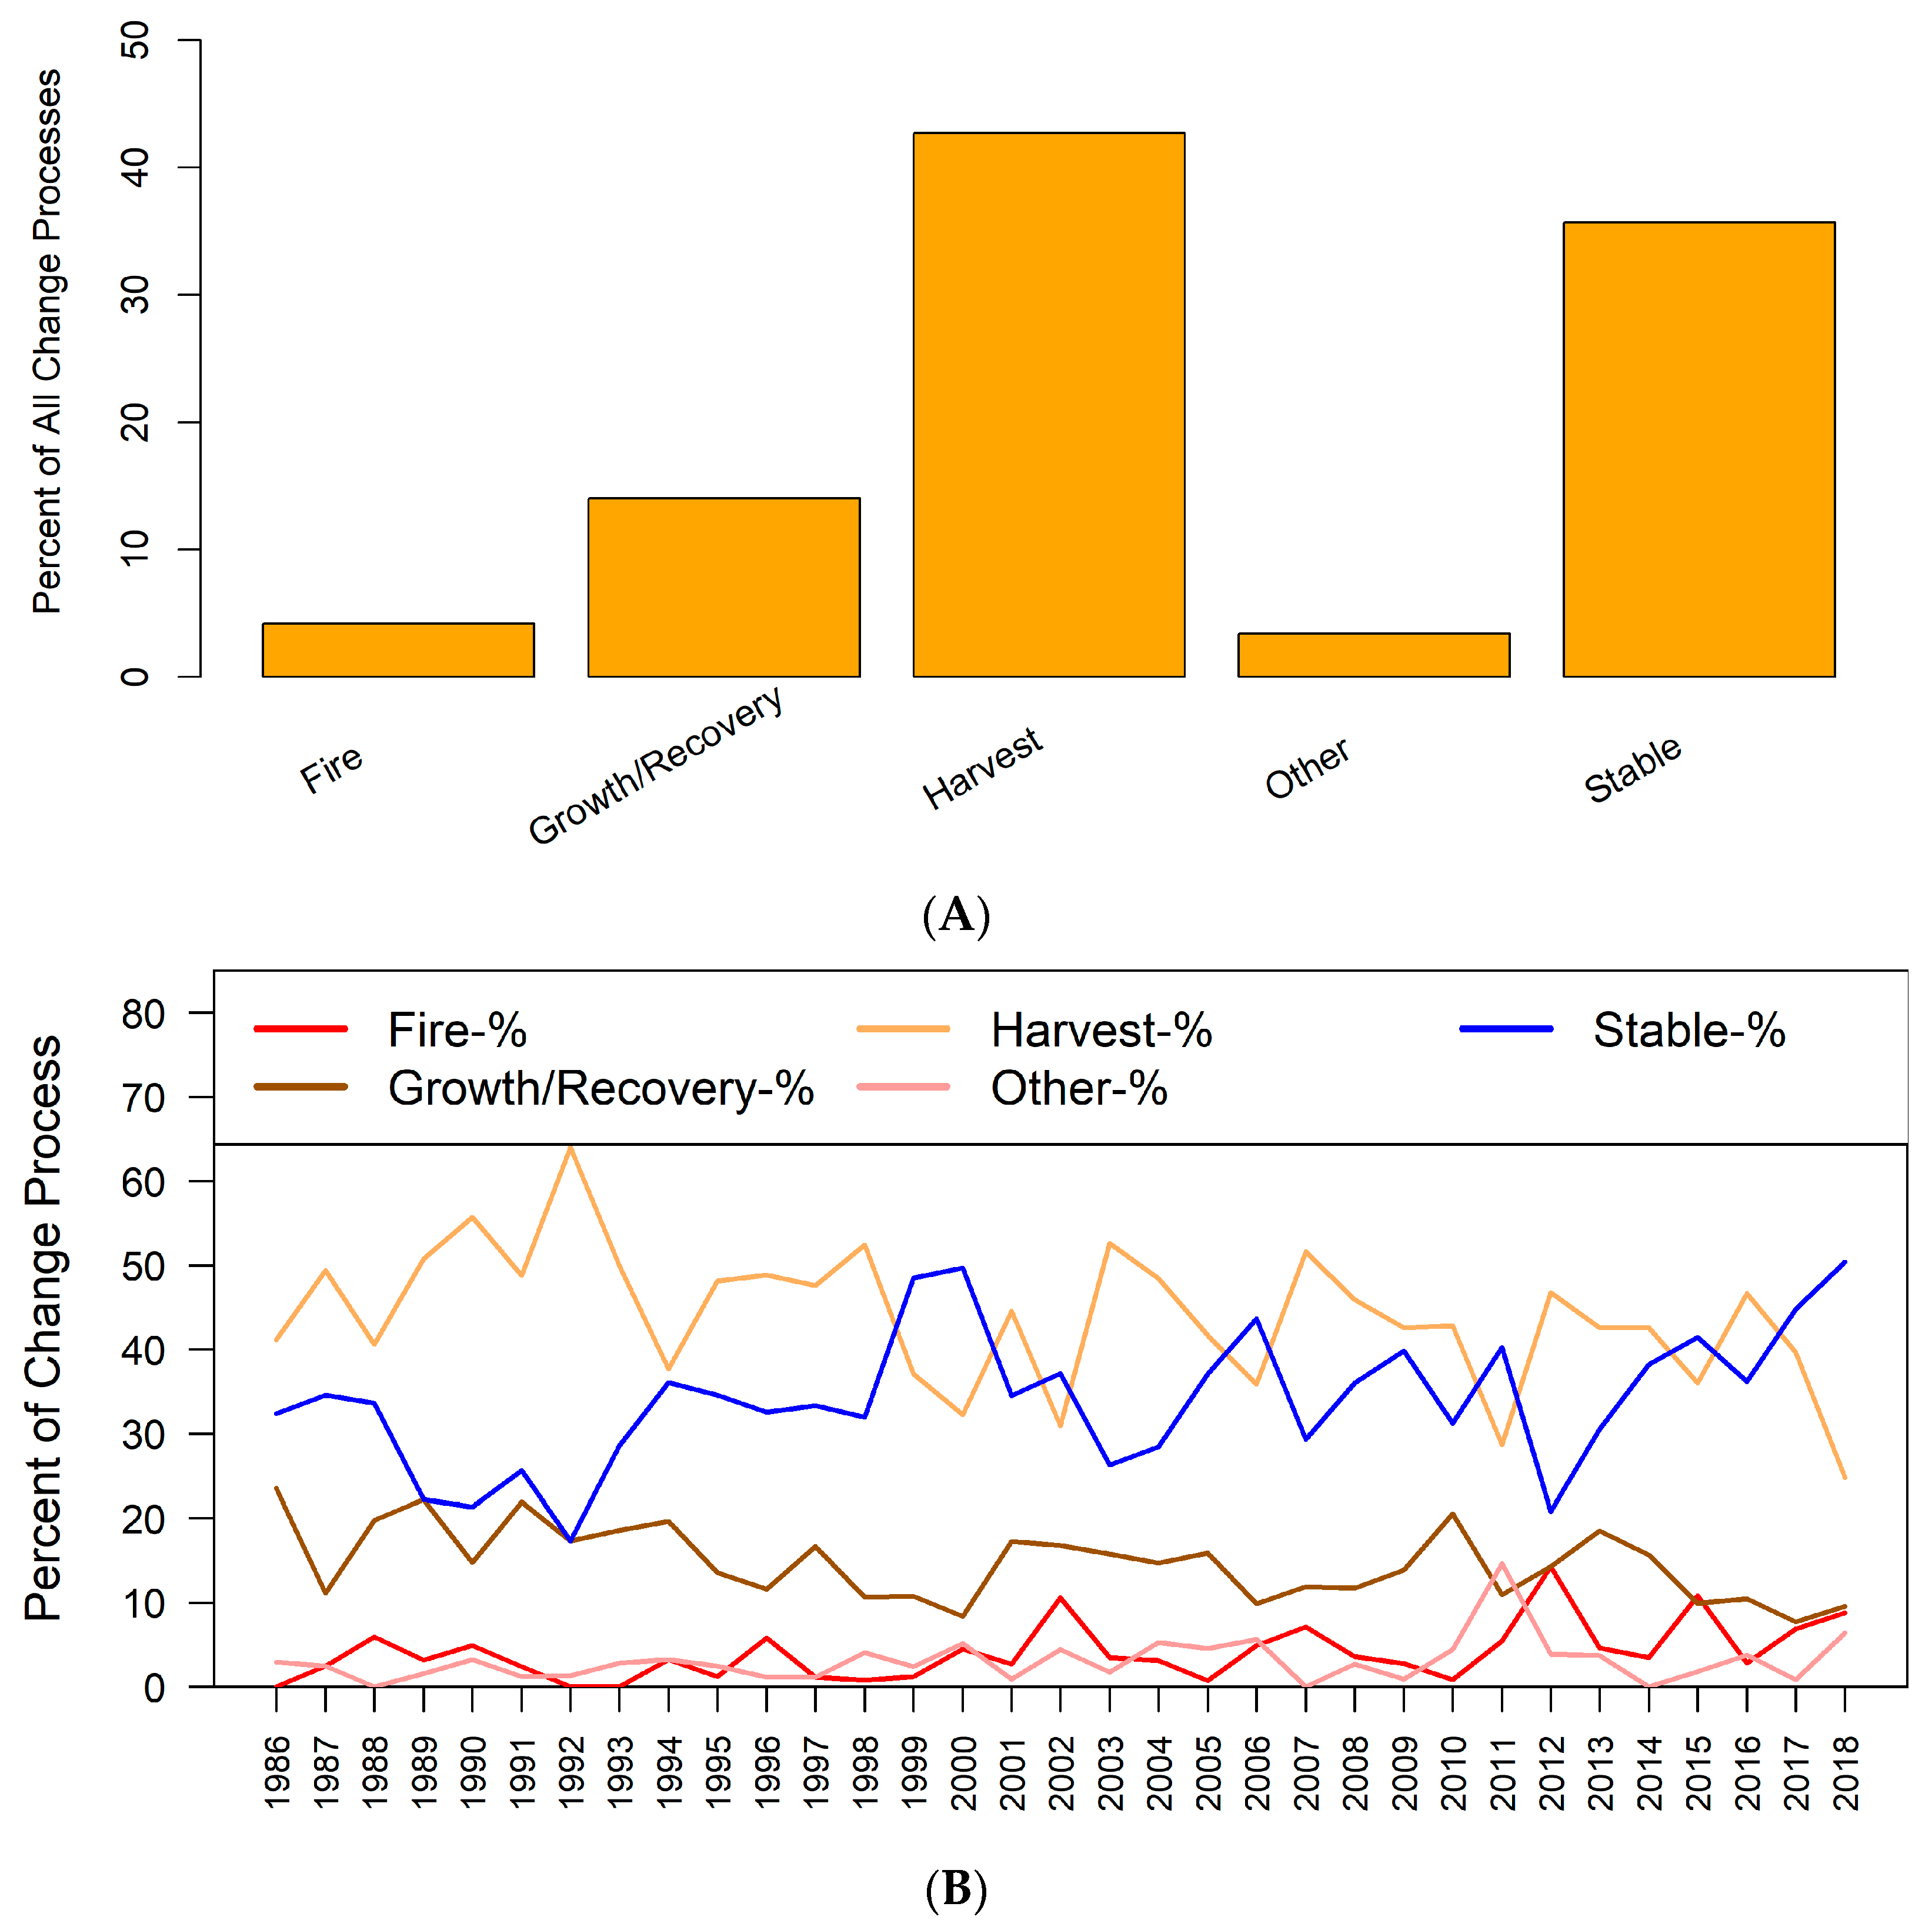
Analysis of the reference data change processes indicate that overall, across the CONUS, harvest dominated the change process (42.7%), followed by stable (35.7%), growth/recovery (14%), fire (4.2%) and other (3.4%) (Figure 6A). There were interannual variation in the dominance of change processes (Figure 6B). There was also regional variability in the types of change and change processes that were associated with tree cover disturbances (Figure 7). The reference dataset indicates that across the four CONUS mega-regions, leading change processes were harvest in the east and east-central regions (Figure 7A,C), while wildfires and harvest dominated in the west (Figure 7B). In the west, harvest used to dominate but wildfires picked up from the 2000s and were elevated to the end of the study period (Figure 7B). In the east, the predominance of harvest was evident throughout the study period (Figure 7A). A substantial proportion of the time-series model breaks were identified as stable, and this change process dominated for many years in all the mega-regions, especially in the west and west-central (Figure 7B,D).

Figure 6.
(A) The major change processes in the LCMAP map validation reference data, each expressed as (B) percentage of all change processes affecting tree cover in CONUS for the period 1986 to 2018.
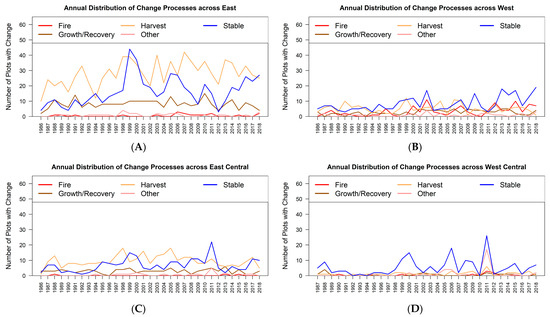
Figure 7.
Annual distribution of change processes affecting tree cover change across the four U.S. mega-regions.
4. Discussion
Our study documented a substantial amount of change in tree cover condition in tree-dominated areas across the CONUS during the study period. Large estimates of disturbance-related tree cover change in condition indicate that tree cover loss estimates based only on tree cover conversion (complete tree cover loss) are likely under-reporting, with considerable implications for forest carbon accounting and other ecosystem goods and services. Moreover, identification of change processes causing disturbances is crucial for reporting effects of forest change and for characterizing forest dynamics, carbon consequences, sustainable forest management and long-term functioning of forest ecosystems [34,52,53]. The LCMAP map validation reference data indicated that although change processes varied spatially and temporally across regions, tree harvest dominated overall.
The NLCD land cover showed that over half of all CCDC harmonic model breaks occurred in evergreen forests when all NLCD land cover classes were included. This observation indicates that across CONUS, forest change, both in state and condition, is happening more in evergreen forest than deciduous forest. The reasons why evergreen forests have more change happening to them is because (1) softwood species are the basis for U.S. industrial wood consumption compared to hardwoods, (2) evergreen forests in the west are more prone to fire because of generally less moisture than most eastern forests, although southern pine forests can certainly and do burn on occasion and (3) western evergreen forests also appear to show more stress indicators from their environment because most are found in drier areas than eastern deciduous forests.
The mapping, with correct labels, of land cover change is more difficult, especially when mapping large areas, than mapping the land cover composition of multiple classes [49,54]. In the CONUS, most individual land cover pixels do not change in any given year; in fact, most have not changed in land cover class in 15 years [55] or altogether over 30 years [49]. Even a change metric such as “Change/No Change” is highly influenced by the non-changing pixels [54]. The widely used USGS NLCD had a PA of 74 (±3) % for “forest loss” for their 2011–2016 change mapping accuracy and a UA of 75 (±8) %. Their accuracy efforts for “forest loss” were determining if a forest class pixel had changed to a non-forest class pixel. Our effort in this work was not only to see how well class change had been captured but to determine the accuracy of change in tree cover condition; thus, our accuracy of change was similar to other large-area operational mapping programs.
Forest land ownership played an important role in tree cover disturbances during our study period in the CONUS. Regionally, the U.S. forests outside of Alaska are commonly divided up as the south, north and the west [56]. The west, primarily the sub-region of the Pacific Northwest, at the beginning of the study period was the leading wood-producing region in the United States by volume, specializing in using timber coming from publicly owned national forests that was often from still-existing old-growth trees [56,57]. The U.S. south had the largest forestry industry by geographic extent but because most of its existing and growing trees were smaller and younger, the region produced less wood volume from its harvesting. The CONUS north was in a distinct third place after the two other regions [56].
Governmental policy started to change substantially in the late 1980s for publicly owned national forest land in the west as growing concerns about the declining amounts of old growth forest in the Pacific Northwest sparked the “Spotted Owl controversy” (listing this bird, Strix occidentalis caurina, on the federal endangered species list) that helped closed off almost all such older forests to widespread harvesting [57,58]. The environmental aspects of tree-covered land besides the wood it could produce for human use gained traction in the 1990s and most public forest land in the west ended up with greatly reduced timber harvesting events [57]. These decisions are reinforced by documentation that showed timber harvest from many of the western national forests in the Rocky Mountain sub-region was not cost effective, given that the costs of building the needed transportation infrastructure often exceeded the wood value that could be extracted, as well as increasingly unsustainable harvest volumes [58]. By the 1990s, the U.S. south, with much of its forested land in private ownership, became the dominant tree-harvesting region in the country [56].
Fire policy, primarily for government-owned land, also changed (or continued to change) during the study period. The Wilderness Act of the 1960s started the move towards other land management tactics besides aggressive wildfire suppression in some areas of federal forest land, mostly in the U.S. west [59,60]. The shift in the 1990s from the past massive emphasis on timber cutting in national forests to more ecosystem management policies, such as “ecosystem restoration” (often without fully defined goals and benchmarks, at least initially), also allowed federal land managers to try more adaptive uses of fire, although some of this was stymied by increases in the area extent of the WUI (wildland/urban interface) and a continued culture (mostly) of fire suppression [60,61]. The active political pressure of the timber industry on federal policy may have been greatly diminished as their access to federal land became limited, but the near century legacy of such pressure helped leave a largely altered forested landscape [62].
Socioeconomic drivers also had various effects on wood removal from tree cover land over time. Softwood output from evergreen, mostly conifer, forests is the majority amount of wood used in various consumptive uses such as building materials and fiber (paper)-based products. Building materials, much of it used to construct residential dwellings in the United States, uses the most softwood output so harvesting trees often follows the new housing unit market. The housing financial crisis that set off the Great Recession of 2008 greatly affected the amount of wood harvest in the CONUS for several years afterwards [56]. The highpoint of wood used in new housing during our study period was from the later 1990s through 2006, with 2005 having record high wood prices [56]. Governmental policy intersected directly with potential wood harvesting in the CONUS as more and more Canadian softwood was allowed to be imported into the United States. The Canadian and U.S. governments had several different trade skirmishes over these imports but, in the end, Canadian wood maintained a noticeable part of the U.S. softwood market and use over time [56].
Hardwood from deciduous forests has fewer socioeconomic uses than softwood material. The overall land cover change across the CONUS during most of the study period shows that areas in the northeast quadrant of the country that are dominated by deciduous forests had little change [63]. An important use of hardwood is in furniture making but the demand for U.S.-sourced material has lessened over time as imported Asian-based hardwood furniture made inroads fueled by a strong U.S. dollar that allowed cheaper imports to gain a competitive advantage [56]. A hardwood consumer good that has increased over time has been compressed pellets for modern wood burning stoves, although it is hard to gauge the multi-geographical scales of either fuel wood pellets or furniture making with tree cover removals on the ground. Hardwood also plays a role in U.S. paper-based consumer products, but it remains as the minority source when compared to softwood materials for such usage [56].
5. Conclusions
Change in condition of forest cover constituted the majority of CCDC harmonic model breaks across the CONUS, accounting for nearly three-quarters of tree cover change during the study period. Forest change in the CONUS, both in class and condition, is happening more in evergreen forest than deciduous forest. The traditional way of tree cover conversion is missing this aspect of change, and although it has probably been surmised and perhaps explored to a certain degree, LCMAP data (in the entire suite including the map validation reference dataset) now can provide some quantified numbers of change in possibly a more direct way than other sources.
Our findings indicate that change processes such as harvest thinning, low severity wildfires and other low intensity disturbances potentially lead to considerable declines in tree cover that are often missed in tree cover loss estimates based only on tree cover conversions. There was regional variability in the types of change and change processes that were associated with tree cover disturbances. Thus, through the power of continuous monitoring and an annual time-series reference dataset, the LCMAP dataset has a unique potential for better characterizing both tree cover conversions and tree cover condition change associated with various change processes across diverse landscapes of the CONUS.
Supplementary Materials
The following supporting information can be downloaded at: https://www.mdpi.com/article/10.3390/f15030470/s1, Figure S1. A flowchart of methods for obtaining Continuous Change Detection and Classification (CCDC) harmonic model breaks that were tree cover conversion or change in tree cover condition based on Land Change Monitoring Assessment and Projection (LCMAP) data products and map validation reference data.
Author Contributions
Conceptualization, F.K.D. and R.F.A.; methodology, F.K.D.; formal analysis, F.K.D.; writing—original draft preparation, F.K.D.; writing—review and editing, F.K.D. and R.F.A.; supervision, R.F.A. All authors have read and agreed to the published version of the manuscript.
Funding
This research was funded by the U.S. Geological Survey National Land Imaging (NLI) program under contract 140G0119C0001.
Institutional Review Board Statement
Any use of trade, firm, or product names is for descriptive purposes only and does not imply endorsement by the U.S. Government. This article has been peer reviewed and approved for publication consistent with U.S. Geological Survey Fundamental Science Practices (https://pubs.usgs.gov/circ/1367/, accessed on 15 March 2023).
Data Availability Statement
All datasets used in this study are publicly accessible in the sources indicated in the text.
Acknowledgments
We thank the academic editor and the reviewers who helped us substantially improve the manuscript. We are very grateful to Melanie K. Vanderhoof of the USGS for her helpful comments that improved earlier drafts of this manuscript.
Conflicts of Interest
The authors declare no conflicts of interest.
References
- Cobb, R.C. The intertwined problems of wildfire, forest disease, and climate change interactions. Curr. For. Rep. 2022, 8, 214–228. [Google Scholar] [CrossRef]
- Woodbridge, M.; Keyser, T.; Oswalt, C. Stand and environmental conditions drive functional shifts associated with mesophication in eastern US forests. Front. For. Glob. Chang. 2022, 5, 214–228. [Google Scholar] [CrossRef]
- Meeussen, C.; Govaert, S.; Vanneste, T.; Haesen, S.; Van Meerbeek, K.; Bollmann, K.; Brunet, J.; Calders, K.; Cousins, S.A.O.; Diekmann, M.; et al. Drivers of carbon stocks in forest edges across Europe. Sci. Total Environ. 2021, 759, 143497. [Google Scholar] [CrossRef]
- Williams, C.A.; Collatz, G.J.; Masek, J.; Huang, C.; Goward, S.N. Impacts of disturbance history on forest carbon stocks and fluxes: Merging satellite disturbance mapping with forest inventory data in a carbon cycle model framework. Remote Sens. Environ. 2014, 151, 57–71. [Google Scholar] [CrossRef]
- Williams, C.A.; Gu, H.; MacLean, R.; Masek, J.G.; Collatz, G.J. Disturbance and the carbon balance of US forests: A quantitative review of impacts from harvests, fires, insects, and droughts. Glob. Planet. Chang. 2016, 143, 66–80. [Google Scholar] [CrossRef]
- Liu, J.; Sleeter, B.; Selmants, P.C.; Diao, J.; Zhou, Q.; Worstell, B.; Moritsch, M. Modeling watershed carbon dynamics as affected by land cover change and soil erosion. Ecol. Model. 2021, 459, 109724. [Google Scholar] [CrossRef]
- Monsted, J.; Matlack, G.R. Shaping the second-growth forest: Fine-scale land use change in the Ohio Valley over 120 years. Landsc. Ecol. 2021, 36, 3507–3521. [Google Scholar] [CrossRef]
- Motzkin, G.; Wilson, P.; Foster, D.R.; Allen, A. Vegetation patterns in heterogeneous landscapes: The importance of history and environment. J. Veg. Sci. 1999, 10, 903–920. [Google Scholar] [CrossRef]
- Stueve, K.M.; Perry, C.H.; Nelson, M.D.; Healey, S.P.; Hill, A.D.; Moisen, G.G.; Cohen, W.B.; Gormanson, D.D.; Huang, C. Ecological importance of intermediate windstorms rivals large, infrequent disturbances in the northern Great Lakes. Ecosphere 2011, 2, 1–21. [Google Scholar] [CrossRef]
- Tao, X.; Huang, C.; Zhao, F.; Schleeweis, K.; Masek, J.; Liang, S. Mapping forest disturbance intensity in North and South Carolina using annual Landsat observations and field inventory data. Remote Sens. Environ. 2019, 221, 351–362. [Google Scholar] [CrossRef]
- Ping, X.; Chang, Y.; Liu, M.; Hu, Y.; Huang, W.; Shi, S.; Jia, Y.; Li, D. Carbon emission and redistribution among forest carbon pools, and change in soil nutrient content after different severities of forest fires in Northeast China. Forests 2022, 13, 110. [Google Scholar] [CrossRef]
- Thom, D.; Seidl, R. Natural disturbance impacts on ecosystem services and biodiversity in temperate and boreal forests. Biol. Rev. 2016, 91, 760–781. [Google Scholar] [CrossRef]
- Cantarello, E.; Newton, A.C.; Martin, P.A.; Evans, P.M.; Gosal, A.; Lucash, M.S. Quantifying resilience of multiple ecosystem services and biodiversity in a temperate forest landscape. Ecol. Evol. 2017, 7, 9661–9675. [Google Scholar] [CrossRef]
- Trumbore, S.; Brando, P.; Hartmann, H. Forest health and global change. Science 2015, 349, 814–818. [Google Scholar] [CrossRef]
- Wei, X.; Hayes, D.J.; Fraver, S.; Chen, G. Global pyrogenic carbon production during recent decades has created the potential for a large, long-term sink of atmospheric CO2. J. Geophys. Res. Biogeosciences 2018, 123, 3682–3696. [Google Scholar] [CrossRef]
- Bonan, G.B. Forests and climate change: Forcings, feedbacks, and the climate benefits of forests. Science 2008, 320, 1444–1449. [Google Scholar] [CrossRef] [PubMed]
- Stevens, J.T.; Boisramé, G.F.S.; Rakhmatulina, E.; Thompson, S.E.; Collins, B.M.; Stephens, S.L. Forest vegetation change and its impacts on soil water following 47 years of managed wildfire. Ecosystems 2020, 23, 1547–1565. [Google Scholar] [CrossRef]
- Li, Y.; Liu, Y.; Bohrer, G.; Cai, Y.; Wilson, A.; Hu, T.; Wang, Z.; Zhao, K. Impacts of forest loss on local climate across the conterminous United States: Evidence from satellite time-series observations. Sci. Total Environ. 2022, 802, 149651. [Google Scholar] [CrossRef] [PubMed]
- Alkama, R.; Cescatti, A. Biophysical climate impacts of recent changes in global forest cover. Science 2016, 351, 600–604. [Google Scholar] [CrossRef] [PubMed]
- Frolking, S.; Palace, M.W.; Clark, D.B.; Chambers, J.Q.; Shugart, H.H.; Hurtt, G.C. Forest disturbance and recovery: A general review in the context of spaceborne remote sensing of impacts on aboveground biomass and canopy structure. J. Geophys. Res. Biogeosciences 2009, 114, JG000911. [Google Scholar] [CrossRef]
- Adámek, M.; Hadincová, V.; Wild, J. Long-term effect of wildfires on temperate Pinus sylvestris forests: Vegetation dynamics and ecosystem resilience. For. Ecol. Manag. 2016, 380, 285–295. [Google Scholar] [CrossRef]
- Burton, P.J.; Parisien, M.A.; Hicke, J.A.; Hall, R.J.; Freeburn, J.T. Large fires as agents of ecological diversity in the North American boreal forest. Int. J. Wildland Fire 2008, 17, 754–767. [Google Scholar] [CrossRef]
- Marcos, B.; Gonçalves, J.; Alcaraz-Segura, D.; Cunha, M.; Honrado, J.P. Assessing the resilience of ecosystem functioning to wildfires using satellite-derived metrics of post-fire trajectories. Remote Sens. Environ. 2023, 286, 113441. [Google Scholar] [CrossRef]
- Qiu, L.; Fan, L.; Sun, L.; Zeng, Z.; Feng, L.; Yue, C.; Zheng, C. Higher burn severity stimulates postfire vegetation and carbon recovery in California. Agric. For. Meteorol. 2023, 342, 109750. [Google Scholar] [CrossRef]
- Davis, K.T.; Robles, M.D.; Kemp, K.B.; Higuera, P.E.; Chapman, T.; Metlen, K.L.; Peeler, J.L.; Rodman, K.C.; Woolley, T.; Addington, R.N.; et al. Reduced fire severity offers near-term buffer to climate-driven declines in conifer resilience across the western United States. Proc. Natl. Acad. Sci. USA 2023, 120, e2208120120. [Google Scholar] [CrossRef]
- Hislop, S.; Jones, S.; Soto-Berelov, M.; Skidmore, A.; Haywood, A.; Nguyen, T.H. High fire disturbance in forests leads to longer recovery, but varies by forest type. Remote Sens. Ecol. Conserv. 2019, 5, 376–388. [Google Scholar] [CrossRef]
- Zhu, Z.; Zhang, J.; Yang, Z.; Aljaddani, A.H.; Cohen, W.B.; Qiu, S.; Zhou, C. Continuous monitoring of land disturbance based on Landsat time series. Remote Sens. Environ. 2020, 238, 111116. [Google Scholar] [CrossRef]
- Woodcock, C.E.; Loveland, T.R.; Herold, M.; Bauer, M.E. Transitioning from change detection to monitoring with remote sensing: A paradigm shift. Remote Sens. Environ. 2020, 238, 111558. [Google Scholar] [CrossRef]
- Zhu, Z.; Woodcock, C.E. Continuous change detection and classification of land cover using all available Landsat data. Remote Sens. Environ. 2014, 144, 152–171. [Google Scholar] [CrossRef]
- Vogelmann, J.E.; Xian, G.; Homer, C.; Tolk, B. Monitoring gradual ecosystem change using Landsat time series analyses: Case studies in selected forest and rangeland ecosystems. Remote Sens. Environ. 2012, 122, 92–105. [Google Scholar] [CrossRef]
- Vanderhoof, M.K.; Hawbaker, T.J.; Ku, A.; Merriam, K.; Berryman, E.; Cattau, M. Tracking rates of postfire conifer regeneration vs. deciduous vegetation recovery across the western United States. Ecol. Appl. 2021, 31, e02237. [Google Scholar] [CrossRef]
- Kennedy, R.E.; Yang, Z.; Cohen, W.B. Detecting trends in forest disturbance and recovery using yearly Landsat time series: 1. LandTrendr—Temporal segmentation algorithms. Remote Sens. Environ. 2010, 114, 2897–2910. [Google Scholar] [CrossRef]
- Huang, C.; Goward, S.N.; Masek, J.G.; Thomas, N.; Zhu, Z.; Vogelmann, J.E. An automated approach for reconstructing recent forest disturbance history using dense Landsat time series stacks. Remote Sens. Environ. 2010, 114, 183–198. [Google Scholar] [CrossRef]
- Coops, N.C.; Shang, C.; Wulder, M.A.; White, J.C.; Hermosilla, T. Change in forest condition: Characterizing non-stand replacing disturbances using time series satellite imagery. For. Ecol. Manag. 2020, 474, 118370. [Google Scholar] [CrossRef]
- Morin-Bernard, A.; Achim, A.; Coops, N.C. Attributing a causal agent and assessing the severity of non-stand replacing disturbances in a northern hardwood forest using Landsat-derived vegetation indices. Can. J. Remote Sens. 2023, 49, 2196356. [Google Scholar] [CrossRef]
- Hermosilla, T.; Wulder, M.A.; White, J.C.; Coops, N.C.; Hobart, G.W. Regional detection, characterization, and attribution of annual forest change from 1984 to 2012 using Landsat-derived time-series metrics. Remote Sens. Environ. 2015, 170, 121–132. [Google Scholar] [CrossRef]
- Xian, G.Z.; Smith, K.; Wellington, D.; Horton, J.; Zhou, Q.; Li, C.; Auch, R.; Brown, J.F.; Zhu, Z.; Reker, R.R. Implementation of the CCDC algorithm to produce the LCMAP Collection 1.0 annual land surface change product. Earth Syst. Sci. Data 2022, 14, 143–162. [Google Scholar] [CrossRef]
- Brown, J.F.; Tollerud, H.J.; Barber, C.P.; Zhou, Q.; Dwyer, J.L.; Vogelmann, J.E.; Loveland, T.R.; Woodcock, C.E.; Stehman, S.V.; Zhu, Z.; et al. Lessons learned implementing an operational continuous United States national land change monitoring capability: The Land Change Monitoring, Assessment, and Projection (LCMAP) approach. Remote Sens. Environ. 2020, 238, 111356. [Google Scholar] [CrossRef]
- Loveland, T.; Sohl, T.; Stehman, S.; Gallant, A.; Sayler, K.; Napton, D. A strategy for estimating the rates of recent United States land-cover changes. Photogramm. Eng. Remote Sens. 2002, 68, 1091–1099. [Google Scholar]
- Sleeter, B.M.; Sohl, T.L.; Loveland, T.R.; Auch, R.F.; Acevedo, W.; Drummond, M.A.; Sayler, K.L.; Stehman, S.V. Land-cover change in the conterminous United States from 1973 to 2000. Glob. Environ. Chang. 2013, 23, 733–748. [Google Scholar] [CrossRef]
- U.S. Geological Survey. Status and Trends of Land Change in the United States—1973 to 2000; U.S. Geological Survey: Reston, VA, USA, 2016. [Google Scholar]
- Sleeter, B.M.; Wilson, T.S.; Acevedo, W. (Eds.) Status and Trends of Land Change in the Western United States—1973 to 2000; U.S. Geological Survey Professional Paper 1794–A; U.S. Geological Survey: Reston, VA, USA, 2012. [Google Scholar]
- Taylor, J.L.; Acevedo, W.; Auch, R.F.; Drummond, M.A. (Eds.) Status and Trends of Land Change in the Great Plains of the United States—1973 to 2000; U.S. Geological Survey Professional Paper 1794–B; U.S. Geological Survey: Reston, VA, USA, 2015; p. 180. [Google Scholar] [CrossRef]
- Auch, R.F.; Karstensen, K.A. (Eds.) Status and Trends of Land Change in the Midwest–South Central United States—1973 to 2000; U.S. Geological Survey Professional Paper 1794–C; U.S. Geological Survey: Reston, VA, USA, 2015. [Google Scholar] [CrossRef]
- Sayler, K.L.; Acevedo, W.; Taylor, J.L. (Eds.) Status and Trends of Land Change in the Eastern United States—1973 to 2000; U.S. Geological Survey Professional Paper 1794–D; U.S. Geological Survey: Reston, VA, USA, 2016. [Google Scholar] [CrossRef]
- Pengra, B.W.; Stehman, S.V.; Horton, J.A.; Wellington, D.F. Land Change Monitoring, Assessment, and Projection (LCMAP) Collection 1.2 Annual Land Cover and Land Cover Change Validation Tables (1985–2018) for the Conterminous United States; U.S. Geological Survey Data Release; U.S. Geological Survey: Reston, VA, USA, 2021. [Google Scholar] [CrossRef]
- Pengra, B.W.; Stehman, S.V.; Horton, J.A.; Dockter, D.J.; Schroeder, T.A.; Yang, Z.; Cohen, W.B.; Healey, S.P.; Loveland, T.R. Quality control and assessment of interpreter consistency of annual land cover reference data in an operational national monitoring program. Remote Sens. Environ. 2020, 238, 111261. [Google Scholar] [CrossRef]
- Cohen, W.B.; Yang, Z.; Kennedy, R. Detecting trends in forest disturbance and recovery using yearly Landsat time series: 2. TimeSync—Tools for calibration and validation. Remote Sens. Environ. 2010, 114, 2911–2924. [Google Scholar] [CrossRef]
- Stehman, S.V.; Pengra, B.W.; Horton, J.A.; Wellington, D.F. Validation of the U.S. Geological Survey’s Land Change Monitoring, Assessment and Projection (LCMAP) Collection 1.0 annual land cover products 1985–2017. Remote Sens. Environ. 2021, 265, 112646. [Google Scholar] [CrossRef]
- Zhu, Z.; Woodcock, C.E.; Holden, C.; Yang, Z. Generating synthetic Landsat images based on all available Landsat data: Predicting Landsat surface reflectance at any given time. Remote Sens. Environ. 2015, 162, 67–83. [Google Scholar] [CrossRef]
- Homer, C.; Dewitz, J.; Yang, L.; Jin, S.; Danielson, P.; Xian, G.; Coulston, J.; Herold, N.; Wickham, J.; Megown, K. Completion of the 2011 National Land Cover Database for the conterminous United States—Representing a decade of land cover change information. Photogramm. Eng. Remote Sens. 2015, 81, 345–354. [Google Scholar]
- White, J.C.; Wulder, M.A.; Hermosilla, T.; Coops, N.C.; Hobart, G.W. A nationwide annual characterization of 25 years of forest disturbance and recovery for Canada using Landsat time series. Remote Sens. Environ. 2017, 194, 303–321. [Google Scholar] [CrossRef]
- Meng, R.; Dennison, P.E.; Huang, C.; Moritz, M.A.; D’Antonio, C. Effects of fire severity and post-fire climate on short-term vegetation recovery of mixed-conifer and red fir forests in the Sierra Nevada Mountains of California. Remote Sens. Environ. 2015, 171, 311–325. [Google Scholar] [CrossRef]
- Wickham, J.; Stehman, S.V.; Sorenson, D.G.; Gass, L.; Dewitz, J.A. Thematic accuracy assessment of the NLCD 2016 land cover for the conterminous United States. Remote Sens. Environ. 2021, 257, 112357. [Google Scholar] [CrossRef]
- Homer, C.; Dewitz, J.; Jin, S.; Xian, G.; Costello, C.; Danielson, P.; Gass, L.; Funk, M.; Wickham, J.; Stehman, S.; et al. Conterminous United States land cover change patterns 2001–2016 from the 2016 National Land Cover Database. ISPRS J. Photogramm. Remote Sens. 2020, 162, 184–199. [Google Scholar] [CrossRef]
- Howard, J.L.; Liang, S.U.S. Timber Production, Trade, Consumption, and Price Statistics, 1965–2017; U.S. Forest Service, Research Paper FPL-RP-701; U.S. Department of Agriculture: Washington, DC, USA, 2019. [Google Scholar] [CrossRef]
- Wear, D.N.; Murray, B.C. Federal timber restrictions, interregional spillovers, and the impact on US softwood markets. J. Environ. Econ. Manag. 2004, 47, 307–330. [Google Scholar] [CrossRef]
- Hirt, P.W. A Conspiracy of Optimism: Management of the National Forests Since World War Two; University of Nebraska Press: Lincoln, NE, USA, 1994. [Google Scholar]
- Conard, S.; Hartzell, T.; Hilbruner, M.; Zimmerman, G. Changing fuel management strategies—The challenge of meeting new information and analysis needs. Int. J. Wildland Fire 2001, 10, 267–275. [Google Scholar] [CrossRef]
- Pyne, S. Review of Hudson, Mark, Fire Management in the American West: Forest Politics and the Rise of Megafires; H-Environment, H-Net Reviews: Lansing, MI, USA, 2011. [Google Scholar]
- Crow, T.R. A framework for restoration in the national forests. In Integrated Restoration of Forested Ecosystems to Achieve Multiresource Benefits: Proceedings of the 2007 National Silviculture Workshop; Deal, R.L., Ed.; Gen. Tech. Rep. PNW-GTR-733; U.S. Department of Agriculture, Forest Service, Pacific Northwest Research Station: Portland, OR, USA, 2008; pp. 13–21. [Google Scholar]
- Hudson, M. Fire Management in the American West: Forest Politics and the Rise of Megafires; University Press of Colorado: Denver, CO, USA, 2011. [Google Scholar]
- Auch, R.F.; Wellington, D.F.; Taylor, J.L.; Stehman, S.V.; Tollerud, H.J.; Brown, J.F.; Loveland, T.R.; Pengra, B.W.; Horton, J.A.; Zhu, Z.; et al. Conterminous United States Land-Cover Change (1985–2016): New Insights from Annual Time Series. Land 2022, 11, 298. [Google Scholar] [CrossRef]

Disclaimer/Publisher’s Note: The statements, opinions and data contained in all publications are solely those of the individual author(s) and contributor(s) and not of MDPI and/or the editor(s). MDPI and/or the editor(s) disclaim responsibility for any injury to people or property resulting from any ideas, methods, instructions or products referred to in the content. |
© 2024 by the authors. Licensee MDPI, Basel, Switzerland. This article is an open access article distributed under the terms and conditions of the Creative Commons Attribution (CC BY) license (https://creativecommons.org/licenses/by/4.0/).