Abstract
Wood staining is a crucial technique for enhancing the decorative effect of wood. Different mordants and mordant processes can influence the staining effect of wood. In this study, three types of mordants and mordant methods were selected to improve the color difference and colorfastness to the washing of poplar veneer, using green peanut pigment as the dye. An orthogonal test was conducted to investigate the effects of mordant temperature, mordant time, and mordant concentration on color difference and colorfastness to washing. Range and variance analysis were employed to determine these properties’ main factors. A fuzzy comprehensive evaluation method was used to evaluate and optimize the color difference value and colorfastness of washing. The results revealed that all three factors had significant impacts on both color difference and colorfastness to washing during the process of mordant staining. The optimal process conditions (temperature, concentration, time) for achieving desirable staining effects on poplar veneer were determined as 50 °C, 0.8%, and 2 h, respectively. Furthermore, Fourier transform infrared spectroscopy (FTIR), scanning electron microscopy (SEM), and X-ray diffraction (XRD) analyses demonstrated that the dye formed complexes with poplar wood, enabling it to adhere to wood grain apertures and tube walls effectively. Mordant treatment increased the crystallinity of stained wood significantly while improving its overall staining performance considerably. This study provides substantial data support for future optimization processes involving natural pigment coal staining in wood.
1. Introduction
Under the prevailing global trend of environmental degradation, wood has garnered significant attention as a renewable and eco-friendly biological substrate [1,2,3]. Due to its rich resources, wood is widely used in industry, furniture, energy, construction, and other fields [4,5]. However, due to inherent limitations in its properties, specific challenges arise when utilizing wood across different fields. For instance, the color of wood could be better, and enhancing its economic value through manufacturing and production becomes arduous. People have resorted to employing diverse dyes for staining to augment the added value of wood products. Reactive dyes and alkaline and acidic dyes are commonly used in wood staining [6]; however, their usage poses persistent ecological concerns regarding chemical waste treatment [7]. Natural dyes have gained widespread recognition and research interest due to their green nature, non-toxicity, and biodegradability of associated wastewater [8].
Peanuts are a dietary source of bioactive polyphenols, and peanut coating refers to the reddish–brown membrane that wraps around the outer surface of peanuts. Peanut coating is rich in polyphenols [9], with colors ranging from light brown to deep red. Most plant pigments, especially red, purple, and blue, belong to flavonoid anthocyanins [10]. According to the 2016 Statistical Yearbook of the Food and Agriculture Organization of the United Nations (FAO), peanut production was 43,982,066 tons, and peanut skins constituted 3% of the total kernel mass [11]. Peanut coating, as an agricultural residue from the peanut processing industry, is usually thrown away as waste, and only a tiny amount is used in experimental research or processed into animal feed and food additives. As early as 1982, Motoda, S. was able to use polyphenol oxidase to extract 15% of flavonoid pigments in peanut coats and found that these pigments were readily soluble in water, had particular light and heat resistance, and were less affected by metal ions [12]. In order to study the staining process of peanut coat pigment, Pandey et al., extracted dyes from roasted peanut skins and used them to stain cotton, silk, and wool fabrics. The results showed that silk had the highest staining rate, and the dyed samples had good colorfastness to washing, ultraviolet protection, and skin affinity [13]. Elsorady et al., used solvents with different ethanol concentrations to extract phenolic substances from peanut coats and found that extracts with an ethanol content of 80% had the highest total phenol content and the highest free radical scavenging activity. It has been found that peanut coat is rich in phenolic antioxidants, so peanut coat extract is likely to become an essential source of natural antioxidants in the future [14].
Poplar is a fast-growing, loose, broad-leaved wood with poor wood performance [15,16]. Therefore, wood modification, wood pretreatment, and other technologies have been developed to meet people’s different needs for wood [17,18,19]. In the study of wood pretreatment, Sun et al., using the single factor method, studied the optimal conditions of freeze–thaw cycle pretreatment of poplar, and the results showed that poplar could have a higher staining rate under the treatment conditions of freezing time 11.9 h, thawing time 7.2 h, and cycling twice [20]. Wu et al., determined the elastic modulus (E-r) and hardness (H) of the cell wall and coating of Pinus massoniana Lamb wood after heat treatment at different temperatures using the nanoindentation method and analyzed and studied the factors affecting the mechanical properties during the thermal modification process [21]. The wood cell wall is composed of cellulose, hemicellulose, and lignin [22,23], and the cell wall constitutes the main form of wood, so the essence of wood modification is to change the permeability, hygroscopicity, and permeability of the wood cell wall [24]. Wood fiber is rich in hydrophilic groups (such as carboxyl and hydroxyl groups) [15,25].
Wood staining refers to the dye within an aqueous solution moving through the wood capillary channel, diffusing through the wood cell wall, and settling on the fiber’s surface so that the wood stains. In the study on wood staining, Widsten et al., used fiber-reactive dyes and pine tannin to stain pine blocks, and the results showed that pine treated with pectinase had the best staining effect, which proved that pectinase pretreatment of wood could increase the absorption of fiber reactive dyes and direct dyes by the wood cell wall [26]. To achieve the best wood staining process, Nguyen et al., studied and established a method for determining the dye absorption rate in wood staining [27]. According to the different molecular structures of natural dyes, the staining mechanism is not the same, so choosing the appropriate staining method is necessary. Two main staining methods exist for natural dyes: direct staining and mordant staining [28]. Wu et al., used direct staining of wood finishes with acidic mixed dyes achieved through the orthogonal test. The results showed that the optimal staining conditions for Loblolly pine were as follows: staining temperature of about 80 °C, dye concentration of 0.5%, staining time of about 50 min, pH value of 4.5, and penetrant concentration of 0.3% [29]. There are few studies on peanut pigment staining, and most of them are limited to the extraction of crude peanut pigment. Peanut pigment is mainly used in food and textile staining, but its application in wood staining has not been reported. Therefore, in this paper, using poplar veneer as the research object, under the optimal conditions optimized in the ultrasonic direct staining pre-experiment, three mordant dyes of alum, soap alum, and blue alum were selected, and three mordant staining methods of pre-mordant staining, co-mordant staining, and post-mordant staining were used to stain poplar. The CIE chromaticity parameters (1976) L*, a*, and b* were used to calculate the value changes. We will observe the change of color difference value and washing fastness, explore the influence of different mordants on peanut coating pigment staining poplar wood, and select the best mordant and mordant process. Then, the orthogonal test will determine the influence of mordant time, mordant temperature, and mordant concentration on color difference and colorfastness, and the optimal mordant conditions will be optimized by the fuzzy comprehensive evaluation method. Using electron microscopy (SEM), Fourier infrared spectrum (FTIR), and X-ray diffraction characteristics of the wood surface, we will observe and discuss the change in the wood surface after dyeing and its mechanism.
In order to use peanut coat, a natural crop waste product, as a new type of environmentally friendly dye, the dyeing process of poplar wood was optimized. Applying it to actual industrial production as a natural, non-toxic dye will have a certain impact on today’s printing and dyeing industry, and it is also fully in line with the concept of green development in the world today.
2. Materials and Methods
2.1. Materials and Equipment
Test material: poplar wood (Hebei, China), with an air-dry density of 0.386 g/cm3 and moisture content of 12%. Select the material with specifications of 40 mm × 40 mm × 2 mm (length × width × thickness) and no defects. Homemade peanut coat pigment. Alum (KAl (SO4)2·12H2O) (Sinopharm Group Chemical Reagent Co., Ltd., Shanghai, China), soap alum (CuSO4·5H2O) (Sinopharm Group Chemical Reagent Co., Ltd., Shanghai, China), and blue alum (FeSO4·7H2O) (Sinopharm Group Chemical Reagent Co., Ltd., Shanghai, China), ethanol (Mubai Chemical Co., Ltd., Shanghai, China). Using the IBM SPSS Statistics v26 software (Suzhou, China) to analyze data.
Extraction of Peanut Pigment
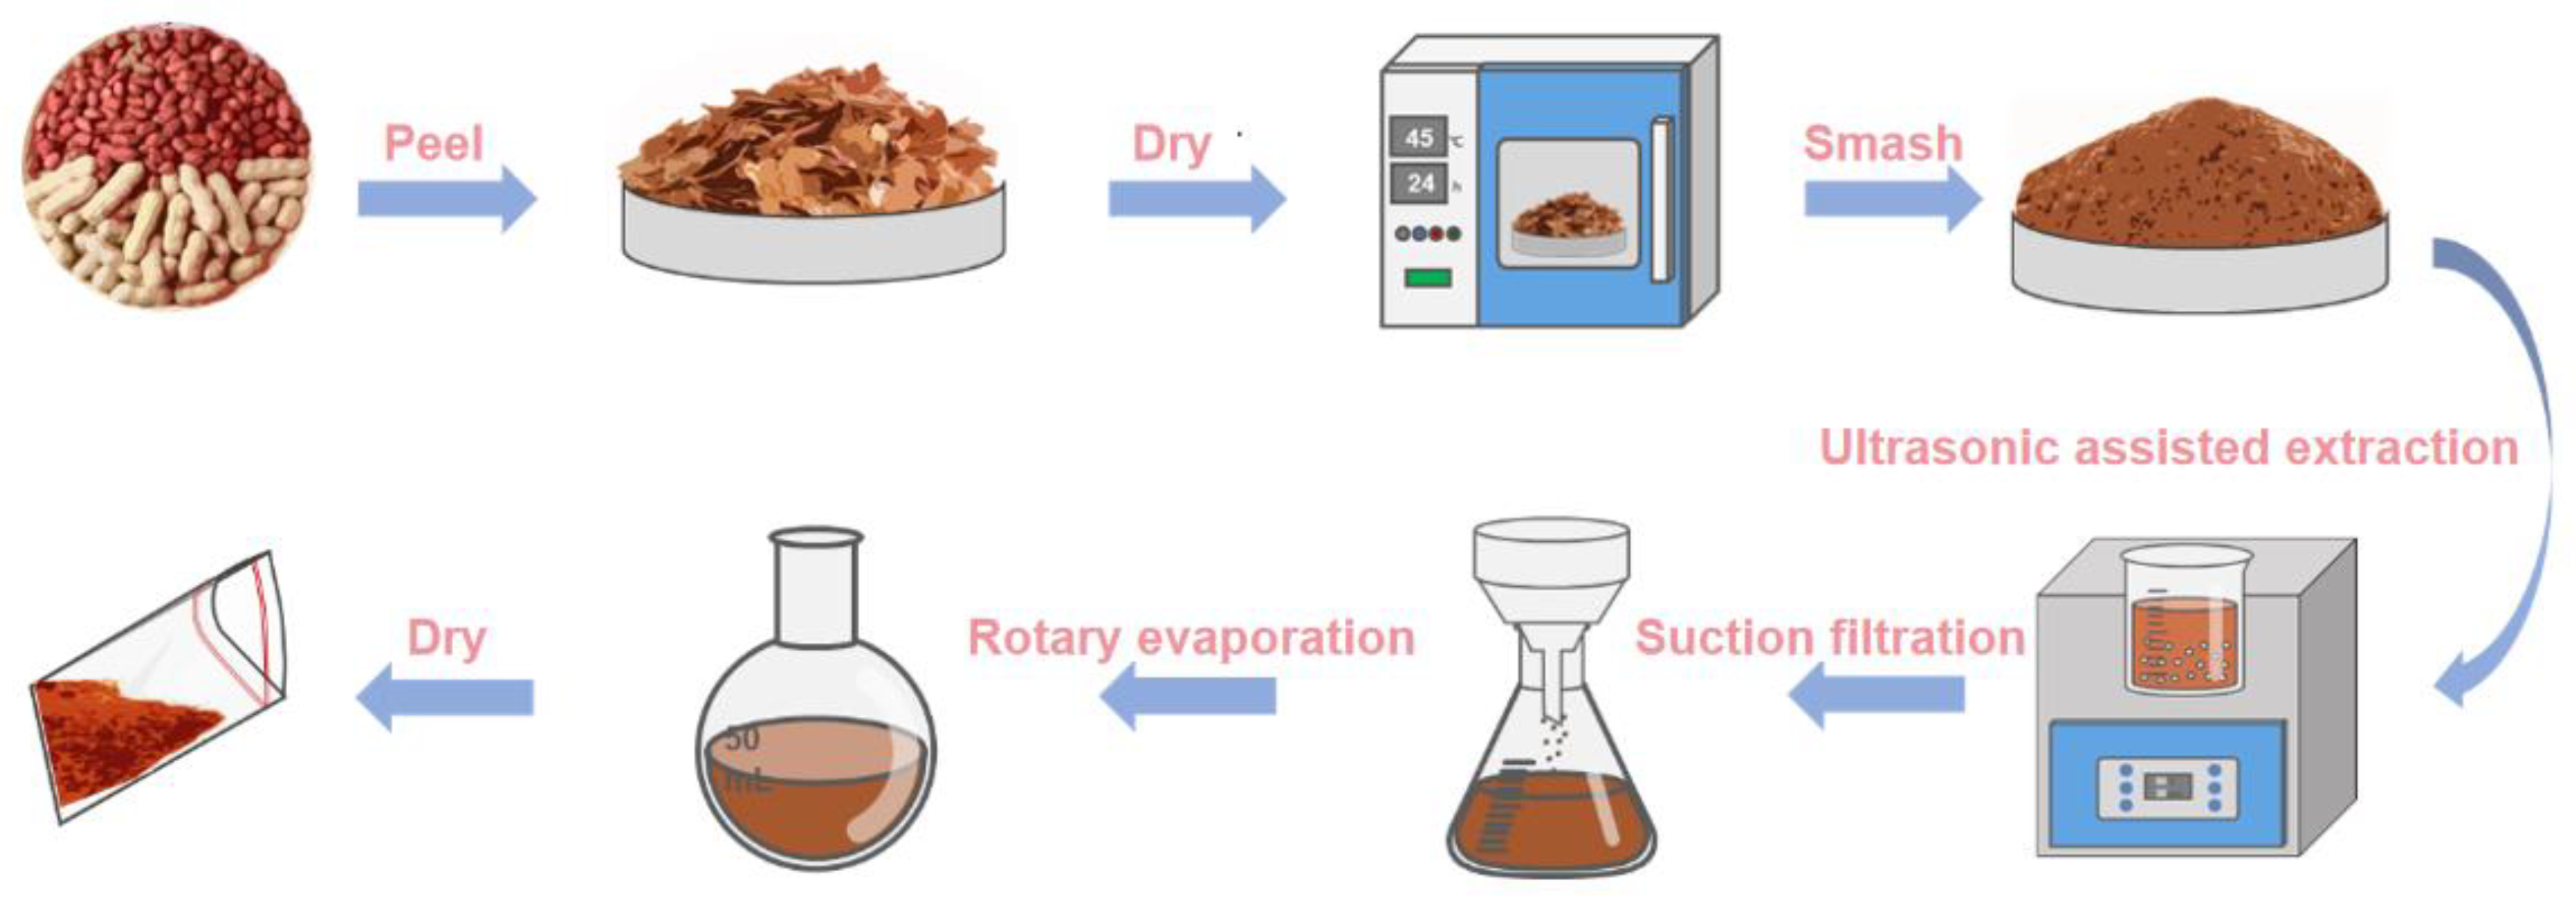
Take the appropriate amount of peanut coat (Bozhou Duandetang Biotechnology Co., Ltd., Bozhou, China), pulverize with an ultrasonic mill (Jiuyang Co., Ltd., Jinan, China, Qsonica, Q700), dry, make powder, and store for use. Ultrasonic-assisted ethanol solvent extraction was adopted. The peanut coating powder was accurately weighed and placed in a beaker, and 70% ethanol was added according to the solid–liquid ratio of 1:10 (w/v), PH = 2, and ultrasound-assisted extraction was carried out at 45 °C for 80 s. The extracted filtrate was vacuumed with a vacuum pump (XIUI Technology Co., Ltd., Shenzhen, China, SHZ-D(III)) to obtain the pigment filtrate. The mixed solution was rotated on the rotary evaporation instrument (Jinan Tongxin Biotechnology Co., Ltd., Jinan, China, RE-52) to remove the ethanol, the temperature was set at 50 °C, and the vacuum degree was set at 0.1 MPa. Finally, the concentrated liquid was freeze-dried by YANYI Scientific Instruments (Shanghai) Co., Ltd., Shanghai, China, FreeZone® into pigment powder. Figure 1 shows the process.
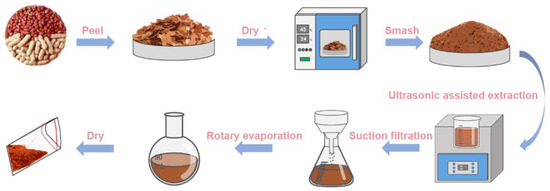
Figure 1.
Flow chart of peanut pigment extraction.
2.2. Mordant Staining Process
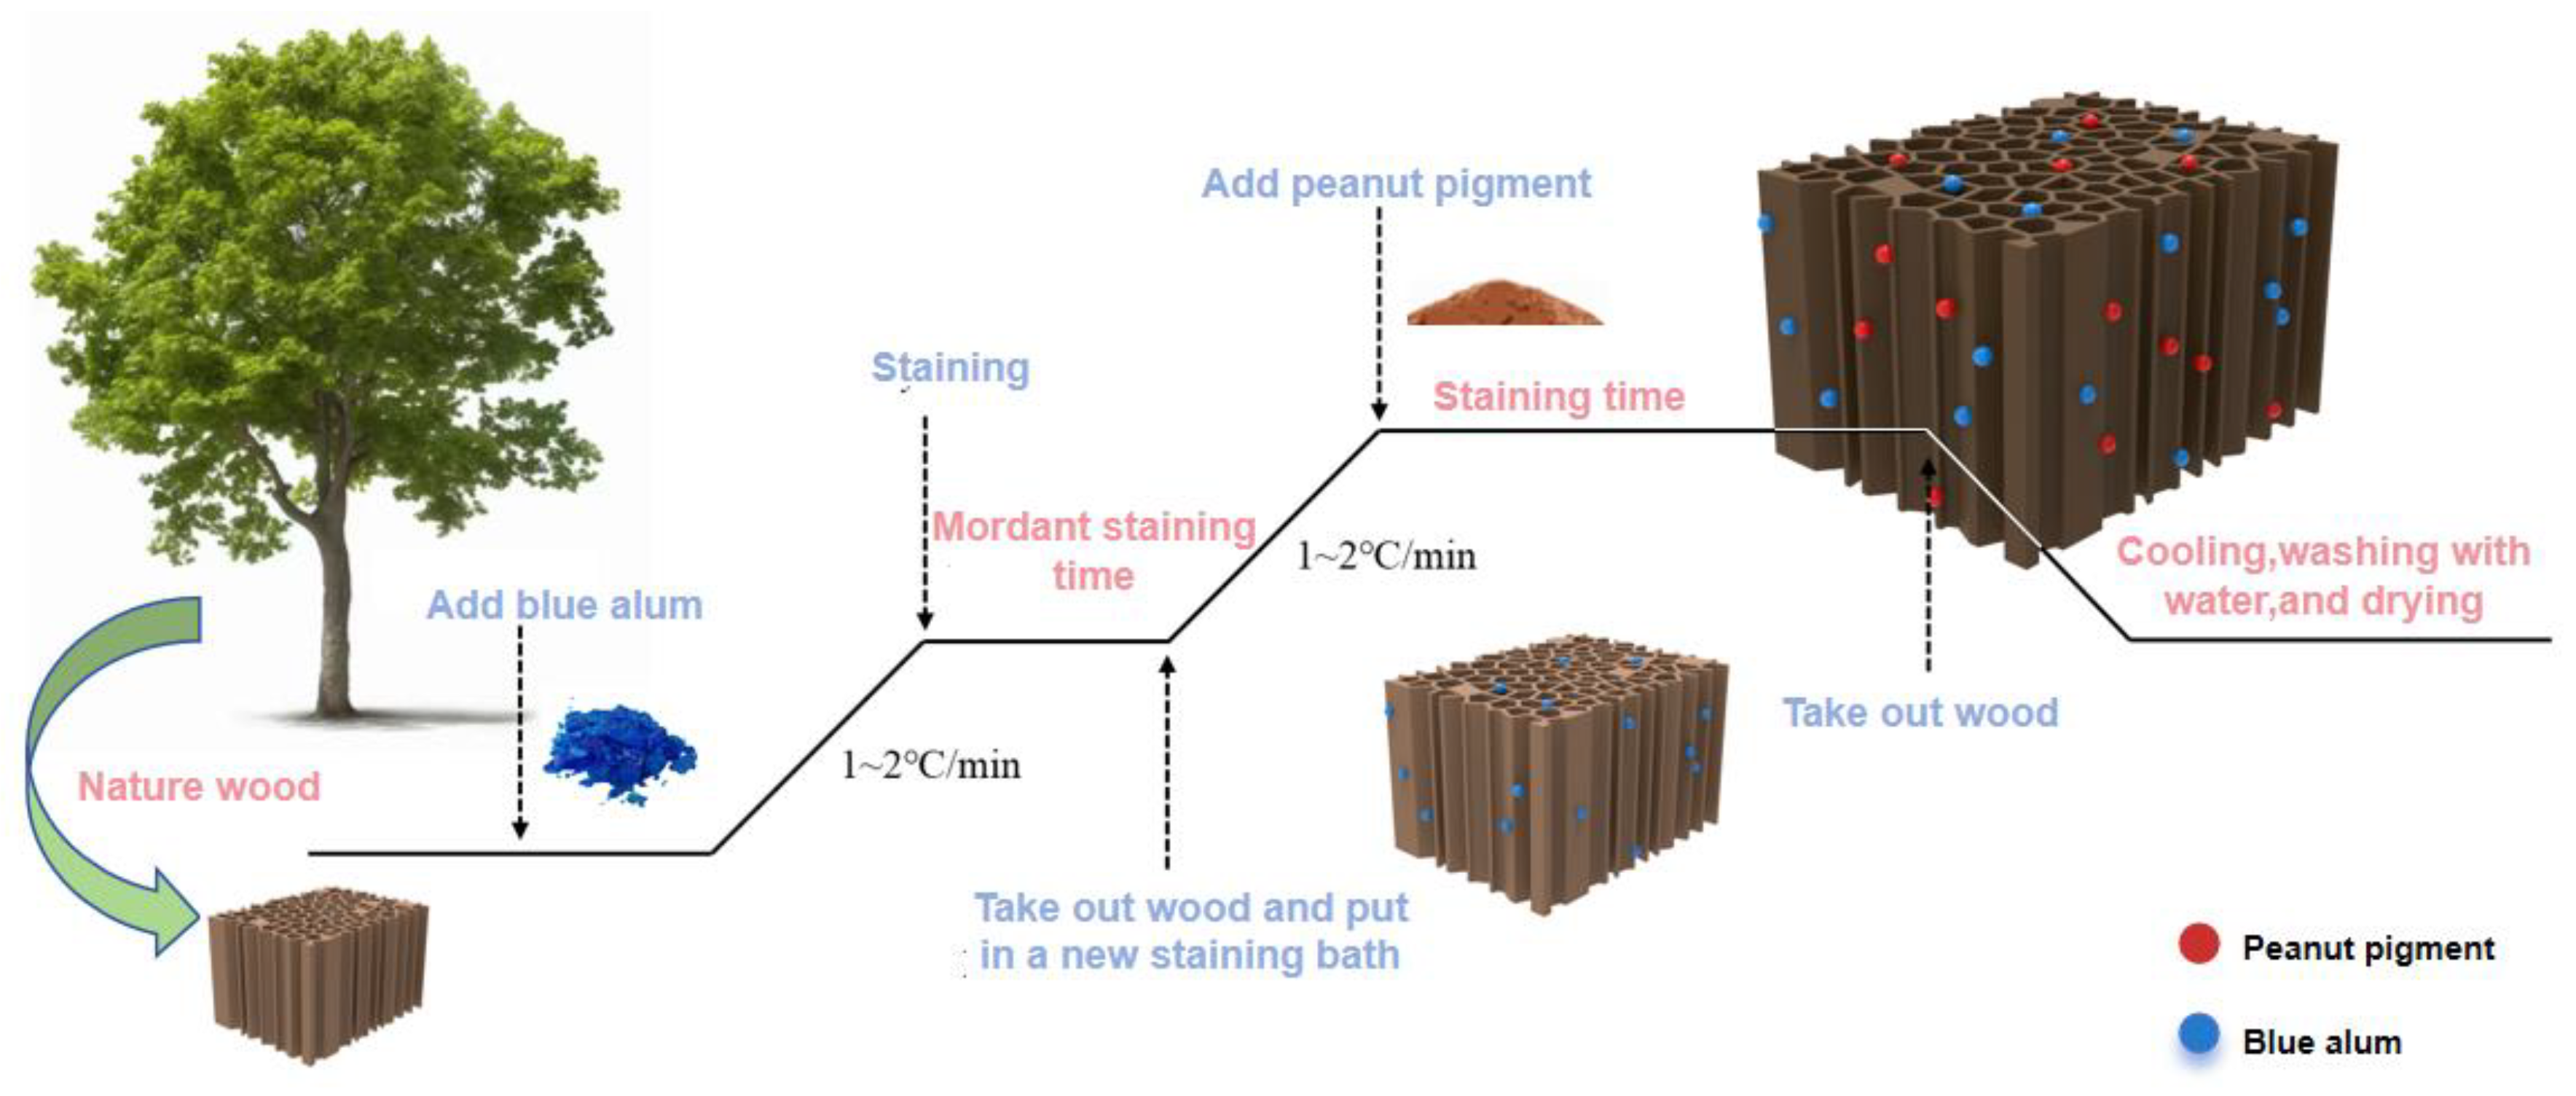
Co-mordant staining: dissolve the mordant in the dye solution and then put the wood into the dye solution to stain. Pre-mordant staining: Dissolve the mordant in water, put the wood into the mordant solution for mordant staining, and then put the dyed wood into the dye solution for staining. After-mordant staining: Unlike the former media method, the wood is soaked in the dye solution, removed, and then put into the mordant water solution for mordant staining (Figure 2).
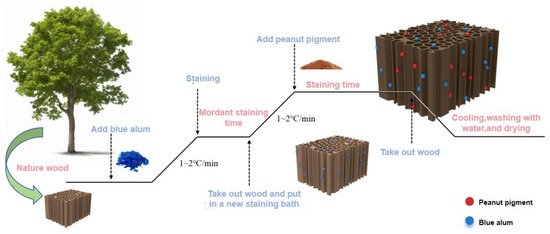
Figure 2.
Pre-mordant staining process.
In order to improve the colorfastness of poplar staining with peanut coat pigment, obtain a better staining effect, and enrich the hue of the stain, we used the direct dyeing method of the orthogonal experiment and fuzzy comprehensive evaluation method for staining of poplar. In a solution, we added alum, soap alum, or blue vitriol (three mordants) and used three methods of mordant staining of poplar. We will not add a mordant dye set to the control group to explore how mordant can affect wood staining. We will explore the influence of different mordants on the peanut coat pigment staining poplar, select the mordant with the best dyeing effect, and further explore the best mordant dyeing process of this mordant dyeing poplar.
2.3. Single Factor Experiment of Mordant Staining
We will observe the color difference before and after staining and washing. The mordant temperature, time, and concentrations are indicators for the single-factor experiment. The optimized parameters used in this experiment are mordant temperature: 30 °C, 40 °C, 50 °C, 60 °C, and 70 °C; mordant time: 0.5 h, 1 h, 1.5 h, 2 h, and 2.5 h; mordant concentration: 0.2%, 0.4%, 0.6%, 0.8%, and 1%.
2.4. Single Factor Experiment of Direct Staining
The peanut pigment without mordant was set as the control group to explore whether mordant dyeing had an effect on peanut dyeing. In order to reduce the interference of other factors, the experiment was carried out by using the dye solution with 0.6% peanut pigment concentration and the mordant with 0.4% peanut pigment concentration. The optimization parameters used in this experiment are as follows: temperature: 30 °C, 40 °C, 50 °C, 60 °C, and 70 °C; staining time: 0.5 h, 1 h, 1.5 h, 2 h, and 2.5 h.
2.5. Mordant Orthogonal Test
Taking three influencing factors, mordant staining time, mordant staining temperature, and mordant concentration, we chose three levels for the orthogonal experiment, and before and after the poplar veneer dyeing color difference and wash fastness as the optimization index. The horizontal coding of orthogonal test factors for mordant staining of peanut coat pigment is shown in Table 1.

Table 1.
Horizontal coding table of mordant orthogonal test factors.
2.6. Fuzzy Comprehensive Evaluation Method
For wood staining involving multi-index evaluation, obtaining a consistent, optimized process combination is impossible by evaluating only a single index. Therefore, it is necessary to use the fuzzy comprehensive evaluation method for reference to comprehensively evaluate the color difference value and colorfastness and optimize the staining process parameters of wood according to the evaluation value [30]. Firstly, according to the principle of fuzzy mathematics, the fuzzy comprehensive evaluation uses the established membership function to transform the measured values to map the index values to the [0,1] interval and make each index value fuzzy [31]. Then, the expert method is used to determine the weight distribution. Finally, the comprehensive evaluation model is used for comprehensive evaluation and level optimization, and the optimal process parameters are selected.
2.7. Color Difference Determination
Select five marking points on the front of each veneer and measure the marked part of the circle with a colorimeter. The chromaticity parameters of CIE (1976) L*, a*, and b* were used to calculate ∆L*, ∆a*, ∆b*, and ∆E*. The greater the ∆E*, the more significant the color difference of wood before and after treatment. On the contrary, the smaller the ∆E*, the smaller the color difference between the wood before and after treatment. Calculate the color difference by Equation (1):
where ∆L* = L1* − L0*; ∆a* = a1* − a0*; ∆b* = b1* − b0*; ∆E* indicates the color difference of veneer, in NBS; ∆L* reflects the brightness of single board; ∆a* reflects the color saturation of the red–green axis of veneer; ∆b* reflects the color saturation of the veneer yellow–blue axis; L0*, a0*, and b0* represent the chromaticity values of the specimen before pretreatment; L1*, a1*, and b1* represent the chromaticity value of the pretreated specimen [32].
2.8. Determination of Colorfastness to Washing of Dyed Veneer
Take the color difference of dyed veneer before and after washing as the index of washing colorfastness grade [33], and classify the colorfastness grade according to GB/T 250-2008 [34] Gray Sample Card for Evaluating Color Change, as shown in Table 2. Put 100 mL pure water into a 250 mL beaker, then add the dyed poplar veneer whose chromaticity value has been measured and heat it in a constant temperature water bath at 60 °C for 2 h. After that, take out the sample and wash away the floating color. After drying, continue to measure the chromaticity value of the surface [35]. Calculate the color difference before and after washing using Equation (1).

Table 2.
Color difference and gray card grade comparison.
2.9. Scanning Electron Microscope (SEM) Test
We used a scanning electron microscope (FEI Company QUANTA200, Hillsboro, OR, USA) with a magnification of 500–200,000 times and a resolution of 3 nm. The morphology of wood fiber before and after staining was observed by adjusting the magnification and resolution under 20 KV acceleration voltage [36]. The test materials were prepared into 3 mm × 3 mm × 1 mm absolute dry wood chips, and then they were glued to the metal observation platform with conductive glue. We put the observation platform into a sputtering instrument for gold spraying. The observation platform sprayed with gold was put into a scanning electron microscope.
2.10. X-ray Diffraction (XRD) Test
We dried the sample in a drying oven and cut it into 18 mm × 15 mm × 1 mm samples. The test conditions were as follows: scanning range of 5~50, scanning speed of 5°/min, sampling step width of 0.02, a slit of 10 mm, box emitter voltage of 40 KV, and radiation tube current of 20 mA.
The crystallization zone and setting zone area are not easy to measure, so the Segal method, which is usually used in this experiment, is selected. Record the diffraction maximum peak in the area of 2θ = 22° and the peak of the valley around 2θ = 18° on the diffraction curve and calculate its crystallization index according to Equation (2).
In Equation (2), CrI is the crystallization index; I002 is the maximum diffraction intensity of the central crystal peak 002; Iamorph is the scattering intensity of amorphous background diffraction near 2θ = 18°.
2.11. Fourier Infrared Spectroscopy (FTIR) Test
Before the test, the sample was placed in the 103 °C drying drum wind-drying oven. Then, the sample was placed in the sample optical path of the infrared spectrometer, scanned by ATR mode, and its infrared spectrum data were recorded. The window background and scanning measurement were first to remove the interference. The scanning times were 16 times, and the wave number range was 4000 cm−1–500 cm−1 [37].
3. Results and Discussion
3.1. Effects of Different Mordants and Mordant Staining Methods on the Staining Effect of Peanut Coat Pigment
Table 3 shows the influence of mordant staining on color difference value under different conditions. According to the GB/T 250-2008 Gray Sample Card for Evaluating Discoloration [34], the surface colorfastness of objects is divided into the following grades, and the specific test results are shown in Table 4.

Table 3.
Effects of different mordants and mordant staining methods on color difference.

Table 4.
Effects of different mordants and mordant staining methods on colorfastness to washing.
From the above test data, it can be seen that under the same dyeing conditions using alum as mordant, the color is similar; co-mordant staining, pre-mordant staining, and after-mordant staining show different depths of reddish–brown. The data of L* showed after-mordant staining > pre-mordant staining > co-mordant staining; a* data showed pre-mordant staining > staining > after-mordant staining; b* shows pre-mordant staining > after-mordant staining > after-mordant staining; the color difference value shows co-mordant staining > pre-mordant staining > after-mordant staining; colorfastness level shows co-mordant staining > pre-mordant staining > after-mordant staining. This shows that the color gamut of the after-mordant staining sample is higher, the red and yellow tendencies of the pre-mordant staining sample are the most obvious, and the samples with the co-mordant staining sample have the best coloring effect, and the colorfastness level is also the worst, which is obvious to the human eye.
When soap alum mordant was used as a mordant, the color samples were obviously different; the after-mordant staining samples were grayish–brown, and the co-mordant staining and the pre-mordant staining were grayish–black. This is because iron ions easily combine with phenolic hydroxyl groups to form blue complexes. The L* data showed that after-mordant staining > pre-mordant staining > co-mordant staining; a* data showed after-mordant staining > pre-mordant staining > co-mordant staining; b* data showed pre-mordant staining > after-mordant staining > co-mordant staining; the color difference data shows co-mordant staining > pre-mordant staining > after-mordant staining. This shows that the color sample dyed by the after-mordant staining sample has higher brightness and correspondingly the lowest coloring rate, and the red tendency is the most obvious. The pre-mordant staining sample has a stronger yellow tendency, and the co-mordant staining sample has the best color rate, but the color difference before and after washing is large, and the feeling is strong.
Using blue alum as a mordant, similar colors of reddish–brown were shown. The data of L* showed pre-mordant staining > after-mordant staining > co-mordant staining; a* data showed pre-mordant staining > after-mordant staining > co-mordant staining; b* data showed homomorph > pre-mordant staining > post-mordant; the color difference value is displayed as co-mordant staining > pre-mordant staining > after-mordant staining. This indicates that the color gamut of the pre-mordant staining sample is higher, the red tendency of the pre-mordant staining sample is stronger, the colorfastness of the co-mordant staining sample is the lowest, and the visual sensation is obvious.
To sum up, under the conditions of three mordants and mordant staining methods, peanut coat dyes show lightness, different shades of reddish–brown, gray–brown, black–gray, and so on, and the staining effect of three mordants on poplar trees have been improved to varying degrees [38]. Different mordants and mordant staining methods affect the lightness, color tendency, and colorfastness of color samples [39]. Among them, soapy alum as mordant has the most significant color difference, but it changes the original color of natural peanut skin pigment and has a poor colorfastness grade [40]. However, the color samples stained by the alum pre-mordant staining method have higher color differences and better colorfastness, which can be further optimized in subsequent experiments [41].
3.2. Analysis of Single Factor Experiment Results of Peanut Coat Pigment Mordant Staining
Through the above test analysis, it can be seen that when using alum as a mordant staining poplar wood, its color sample color difference is large, and the colorfastness is good, so this supports the use of alum as a mordant.
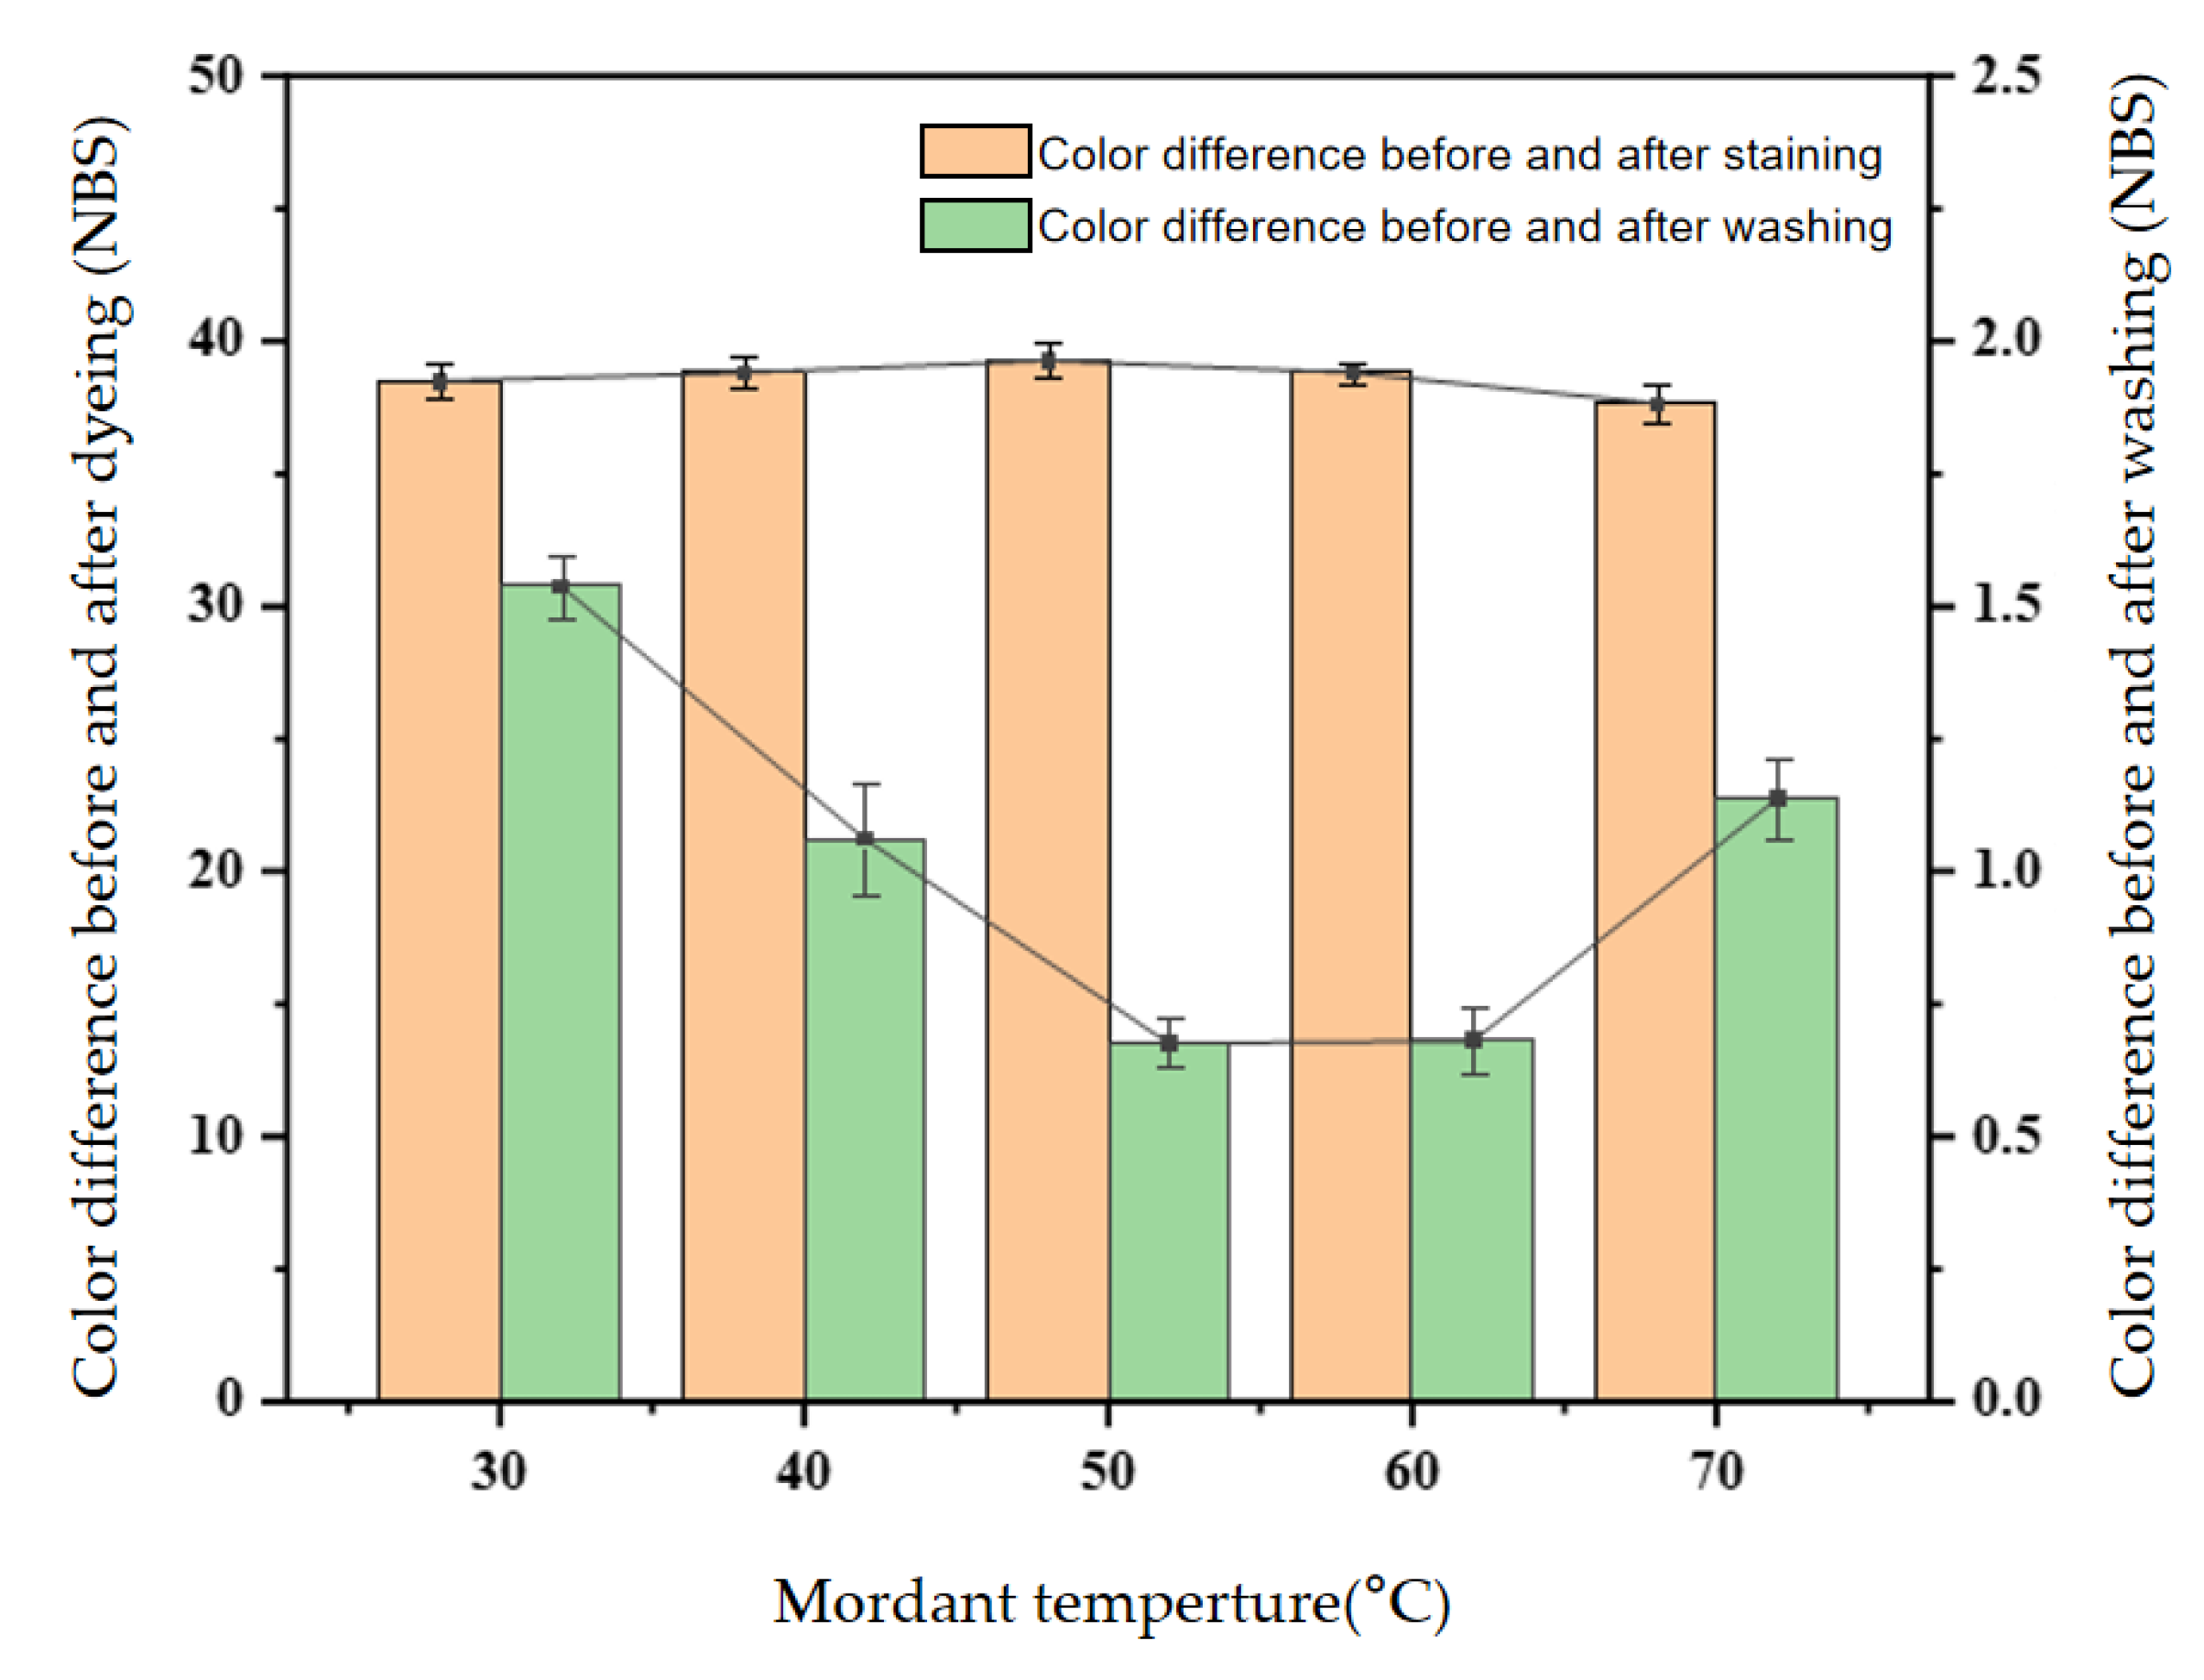
The color difference value of the staining wood is highest at 50 °C, as illustrated in Figure 3. Insufficient premium temperature leads to inadequate fixation of color on wood, with metal ions failing to penetrate the interior fibers and remaining on the surface, resulting in floating color. As temperature increases, the molecular movement within the dye solution intensifies, facilitating enhanced penetration of mordant and dye into the fiber’s interior. However, excessively high temperatures can have a detrimental impact on staining effectiveness; therefore, a more controlled temperature range should be considered.
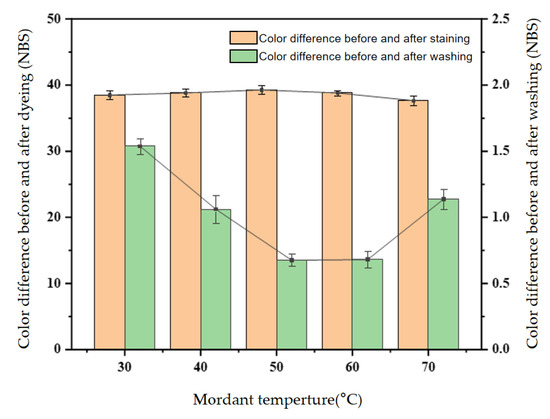
Figure 3.
Effect of mordant temperature on color difference and colorfastness to washing of poplar.
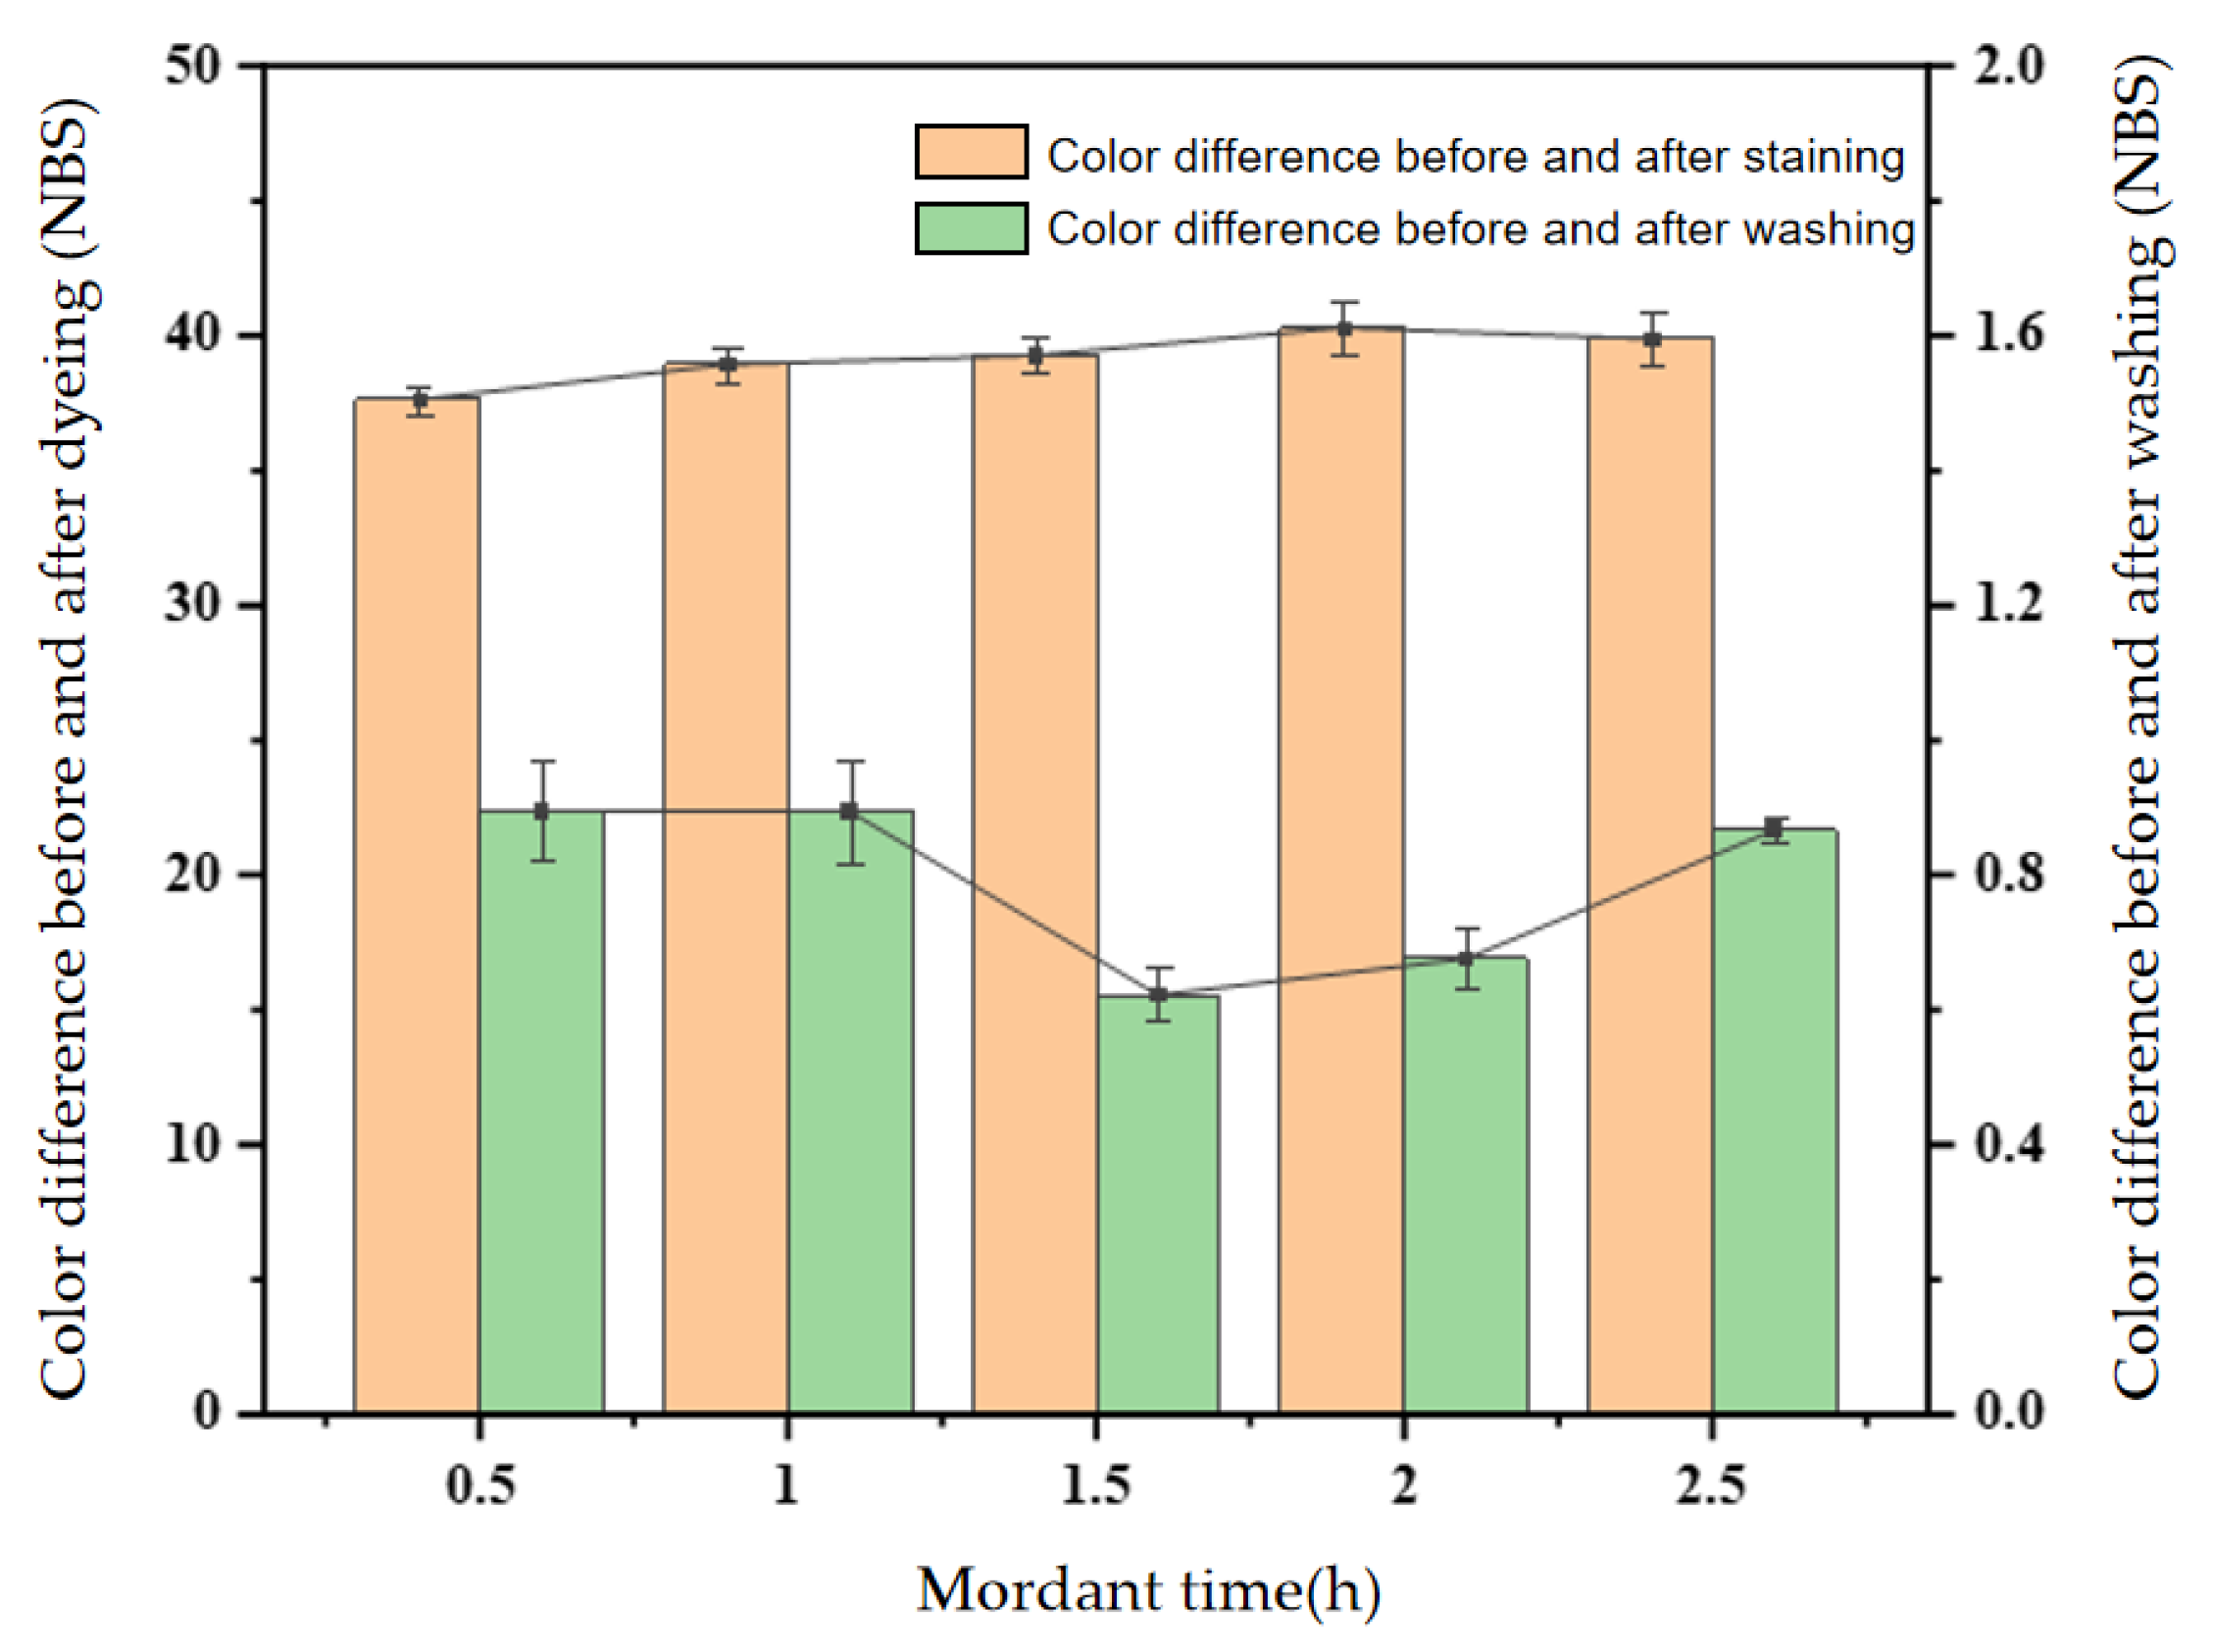
The influence of mordant time on the chromatic difference value and colorfastness to washing is shown in Figure 4. The staining depth deepens with the extension of time, during which the pigment dye gradually penetrates the interior of the wood and achieves the staining effect through the complexation reaction of Al3+. When the staining lasts for 2 h, the difference value reaches the maximum value, and the staining depth no longer increases as the staining time continues to extend. The mordant reaction has reached the saturation state of adsorbing the upper stain [42]. It was found that the pre-mediating time of the dyed wood was short, and the color of the dyed wood was uneven. With the increase of time, the metal ions on the surface of the wood gradually migrated from the place with high concentration to the place with low concentration, resulting in the effect of leveling. Therefore, the premedium time of peanut coating pigment was selected for 1.5~2.5 h.
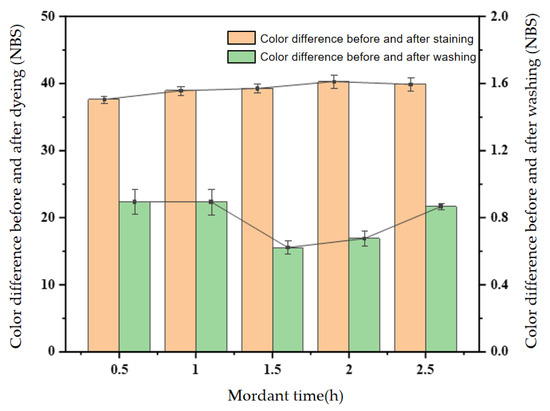
Figure 4.
Effect of mordant time on color difference and colorfastness to washing of poplar.
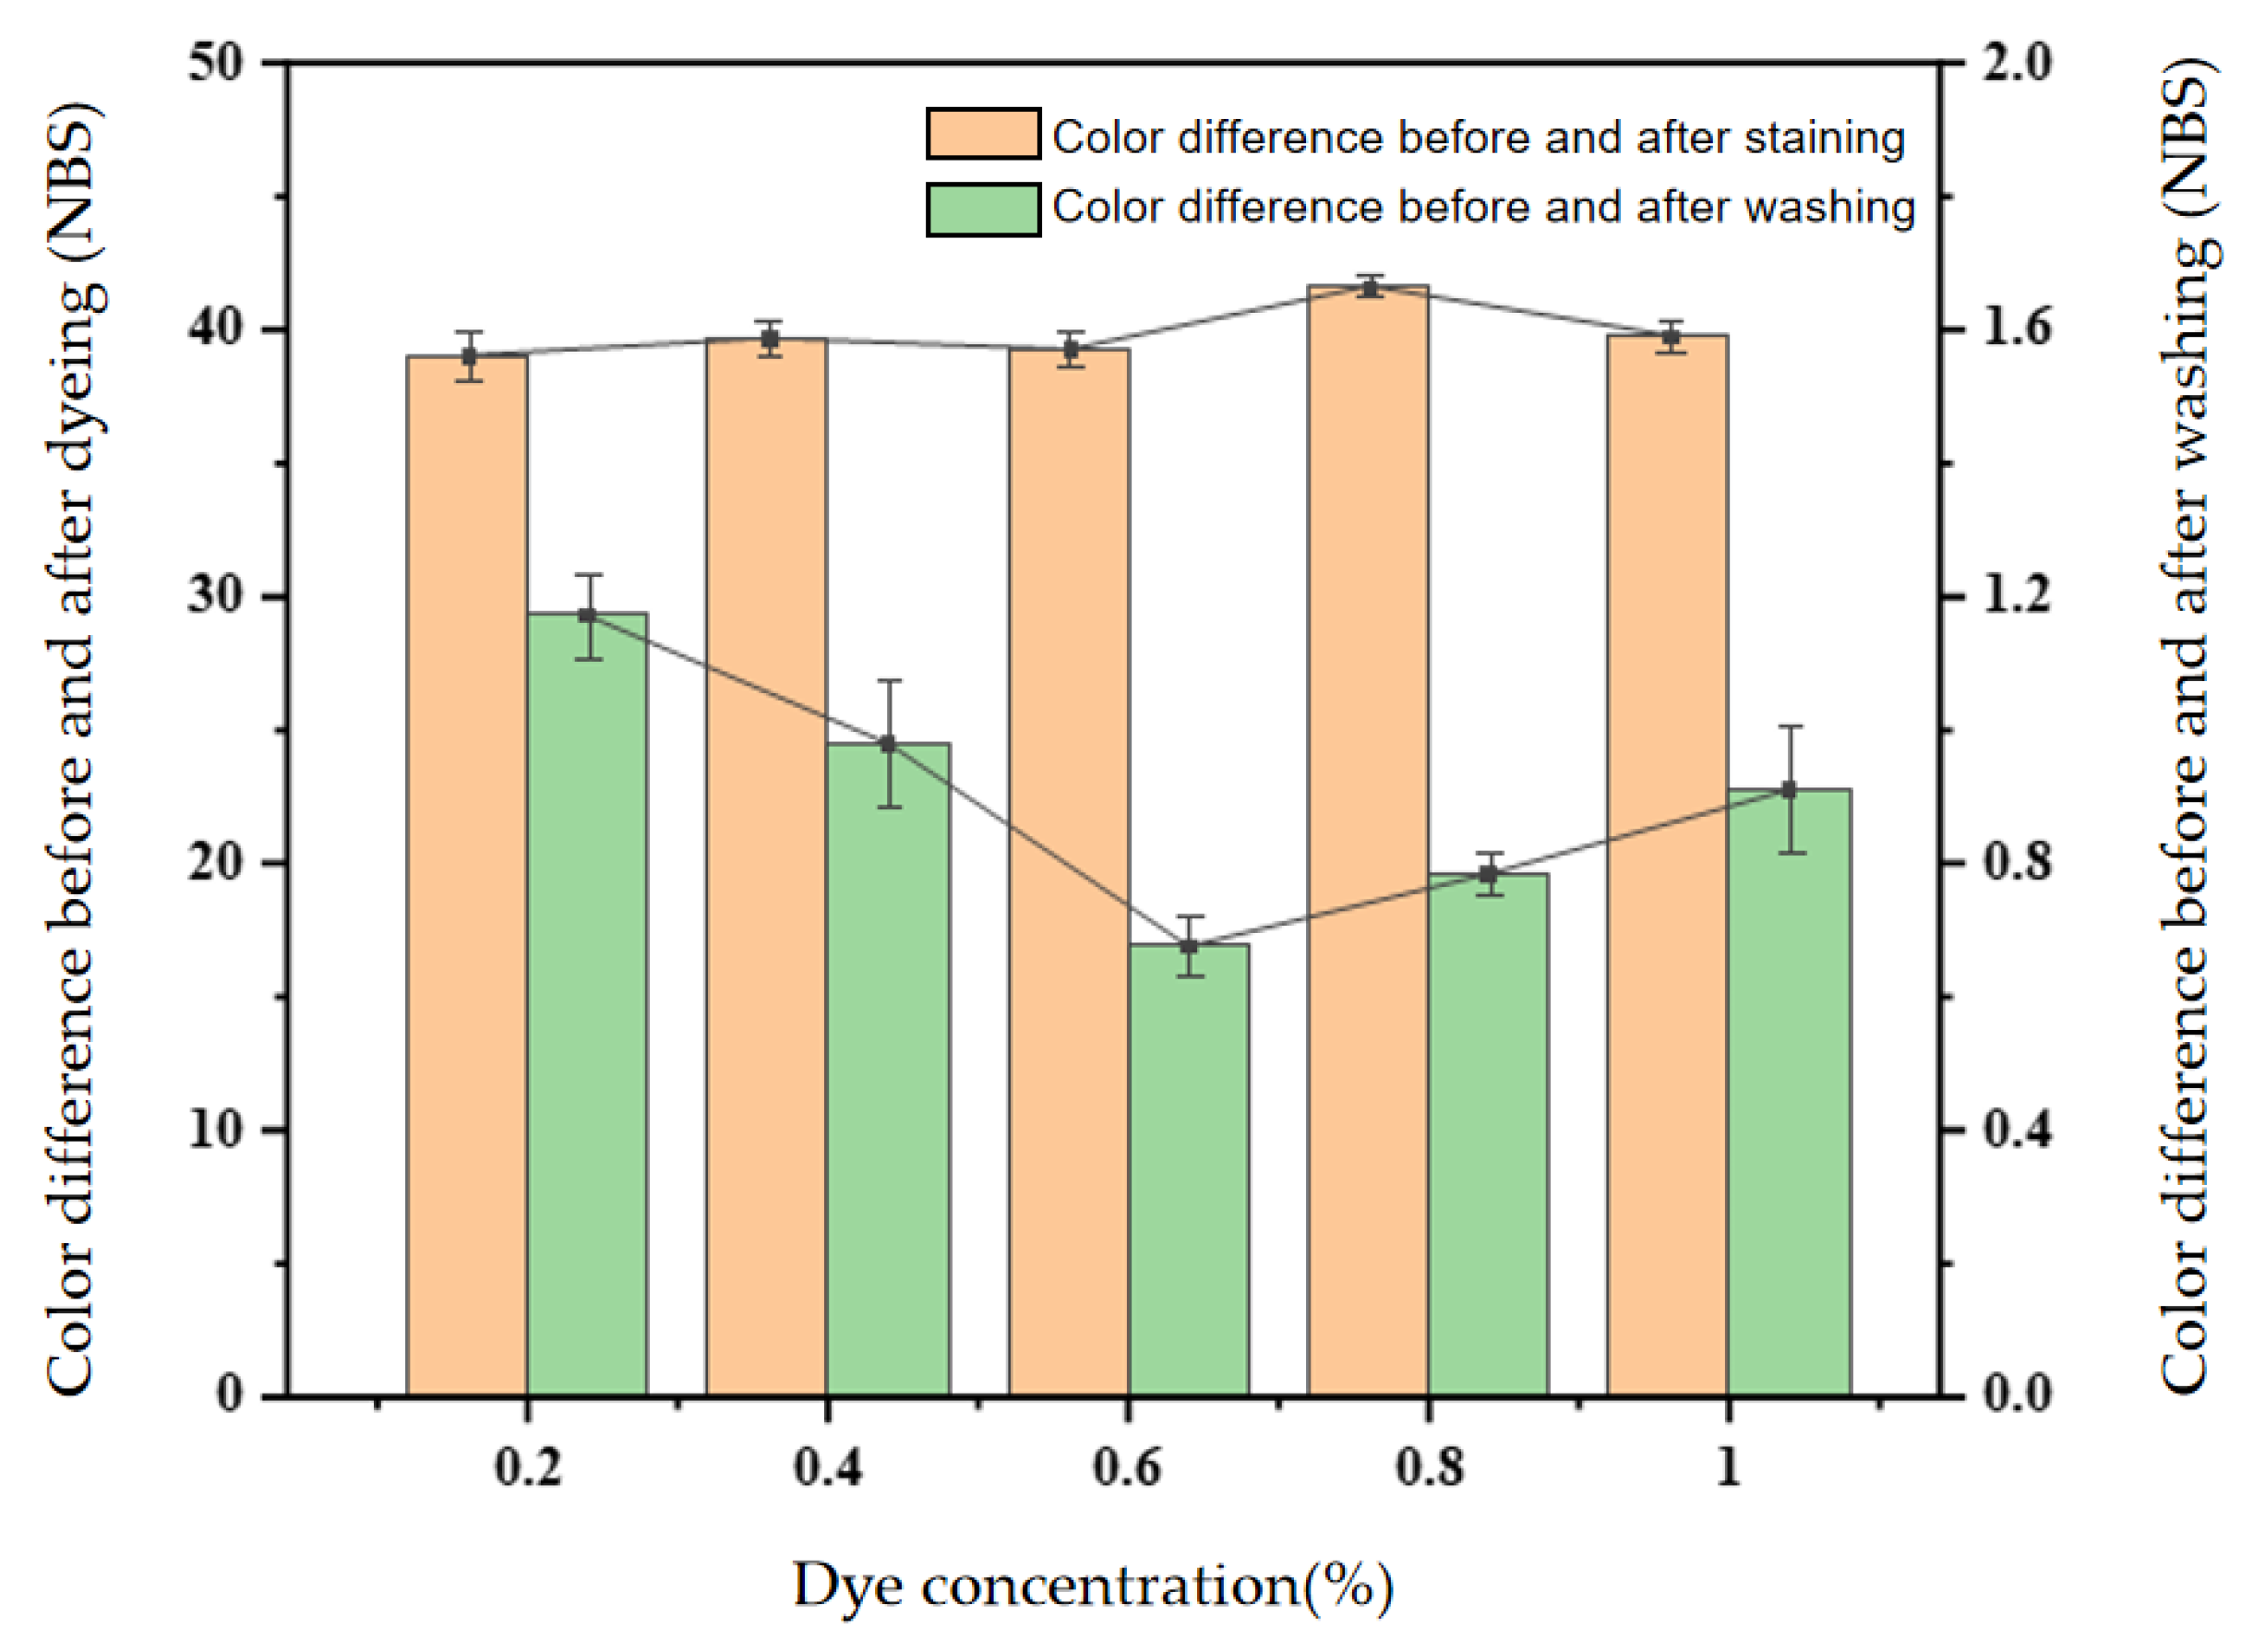
Figure 5 clearly shows that with the increase of mordant alum, the color difference value also shows an upward trend. When the mordant concentration reaches 0.8%, the color difference value of wood reaches the maximum value, and the concentration continues to increase, but it decreases somewhat. It may be because the mordant concentration is small; the dye cannot be thoroughly combined with the wood, resulting in a lighter color after staining. When the mordant concentration exceeds 0.8%, due to excessive metal ions, excess metal ions are easy to adsorb and aggregate on the surface of wood, resulting in floating color and decreased colorfastness to washing [43]. Therefore, the mordant concentration of peanut coat pigment should be selected at 0.6~1%.
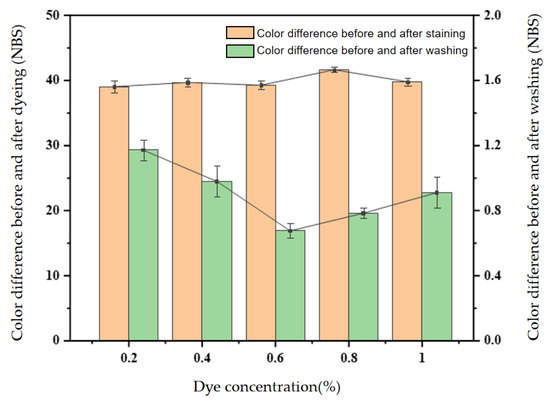
Figure 5.
Effect of mordant concentration on color difference and colorfastness to washing of poplar.
3.3. Analysis of Single Factor Experiment Results of Peanut Coat Pigment Direct Staining
For the rigor of the experiment, a control group was added, which used the direct staining method (without the addition of mordant).
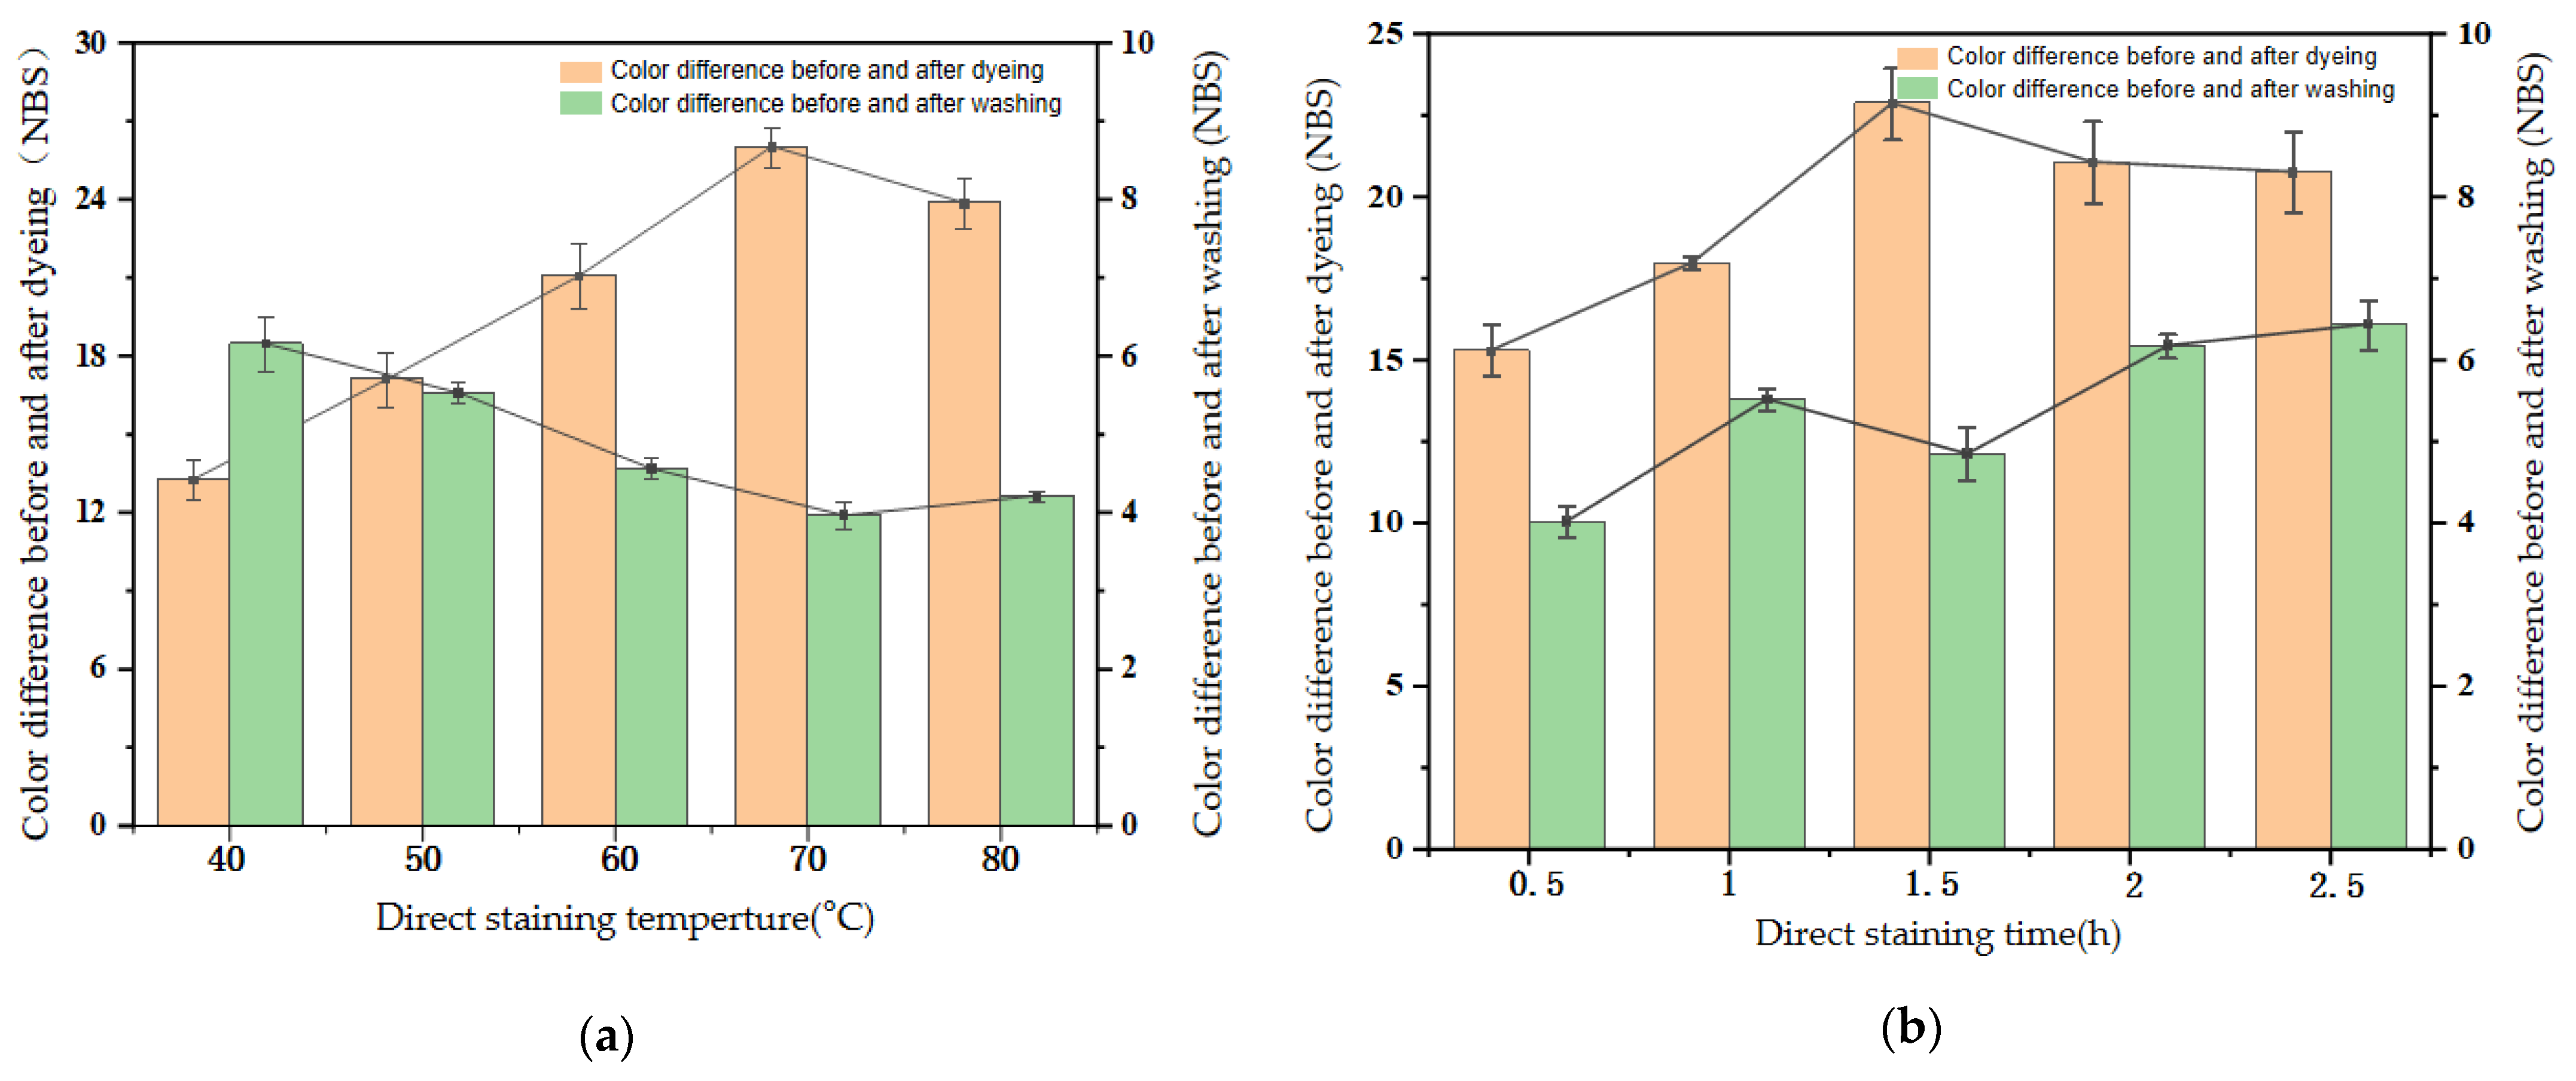
As can be seen from Figure 6a, increasing the direct staining temperature is conducive to improving the color difference and colorfastness to washing the wood veneer, thus improving the dyeing effect. When the staining temperature is 80 °C, the color difference obtained by poplar veneer is increased by 20.3% compared with that at 40 °C. In fact, high temperatures in wood dyeing can make wood fibers swell and promote thermoplastic strengthening. The intense thermal movement of the dye molecules increases the distance between the wood fibers, creating favorable conditions for their penetration into the interior of the wood. Poplar is a broad-leaved wood with hemicellulose content accounting for about 80%. Among them, the main component is partially acetylated 4-O-methylglucuronic acid xylan. At medium and high temperatures, the acetyl group will undergo a decomposition reaction to produce acetic acid, which is beneficial to the degradation of polysaccharide to produce glycolaldehyde, and glycolaldehyde and lignin will further condense into colored substances.
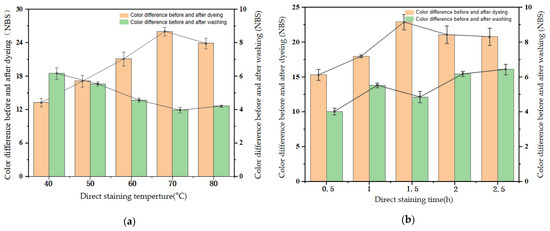
Figure 6.
(a) Effect of direct staining time on color difference and colorfastness to washing of poplar. (b) Effect of direct staining temperature on color difference and colorfastness to washing of poplar.
As can be seen from Figure 6b, with the extension of staining time, the color difference value of poplar veneer gradually increased from 15.31 to 22.88 within 5 h, and the colorfastness to washing also reached the best. After 5 h, the color difference value of poplar veneer showed a decreasing trend, and the colorfastness became worse. This is mainly because wood staining is a dynamic equilibrium process of adsorption and desorption between dye molecules and wood structure. The cavitation and thermal effects of ultrasonic waves also promote the adsorption of dye molecules into wood and on wood tracheids or ducts. Therefore, the staining time of peanut coat pigment is about 5 h, and the adsorption and desorption of dye molecules between wood and dye solution tend to be balanced.
Comparing Figure 6a,b with Figure 3 and Figure 4 of the above mordant staining poplar test, it can be seen that the mordant (alum) added during staining not only improves the color difference before and after staining but also reduces the color difference before and after washing to a large extent, which brings a positive impact on staining.
3.4. Orthogonal Test Results and Analysis of Pigment Mordant Staining of Peanut Coat
3.4.1. Analysis of Range and Variance of Color Difference Values
From the results of the range of color difference in Table 5, it can be seen that the degree of influence of various factors on the color difference value is as follows: C > B >A, that is, mordant concentration > mordant time > mordant temperature. According to the average value:

Table 5.
Chromaticity range analysis of mordant staining.
When factor A (mordant staining temperature) is at level 2 (50 °C), the staining difference on poplar is the largest; when factor B (mordant staining time) is at level 2 (2 h), the staining difference on poplar is the largest; when factor C (mordant concentration) is at level 2 (0.8%), the staining difference on poplar is the largest; the best combination is A2B2C2. That is, the mordant staining temperature is 50 °C, the mordant staining time is 2 h, and the mordant staining concentration is 0.8%.
The variance analysis of color difference was completed by IBM SPSS Statistics v26 software. F is the variance test for the whole regression model, so P in the following table is the criterion to judge whether the F test is significant. The R2and the adjusted R2 are the description of the fitting effect of the model, and the adjusted R square is generally more accurate. As can be seen from Table 6, mordant temperature (A) has a significant influence on the color difference of poplar, among which mordant time (B) and mordant concentration (C) have extremely significant influences on the color difference value of poplar.

Table 6.
Variance analysis of chromaticity value of mordant staining.
3.4.2. Analysis of the Extreme Range and Variance of Washing Colorfastness of Pigment Mordant Staining of Peanut Coat
According to the inferior washing colorfastness results in Table 7, the influence degree of each factor on washing colorfastness is as follows: C > B > A, that is, mordant concentration > mordant time > mordant temperature. According to the average value:

Table 7.
Analysis of extreme range of washing colorfastness of mordant staining.
When factor A (mordant temperature) is at level 3 (60 °C), the colorfastness to washing on poplar is the best.
When factor B (mordant staining time) is at level 2 (2 h), the colorfastness of poplar to water washing is the best;
When factor C (mordant concentration) is at level 2 (0.8%), the colorfastness of poplar to water washing is the best.
The optimal combination is A3B2C2. That is, the mordant staining temperature is 60 °C, the mordant staining time is 2 h, and the mordant staining concentration is 0.8%.
As can be seen from Table 8, the F value of mordant temperature (A), mordant time (B), and mordant concentration (C) were all less than 0.05, which had significant effects on the colorfastness of poplar staining for washing.

Table 8.
Anova analysis of washing colorfastness of peanut dye mordant.
3.5. Optimization of Technological Parameters by Fuzzy Comprehensive Evaluation of Pigment Mordant Staining of Peanut Coat
3.5.1. Establishment and Results of Evaluation Matrix
The fuzzy comprehensive evaluation matrix is realized by the membership value calculated by the membership function. Firstly, the measured values of color difference and colorfastness of wood were converted to the membership degree by using the established membership function according to the principle of fuzzy mathematics selection. Because the color fastness to washable water does not meet the requirement of an optimal fuzzy comprehensive evaluation, incremental transformation of the data should be carried out before establishing the evaluation matrix. Thus, the index values are mapped to the interval [0,1], which makes each index value fuzzy. Table 9 lists the conversion results.

Table 9.
Conversion value of peanut coat pigment mordant index.
Assuming that the total comments of the three factors on the two indicators are expressed by fuzzy matrices R1, R2, and R3, respectively, the fuzzy matrices of the three factors investigated on the two indicators are expressed as follows:
3.5.2. Determination of Weight Distribution
Weight is used to measure the impact of each index on the evaluation object. It is necessary to determine the weight of each index in the fuzzy comprehensive evaluation, and the commonly used methods include DelpHi, analytic hierarchy process, and expert scoring. In practical application, color difference and colorfastness are important indexes to evaluate wood dyeing properties. Therefore, the experiment selected a relatively general situation, and the expert scoring method was used to determine the weight of color difference and colorfastness as 0.5:0.5.
3.5.3. Comprehensive Evaluation and Level Optimization
Using the comprehensive evaluation model M(∧, ∨), the weight vector W = (0.5, 0.5) is multiplied by the fuzzy matrix R, B = W·R. The comprehensive evaluation matrix of factor A is represented by fuzzy matrix B1, then:
B1 = {b1,b2,b3}; b1 = (0.5∧0.3330)∨(0.5∧0.3011) = 0.3330; b2 = (0.5∧0.3386)∨(0.5∧0.3163) = 0.3386; b3 = (0.5∧0.3285)∨(0.5∧0.3826) = 0.3826;
Comprehensive evaluation vector B = {b1, b2, b3}; after normalization, B1~B3 are obtained, which are the comprehensive evaluation results of each factor and two indicators, which are respectively expressed as follows:
B1 = (0.3159, 0.3212, 0.3629);
B2 = (0.3121, 0.3450, 0.3429);
B3 = (0.3170, 0.3652, 0.3179);
According to the comprehensive evaluation results, level 3 in B1 is the largest, and the staining effect is the best according to the principle of maximum optimization when the mordant staining temperature is 60 °C. Similarly, the optimal levels of mordant temperature and mordant concentration are 2 h and 0.8%, respectively; the optimal combination of staining process parameters is A3B2C2.
3.6. Scanning Electron Microscope (SEM) Test
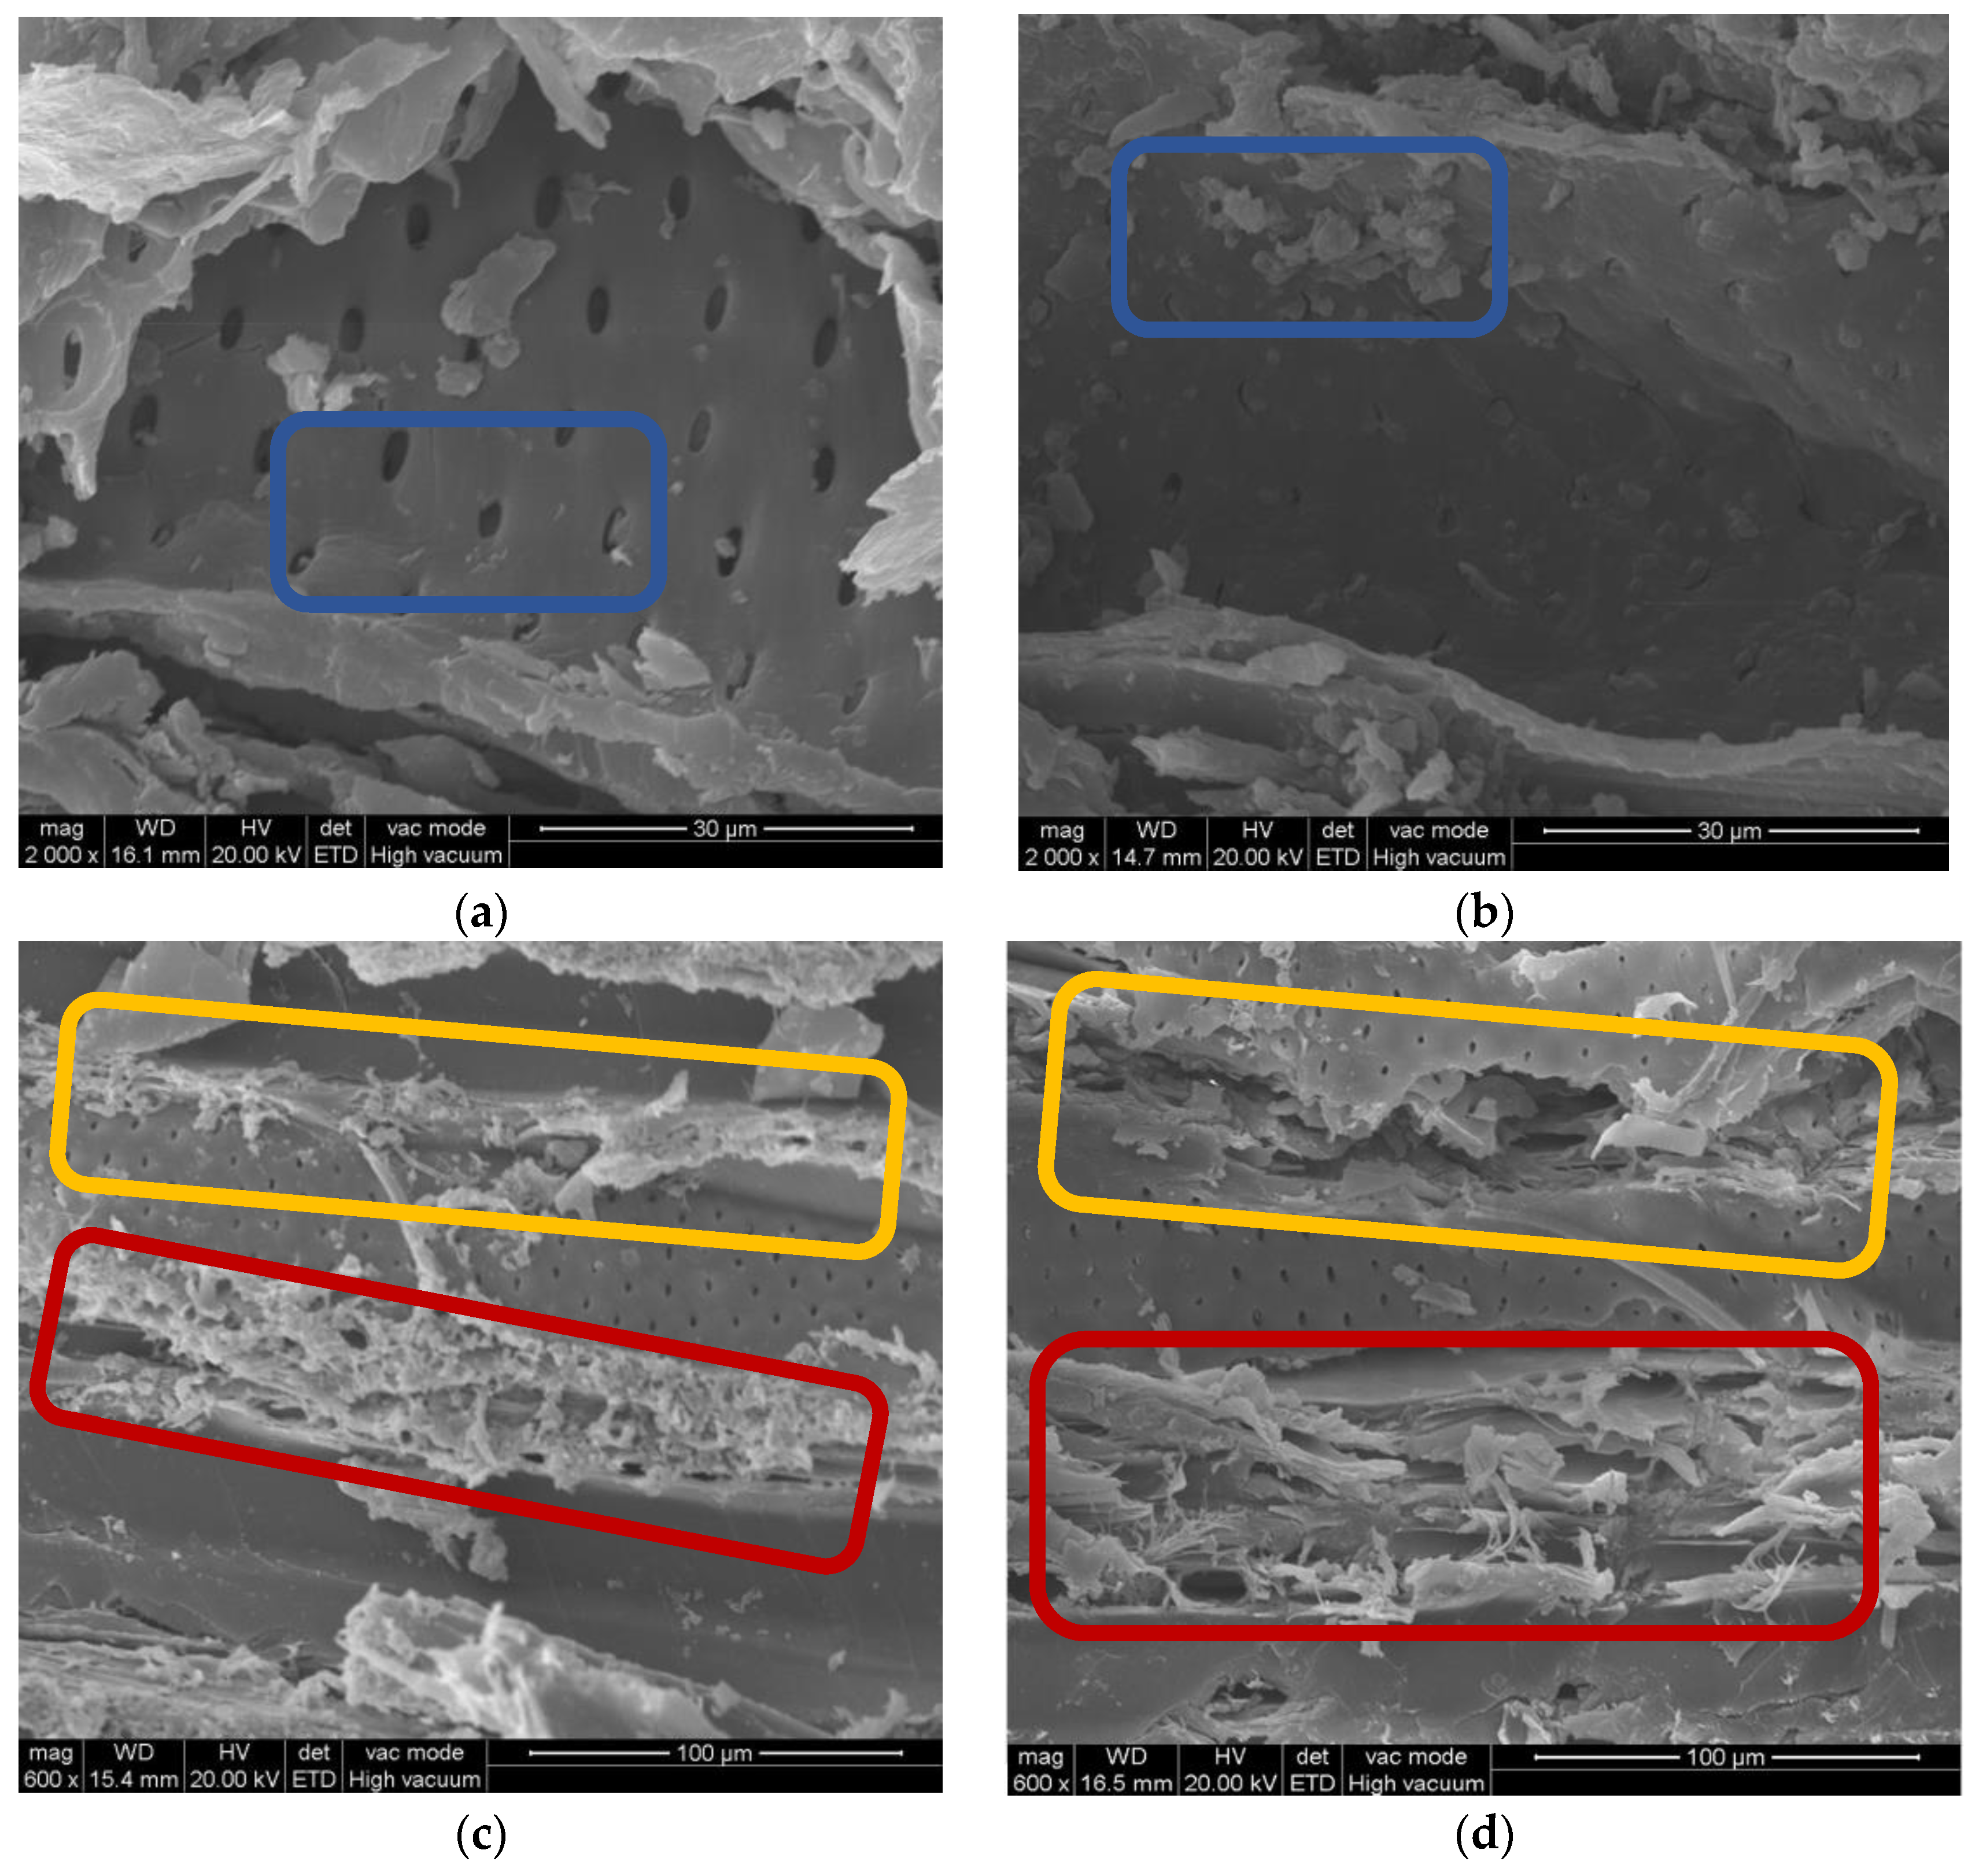
Figure 7a,c show the 2000 and 600 times images of poplar direct staining by peanut pigment with SEM; Figure 7b,d show the 2000 and 600 times images of mordant staining (with alum added) observed by SEM. It can be seen that the surface morphology of veneer is very different from that of direct staining wood and mordant staining wood. From Figure 7a, it can be seen that there are a few dye molecules around the wood grain holes of the direct staining veneer (shown in the blue box), and from Figure 7c, the surface of the tube wall is smooth and flat (shown in the yellow box). In contrast, in Figure 7b, the mothballs and surrounding areas of the mordant staining veneer have a high degree of agglomeration, and a large number of dye molecules are attached to the wall of the guide tube [32]. It can be observed from Figure 7d that the surface of the wood guide tube wall of the mordant staining veneer is rough. It was observed that after mordant staining with alum, the cracks and voids distributed between the wood fibers of poplar increased (as shown in the red box), and when the dye liquid moved along the duct cavity and fiber cells, more adsorption points were provided for the dye molecules, thus improving the staining effect of the wood.
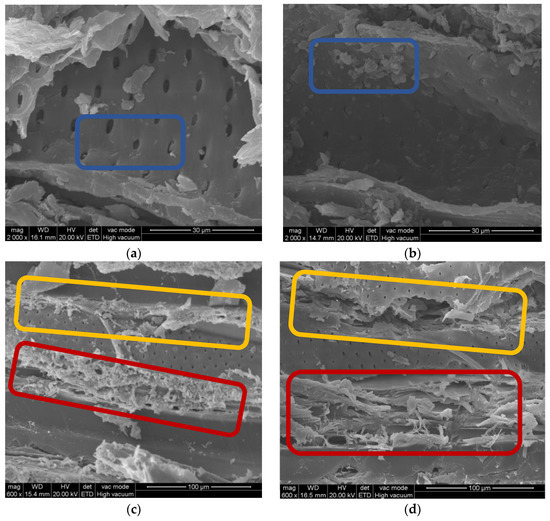
Figure 7.
SEM images of direct and mordant staining of poplar with peanut pigment. (a) alum is not added (b) alum is added (c) alum is not added (d) alum is added.
3.7. X-ray Diffraction (XRD) Test
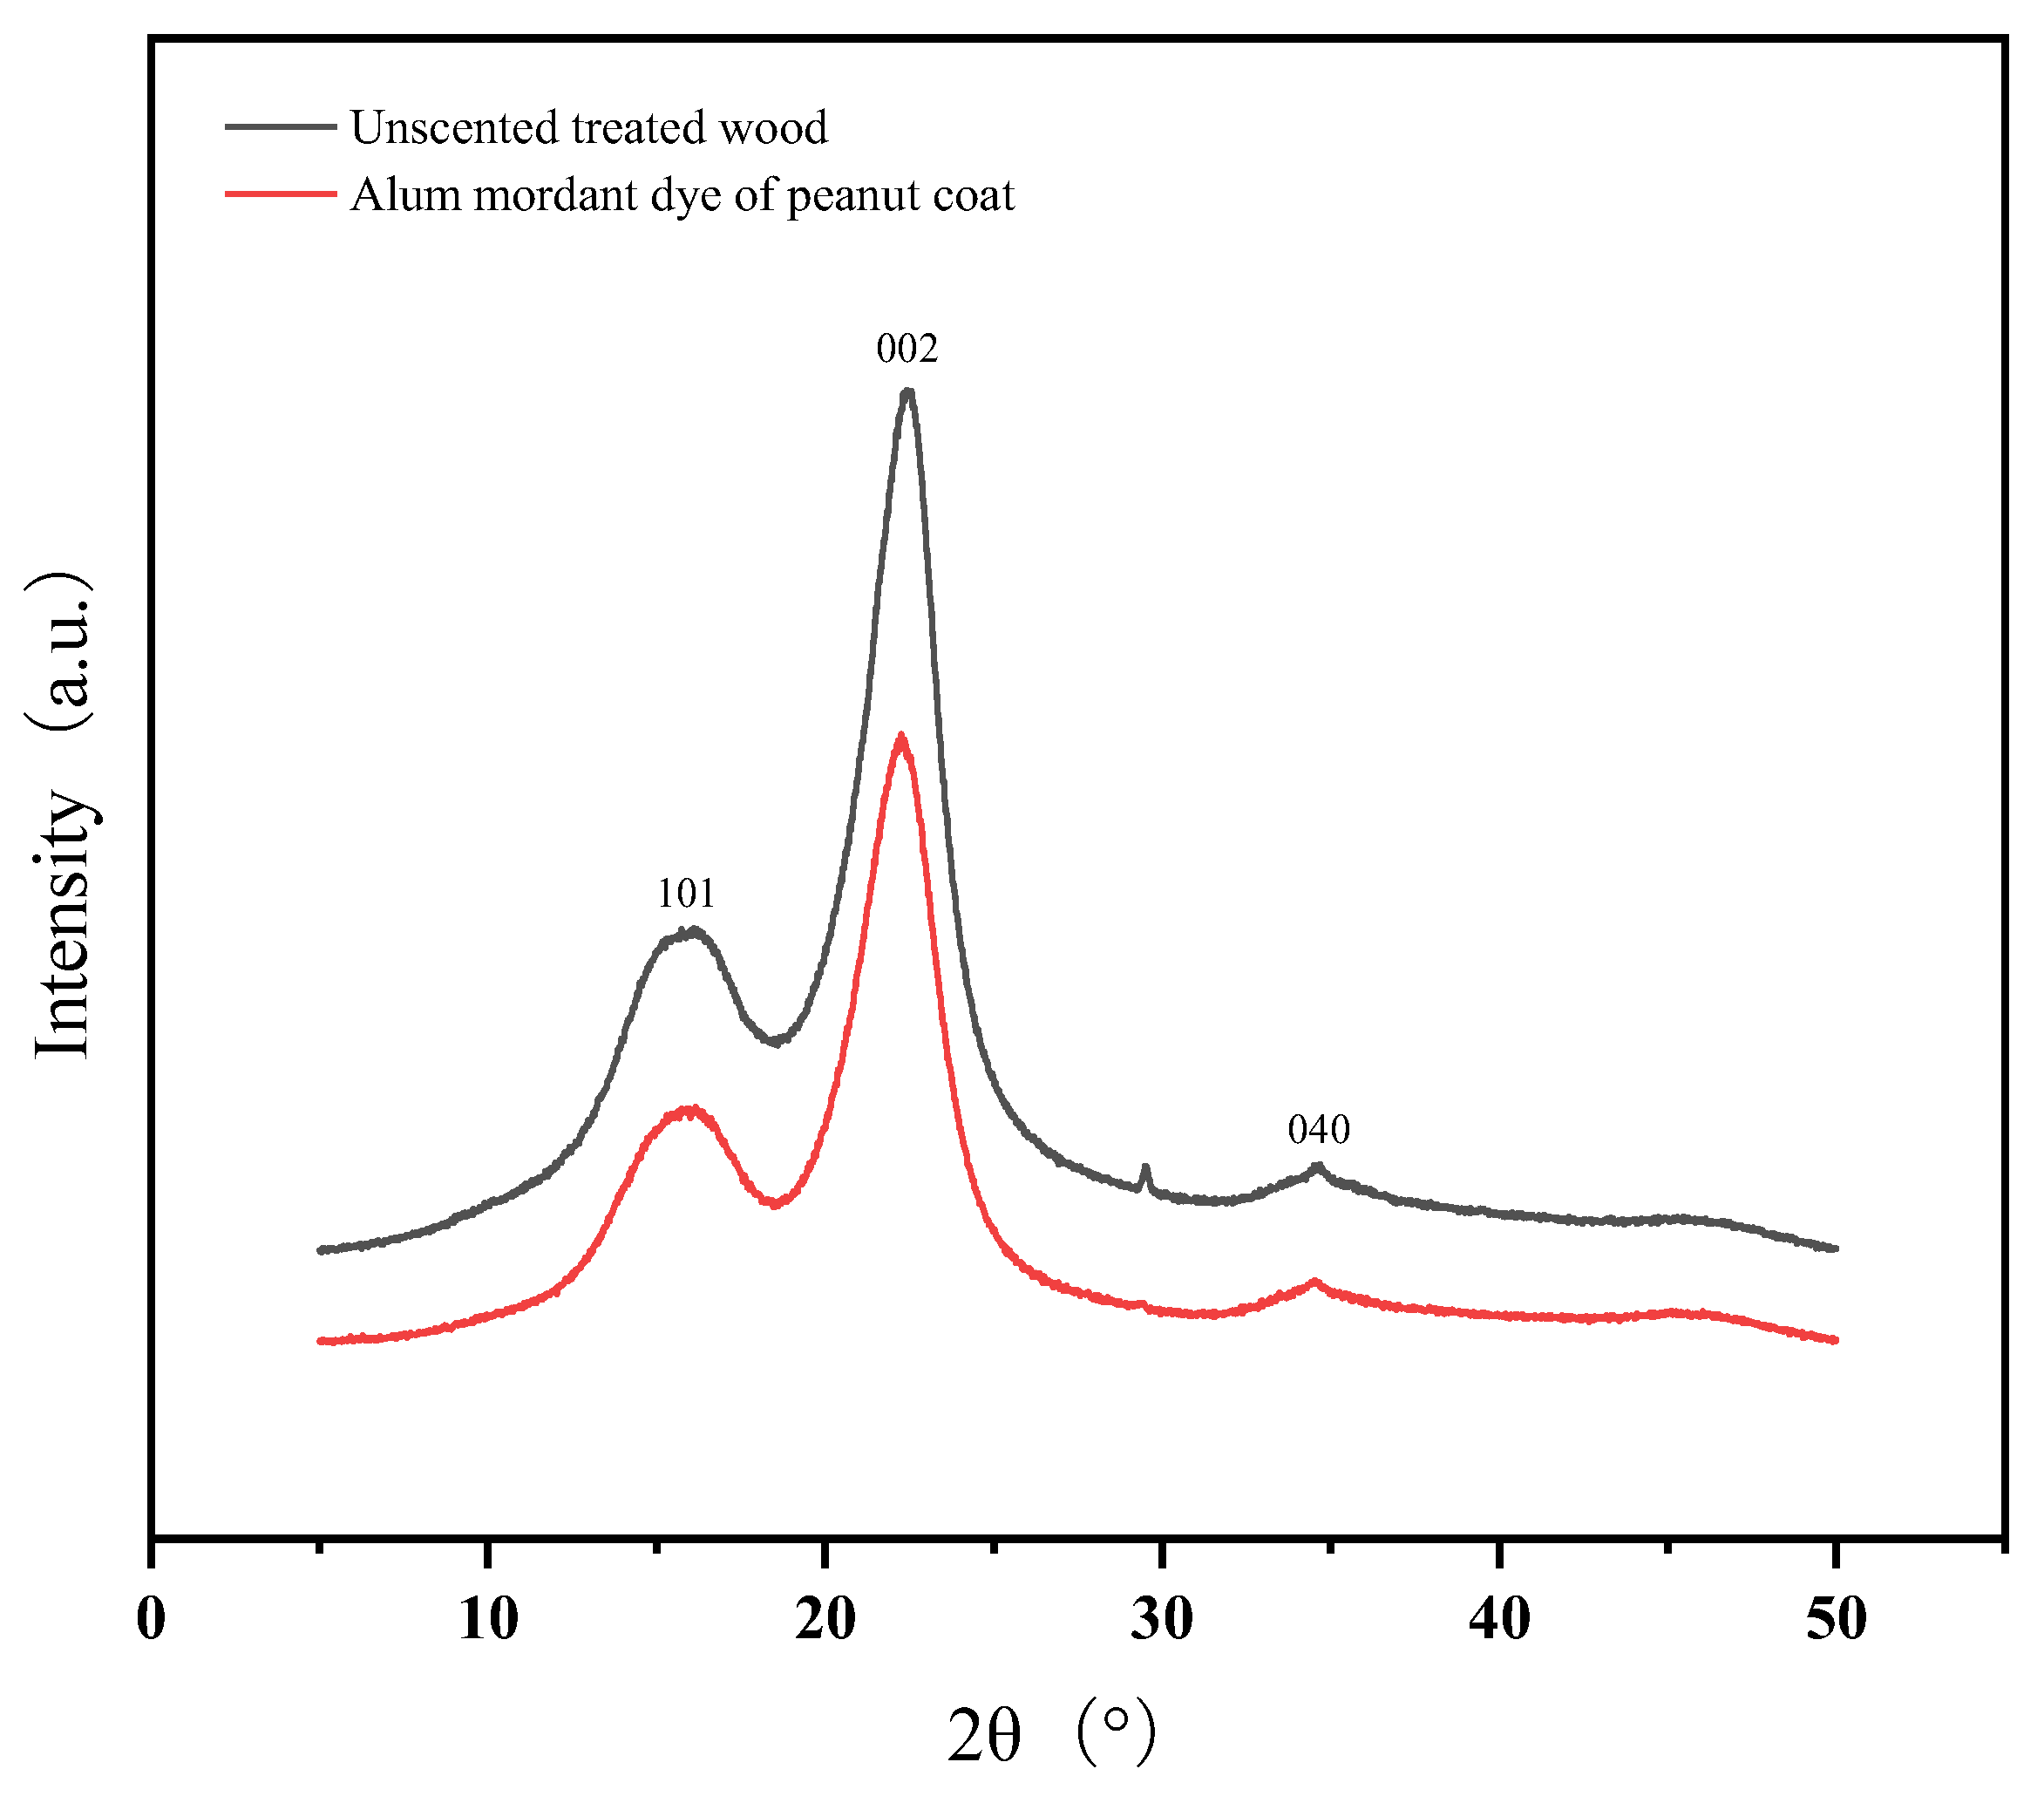
As can be seen from Figure 8 and Table 10, the diffraction peak position of crystal plane 002 is concentrated at 22.26~22.42, which shows that the staining treatment has no apparent influence on the crystallization zone of wood cellulose and does not change the crystal layer distance of the crystallization zone. The relative crystallinity of untreated poplar and alum mordant staining poplar are 71.27% and 71.51%, respectively. It has a specific change, but the change range is not extensive, so the staining treatment has little influence on its properties and subsequent processing [23]. The crystallinity of poplar dyed with mordant is slightly improved, which shows that dye molecules can quickly enter the wood, deposit, adsorb, and react inside the wood.
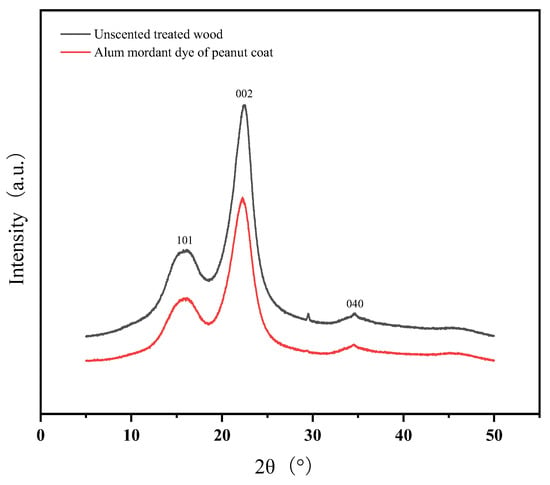
Figure 8.
XRD patterns of direct staining and mordant staining of poplar with peanut coat pigment.

Table 10.
Comparison of infrared spectra of poplar wood dyed by peanut coating dyes in different processes.
3.8. Fourier Infrared Spectroscopy (FTIR) Test
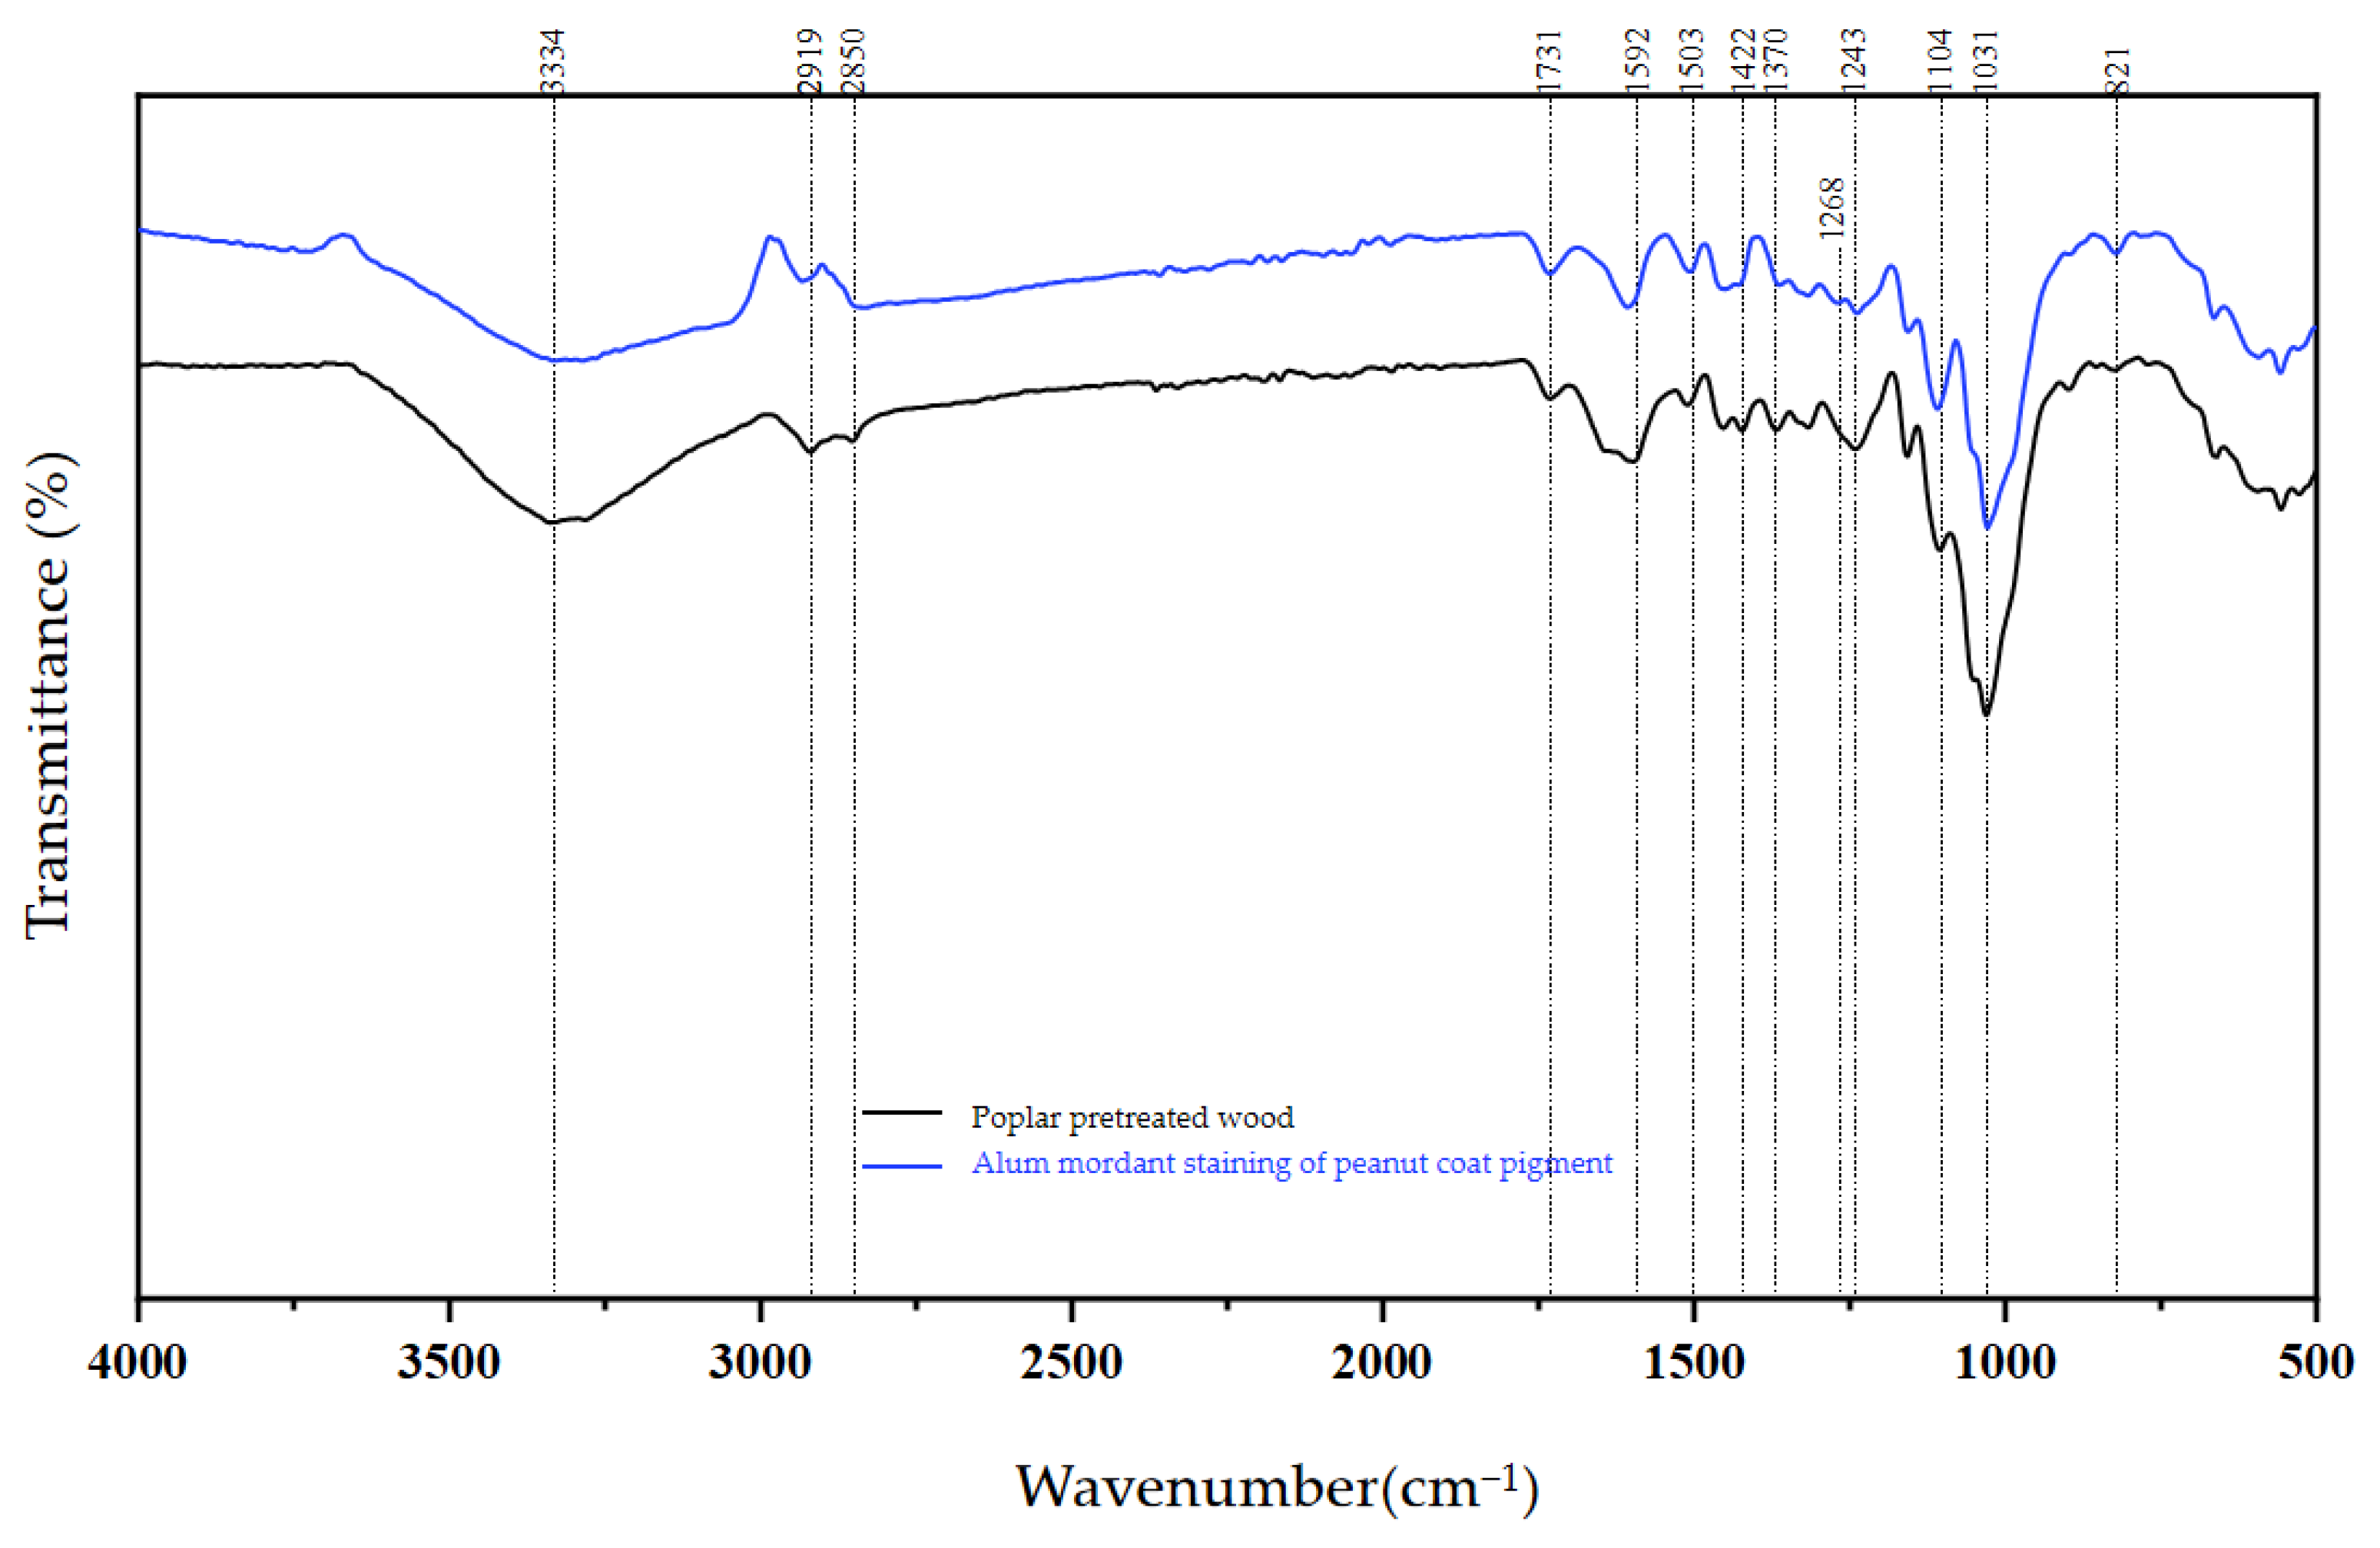
From the analysis of Figure 9, it can be seen that in the O-H absorption frequency range of 3334 cm−1, the strength of mordant (B) is lower than that of undyed material (A) [44]. Moreover, the vibration peaks of the carbon skeleton at wave numbers 1592 cm−1 and 1422 cm−1 are significantly weakened compared with undyed and directly dyed wood. The new absorption peak at 1268 cm−1 is the stretching vibration of phenolic C-OH in peanut hull [41]. Notably, phenolic hydroxyl groups in lignin, benzene ring, and peanut hull mainly participate in coordination reactions [45].
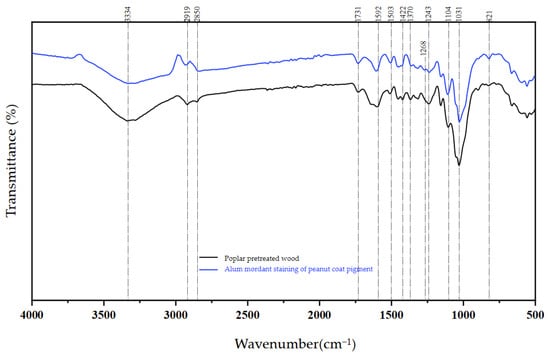
Figure 9.
Comparison of infrared spectra of poplar dyed with peanut coat dyes in different processes.
The main reason is that Al3+ formed by the hydrolysis of alum in a mordant staining solution can provide an empty orbit and can form a complex structure with dyes and oxygen with a lone pair in wood fiber structures so that the peanut coat dye can be combined with poplar. This way of chemical bonding can make the wood absorb more dyes and effectively improve its staining fastness [46].
4. Conclusions
- (1)
- Using three different mordants and mordant staining methods, the wood dyed with peanut coat pigment showed lightness, shades of reddish–brown, grayish–brown, dark gray, and so on. Among them, the color samples stained by the alum pre-mordant staining method have higher color differences and better colorfastness.
- (2)
- The degree of influence of various factors on the color difference value in the pre-mordant staining method of peanut coat pigment alum is C > B > A, that is, mordant concentration > mordant time > mordant temperature. The degree of influence of various factors on washing colorfastness is as follows: C > B > A, that is, mordant concentration > mordant time > mordant temperature. The fuzzy comprehensive evaluation method was used to optimize these two indexes comprehensively, and the optimal process parameters were obtained as follows: A3B2C2, namely mordant staining temperature 60 °C, mordant staining time 2 h, and mordant staining concentration 0.8%.
- (3)
- SEM observation results show that mordant staining of peanut coat pigment has a higher aggregation of dye molecules in the grain orifice and surrounding areas than direct staining of veneer. After alum mordant staining, the gaps between the wood fibers of poplar increased, which provided more adsorption points for the dye when the dye solution moved along the catheter lumen and fiber cells.
- (4)
- XRD showed that the relative crystallinity of untreated poplar, direct staining, and alum mordant staining poplar were 71.27% and 71.51%, respectively. The change range is not extensive, so the staining treatment has little influence on its properties and subsequent processing.
- (5)
- FRIR test analysis shows that the vibration peak of the carbon skeleton of poplar pre-mordanted with alum is much weaker than that of unstained wood and directly dyed wood. It is speculated that Al3+ bridges the phenolic hydroxyl group in lignin, benzene ring, and phenolic hydroxyl group in peanut coat to form a complex structure, enabling wood to absorb more dyes and effectively improving its staining fastness.
- (6)
- This study provides a lot of creativity for the selection and application of dyes in today’s staining industry, optimizes and improves the process of wood staining, and greatly improves the staining effect. At present, it has a positive impact on the severe ecological environment in the world. At the same time, this study also provides more possibilities and relevant theoretical basis for the subsequent development of more varieties and more abundant natural dyes.
Author Contributions
Conceptualization, Y.Q. and L.S.; methodology, Y.Q.; data curation, Z.Z. and Y.S.; writing—original draft preparation, Z.Z.; visualization, Y.S. and J.H. All authors have read and agreed to the published version of the manuscript.
Funding
This research was funded by International Cooperation Joint Laboratory for Production, Education, Research, and Application of Ecological Health Care on Home Furnishing, University-Industry Collaborative Education Program, grant number 202101148006.
Data Availability Statement
The data presented in this study are available on request from the corresponding author. The data are not publicly available due to this paper has further research on this topic.
Conflicts of Interest
The authors declare no conflict of interest.
References
- Liu, M.; Xu, G.; Wang, J.; Tu, X.; Liu, X.; Wu, Z.; Lv, J.; Xu, W. Effects of Shellac Treatment on Wood Hygroscopicity, Dimensional Stability and Thermostability. Coatings 2020, 10, 881. [Google Scholar] [CrossRef]
- Xiong, X.; Yue, X.; Dong, W.; Xu, Z. Current status and system construction of used-furniture recycling in China. Environ. Sci. Pollut. Res. 2022, 29, 82729–82739. [Google Scholar] [CrossRef]
- Zhou, L.; Fu, Y.C. Flame-Retardant Wood Composites Based on Immobilizing with Chitosan/Sodium Phytate/Nano-TiO2-ZnO Coatings via Layer-by-Layer Self-Assembly. Coatings 2020, 10, 296. [Google Scholar] [CrossRef]
- Qi, Y.; Shen, L.; Zhang, J.; Yao, J.; Lu, R.; Miyakoshi, T. Species and release characteristics of VOCs in furniture coating process. Environ. Pollut. 2019, 245, 810–819. [Google Scholar] [CrossRef] [PubMed]
- Yan, X.; Wang, L.; Qian, X. Influence of the PVC of Glass Fiber Powder on the Properties of a Thermochromic Waterborne Coating for Chinese Fir Boards. Coatings 2020, 10, 588. [Google Scholar] [CrossRef]
- Xiong, G.B.; Wang, Z.Q.; Lu, X.N. Research on Technology of Color uniformity for Inner Dying of Fast-Growing Poplar. In Proceedings of the Conference on Engineered Wood Products Based on Poplar/Willow Wood, Nanjing, China, 21–24 October 2008. [Google Scholar]
- Haji, A.; Nasiriboroumand, M.; Qavamnia, S.S. Cotton staining and Antibacterial Finishing Using Agricultural Waste by an Eco-friendly Process Optimized by Response Surface Methodology. Fibers Polym. 2018, 19, 2359–2364. [Google Scholar] [CrossRef]
- Liu, G.; Zhang, Z.; Zhou, Z. Optimization of Green Extraction Process of Cinnamomum camphora Fruit Dye and its Performance by Response Surface Methodology. Bioresources 2023, 18, 4916–4934. [Google Scholar]
- Hill, G.M.; Utley, P.R.; Newton, G.L. Influence of dietary crude protein on peanut skin digestibility and utilization by feedlot steers. J. Anim. Sci. 1986, 62, 887–894. [Google Scholar] [CrossRef] [PubMed]
- Chukwumah, Y.; Walker, L.T.; Verghese, M. Peanut Skin Color: A Biomarker for Total Polyphenolic Content and Antioxidative Capacities of Peanut Cultivars. Int. J. Mol. Sci. 2009, 10, 4941–4952. [Google Scholar] [CrossRef] [PubMed]
- Tas, N.G.; Gokmen, V. Phenolic compounds in natural and roasted nuts and their skins: A brief review. Curr. Opin. Food Sci. 2017, 14, 103–109. [Google Scholar] [CrossRef]
- Choi-Kwon, S.; Choe, M.; Kim, K.S.; Yi, M.S.; Suh, E.; Suh, M. Nutritional Status, Nutrients Intakes, and Health Status of Young-old and Old-old Homebound Elderly in Korea. J. Korean Biol. Nurs. Sci. 2012, 14, 183–192. [Google Scholar] [CrossRef][Green Version]
- Pandey, R.; Patel, S.; Pandit, P.; Nachimuthu, S.; Jose, S. Colouration of textiles using roasted peanut skin-an agro processing residue. J. Clean. Prod. 2018, 172, 1319–1326. [Google Scholar] [CrossRef]
- Elsorady, M.E.I.; Ali, S.E. Antioxidant activity of roasted and unroasted peanut skin extracts. Int. Food Res. J. 2018, 25, 43–50. [Google Scholar]
- Liu, Q.; Gao, D.; Xu, W. Influence of the Bottom Color Modification and Material Color Modification Process on the Performance of Modified Poplar. Coatings 2021, 11, 660. [Google Scholar] [CrossRef]
- Gu, Y.; Bian, H.; Wei, L.; Wang, R. Enhancement of Hydrotropic Fractionation of Poplar Wood Using Autohydrolysis and Disk Refining Pretreatment: Morphology and Overall Chemical Characterization. Polymers 2019, 11, 685. [Google Scholar] [CrossRef] [PubMed]
- Liu, Q.; Gao, D.; Xu, W. Effect of Paint Process on the Performance of Modified Poplar Wood Antique. Coatings 2021, 11, 1174. [Google Scholar] [CrossRef]
- Liu, Q.; Gao, D.; Xu, W. Effect of Sanding Processes on the Surface Properties of Modified Poplar Coated by Primer Compared with Mahogany. Coatings 2020, 10, 856. [Google Scholar] [CrossRef]
- Sandak, A.; Allegretti, A.; Cuccui, I.; Sandak, J.; Rosso, L.; Castro, G.; Negro, F.; Cremonini, C.; Zanuttini, R. Thermo-Vacuum Modification of Poplar Veneers and its Quality Control. Bioresources 2016, 11, 10122–10139. [Google Scholar] [CrossRef]
- Qi, Y.; Sun, Y.; Zhou, Z.; Huang, Y.; Li, J.; Liu, G. Response surface optimization based on freeze-thaw cycle pretreatment of poplar wood staining EFFECT. Wood Res. 2023, 68, 293–305. [Google Scholar] [CrossRef]
- Wu, Y.; Wu, X.; Yang, F.; Zhang, H.; Feng, X.; Zhang, J. Effect of Thermal Modification on the Nano-Mechanical Properties of the Wood Cell Wall and Waterborne Polyacrylic Coating. Forests 2020, 11, 1247. [Google Scholar] [CrossRef]
- Yang, L.; Wu, Y.; Yang, F.; Wang, W. A conductive polymer composed of a cellulose-based flexible film and carbon nanotubes. Rsc Adv. 2021, 11, 20081–20088. [Google Scholar] [CrossRef]
- Liu, H.; Li, Z.; Zhang, X.; Tang, B.; Wan, C.; Wang, K. The Effect of Different Moderate Thermal Modification Durations on the Wood Properties of American Alder. Materials 2022, 15, 8839. [Google Scholar] [CrossRef]
- Zhou, T.; Liu, H. Research Progress of Wood Cell Wall Modification and Functional Improvement: A Review. Materials 2022, 15, 1598. [Google Scholar] [CrossRef]
- Timar, M.C.; Varodi, A.M.; Gurău, L. Comparative study of photodegradation of six wood species after short-time UV exposure. Wood Sci. Technol. 2016, 50, 135–163. [Google Scholar] [CrossRef]
- Widsten, P.; Chittenden, C.; West, M.; Thumm, A.; Donaldson, L. Enzymatic treatments for improved staining of solid wood. Holzforschung 2022, 76, 493–502. [Google Scholar] [CrossRef]
- Nguyen, N.; Ozarska, B.; Fergusson, M.; Vinden, P. Comparison of two dye uptake measurement methods for dyed wood veneer assessment. Eur. J. Wood Wood Prod. 2018, 76, 1757–1759. [Google Scholar] [CrossRef]
- Ngaini, Z.; Hissam, M.A.; Mortadza, N.A.; Abd Halim, A.N.; Daud, A.I. In vitro antimicrobial activities, molecular docking and density functional theory (DFT) evaluation of natural product-based vanillin derivatives featuring halogenated azo dyes. Nat. Prod. Res. 2023, 5, 227–236. [Google Scholar] [CrossRef] [PubMed]
- Wu, Y.Q.; Peng, W.X. Study on the Optimized staining Technology of Wood Veneer Based on Reducing Discharge of Wastewater. In Proceedings of the International Small and Medium Enterprise Forum on SME Growth and Sustainability, Beijing, China, 16 October 2009. [Google Scholar]
- Qian, Z.W.; Shi, Y.F.; Du, X.L. Selection of Logistics Service Provider Based on Fuzzy Comprehensive Evaluation; Atlantis Press: Paris, France, 2016; pp. 38–41. [Google Scholar]
- Xing, T.; Liu, D.C.; Zhao, G.Q. Study on System Analyst Comprehensive Capacity Evaluation Method; Scientific Research Publishing: Wuhan, China, 2010; pp. 48–52. [Google Scholar]
- Yang, L.; Han, T.; Liu, Y.; Yin, Q. Effects of Vacuum Heat Treatment and Wax Impregnation on the Color of Pterocarpus macrocarpus Kurz. BioResources 2021, 16, 954–963. [Google Scholar] [CrossRef]
- Kamataki, Y.; Kameda, Y.; Kita, Y.; Matsuda, I.; Itoh, S. Lossless Coding of HDR Color Images in a Floating Point Format Using Block-Adaptive Inter-Color Prediction. IEICE Trans. Inf. Syst. 2021, 104, 1572–1575. [Google Scholar] [CrossRef]
- GB/T 250-2008; Gray Scale for Assessing Change in Colour. Standardization Administration of China: Beijing, China, 2008.
- Choi, H.J.; Park, Y.; Lee, H.; Joo, K.I.; Lee, T.H.; Hong, S.; Kim, H.R. Compensation of color breaking in bi-focal depth-switchable integral floating augmented reality display with a geometrical phase lens. Opt. Express 2020, 28, 35548–35560. [Google Scholar] [CrossRef]
- Mao, J.; Wu, Z.; Feng, X. A Modeling Approach on the Correction Model of the Chromatic Aberration of Scanned Wood Grain Images. Coatings 2022, 12, 79. [Google Scholar] [CrossRef]
- Yan, X.; Wang, L. Preparation and performance of a waterborne UV/Al low infrared emissivity coating. Appl. Sci. 2020, 10, 6423. [Google Scholar] [CrossRef]
- Yan, X.; Chang, Y. Investigation of the properties of color-changing powder water-based coating. Coatings 2020, 10, 815. [Google Scholar] [CrossRef]
- Zhao, W.; Yan, X. Preparation of thermochromic microcapsules of bisphenol a and crystal violet lactone and their effect on coating properties. Polymers 2022, 14, 1393. [Google Scholar] [CrossRef]
- Wu, X.; Yang, F.; Gan, J.; Kong, Z.; Wu, Y. A superhydrophobic, antibacterial, and durable surface of poplar wood. Nanomaterials 2021, 11, 1885. [Google Scholar] [CrossRef] [PubMed]
- Zhao, Z.; Huang, C.; Wu, D.; Chen, Z.; Zhu, N.; Gui, C.; Yong, Q. Utilization of enzymatic hydrolysate from corn stover as a precursor to synthesize an eco-friendly plywood adhesive. Ind. Crops Prod. 2020, 152, 112501. [Google Scholar] [CrossRef]
- Zhang, Y.; Zhou, Q.; Rather, L.J.; Li, Q. Agricultural waste of Eriobotrya japonica L. (Loquat) seeds and flora leaves as source of natural dye and bio-mordant for coloration and bio-functional finishing of wool textile. Ind. Crops Prod. 2021, 169, 113633. [Google Scholar] [CrossRef]
- Qi, Y.; Zhou, Z.; Xu, R.; Dong, Y.; Liu, M.; Shen, L.; Han, J. Research on the staining Properties of Chinese Fir Using Ultrasonic-Assisted Mulberry Pigment staining. Forests 2023, 14, 1832. [Google Scholar] [CrossRef]
- Wu, Y.; Wang, J.; Wang, Y.; Zhou, J. Properties of multilayer transparent bamboo materials. ACS Omega 2021, 6, 33747–33756. [Google Scholar] [CrossRef]
- Regmi, B.; Dutta, A.; Pradhan, R.R.; Arku, P. Physicochemical characteristics and pyrolysis kinetics of raw and torrefied hybrid poplar wood (NM6–Populus nigra). Biofuels 2020, 11, 329–338. [Google Scholar] [CrossRef]
- Rawat, R.; Kumbhar, B.K.; Tewari, L. Optimization of alkali pretreatment for bioconversion of poplar (Populus deltoides) biomass into fermentable sugars using response surface methodology. Ind. Crops Prod. 2013, 44, 220–226. [Google Scholar] [CrossRef]
Disclaimer/Publisher’s Note: The statements, opinions and data contained in all publications are solely those of the individual author(s) and contributor(s) and not of MDPI and/or the editor(s). MDPI and/or the editor(s) disclaim responsibility for any injury to people or property resulting from any ideas, methods, instructions or products referred to in the content. |
© 2024 by the authors. Licensee MDPI, Basel, Switzerland. This article is an open access article distributed under the terms and conditions of the Creative Commons Attribution (CC BY) license (https://creativecommons.org/licenses/by/4.0/).

