Abstract
The Tarim Basin is located in an arid inland area; the ecological environment is fragile, and it is extremely sensitive to climate change. For the purpose of studying dynamic changes in the vegetation response of vegetation in the Tarim Basin to extreme climate, this study used the Vegetation Ecological Quality Index (EQI) as a vegetation indicator and calculated 12 extreme climate indices using Rclimdex. Pearson correlation analysis was used to explore the relationship between EQI values and various extreme climate indices at both inter-annual and intra-annual scales. Additionally, geographic detector analysis was employed to examine the single and interactive effects of extreme climate on the EQI for different vegetation types. The following was found: (1) During 2000–2022, the EQI showed an upward trend in the Tarim Basin, and the increase in agricultural vegetation was the fastest. (2) Since 2000, the extreme warm temperature indices have risen, whereas the extreme cold temperature indices have declined. The warming rate of nighttime temperatures exceeds that of daytime, and the extreme precipitation rises intensively. Simultaneously, continuous dry days have also increased. (3) On an inter-annual scale, the EQI is primarily negatively correlated with the most extreme warm temperature indices, while it is positively correlated with extreme cold temperatures and extreme precipitation indices. On an intra-annual scale, there is an obvious regional concentration in the correlation between the EQI and extreme climate indices. The diurnal temperature range (DTR) and cold daytimes (TX10P) have inhibitory and promoting effects on areas with high and low EQI, respectively. The extremum indices, temperature warm indices, and precipitation intensity indices have a promoting effect on areas with a high EQI and an inhibiting effect on areas with a low EQI. The interaction between extreme climate indices has a greater impact on the EQI than the effect of a single extreme climate index, especially with a significant impact on forests and shrubs. This study provides a reference for the early warning of meteorological disasters, ecosystem protection, and sustainable management in the Tarim Basin.
1. Introduction
The occurrence and intensity of extreme climate events have significantly increased due to the large-scale climate warming observed since the mid-20th century [1,2]. It is anticipated that this trend will only grow stronger in the future [3,4]. Due to the unpredictable and destructive nature of an extreme climate, it has a negative impact on ecosystems and the social economy [5]. It has become evident that vegetation growth in terrestrial ecosystems is significantly impacted by climate change [6]. Extreme climates have a greater and more pronounced impact on vegetation compared to a typical climate. This is due to the abrupt onset of extreme climate, which leaves vegetation communities with insufficient time to adapt, causing the population of crucial species in the ecosystem to decline, and causing terrestrial ecosystems to face significant challenges [7,8,9,10,11]. Vegetation change caused by extreme climate represents the most urgent and significant consequences of climate change for both the economy and the environment. As a result, extensive research has been implemented for the sake of the impacts of extreme climate upon vegetation [12,13,14,15]; monitoring vegetation change and its response to climate extremes is essential to inform ecosystem mitigation responses [16].
Data obtained through remote sensing can be employed to observe the varying changes in vegetation [17]. Commonly used vegetation ecological indices include the Normalized Difference Vegetation Index (NDVI) [18], Fraction of Vegetation Cover (FVC) [19], Enhanced Vegetation Index (EVI) [20], Gross Primary Productivity (GPP) [21], and Net Primary Productivity (NPP) [22]. However, these vegetation ecological indices reflect only one of the vegetation indicators of vegetation coverage or productivity. The growth status of vegetation is not solely indicated by a single characteristic measure of vegetation productivity or coverage, and the outcomes are not exhaustive [23]. Therefore, some scholars have improved the vegetation index and constructed a comprehensive index through multiple vegetation ecological indices to reflect the comprehensive growth of vegetation. At present, the study on vegetation NPP and FVC is still in the research and application phase of individual estimation methods [14,19], and few models and methods based on the two have been observed to estimate the overall ecological quality of vegetation [23]. In 2019, the China Meteorological Administration released the Land Vegetation Meteorological and Ecological Quality Monitoring and Evaluation Level, which introduced the Vegetation Ecological Quality Index (EQI) composed of the FVC and NPP as two key characteristic quantities to comprehensively reflect the overall condition of vegetation and ecosystems; by adjusting the weight coefficients of FVC and NPP, the EQI can be applied to different regions [24]. Currently, research on the EQI mainly focuses on monitoring dynamic changes in vegetation and reflecting the impact of climate change, human activities, and other factors on vegetation [25,26,27,28]. There are also studies using the EQI to reflect the response of vegetation in the Yellow River Basin [29], the Chengdu–Chongqing Economic Zone in China [30], and the Aksu region of Xinjiang [31] to extreme climates. These studies have demonstrated the feasibility of using the EQI to study the dynamic changes in vegetation and its response to extreme climates. However, research on the EQI is still limited, especially in relation to the Tarim Basin EQI, which is currently restricted to the Aksu region on the northern edge of the Tarim Basin, and the weights of FVC and NPP in the EQI calculation of the Tarim Basin refer to the EQI calculation of the Aksu area [31]. The temporal and spatial characteristics of EQI changes are affected by the research period, region, and vegetation type, leading to some differences [29]. Therefore, it is necessary to conduct further research on the Tarim Basin EQI.
Vegetation is highly sensitive to climate change in arid regions, and increasing temperature and precipitation can prolong the growth period of vegetation in Central Asia [32]. In the arid region of Eritrea, vegetation degradation has been attributed to extreme drought in a warming climate [33]. In arid areas of Spain, vegetation is more responsive to drought [34]. There are similarities and differences in the responses of vegetation to climate in different arid areas. The common denominator is that precipitation is the main factor affecting vegetation in arid areas because changes in temperature and precipitation can determine the hydrothermal conditions of vegetation growth, especially for arid and semi-arid ecosystems [35]. Therefore, the response of vegetation to extreme climate in the Tarim Basin needs to be explored. In previous studies, the primary focus was on examining how individual extreme climate factors impacted vegetation. However, this approach failed to fully capture the complete influence of extreme climate on vegetation growth. It overlooked the intricate coupling effect between extreme climate indices, which has a more pronounced influence on vegetation [36,37]. In addition, the growth of vegetation in different ecosystems is affected by distinct water and heat requirements; consequently, the impacts of extreme climate on different vegetation types exhibit significant variations [38,39,40]. However, most studies have ignored this difference by focusing on changes in the entire vegetation in relation to the influence of extreme climate; less have studied the extreme climate in relation to the influence of different vegetation types [41] and the extreme climate coupling effect of vegetation growth [42,43]. Therefore, this study not only examines the impact of extreme climate events on vegetation on both inter- and intra-annual scales, but also investigates the combined impact of two extreme climate factors on the growth of various types of vegetation, as well as the individual contribution of each extreme climate factor to vegetation growth. Although there have been studies on the effects of complex extreme climate disasters on vegetation growth from various perspectives, there are still few systematic studies on the coupling effects of multiple extreme climate indicators on the contribution rate of vegetation [37]. Particularly lacking are studies on the effects of the coupling of extreme climate on different vegetation types in arid areas.
The Tarim Basin is located in the southern part of Xinjiang, China. It is an inland arid region that exhibits high susceptibility to climate change. Its vegetation is largely distributed on the basin edge, where various oasis sizes and shapes are scattered [44,45,46]. The following are this study’s primary goals: (1) Breaking down the dynamic variations in extreme climate and the EQI in the Tarim Basin’s vegetation distribution region in order to improve knowledge regarding extreme climate change in arid regions, providing guidance for future risk assessment and economic development in relation to climate-related disasters, as well as a basis for preventing desertification. (2) Analyzing vegetation responses to extreme climate in order to help alleviate the negative effects of extreme climate and protect the ecosystem stability. (3) Exploring the contribution of extreme climate to various vegetation types, providing strategies and laying a foundation for the adaptation of vegetation to different climates.
2. Study Area
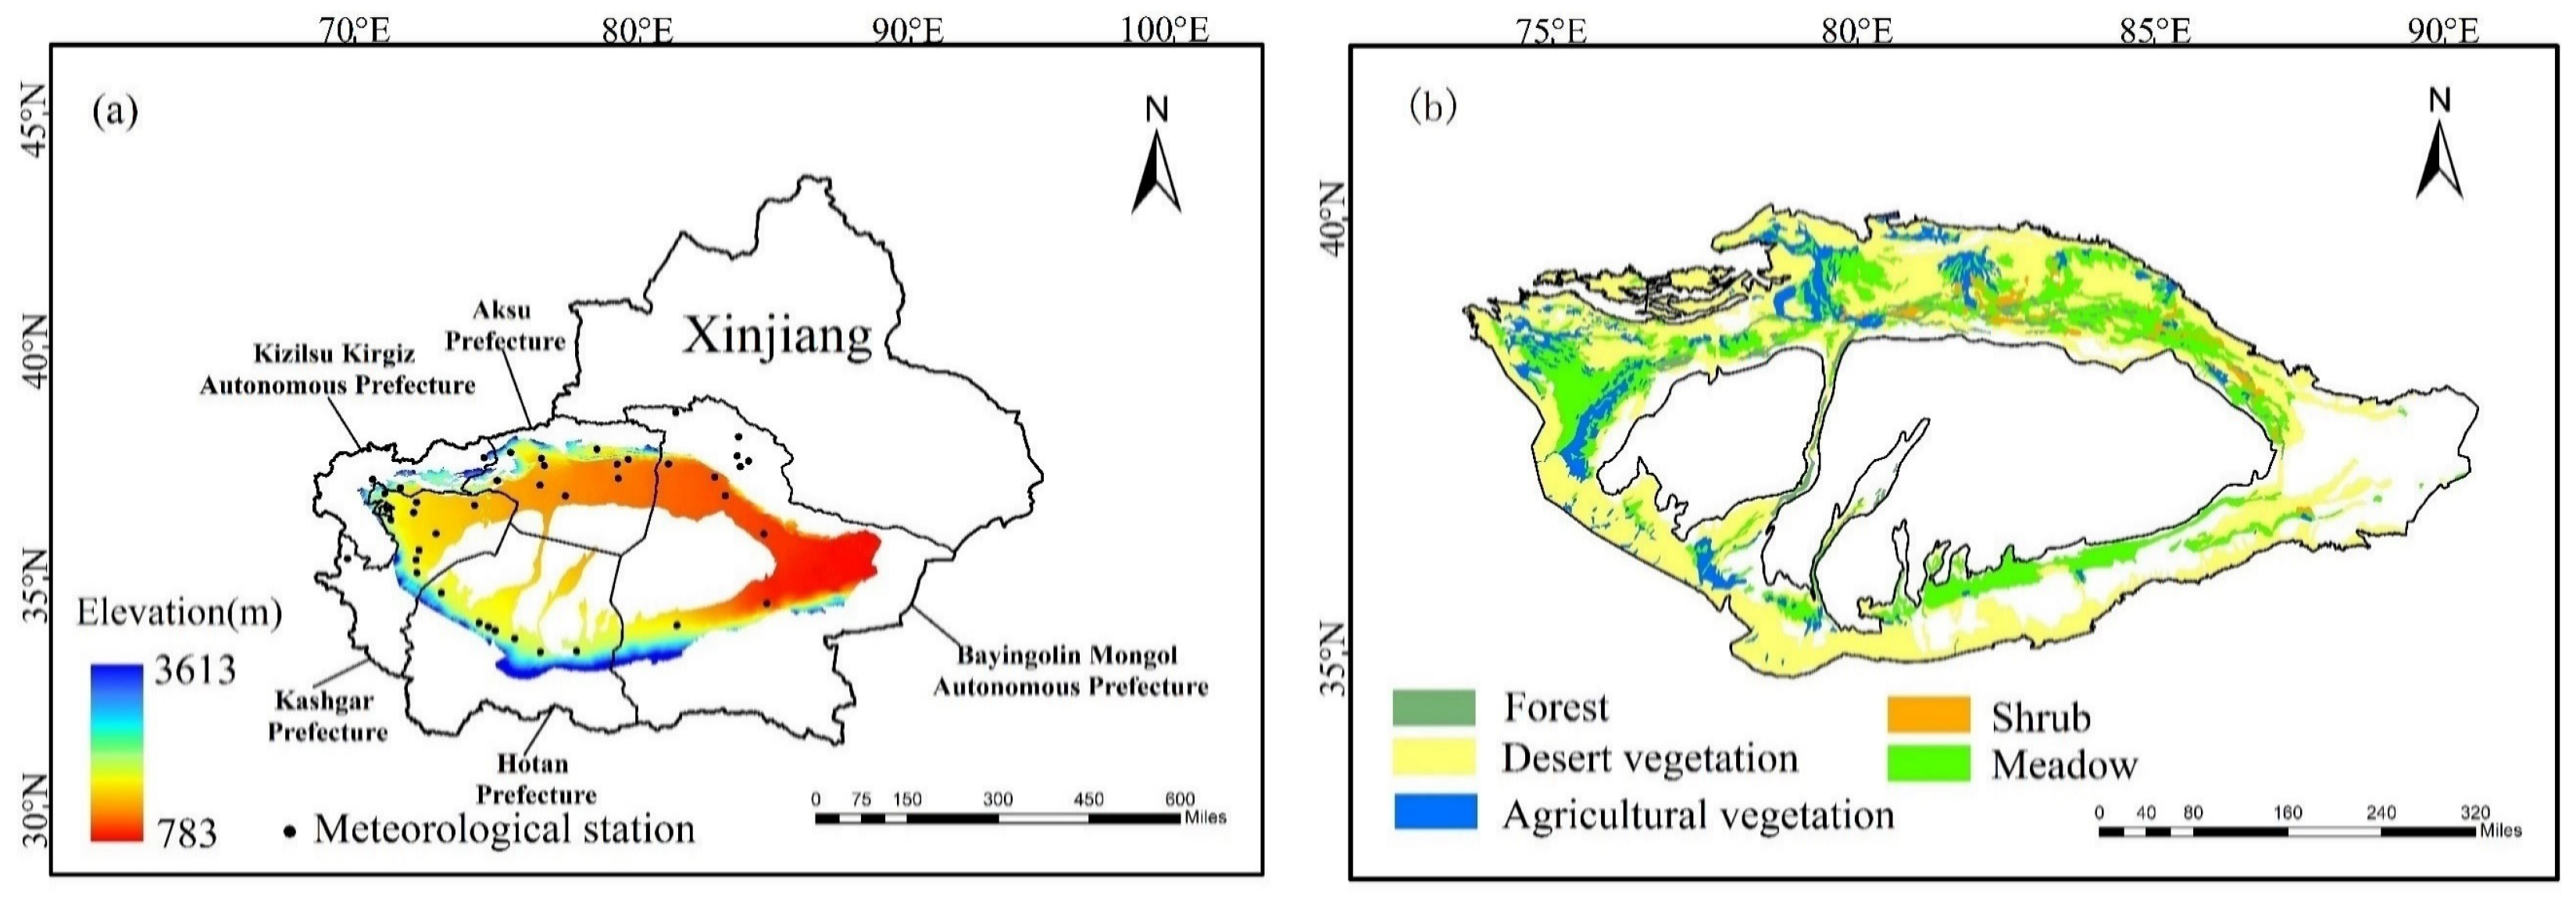
In the Tarim Basin, the climate is dry, experiencing an average annual precipitation of 116.3 mm. The river experiences its highest water levels in July, August, and September due to snow melting and effects of glaciers [47]. The vegetation found in the Tarim Basin primarily consists of trees and shrubs that are able to withstand drought conditions. These types of vegetation are typically found growing along the river. Additionally, there are numerous oases of varying sizes located along the periphery of the Tarim Basin, which have a crucial function in supporting human survival and socio-economic progress and are sensitive to the climate [48,49]. The research area was defined as the vegetation and oasis distribution area near the basin, in addition to surrounding areas of the Taklimakan Desert highway where vegetation is distributed (Figure 1a). The research area primarily consists of woodland, shrubs, meadow, desert vegetation, and agricultural vegetation. The remaining areas are predominantly characterized by bare gobi or desert (Figure 1b). The dominant species are mainly shrubs and herbaceous plants. The main vegetation includes Populus euphratica Oliv., Tamarix ramosissima Ledeb., Glycyrrhiza inflata Batal., Alhagi camelorum Fisch., Nitraria tangutorum Bobr., and Kalidium foliatum (Pall.) Moq. [50]. The main agricultural crops are cotton, wheat, and corn [51].
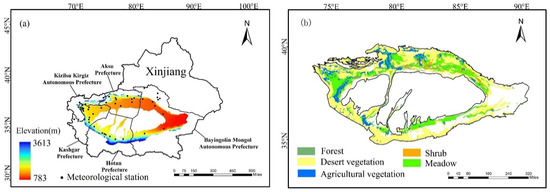
Figure 1.
Study area location distribution maps: (a) distribution map of the geographical location and meteorological stations of the Tarim Basin; (b) distribution map of vegetation types in the Tarim Basin.
3. Datasets and Methodology
3.1. Data Sources and Pre-Processing
The meteorological information originated from two sources. One of these sources was the China Meteorological Data-Sharing Service System (http://cdc.cma.gov.cn/, accessed on 13 February 2023), which contains the common maximal and minimal temperatures and precipitation taken from 42 meteorological stations between 2000 and 2022. These data were used for calculating extreme climate indices using the Rclimdex(1.0) software, and the sunshine percentage was used to calculate the monthly solar radiation. The other source was the National Earth System Science Data Center (National Science and Technology Infrastructure of China) (http://www.geodata.cn, (accessed on 9 July 2023), accessed on 20 July 2023), which provided monthly mean temperatures and precipitation from 2000 to 2022 at a space resolution of 0.0083333° (more or less 1 km). We sampled the data to a space resolution of 500 m as raster data, and interpolated the monthly solar radiation data to an identical resolution by means of ANUSPLINE. The monthly mean temperatures were used to calculate the NPP parameters in the CASA model, as well as monthly average precipitation, and monthly solar radiation.
NDVI data were derived from the 2000–2022 MODIS13A1 data product, which was supplied by the National Aeronautics and Space Administration (NASA) Data Center. The spatial resolution was 500 m; in addition, the time interval was 16 days. From the MODIS13A1 data, we selected images of the vegetation between April and October. Synchronously, the maximal value synthesis (MVC) approaches were utilized, with the aim of attaining month-by-month NDVI data. The NDVI data were then used to calculate the NPP and FVC.
The data for the vegetation types comprised 1:1,000,000 vegetation type maps of China from the Western China Environmental and Ecological Science Data Center (http://westdc.westgis.ac.cn, accessed on 6 August 2023); these data were applied to the CASA model for the purpose of figuring out the NPP.
3.2. Methods
3.2.1. Calculation of the Extreme Climate Indices
We selected 12 extreme climate indices, recommended by the Climate Change Detection and Index Expert Group (ETCCDMI), that exhibited strong associations with vegetation, flood disasters, high temperatures, and low temperatures in the Tarim Basin, as shown in Table 1. The raw data were first screened with the Rclimdex model to exclude outliers. Missing values were recorded as −99 to ensure that no more than 1% of the values were missing.

Table 1.
The names and meanings of extreme climate indices.
3.2.2. Pixel Dichotomy Model
Vegetation cover (FVC) refers to the percentage of the total area covered with ground vegetation [52]. The vegetation cover calculated using the NDVI-based pixel dichotomy model has high accuracy and is widely used [53]. In this study, the FVC was determined using MODIS13A1 monthly synthetic NDVI data for the period spanning from April to October, which represents the vegetation growing season, from 2000 to 2022. The model of the pixel dichotomy was adopted for the sake of calculating the FVC, and the average monthly FVC values were combined to calculate the annual FVC. The formula for the FVC is as follows:
NDVIsoil is nearly 0, and it refers to the NDVI value of pure bare soil pixels. NDVIveg is roughly 1, and it refers to the NDVI of pure vegetation pixels. In fact, noise frequently impacts remote-sensing images, which makes it hard for them to be up to standard in real-world environments. In the calculation process, the gray value of the image element at the 5th and 95th percentiles is typically used to calculate the FVC in desert areas, taking into account the environmental characteristics of arid regions [54,55]. In this study, in combination with previous research experience, the first 5% of the NDVIV was chosen as the NDVIsoil, while the NDVI value corresponding to the latter 95% was selected as NDVIveg.
3.2.3. NPP Calculation Based on CASA Model
The CASA model is the most extensively applied model for estimating light energy utilization. Potter [56] was the first to use CASA to estimate the North American vegetation NPP. Two main parameters, the vegetation absorbed photosynthetic active radiation (APAR) and the light energy utilization ratio (ε), are primarily used to estimate the NPP [57]. The formula for calculating this is listed as follows:
In Equation (2), the APRP denotes the favorable radiation for plant photosynthesis (MJ·m−2) on a specific pixel (x) during the t month. The symbol ε represents the efficiency of light energy utilization (x), also known as the photogenic utilization rate (gC·MJ−1). Regarding the calculation methods for APAR and ε, please refer to the literature [58].
3.2.4. Calculate the Vegetation Ecological Quality Index
The Vegetation Ecological Quality Index (EQI), constructed from the vegetation NPP and FVC, can reflect both the ability of vegetation to produce and its cover capacity per unit area. The NPP and FVC form an integrated model using a weighted approach [29]. The formula for the EQI is as follows:
In Equation (3), the EQI ranges from 0 to 100. NPPmax stands for the highest value of the vegetation NPP that was documented throughout the designated assessment period. f1 and f2 are weight coefficients, where the sum of f1 and f2 is 1, and the values of f1 and f2 are adjusted according to the region; in this study, both f1 and f2 are set at 0.5.
3.2.5. Pearson Correlation Analysis
Pearson correlation analysis is used to calculate the correlation coefficients between extreme climate indices and the EQI. We employed the correlation coefficient for the sake of indicating the extent to which vegetation responds to extreme climate (significance level 0.05) [16].
3.2.6. Geographic Detector
The geographic detector is a group of statistical approaches. This detector is used for detecting the spatial differences and uncovering the driving factors and influencing mechanisms behind them [59,60]. This study examined the explanatory power of individual extreme climate factors and combinations of two extreme climate factors on the EQI using factor detectors and interaction detectors.
Factor detector: The factor detector primarily quantitatively measures the spatial differentiation of each natural factor’s impact on the EQI of the Tarim Basin by evaluating the factor’s level of explanatory power. For the explanatory power q value, the formula is expressed below:
In Equation (4), h represents the layer of the influence factor. Nh refers to the sample size of the factor in layer h. Additionally, N refers to the sample size of the factor in the entire study area. Moreover, h refers to the variance of the factor in layer h; δh2 refers to the variance of the factor in the EQI of the research area. The q values span from 0 to 1. A higher q value signifies a greater explanatory capacity of the factor in relation to the EQI space distribution. q = 0 indicates that the factor is not correlated with the EQI. Conversely, when q = 1, this suggests that the factor is capable of completely explaining the spatial pattern of the vegetation ecological quality.
Interaction detector: The interaction detector is a tool utilized for the sake of determining if the interaction between two influence factors will enhance or weaken their explanatory EQI capability. It evaluates whether the impacts of these elements on the EQI are independent of one another. In this study, interactive detection was used to reflect the explanatory capability of the interaction between various extreme climate indices to the EQI. The criteria for making these judgments are listed in Table 2.
Table 2.
Interaction types of impact factors.
4. Results
4.1. Change Characteristics of Vegetation Ecological Quality
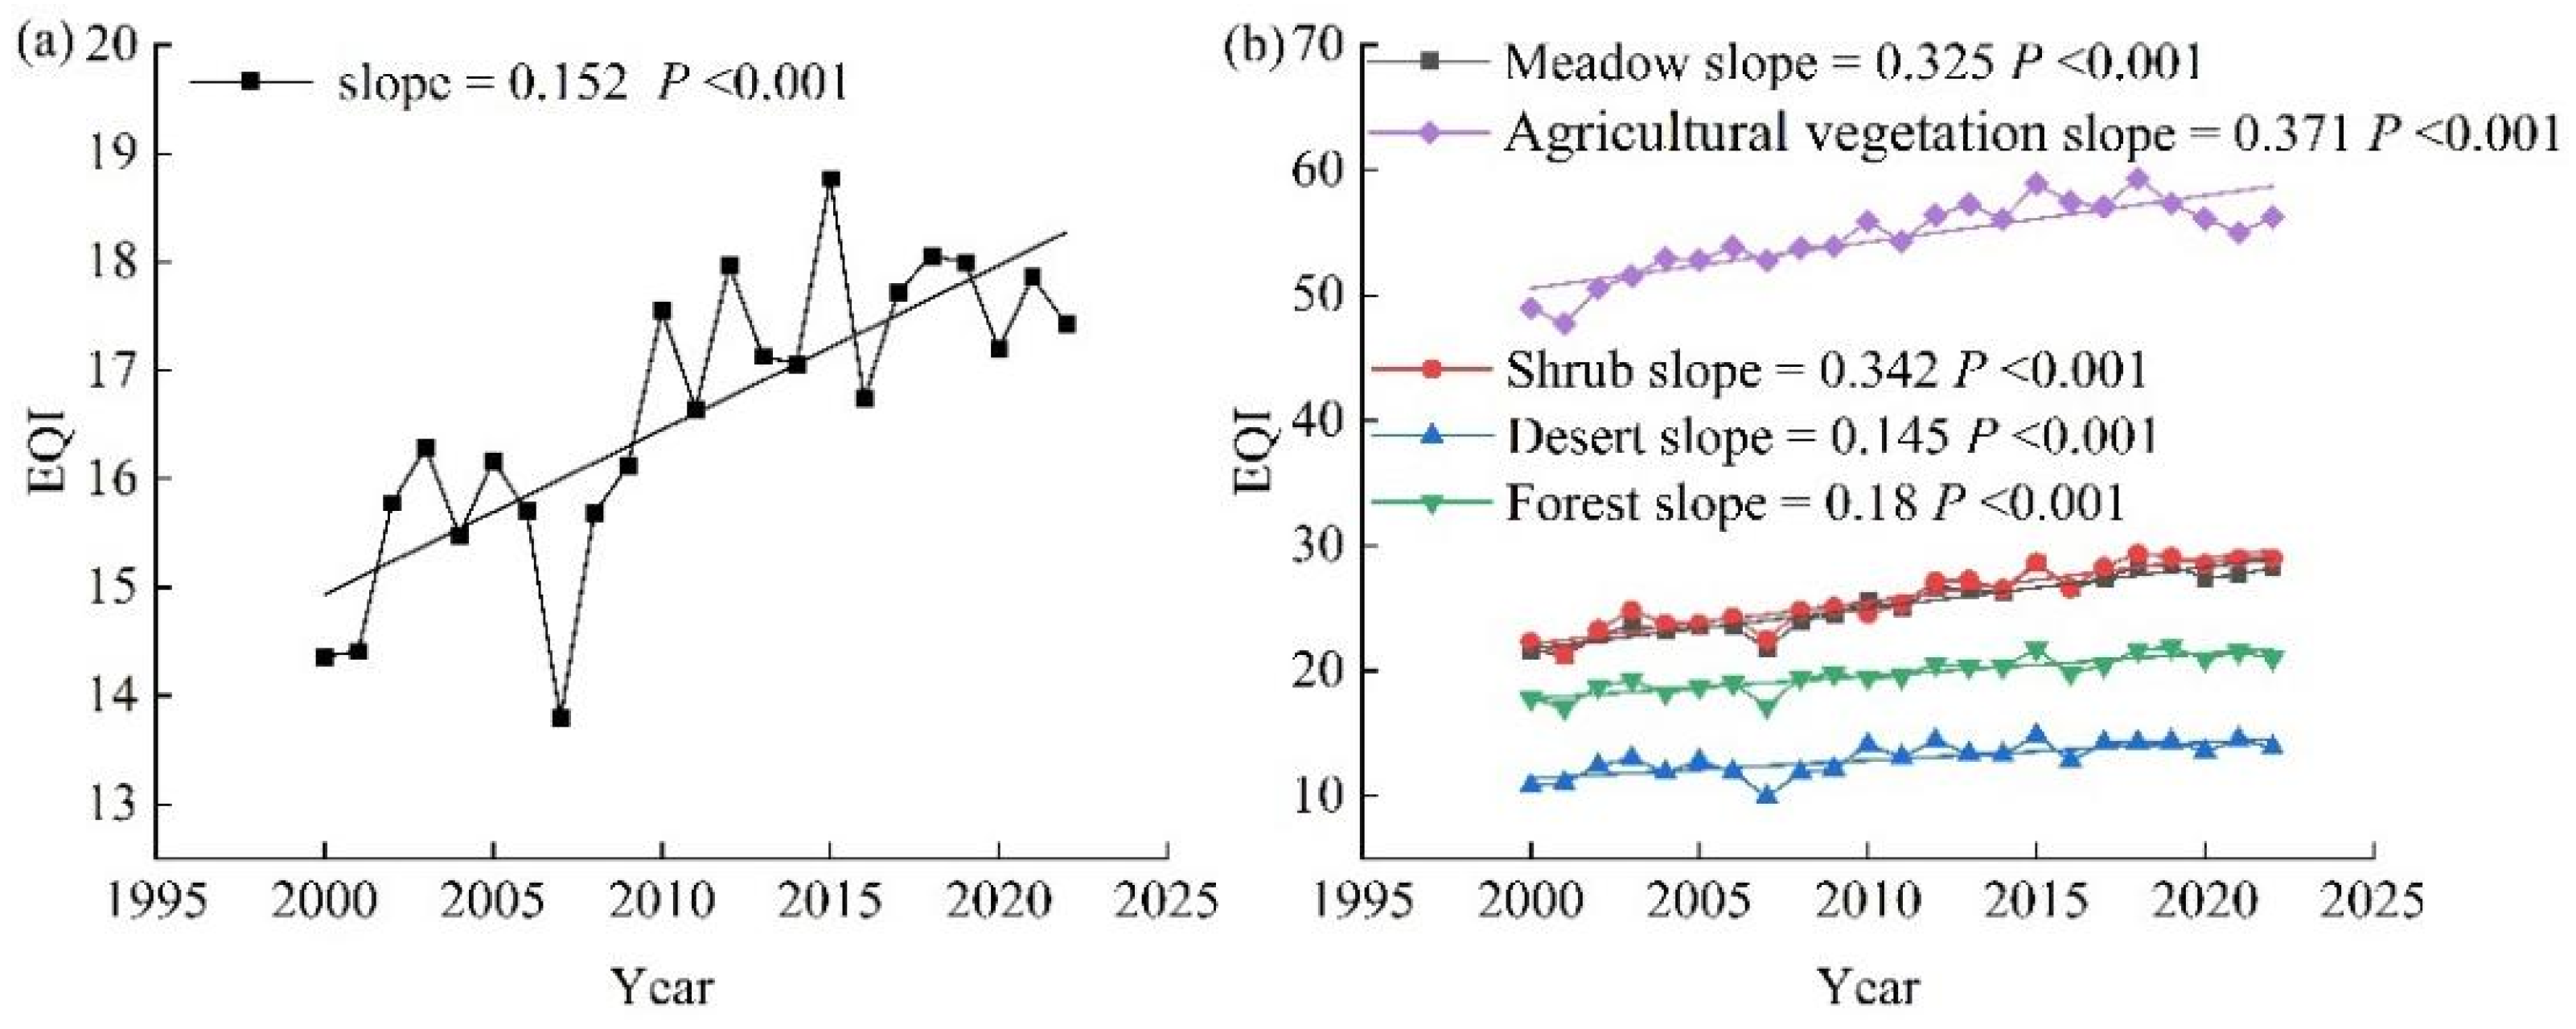
This study analyzed the annual mean (growing season) changes in EQI on an inter-annual scale. As depicted in Figure 2, the EQI in the Tarim Basin exhibited a significant increase from 2000 to 2022, growing at a rate of 1.52/10a (p < 0.001). During this specified time frame, the EQI experienced its lowest value in 2007 (13.793), its highest value in 2015 (18.765), and maintained an average value of 16.603. The trend in the EQI change for all vegetation types exhibited similarity to the annual EQI change trend (Figure 2b), indicating a significant increasing trend. The range of the annual average EQI was found to be 9.899–59.355. The EQI growth rate of agricultural vegetation was the highest at 3.71/10a. On the other hand, desert vegetation exhibited the slowest growth rate, with a value of 1.45/10a.
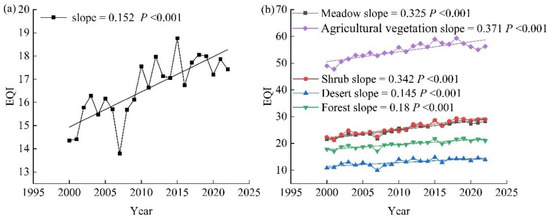
Figure 2.
Inter-annual variations in the EQI from 2000 to 2022. (a) Variations in the overall EQI within the Tarim Basin; (b) EQI fluctuations across different vegetation types.
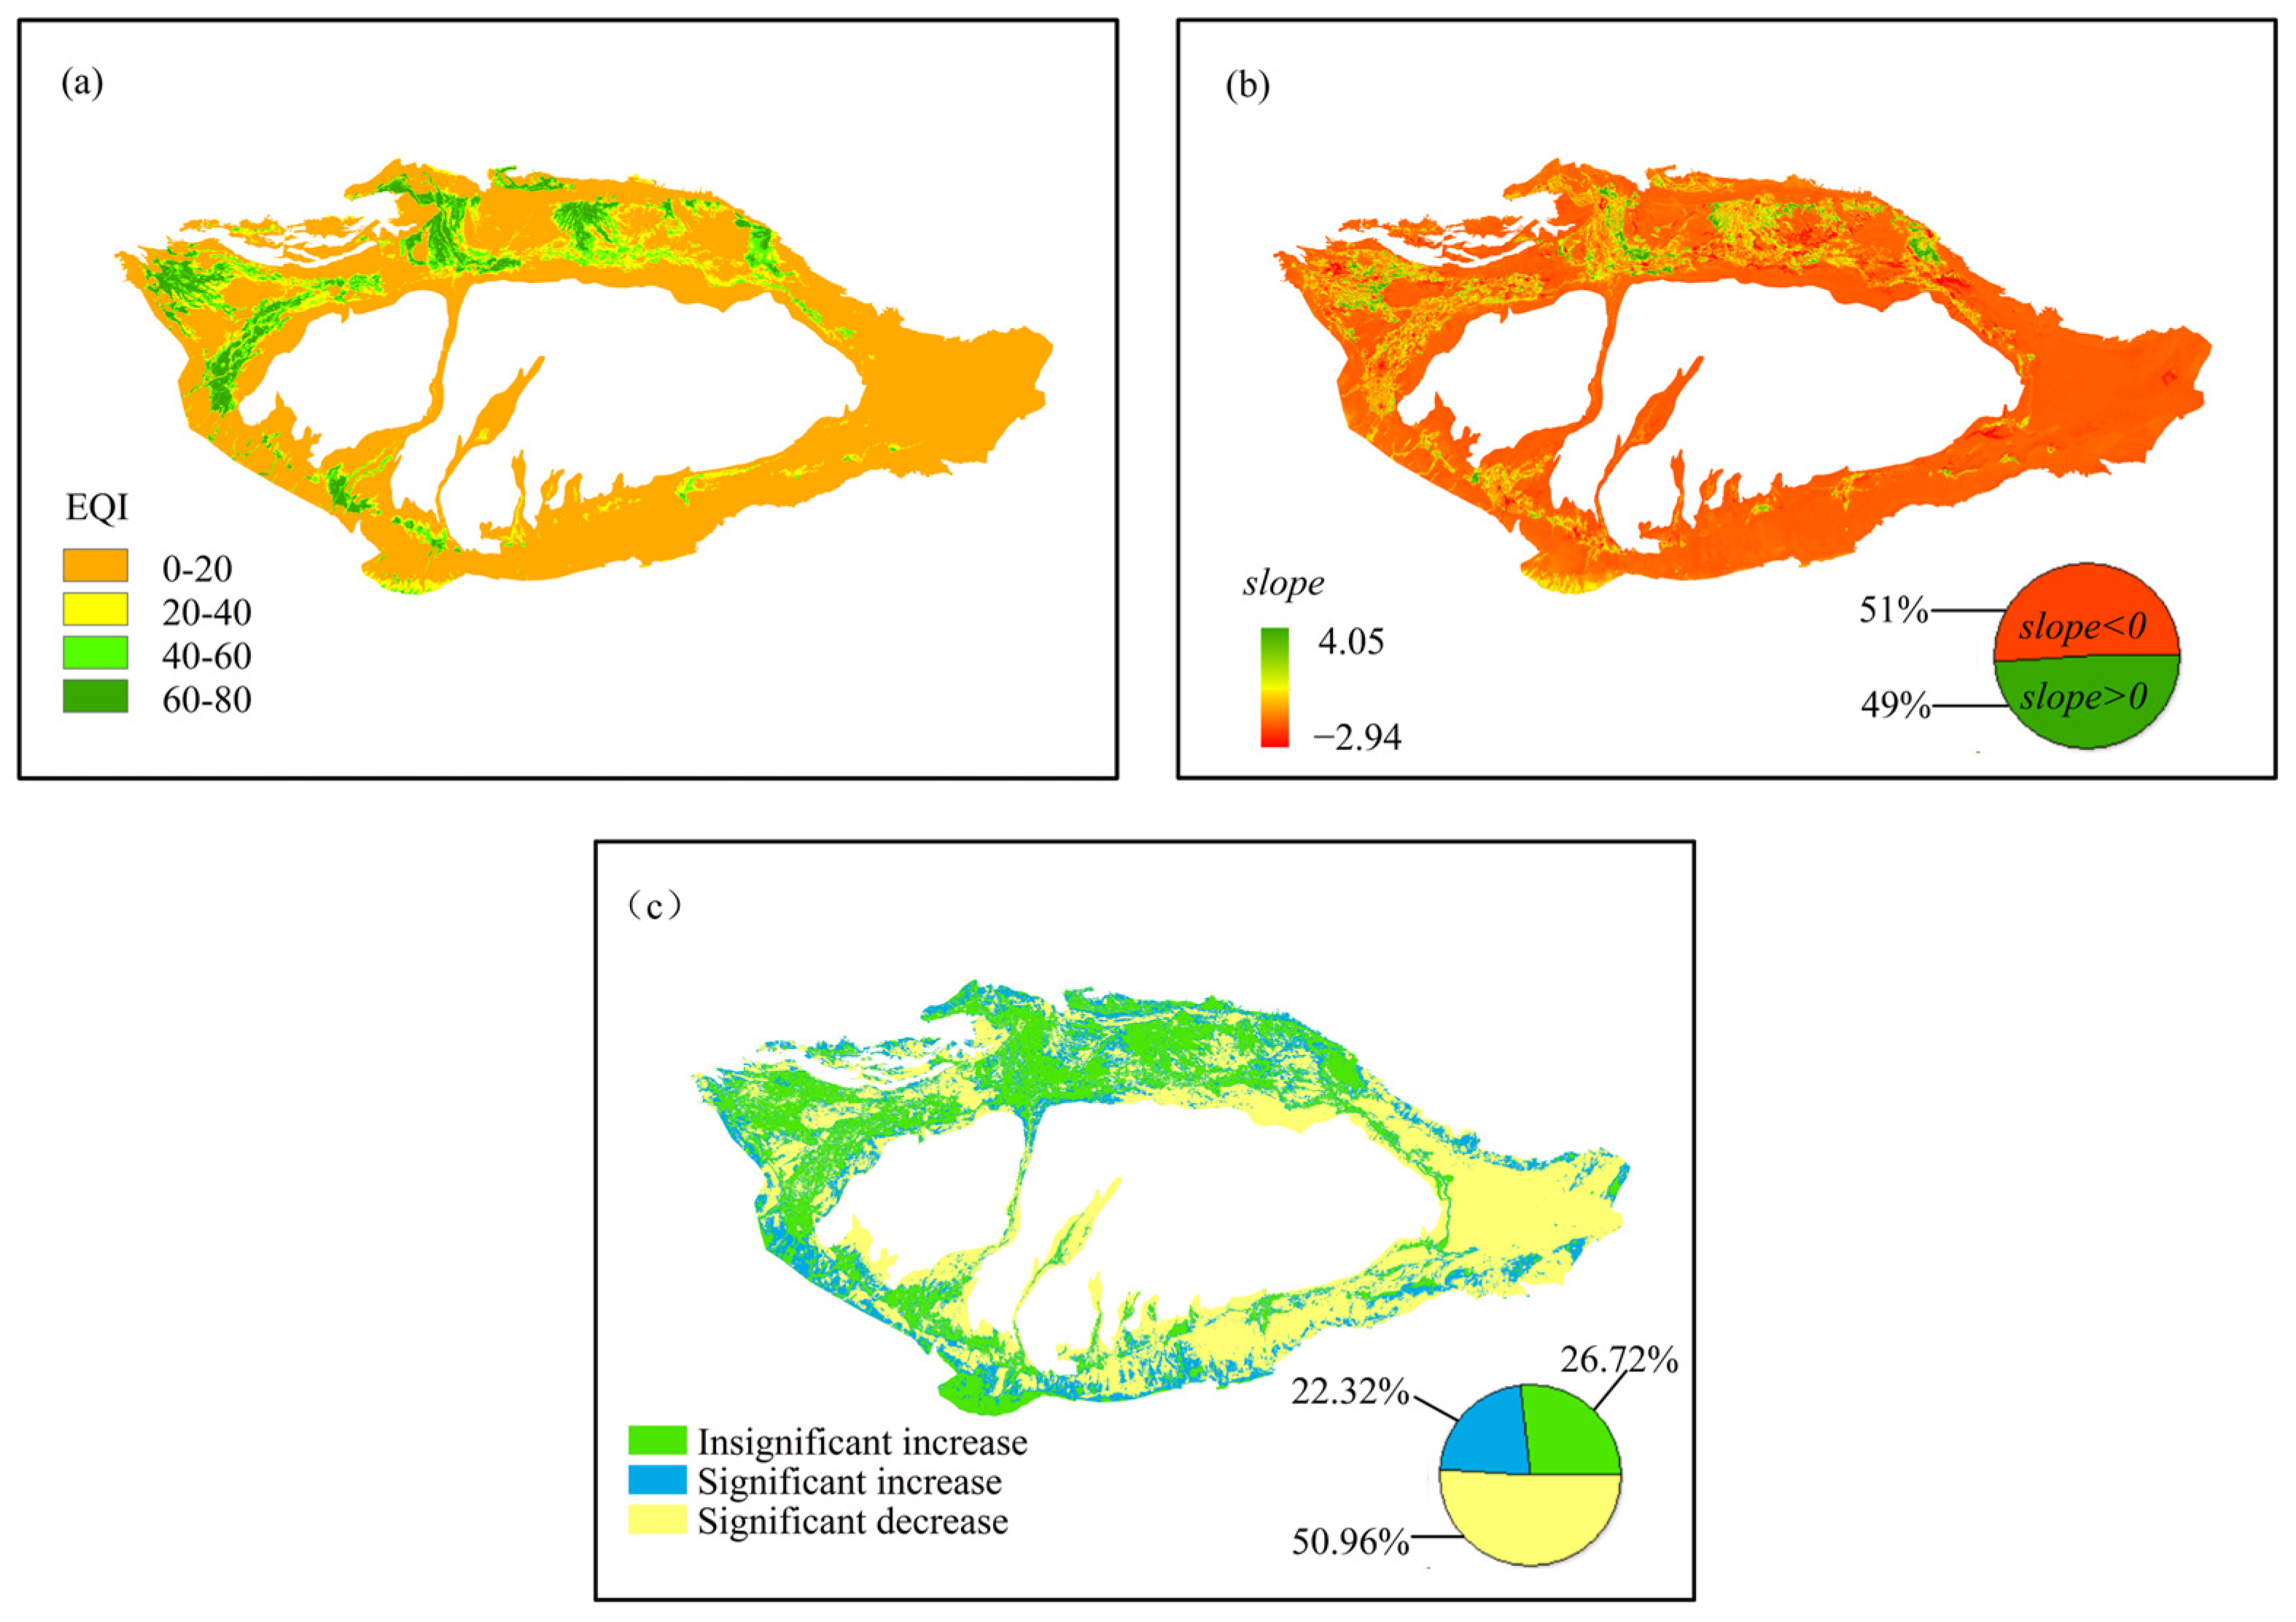
Figure 3a shows the average EQI’s spatial distribution pattern in the Tarim Basin from 2000 to 2022. The EQI ranges from 0.12 to 78.15 across the study area. The regions with high EQI values in the Aksu region are primarily located at the juncture of the regions of Kuqa, Shaya, and Xinhe. Additionally, high EQI values are observed in Aksu city, Southern Wensu, Northern Awati, and Alar. The high-EQI areas in the Kashgar region are primarily found in Kashgar city, Shule, and Shufu to the north, and Yingjisha and Zepu to the south. The areas with a high-value EQI in the Hotan region are relatively scarce and mainly located in the oasis border areas in Southern Moyu, Southern Luopu, and Northern Hotan County. Of the high-EQI-value areas in the Bayingoleng Mongolin Autonomous Prefecture, the distribution is relatively limited and primarily concentrated in Korla city. The areas with low EQI values are primarily found in the Chemma, Ruoqiang, and Hotan regions located on the southern part near the above-described basin, as well as in the central Kashgar and Aksu regions situated on the northern part near the basin. The analysis reveals that the ecological vegetation quality in the northern margin of the basin surpasses that of the southern one. Additionally, the northern margin is characterized by a greater number of oases, whereas the southern margin is predominantly composed of desert and gobi landforms, resulting in larger areas with sparse or no vegetation. This can be clearly observed in the regions of Chemma and Ruoqiang.

Figure 3.
Spatial variations of the EQI from the year 2000 to 2022. (a) The mean distribution of the EQI; (b) the distribution of EQI trends; (c) The distribution of significance levels for EQI trends.
The variation trend of the EQI for each pixel during the growing season in the basin between 2000 and 2022 ranges from −2.93 to 4.05 (Figure 3b). The spatial distribution of the EQI variation trends resembles that of the EQI mean values, where the EQI trend increased in about 49% of the region. As depicted in Figure 3c, the observed rise in the EQI in the Tarim Basin can be linked to both the enlargement of the oasis area and the augmentation of vegetation within the pre-existing oasis area. Consequently, the EQI in the vicinity of the oasis region exhibits a noticeable upward trajectory. The EQI decreased prominently in desert and gobi regions in Chemma and Ruoqiang regions, while it demonstrated an increase in most other regions within the basin. Particularly, there existed a prominent increase of 22.32% observed primarily in the desert vegetation area.
4.2. Change Trend of Extreme Climate Indices
Figure 4 shows features of the extreme climate indices’ temporal variation. There are obvious differences in the inter-annual variation in each extreme climate indices. The TXx exhibited an increase at a rate of 0.4 °C/10a, the TNn increased at a rate of 0.5 °C/10a, and the DTR exhibited a declining trend at a rate of −0.1 °C/10a. The rate of decrease in the SU25 was 1.5 days/10a. The cold indices, TN10P and TX10P, decreased at rates of 0.8/10a and 0.1/10a, respectively. The warm indices, TN90P and TX90P, showed a rising tendency, with increasing rates of 1.1/10a and 0.8/10a, respectively. The rate of warming during the night was found to be higher compared to the daytime. The extreme precipitation indices, RX1d and RX5d, exhibited increasing rates of 1.4 mm/10a (p < 0.001) and 2.3 mm/10a (p < 0.001), respectively. The SDII increased at a 0.4 mm·d−1/10a (p < 0.001) pace. The CDD also raised at a growth rate of 7.1 days/10a. In general, between 2000 and 2022, the Tarim Basin displayed a warming tendency; the single precipitation intensity increased and the trend of continuous dry days also increased.
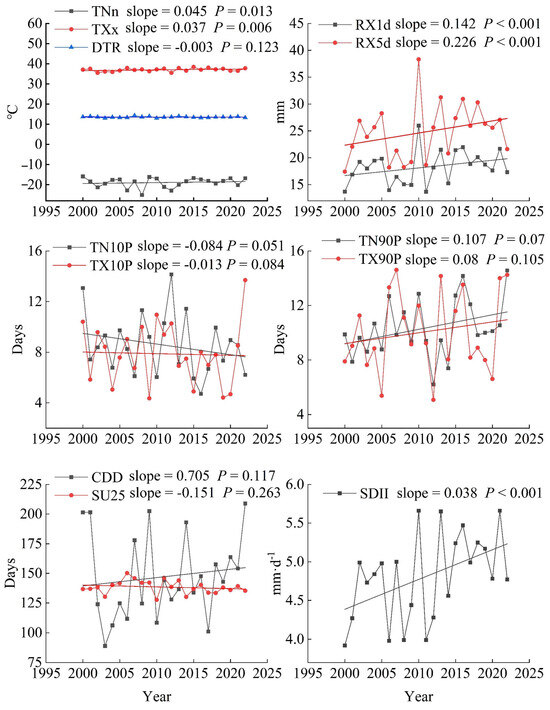
Figure 4.
Change trend of extreme climate indices in the Tarim Basin during 2000–2022.
4.3. Correlation between the EQI and Extreme Climate Indices
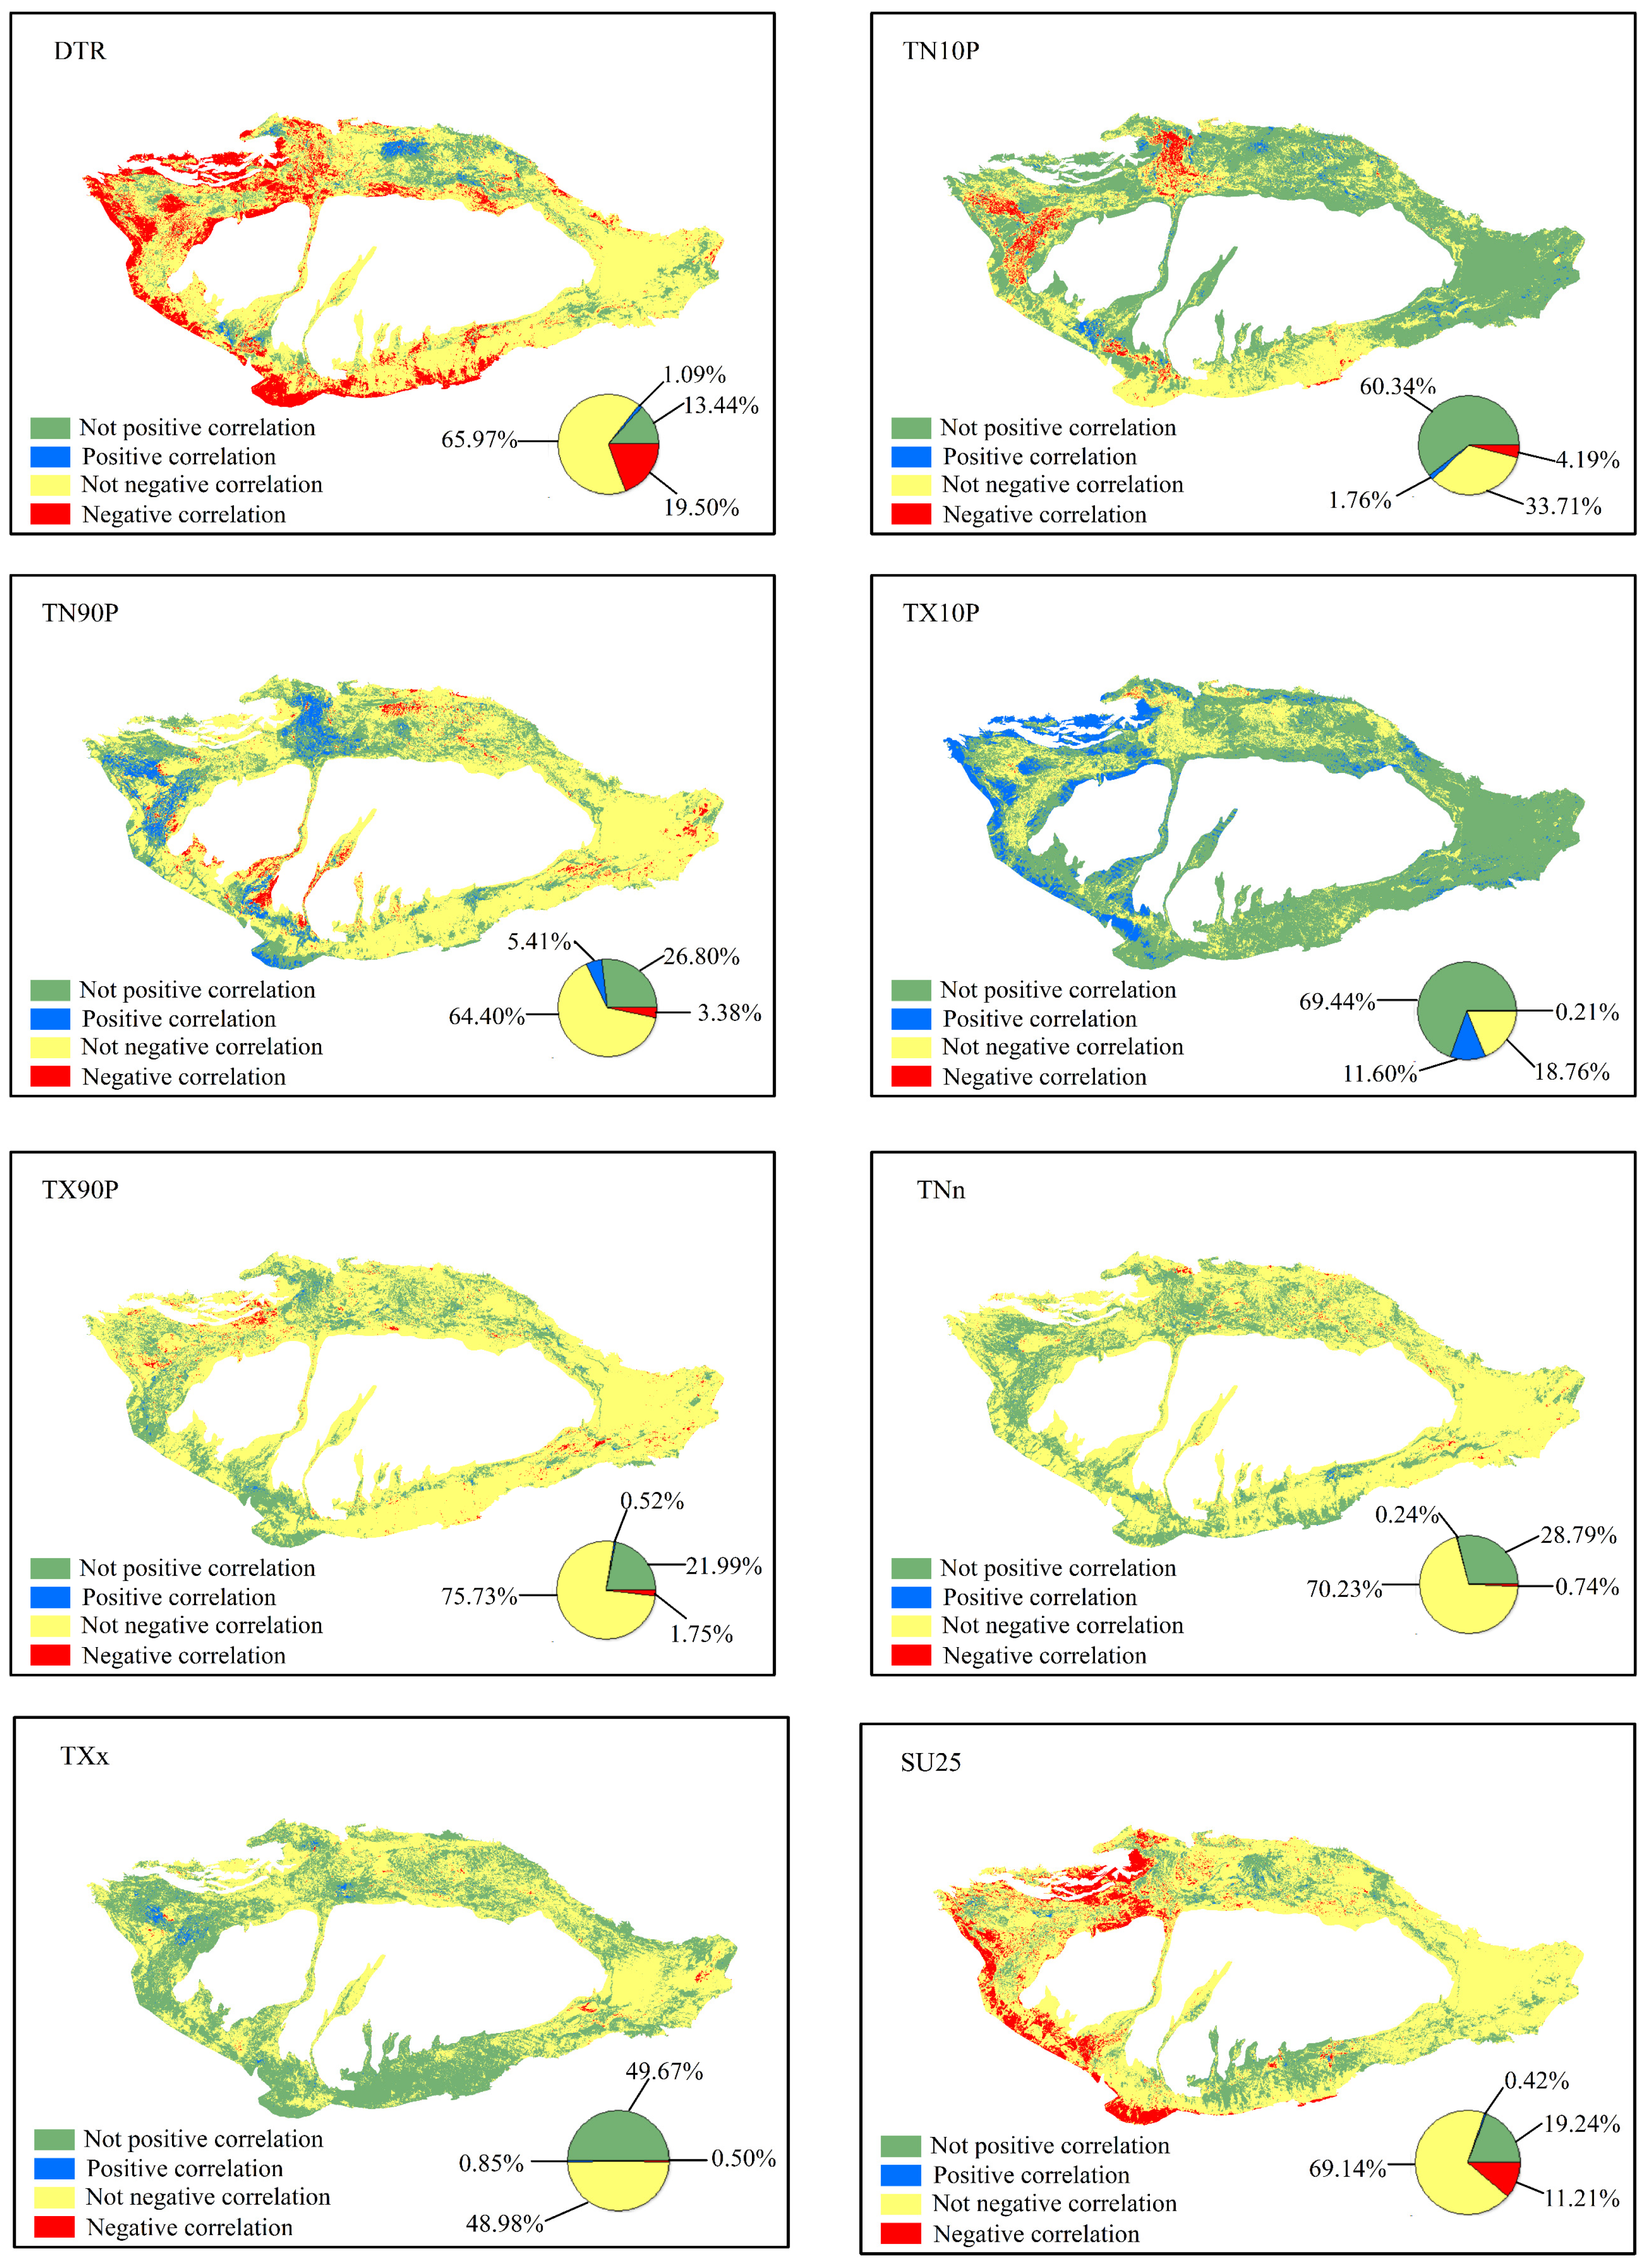
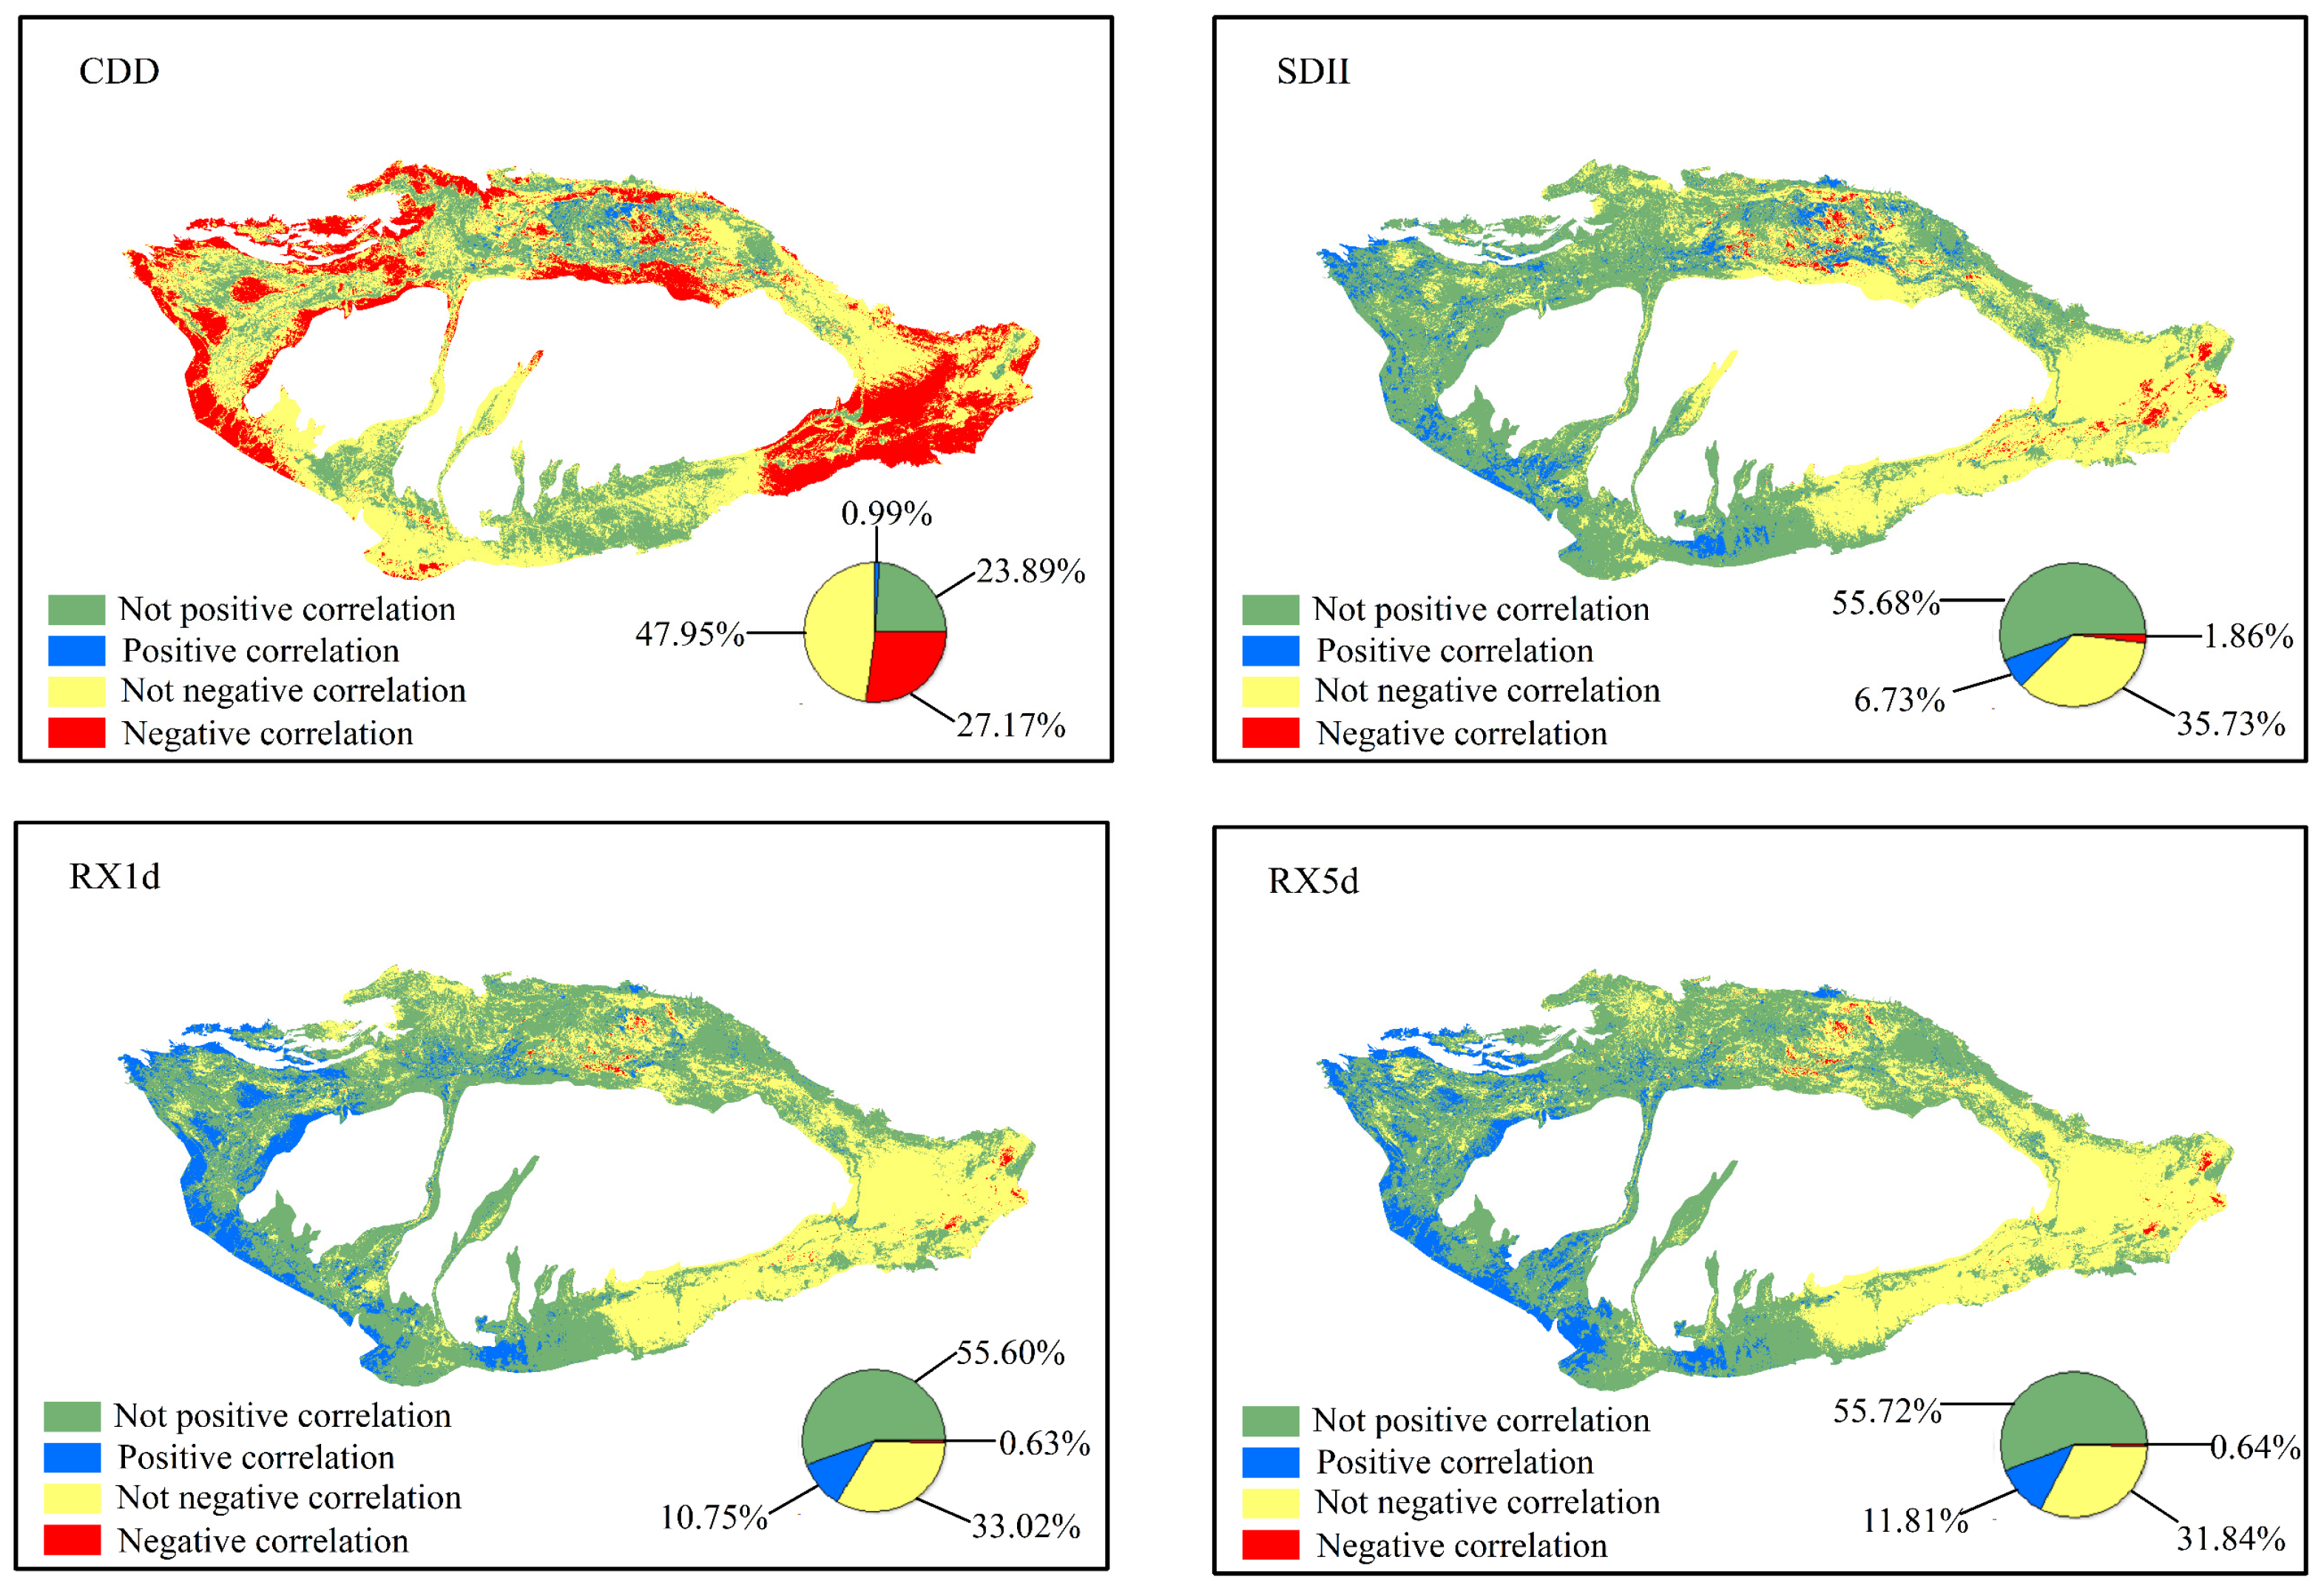
The correlation coefficient between vegetation and extreme climate indices can serve as an indicator for evaluating the influence of extreme climatic conditions upon vegetation growth. The inter-annual correlation coefficient is exhibited in Figure 5 as a spatial distribution pattern. In the extreme temperature indices, DTR, TN90P, TX90P, TNn, SU25, and EQI are mainly negatively correlated. Specifically, the DTR and SU25 show a negative correlation in more than 80% of the regions studied. A prominent negative correlation is demonstrated in nearly 19.5% and 11.21% of these regions; it largely diffuses in western regions of Aksu, Kashgar, and Hotan. The correlation between the TN10P, TX10P, and EQI is predominantly positive, while the region displaying a significantly positive correlation with the TX10P encompasses 11.60% of the overall region. It is chiefly distributed in Western Aksu, Kashgar, and Western Hotan. The TXx positively correlated areas are chiefly distributed in the southern margin of the basin. The positive correlation between extreme precipitation indices SDII, RX1d, and RX5d and the EQI occupies more than 60% of the regions, and 6.73%, 10.75%, and 11.81% of regions exhibit significant positive correlations, respectively. SDII, RX1d, and RX5d show significant positive correlations with the EQI, primarily concentrated in the western regions of Kashgar and Hotan. The regions with a negative correlation between the CDD and EQI represented 75.12%; the areas with a prominent negative correlation were primarily observed in the northern margin of the basin and the eastern region of Ruoqiang County.
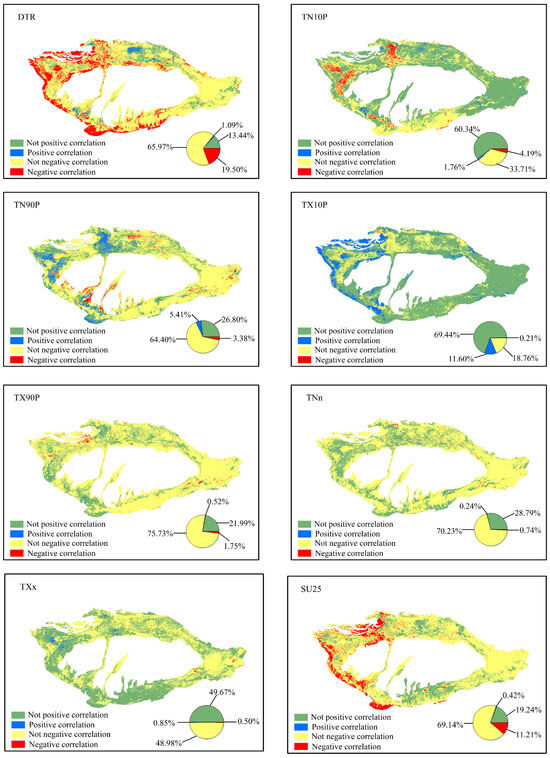
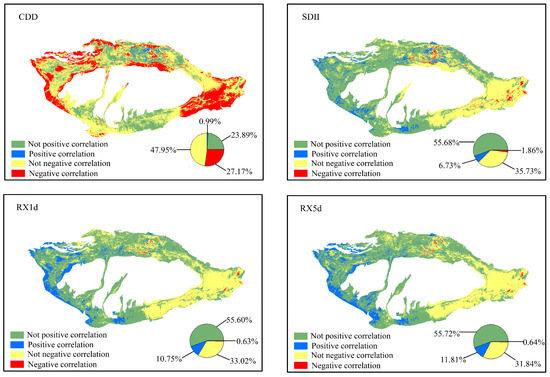
Figure 5.
Spatial distribution of inter-annual correlation coefficients between the EQI and extreme climate indices.
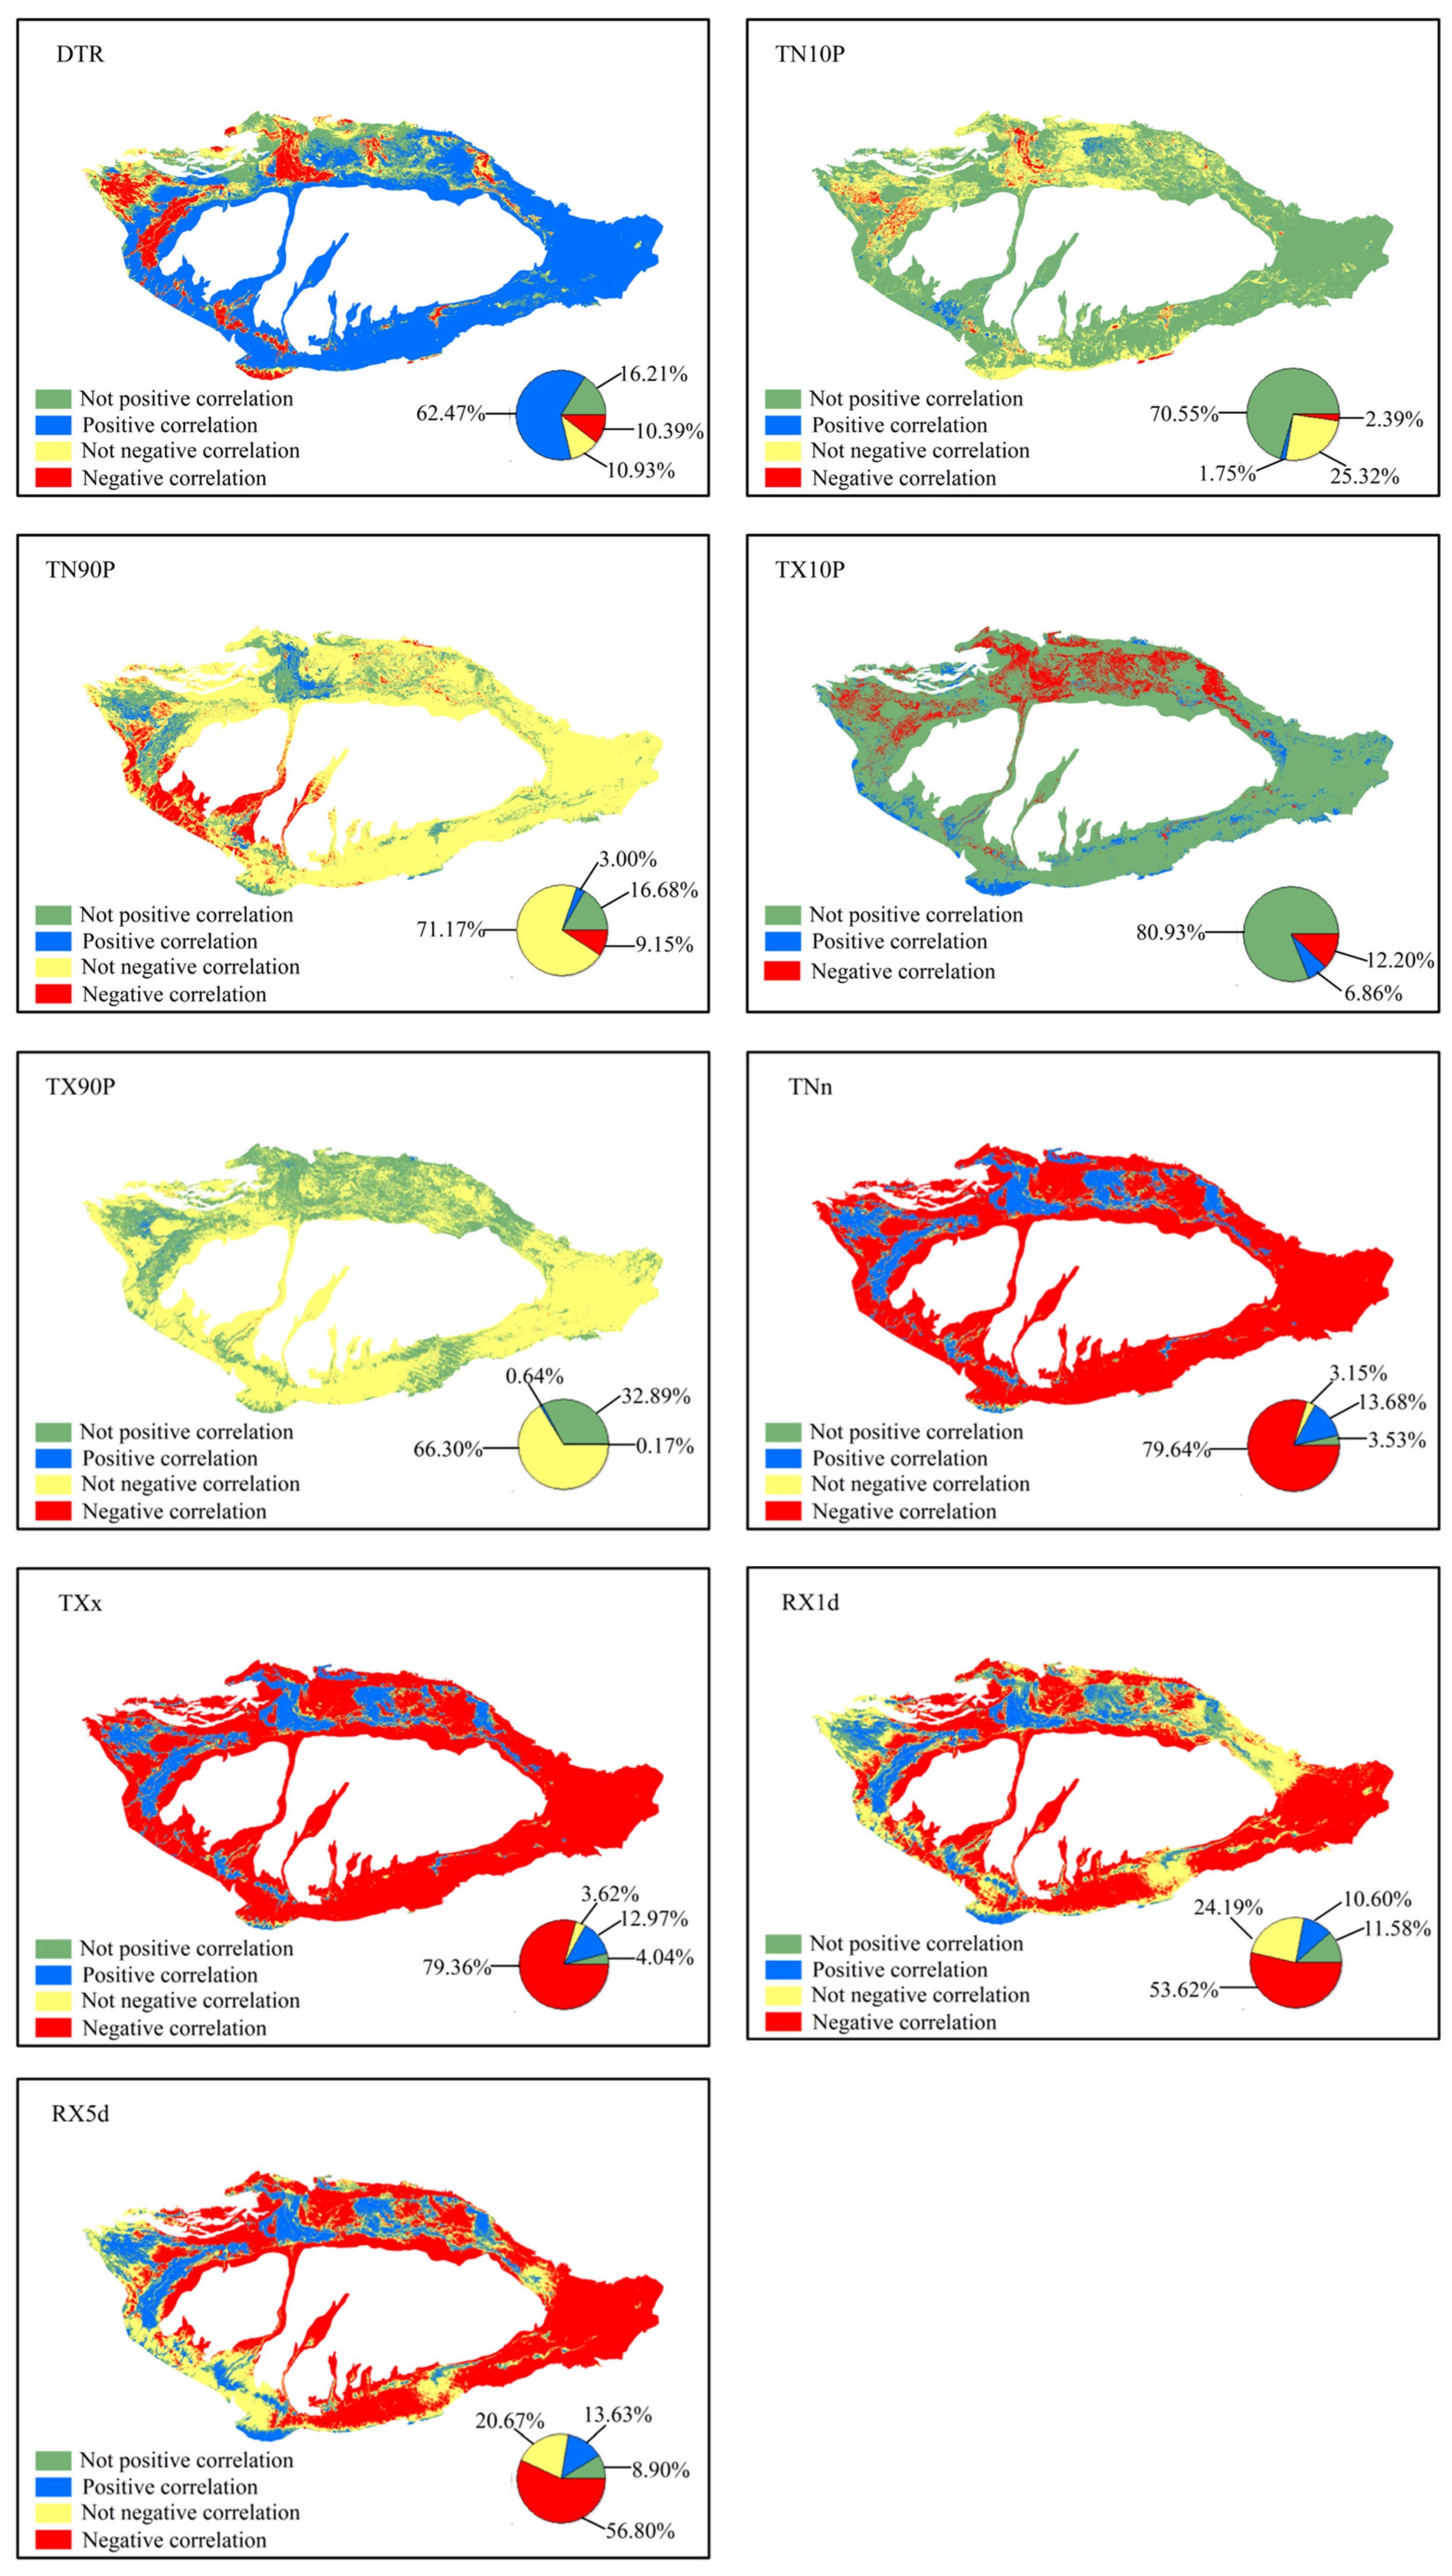
Figure 6 displays the spatial distribution pattern of intra-annual correlation coefficients between the EQI and extreme climate indices. The correlations of the extreme temperature indices, the TX90P, TN10P, TX10P, and TN90P, with the EQI are analogous to the distributing pattern of inter-annual correlation coefficients. The regions where TN10P, TX10P, and EQI are positively correlated are distributed in most parts of the Tarim Basin, but the areas where TN10P is significantly positively correlated are relatively few, mainly concentrated in Moyu County. The areas where TX10P is significantly negatively correlated are greater than the significantly positively correlated areas, mainly distributed on the northern edge of the Tarim Basin, where the EQI is higher. Conversely, TX10P shows a significant positive correlation in the areas with higher EQI at the southern edge of the Tarim Basin. TN90P, TX90P, and EQI are negatively correlated in most parts of the Tarim Basin. The areas where TX90P is significantly negatively correlated account for 9.15%, but these areas are concentrated in the regions with lower EQI values in the southern part of Kashgar and the western part of Hotan. TNn, TXx, RX1d, and RX5d are significantly positively correlated in areas with high EQI values, while areas with sparse or no vegetation show a negative correlation. In particular, the regions where TNn and TXx are significantly negatively correlated are close to 80%, indicating a clear regional concentration distribution feature. The spatial distribution pattern of intra-annual correlation coefficients between the DTR and EQI exhibits a significant divergence from that of the inter-annual correlation coefficients. In terms of inter-annual analysis, DTR was negatively correlated with the EQI in most regions. Conversely, on the intra-annual scale, the positive correlation area accounted for 78.68%. This positive correlation was primarily observed in regions characterized by sparse vegetation. Conversely, oasis areas with high EQI values displayed a significant negative correlation. It is evident that, in contrast to the inter-annual scale, the correlation on the intra-annual scale exhibits distinct regional concentrations.
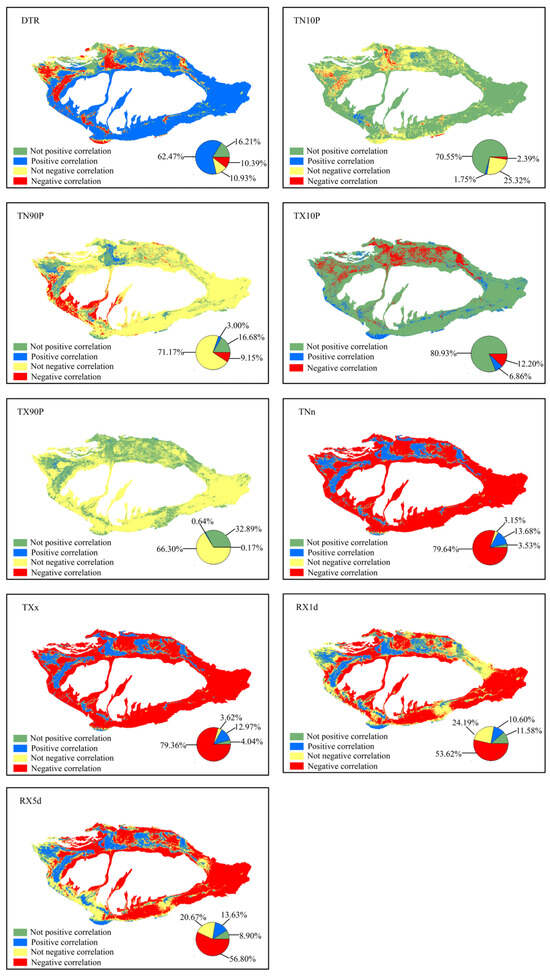
Figure 6.
Spatial distribution of intra-annual correlation coefficients between EQI and extreme climate indices.
4.4. Change Characteristics of Vegetation Ecological Quality
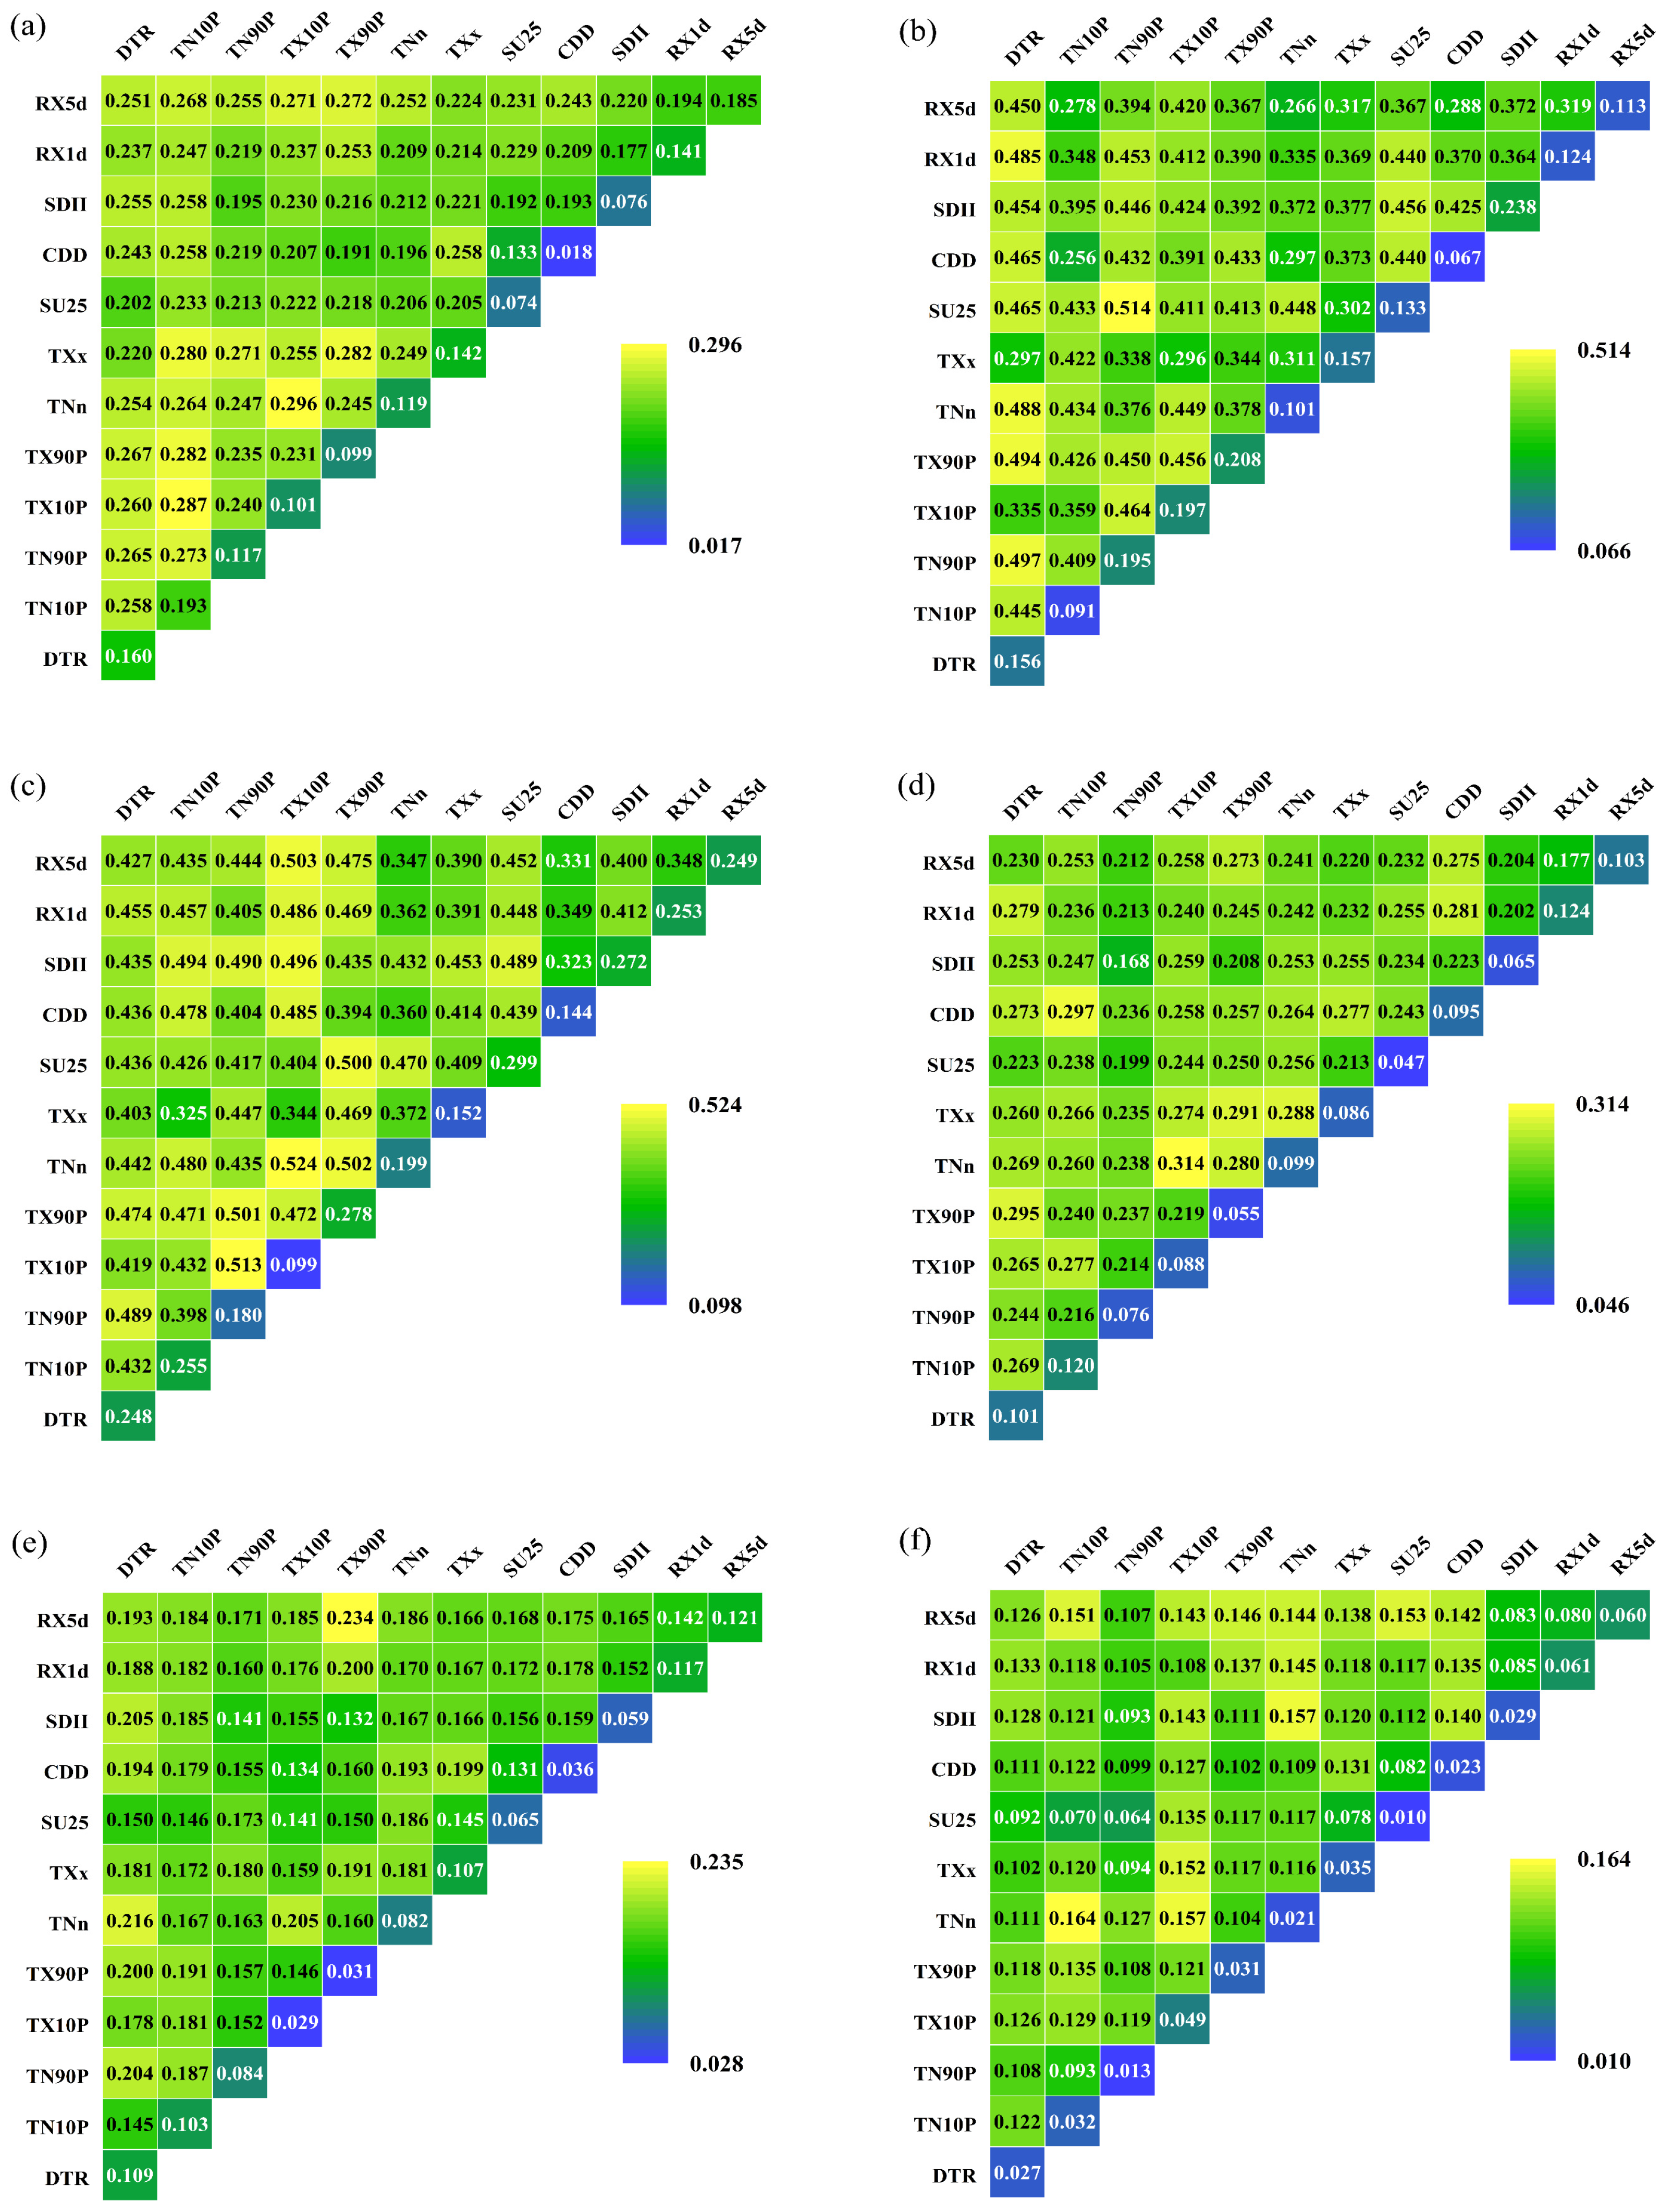
In this research, a factor detection analysis approach was adopted to examine the influence of 12 extreme climate factors on the EQI intensity in the Tarim Basin, as well as on different vegetation types. The findings are presented in Table 3. The TN10P contributes the most to the EQI spatial distribution in the Tarim Basin (q = 0.193), followed by the RX5d (q = 0.185). The influence of the same extreme climate on the EQI varies significantly across different vegetation types. The SDII and the TX90P are identified as the primary factors influencing the EQI of forests. The SU25, TX90P, SDII, TN10P, RX5d, and other similar factors have been identified as the primary determinants influencing the vegetation EQI. Among the various factors considered, the SU25 (q = 0.299) exhibits the most significant influence on the shrub EQI. The variables of the RX1d, TN10P, RX5d, and DTR exert a substantial influence on the meadow EQI. The desert vegetation EQI is primarily influenced by the RX5d, with the RX1d having a secondary impact. It was discovered that the influence of extreme climate upon agricultural vegetation was relatively minimal, with each extreme climate factor contributing less than 10% to the agricultural vegetation EQI. Among these factors, RX1d was identified as having the greatest impact on agricultural vegetation. The study employed an interaction detector to examine how the interaction between various extreme climate factors affected the EQI. The interaction detection analysis (Figure 7) revealed that the interaction of these factors exhibited a nonlinear enhancement or a double-factor enhancement relationship with the EQI. For the whole Tarim Basin, the variables of the TX10P ∩ TNn (q = 0.296), TN10P ∩ TX10P (q = 0.287), TX90P ∩ TXx (q = 0.282), and TN10P ∩ TX90P (q = 0.282) exhibit a significant impact on the EQI. The forest EQI is primarily influenced by the TN90P ∩ SU25. The individual contribution rates of the TN90P and SU25 to the forest EQI are moderate. However, their interaction significantly enhances their overall influence. Both the shrub and meadow EQI are primarily influenced by the TX10P ∩ TNn, whereas the agricultural vegetation EQI is most affected by the TX10P ∩ TNn. The impact of the TNn on the EQI of shrub, meadow, and agricultural vegetation was found to be minimal. However, it was discovered that the TNn impact on the vegetation type EQI was enhanced when it interacted with other factors. This suggests that the TNn acts as an indirect factor that affects the EQI of shrub, meadow, and agricultural vegetation. The TX90P and RX5d exhibit the most significant contribution to the desert EQI, with the TX90P having a relatively minor effect on the desert EQI, while the RX5d has the greatest impact. The interaction between the TX90P and RX5d significantly amplifies their impact on the desert EQI. It is evident that the EQI in each vegetation type area is not only affected by a single factor but is the result of the combined action of all factors. There exist notable variations in the extent to which extreme climate factors contribute to different vegetation types.
Table 3.
Contribution of different extreme climate factors to the EQI of different vegetation types.
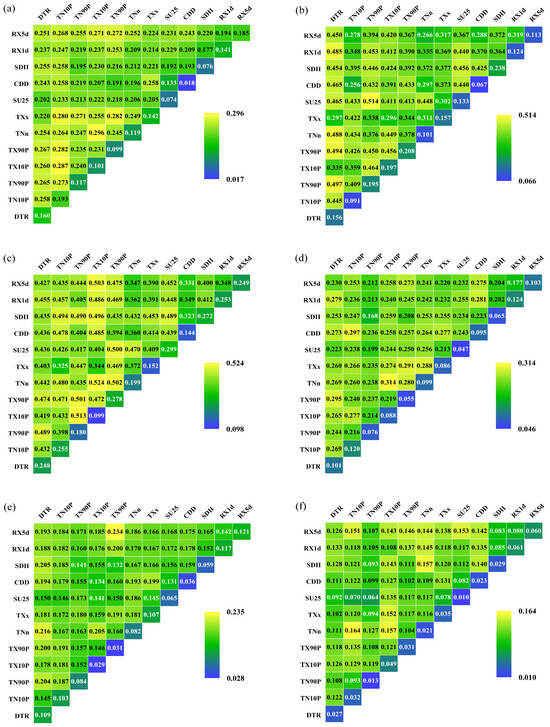
Figure 7.
The contribution rates of different extreme climate factors to different vegetation types. (a) Tarim Basin; (b) forest; (c) shrub; (d) meadow; (e) desert vegetation; (f) agricultural vegetation.
5. Discussion
5.1. Alteration in the Ecological Quality of Vegetation
From 2000 to 2022, the growing season EQI in the Tarim Basin exhibited a significant increasing trend, aligning with the observed patterns of vegetation variation within Xinjiang [61], Northwestern China [16], and across the entirety of China [62]. From Figure 4, it can be seen that in 2007, the extreme precipitation indices RX1d, RX5d, and SDII were relatively high, which could improve vegetation growth in the short term after rainfall. However, the number of consecutive dry days (CDD) in 2007 was significantly higher than in most years, i.e., there was extreme drought in the northwest of the Tarim Basin in 2007 [63], and the TX90P was also higher than in neighboring years. Therefore, the lowest EQI value in the Tarim Basin in 2007 may be related to the phenomenon of prolonged drought and high daily temperatures. In contrast, in 2015, the extreme precipitation indices RX1d, RX5d, and SDII were relatively high, and the CDD was lower, promoting vegetation growth, resulting in a higher EQI value in 2015 compared to other years. The vegetation in the Tarim Basin is mainly agricultural, so the EQI for agricultural vegetation is the highest [61]. This disparity can be attributed to the presence of a larger oasis area on the northern edge, which surpasses that on the southern edge. This improvement in the vegetation in the Tarim Basin is attributed not only to climatic factors but also to the positive outcomes of ecological restoration initiatives. With increasing human activities, oasis agriculture has been vigorously developed [64]. The implementation of various projects, including the Tarim River water diversion project, the Three-North Shelterbelt Project, and sand control measures, has been carried out in a sequential manner [65,66]. These projects have augmented the expanse of the oasis area within the basin and have also increased the vegetation coverage within the transitional area between the desert and the oasis. The vegetation conditions in the Tarim Basin have obviously improved. Due to the growth of population and the development of the social economy, human activities have increasingly interfered with the ecological system, leading to a reduction of vegetation in arid areas. Therefore, human activities have both a promoting and inhibiting effect on the EQI of the Tarim Basin [48]. In addition, the superimposed effects of human activities, climate change, and other factors have caused the EQI of the Tarim Basin to show a fluctuating upward trend. The EQI values of different vegetation types in the basin all show an increasing trend. Among them, agricultural vegetation has the fastest increasing trend in terms of the EQI. This can be attributed to the expansion of oasis agriculture within the Tarim Basin, which has led to the cultivation of surrounding grasslands and unused land into farmland, promoting the greening of the oasis edges [67]. Therefore, the growth rate of agricultural vegetation in terms of the EQI (3.71/10a) is the fastest. The desert vegetation is sparse due to harsh living conditions and is also impacted by the limited number of ecological rehabilitation projects. Therefore, the desert vegetation EQI is the lowest and has the slowest growth rate (1.45/10a).
5.2. Changes in the Extreme Climate Indices
On account of the delicate ecological balance, the Tarim Basin is painfully vulnerable to the impact of extreme climate. Between 2000 and 2022, the Tarim Basin exhibited a notable upward tendency in the extreme warm temperature indices, while simultaneously experiencing a downward tendency in the extreme cold temperature indices. The magnitudes of the changes observed in the TN10P and TN90P exceed those observed in the TX10P and TX90P, resulting in the nighttime temperatures rising more rapidly than the daytime temperatures. The rate of warming for the daily minimum temperature exceeds that of the daily maximum temperature, resulting in an asymmetry between the two changes and ultimately bringing about a decline in DTR [68]. This changing trend is consistent with the whole of Xinjiang and the world, but the warming rate of TNn is lower than the average warming rate of TNn in China [69]. Extreme warm temperature events mainly occur in the southern part of the Tianshan Mountains surrounding the Tarim Basin and the western part of the Taklimakan Desert [70]. In the basin, the temperature demonstrates a consistent rise, consistent with the broader temperature patterns observed in Xinjiang and across China [71,72]. Therefore, it is evident that the extreme temperature indices demonstrate significant regional coherence.
In this study, an analysis of extreme precipitation indices RX1d, RX5d, and SDII reveals a significant increasing trend, suggesting a rise in precipitation intensity within the Tarim Basin from 2000 to 2022. It is anticipated that this trend will persist throughout the 21st century [71,73]. The amount of rainfall in the eastern part of the Tarim Basin is significantly higher than in the western part. Intense rainfall is mainly concentrated on the southern slope of the Tianshan Mountains, and extreme precipitation is significantly increased in the northern part of the Tarim Basin [74]. In addition, the changes in temperature and precipitation in the Tarim Basin can be reflected in the changes in glacial lakes. The expansion of glacial meltwater has increased the area of lakes, mainly due to the large-scale reduction in glaciers under warming conditions. The expansion of non-glacier-fed lakes reflects an increase in precipitation in the mountainous areas of the Tarim Basin [75]. These findings provide confirmation that the climate in Xinjiang is undergoing a gradual transition towards a warmer and more humid pattern. Hu observed a declining trend in the number of overall cumulative dry days (CDD) in Xinjiang [76]. However, in this study, the CDD showed a rising tendency, which contradicts the general pattern observed in Xinjiang, and compared to northern Xinjiang, there are fewer RX1d and RX5d events with weaker intensity in the Tarim Basin, while the CDD events are the opposite [77]. Under RCP4.5 and RCP8.5 scenarios, Zhang concluded that the CDD in Central Asia is expected to increase slightly in the 21st century [78], and persistent drought in southern Xinjiang is also expected to intensify [79], aligning with the conclusions drawn from this research. It is evident that the extreme precipitation indices exhibit significant spatial heterogeneity. The escalation in the intensity of drought is anticipated to result in a corresponding rise in the process of desertification [80]. Therefore, in future endeavors related to ecological construction and protection, it is imperative to prioritize drought prevention and control measures in order to mitigate the risk of desertification expansion.
5.3. The Impact of Extreme Climate on the Ecological Quality of Vegetation
From the correlation coefficient of the spatial distribution, in comparison to the response patterns observed on the inter-annual scale, the intra-annual scale EQI influence upon extreme climate indices in the basin demonstrates a more geographically concentrated spatial distribution. The main reason is that the EQI’s inter-annual correlation with the extreme climate indices reflects the correlations of long-term sequence trends, while the intra-annual analysis of the EQI and the extreme indices eliminates some influencing factors with seasonal characteristics [81]. Additionally, vegetation is less distributed in the basin, and the gobi and desert areas are larger than that of the oasis. Moreover, the oases within the basin display a concentrated distribution pattern that is specific to the region. The regional concentration of the correlation coefficient is more pronounced at the intra-annual scale.
The extreme warm temperature indices TN90P, TX90P, and extremum indices TNn contribute positively to the growth of vegetation in the concentrated oasis area of the Tarim Basin, while they have an inhibitory impact on the desert vegetation outside the oasis area. Conversely, these indices have an inhibitory effect on desert vegetation outside the oasis region. The primary factor contributing to this difference is that precipitation is only one of the water sources required for oasis vegetation, whereas high temperatures provide sufficient heat for photosynthesis, which promotes the growth of vegetation [12]. The increasing temperature results in glaciers and snow melting, which also promotes improvements in the oasis vegetation’s ecological quality [82]. However, the decrease in glacier area and snowfall during the summer and autumn seasons poses a threat to ecological and agricultural security of downstream oases, increasing the risk of flood disasters [83]. The rise in temperature causes intensified drought stress, which causes the increased evaporation of soil humidity and severely impedes desert vegetation growth [84]. Therefore, the SU25 exerts a greater influence on desert vegetation. The cold indices TN10P and TX10P have an eminent inhibitory influence on oasis vegetation. The dominant cause of this phenomenon is the low temperature, which shortens the period of vegetation growth. Especially in April and October, the basin temperature is low, which results in an insufficient accumulated temperature for vegetation growth. This negatively impacts vegetation development. The DTR inhibits oasis vegetation growth and is associated with an increase in nighttime temperatures. The rise in nighttime temperatures will lead to crop respiration and organic matter decomposition [43]. Research has shown that a rise in the minimum day and night temperatures has a significant positive impact on shrubs and desert vegetation, reducing the hazard of vegetation damage by frost [43,85]. This is consistent with the positive effects of the TN10P, TX10P, and DTR on the desert vegetation observed in this study.
Extreme precipitation on an inter-annual scale is an important factor in improving the desert vegetation EQI. Except for a few oasis areas, the duration of CDD has a detrimental impact on vegetation in other regions, particularly on desert vegetation. The SDII, RX1d, and RX5d have promoting effects on oasis and desert vegetation, except in non-vegetated areas. They exhibit a significant positive correlation with vegetation in desert regions. In Xinjiang, about 50% of all of the precipitation falls under extreme precipitation. The increase in precipitation in Xinjiang is primarily driven by extreme precipitation [64], indicating that extreme precipitation contributes significantly to vegetation development and distribution in most areas. However, the increase in precipitation, along with a decline in extreme cold events and a rise in extreme warm events, will worsen the extreme climate activities, risking ecological and agricultural security [83]. The RX1d and RX5d indices, however, only exhibit a strong positive correlation with vegetation in the oasis region on the intra-annual scale. This is because the long-term growth of vegetation relies more heavily on the continuity and consistency of precipitation. For vegetation not used to accommodating to the drought environment, sudden rainfall can exert a prominent influence on vegetation growth and stability [41]. Additionally, research results have shown that, in the Inner Mongolia region, the long-term extreme precipitation indices of RX1d and RX5d are negatively correlated to desert vegetation [38]. This is because the soil in desert vegetation cannot retain water for extended periods, and the vegetation is immediately impacted by extreme precipitation. In large areas without vegetation in desert regions, extreme precipitation does not have the same effect as in other types of vegetation. This is the same as the results of this study. At the inter-annual scale, the impact of extreme precipitation on vegetation is integrated throughout the entire growing season, promoting long-term growth. Compared to temperature, precipitation is the primary climatic factor influencing inter-annual variations in vegetation [86]. Therefore, extreme precipitation significantly influences vegetation growth and distribution patterns in the Tarim Basin.
5.4. Effects of Extreme Climate on Different Vegetation Types
According to the factor analysis, the extreme precipitation factors RX1d and RX5d make a significant contribution to the overall Tarim Basin EQI. The EQI of forests, grasslands, desert vegetation, and agricultural vegetation are most impacted by the extreme precipitation indices. Although the shrub EQI is most affected by the SU25, the extreme precipitation factors of SDII, RX1d, and RX5d also make significant contributions to the shrub EQI. Overall, precipitation exerts a larger influence on vegetation than temperature, which corresponds to the discoveries of Chen and Yu [87,88]. However, single-factor extreme climate analysis is no longer sufficient for fully assessing the influence of extreme climate upon vegetation. Additional examination is required to comprehend the combined impacts of extreme climate on vegetation [13]. The results of the interacting-factor analysis indicate that the interplay between any two extreme climate factors exceeds the impact of a single factor. This means that the EQI spatial distribution is affected by the interaction of various factors that have an influence. We found that the combined effect of the TX10P ∩ TNn has the greatest impact on shrubs and grasslands. Most shrubs grow near riverbanks and are primarily Tamarix ramosissima. Their growth requires not only heavy rainfall but also depends on groundwater [89]. Especially in summer, the combined effect of the TX10P and TNn can reduce soil water evaporation in arid areas, maintain soil moisture, and increase the available water for vegetation transpiration. On the other hand, it can reduce vegetation transpiration during the day and increase the net photosynthetic rate of vegetation during high temperatures, thereby promoting vegetation growth. Within the forest, the Populus euphratica is the main tree species, primarily distributed within the Tarim River Basin. Its water requirements for growth mainly depend on the river and groundwater [90]. The combined effect of the TN90P and SU25 contributes the most to the forest EQI. Higher daytime temperatures can not only promote vegetation photosynthesis but also contribute to glacier and snow melting. The melting of these due to high temperatures can supplement river flow and provide water resources for vegetation [91,92]. Higher nighttime temperatures can alter and promote vegetation growth, primarily through lessening frost. It may also be related to the phenomenon of overcompensation. Studies have found that, under sufficient soil moisture and nutrient conditions, higher nighttime temperatures enhance leaf respiration. This leads to a faster consumption of leaf carbohydrates and stimulates compensatory photosynthesis the following day [93]. As a result, vegetation growth is promoted.
The contribution of the single factor TX90P to desert vegetation growth is low, but its interaction with RX5d, the precipitation factor, prominently promotes the desert vegetation growth. This suggests that the desert vegetation distribution is primarily affected by precipitation [94,95]. Conditions of precipitation provide the necessary moisture for the growth of vegetation in the desert. Higher daytime temperatures can promote photosynthesis and extend the growth period of vegetation [43,88]. For example, the vegetation index in autumn responds slightly more to temperature than to precipitation, and higher temperatures can delay the autumn growing season [96]. The growth of agricultural vegetation is more influenced by human factors, including irrigation and mulching. Therefore, extreme climate has a relatively small impact on agricultural vegetation. The interaction between the TN10P and TNn has the greatest impact on the growth of agricultural crops. This is achieved by reducing soil evaporation to maintain a balance between the available water and the vegetation. Additionally, the TN10P can also suppress vegetation respiration, thereby reducing the consumption of dry matter.
6. Conclusions
The Tarim Basin ecosystem is vulnerable to extreme climate change, and vegetation plays an important role in maintaining the regional ecosystem balance, retaining soil water, and reducing wind erosion. Studies on the effects of extreme climate on vegetation are helpful for formulating long-term vegetation adaptation strategies, maintaining ecological security, improving water resource utilization efficiency, and preventing desertification. Therefore, it is necessary to study the influence of extreme climate on vegetation in the Tarim Basin. This study utilized the Rclimdex model to calculate 12 extreme climate indices that are closely associated with vegetation, flooding disasters, and high and low temperatures in the Tarim Basin. The EQI was chosen as the vegetation ecological indicator. This study analyzed the dynamic changes in each extreme climate index and EQI, as well as the response of the EQI to each extreme climate factor. The main conclusions obtained were as follows:
- (1)
- From 2000 to 2022, the growing season EQI in the Tarim Basin shows a significant upward trend. The agricultural vegetation EQI has the fastest rate of increase, while the desert vegetation EQI has the slowest rate of increase. Therefore, future ecological restoration measures can consider focusing on desert vegetation to improve the overall vegetation spatial changes in the Tarim Basin.
- (2)
- During the period of 2000 to 2022, the extreme temperature indices in the Tarim Basin indicated an increase in the warm indices and a decrease in the cold indices. Additionally, the extreme precipitation intensity indices exhibited an upward trend, and the number of dry days also increased. The risk of high-temperature disasters, persistent droughts, and floods will increase in the Tarim Basin in the future, which should be paid attention to, and it is necessary to implement increased measures for preventing this in order to deal with climate disasters.
- (3)
- On an inter-annual scale, the EQI is mainly negatively correlated with most extreme temperature indices, while it is positively correlated with extreme cold temperature and extreme precipitation intensity indices. Extreme precipitation plays a dominant role in the spatial distribution of the EQI. On an intra-annual scale, the correlation between them varies significantly due to the differences in EQI values, and the impact of extreme climate on the EQI shows clear regional concentration. The EQI in the Tarim Basin is not only influenced by a single extreme climate factor but is the result of the combined effects of various extreme climate factors, especially with significant impacts on forests and shrubs. Strategies for adapting vegetation to extreme climates need to consider the compound influence of various extreme climate factors. According to the difference in the influence of extreme climate on different vegetation types, appropriate ecological protection measures can be carried out for different vegetation types.
Author Contributions
Conceptualization, Y.Z. and Y.L.; methodology, Y.Z. and G.S.; software, Y.Z.; validation, Y.L. and G.S.; formal analysis, Z.Z. and X.Z.; investigation, L.L.; resources, L.L. and Z.Z.; data curation, Y.Z. and X.Z.; writing—original draft preparation, Y.Z.; writing—review and editing, Y.L.; visualization, Y.L.; supervision, Y.L.; project administration, L.L.; funding acquisition, Y.L. All authors have read and agreed to the published version of the manuscript.
Funding
This research was supported by The Third Xinjiang Scientific Expedition (2021xjkk030401), Key scientific and technological research projects in the Xinjiang Production and Construction Corps (2023AB017-02), and the West Light Foundation for Young Scholars of the Chinese Academy of Sciences (2021-XBQNXZ-018).
Data Availability Statement
The data that support the findings of this study are available from the corresponding author on request.
Conflicts of Interest
The authors declare no conflicts of interest.
References
- Easterling, D.R.; Meehl, G.A.; Parmesan, C.; Changnon, S.A.; Karl, T.R.; Mearns, L.O. Climate extremes: Observations, modeling, and impacts. Science 2000, 289, 2068–2074. [Google Scholar] [CrossRef]
- Wang, X.; Jiang, D.; Lang, X. Future extreme climate changes linked to global warming intensity. Sci. Bull. 2017, 62, 1673–1680. [Google Scholar] [CrossRef]
- Grant, P.R. Evolution, climate change, and extreme events. Science 2017, 357, 451–452. [Google Scholar] [CrossRef]
- Fischer, E.; Sippel, S.; Knutti, R. Increasing probability of record-shattering climate extremes. Nat. Clim. Chang. 2021, 11, 689–695. [Google Scholar] [CrossRef]
- Cheong, W.; Timbal, B.; Golding, N.; Sirabaha, S.; Kwan, K.; Cinco, T.; Archevarahuprok, B.; Vo, V.; Gunawan, D.; Han, S. Observed and modelled temperature and precipitation extremes over Southeast Asia from 1972 to 2010. Int. J. Climatol. 2018, 38, 3013–3027. [Google Scholar] [CrossRef]
- Wu, D.; Zhao, X.; Liang, S.; Zhou, T.; Huang, K.; Tang, B.; Zhao, W. Time-lag effects of global vegetation responses to climate change. Glob. Chang. Biol. 2015, 21, 3520–3531. [Google Scholar] [CrossRef] [PubMed]
- Siegmund, J.F.; Wiedermann, M.; Donges, J.F.; Donner, R.V. Impact of temperature and precipitation extremes on the flowering dates of four German wildlife shrub species. Biogeosciences 2016, 13, 5541–5555. [Google Scholar] [CrossRef]
- Jha, S.; Das, J.; Goyal, M.K. Assessment of risk and resilience of terrestrial ecosystem productivity under the influence of extreme climatic conditions over India. Sci. Rep. 2019, 9, 18923. [Google Scholar] [CrossRef] [PubMed]
- Thonicke, K.; Bahn, M.; Lavorel, S.; Bardgett, R.D.; Erb, K.; Giamberini, M.; Reichstein, M.; Vollan, B.; Rammig, A. Advancing the understanding of adaptive capacity of social-ecological systems to absorb climate extremes. Earth’s Future 2020, 8, e2019EF001221. [Google Scholar] [CrossRef]
- Leake, I. Climate extremes drive negative vegetation growth. Nat. Rev. Earth Environ. 2023, 4, 68. [Google Scholar] [CrossRef]
- Alexander, L.V. [Climate Change 2013]: Physical Science Basis: Summary for Policymakers. 2013. Available online: https://policycommons.net/artifacts/1206803/climate-change-2013/1759913/ (accessed on 25 October 2023).
- Islam, A.R.M.T.; Islam, H.T.; Shahid, S.; Khatun, M.K.; Ali, M.M.; Rahman, M.S.; Ibrahim, S.M.; Almoajel, A.M. Spatiotemporal nexus between vegetation change and extreme climatic indices and their possible causes of change. J. Environ. Manag. 2021, 289, 112505. [Google Scholar] [CrossRef]
- Lu, Q.; Zhang, Y.; Song, B.; Shao, H.; Tian, X.; Liu, S. The responses of ecological indicators to compound extreme climate indices in Southwestern China. Ecol. Indic. 2023, 157, 111253. [Google Scholar] [CrossRef]
- An, H.; Song, X.; Wang, Z.; Geng, X.; Zhou, P.; Zhai, J.; Sun, W. Investigating the long-term response of plateau vegetation productivity to extreme climate: Insights from a case study in Qinghai Province, China. Int. J. Biometeorol. 2023, 68, 333–349. [Google Scholar] [CrossRef]
- Tan, Z.; Tao, H.; Jiang, J.; Zhang, Q. Influences of climate extremes on NDVI (normalized difference vegetation index) in the Poyang Lake Basin, China. Wetlands 2015, 35, 1033–1042. [Google Scholar] [CrossRef]
- Wang, S.; Liu, Q.; Huang, C. Vegetation change and its response to climate extremes in the arid region of Northwest China. Remote Sens. 2021, 13, 1230. [Google Scholar] [CrossRef]
- Almalki, R.; Khaki, M.; Saco, P.M.; Rodriguez, J.F. Monitoring and Mapping Vegetation Cover Changes in Arid and Semi-Arid Areas Using Remote Sensing Technology: A Review. Remote Sens. 2022, 14, 5143. [Google Scholar] [CrossRef]
- Zhang, G.; Xu, X.; Zhou, C.; Zhang, H.; Ouyang, H. Responses of grassland vegetation to climatic variations on different temporal scales in Hulun Buir Grassland in the past 30 years. J. Geogr. Sci. 2011, 21, 634–650. [Google Scholar] [CrossRef]
- Ma, M.; Wang, Q.; Liu, R.; Zhao, Y.; Zhang, D. Effects of climate change and human activities on vegetation coverage change in northern China considering extreme climate and time-lag and-accumulation effects. Sci. Total Environ. 2023, 860, 160527. [Google Scholar] [CrossRef] [PubMed]
- Wang, Q.; Yao, Y.; Zhao, L.; Yang, C.-H.; Zhao, Y.-C.; Zhang, Q.-P. Enhancing resilience against geological hazards and soil erosion through sustainable vegetation management: A case study in Shaanxi Province. J. Clean. Prod. 2023, 423, 138687. [Google Scholar] [CrossRef]
- Liu, Y.; Ding, Z.; Chen, Y.; Yan, F.; Yu, P.; Man, W.; Liu, M.; Li, H.; Tang, X. Restored vegetation is more resistant to extreme drought events than natural vegetation in Southwest China. Sci. Total Environ. 2023, 866, 161250. [Google Scholar] [CrossRef]
- Xue, H.; Chen, Y.; Dong, G.; Li, J. Quantitative analysis of spatiotemporal changes and driving forces of vegetation net primary productivity (NPP) in the Qimeng region of Inner Mongolia. Ecol. Indic. 2023, 154, 110610. [Google Scholar] [CrossRef]
- Qian, S.; Yan, H.; Wu, M.; Cao, Y.; Xu, L.; Cheng, L. Dynamic monitoring and evaluation model for spatio-temporal change of comprehensive ecological quality of vegetation. Acta Ecol. Sin. 2020, 40, 6573–6583. [Google Scholar]
- QX/T 494-2019; Grade of Monitoring and Evaluating for Terrestrial Vegetation Meteorology Andecological Quality. China Meteorological Administration: Beijing, China; China Meteorological Press: Beijing, China, 2019. (In Chinese)
- Cui, L.; Chen, Y.; Yuan, Y.; Luo, Y.; Huang, S.; Li, G. Comprehensive evaluation system for vegetation ecological quality: A case study of Sichuan ecological protection redline areas. Front. Plant Sci. 2023, 14, 1178485. [Google Scholar] [CrossRef] [PubMed]
- Lingling, X.; Shuan, Q.; Xiulan, Z.; Hao, Y. Spatio-Temporal Variation of Vegetation Ecological Quality and Its Response to Climate Change in Rocky Desertification Areas in Southwest China during 2000–2020. J. Resour. Ecol. 2022, 13, 27–33. [Google Scholar] [CrossRef]
- Mo, J.; Chen, Y.; Mo, W.; Zhang, Y. Realization and Prediction of Ecological Restoration Potential of Vegetation in Karst Areas. Sustainability 2022, 14, 12525. [Google Scholar] [CrossRef]
- Fang, H.; Zhang, Y.; He, Y.; Li, Z.; Fan, G.; Xu, D.; Zhang, C.; He, Z. Spatio-temporal variations of vegetation ecological qualityin Zhejiang Province and their driving factors. Remote Sens. Nat. Resour. 2023, 35, 245–254. [Google Scholar]
- Cao, Y.; Sun, Y.; Chen, Z.; Yan, H.; Qian, S. Dynamic changes of vegetation ecological quality in the Yellow River Basin and its response to extreme climate during 2000–2020. Acta Ecol. Sin. 2022, 42, 4524–4535. [Google Scholar]
- Zhang, Y.; Li, Z.; Guan, D.; Li, Z. Changes of vegetation ecological quality in the Chengdu-Chongqing economic circle from 2000 to 2020 and its response to extreme climatic factor. China Environ. Sci. 2023, 43, 4876–4885. [Google Scholar]
- Fang, H.; Yan, P.; Shi, J.; Kang, J.; Liu, H.; Chen, D.; Luo, J.; Xu, D. Temporal and spatial variation of vegetation ecological quality and its driving mechanism in Aksu prefecture. Arid Zone Res. 2022, 39, 1907–1916. [Google Scholar]
- Wu, L.; Ma, X.; Dou, X.; Zhu, J.; Zhao, C. Impacts of climate change on vegetation phenology and net primary productivity in arid Central Asia. Sci. Total Environ. 2021, 796, 149055. [Google Scholar] [CrossRef]
- Measho, S.; Chen, B.; Trisurat, Y.; Pellikka, P.; Guo, L.; Arunyawat, S.; Tuankrua, V.; Ogbazghi, W.; Yemane, T. Spatio-temporal analysis of vegetation dynamics as a response to climate variability and drought patterns in the semiarid region, Eritrea. Remote Sens. 2019, 11, 724. [Google Scholar] [CrossRef]
- Vicente-Serrano, S.M.; Azorin-Molina, C.; Peña-Gallardo, M.; Tomas-Burguera, M.; Domínguez-Castro, F.; Martín-Hernández, N.; Beguería, S.; El Kenawy, A.; Noguera, I.; García, M. A high-resolution spatial assessment of the impacts of drought variability on vegetation activity in Spain from 1981 to 2015. Nat. Hazards Earth Syst. Sci. 2019, 19, 1189–1213. [Google Scholar] [CrossRef]
- Jiang, H.; Xu, X.; Guan, M.; Wang, L.; Huang, Y.; Jiang, Y. Determining the contributions of climate change and human activities to vegetation dynamics in agro-pastural transitional zone of northern China from 2000 to 2015. Sci. Total Environ. 2020, 718, 134871. [Google Scholar] [CrossRef]
- Ndehedehe, C.E.; Agutu, N.O.; Ferreira, V.G.; Getirana, A. Evolutionary drought patterns over the Sahel and their teleconnections with low frequency climate oscillations. Atmos. Res. 2020, 233, 104700. [Google Scholar] [CrossRef]
- He, Y.; Yan, W.; Cai, Y.; Deng, F.; Qu, X.; Cui, X. How does the Net primary productivity respond to the extreme climate under elevation constraints in mountainous areas of Yunnan, China? Ecol. Indic. 2022, 138, 108817. [Google Scholar] [CrossRef]
- Na, L.; Na, R.; Zhang, J.; Tong, S.; Shan, Y.; Ying, H.; Li, X.; Bao, Y. Vegetation dynamics and diverse responses to extreme climate events in different vegetation types of inner mongolia. Atmosphere 2018, 9, 394. [Google Scholar] [CrossRef]
- Cheng, Q.; Zhong, F.; Wang, P. Potential linkages of extreme climate events with vegetation and large-scale circulation indices in an endorheic river basin in northwest China. Atmos. Res. 2021, 247, 105256. [Google Scholar] [CrossRef]
- Chen, K.; Ge, G.; Bao, G.; Bai, L.; Tong, S.; Bao, Y.; Chao, L. Impact of extreme climate on the NDVI of different steppe areas in Inner Mongolia, China. Remote Sens. 2022, 14, 1530. [Google Scholar] [CrossRef]
- Li, C.; Wang, J.; Hu, R.; Yin, S.; Bao, Y.; Ayal, D.Y. Relationship between vegetation change and extreme climate indices on the Inner Mongolia Plateau, China, from 1982 to 2013. Ecol. Indic. 2018, 89, 101–109. [Google Scholar] [CrossRef]
- Liu, Y.; Liu, S.; Sun, Y.; Li, M.; An, Y.; Shi, F. Spatial differentiation of the NPP and NDVI and its influencing factors vary with grassland type on the Qinghai-Tibet Plateau. Environ. Monit. Assess. 2021, 193, 48. [Google Scholar] [CrossRef]
- Yan, W.; He, Y.; Cai, Y.; Qu, X.; Cui, X. Relationship between extreme climate indices and spatiotemporal changes of vegetation on Yunnan Plateau from 1982 to 2019. Glob. Ecol. Conserv. 2021, 31, e01813. [Google Scholar] [CrossRef]
- Liu, F.; Zhang, H.; Qin, Y.; Dong, J.; Xu, E.; Yang, Y.; Zhang, G.; Xiao, X. Semi-natural areas of Tarim Basin in northwest China: Linkage to desertification. Sci. Total Environ. 2016, 573, 178–188. [Google Scholar] [CrossRef] [PubMed]
- Zhou, Y.; Gao, X.; Lei, J. Characteristics of Dust Weather in the Tarim Basin from 1989 to 2021 and Its Impact on the Atmospheric Environment. Remote Sens. 2023, 15, 1804. [Google Scholar] [CrossRef]
- Xu, Y.; Yang, J.; Chen, Y. NDVI-based vegetation responses to climate change in an arid area of China. Theor. Appl. Climatol. 2016, 126, 213–222. [Google Scholar] [CrossRef]
- Wang, Y.; Liu, D.; Liang, E.; Ni, J. Structural Characteristics of Endorheic Rivers in the Tarim Basin. Remote Sens. 2022, 14, 4502. [Google Scholar] [CrossRef]
- Zhang, Q.; Sun, C.; Chen, Y.; Chen, W.; Xiang, Y.; Li, J.; Liu, Y. Recent oasis dynamics and ecological security in the Tarim River Basin, Central Asia. Sustainability 2022, 14, 3372. [Google Scholar] [CrossRef]
- Hao, X.; Li, W.; Deng, H. The oasis effect and summer temperature rise in arid regions-case study in Tarim Basin. Sci. Rep. 2016, 6, 35418. [Google Scholar] [CrossRef]
- Zhou, C.; Gong, L.; Wu, X.; Luo, Y. Nutrient resorption and its influencing factors of typical desert plants in different habitats on the northern margin of the Tarim Basin, China. J. Arid Land 2023, 15, 858–870. [Google Scholar] [CrossRef]
- Liu, Y.; Xue, J.; Gui, D.; Lei, J.; Sun, H.; Lv, G.; Zhang, Z. Agricultural oasis expansion and its impact on oasis landscape patterns in the southern margin of Tarim basin, Northwest China. Sustainability 2018, 10, 1957. [Google Scholar] [CrossRef]
- Liu, Q.; Zhang, T.; Li, Y.; Li, Y.; Bu, C.; Zhang, Q. Comparative analysis of fractional vegetation cover estimation based on multi-sensor data in a semi-arid sandy area. Chin. Geogr. Sci. 2019, 29, 166–180. [Google Scholar] [CrossRef]
- He, Z.; Yue, T.; Chen, Y.; Mu, W.; Xi, M.; Qin, F. Analysis of Spatial and Temporal Changes in Vegetation Cover and Driving Forces in the Yan River Basin, Loess Plateau. Remote Sens. 2023, 15, 4240. [Google Scholar] [CrossRef]
- Liu, C.; Zhang, X.; Wang, T.; Chen, G.; Zhu, K.; Wang, Q.; Wang, J. Detection of vegetation coverage changes in the Yellow River Basin from 2003 to 2020. Ecol. Indic. 2022, 138, 108818. [Google Scholar] [CrossRef]
- Shi, F.; Liu, M.; Qiu, J.; Zhang, Y.; Su, H.; Mao, X.; Li, X.; Fan, J.; Chen, J.; Lv, Y. Assessing land cover and ecological quality changes in the Forest-Steppe Ecotone of the Greater Khingan Mountains, Northeast China, from Landsat and MODIS observations from 2000 to 2018. Remote Sens. 2022, 14, 725. [Google Scholar] [CrossRef]
- Potter, C.S.; Randerson, J.T.; Field, C.B.; Matson, P.A.; Vitousek, P.M.; Mooney, H.A.; Klooster, S.A. Terrestrial ecosystem production: A process model based on global satellite and surface data. Glob. Biogeochem. Cycles 1993, 7, 811–841. [Google Scholar] [CrossRef]
- Yang, H.; Zhong, X.; Deng, S.; Xu, H. Assessment of the impact of LUCC on NPP and its influencing factors in the Yangtze River basin, China. Catena 2021, 206, 105542. [Google Scholar] [CrossRef]
- Yang, H.; Hu, D.; Xu, H.; Zhong, X. Assessing the spatiotemporal variation of NPP and its response to driving factors in Anhui province, China. Environ. Sci. Pollut. Res. 2020, 27, 14915–14932. [Google Scholar] [CrossRef] [PubMed]
- Chen, Y.; Duo, L.; Zhao, D.; Zeng, Y.; Guo, X. The response of ecosystem vulnerability to climate change and human activities in the Poyang lake city group, China. Environ. Res. 2023, 233, 116473. [Google Scholar] [CrossRef]
- Guo, Y.; Zhang, X.; Wang, Q.; Chen, H.; Du, X.; Ma, Y. Temporal changes in vegetation around a shale gas development area in a subtropical karst region in southwestern China. Sci. Total Environ. 2020, 701, 134769. [Google Scholar] [CrossRef] [PubMed]
- Xue, J.; Wang, Y.; Teng, H.; Wang, N.; Li, D.; Peng, J.; Biswas, A.; Shi, Z. Dynamics of vegetation greenness and its response to climate change in Xinjiang over the past two decades. Remote Sens. 2021, 13, 4063. [Google Scholar] [CrossRef]
- Chang, J.; Liu, Q.; Wang, S.; Huang, C. Vegetation Dynamics and Their Influencing Factors in China from 1998 to 2019. Remote Sens. 2022, 14, 3390. [Google Scholar] [CrossRef]
- Cao, S.; He, Y.; Zhang, L.; Chen, Y.; Yang, W.; Yao, S.; Sun, Q. Spatiotemporal characteristics of drought and its impact on vegetation in the vegetation region of Northwest China. Ecol. Indic. 2021, 133, 108420. [Google Scholar] [CrossRef]
- Yao, J.; Chen, Y.; Zhao, Y.; Mao, W.; Xu, X.; Liu, Y.; Yang, Q. Response of vegetation NDVI to climatic extremes in the arid region of Central Asia: A case study in Xinjiang, China. Theor. Appl. Climatol. 2018, 131, 1503–1515. [Google Scholar] [CrossRef]
- Jiang, N.; Zhang, Q.; Zhang, S.; Zhao, X.; Cheng, H. Spatial and temporal evolutions of vegetation coverage in the Tarim River Basin and their responses to phenology. Catena 2022, 217, 106489. [Google Scholar] [CrossRef]
- He, P.; Sun, Z.; Han, Z.; Dong, Y.; Liu, H.; Meng, X.; Ma, J. Dynamic characteristics and driving factors of vegetation greenness under changing environments in Xinjiang, China. Environ. Sci. Pollut. Res. 2021, 28, 42516–42532. [Google Scholar] [CrossRef] [PubMed]
- Guan, J.; Yao, J.; Li, M.; Zheng, J. Assessing the spatiotemporal evolution of anthropogenic impacts on remotely sensed vegetation dynamics in Xinjiang, China. Remote Sens. 2021, 13, 4651. [Google Scholar] [CrossRef]
- Wang, Y.-R.; Samset, B.H.; Stordal, F.; Bryn, A.; Hessen, D.O. Past and future trends of diurnal temperature range and their correlation with vegetation assessed by MODIS and CMIP6. Sci. Total Environ. 2023, 904, 166727. [Google Scholar] [CrossRef]
- Zhang, K.; Dai, S.; Dong, X. Dynamic variability in daily temperature extremes and their relationships with large-scale atmospheric circulation during 1960–2015 in Xinjiang, China. Chin. Geogr. Sci. 2020, 30, 233–248. [Google Scholar] [CrossRef]
- Zhang, L.; Liu, Y.; Jin, M.; Liang, X. Spatiotemporal variability in extreme temperature events in an arid-semiarid region of China and their teleconnections with large-scale atmospheric circulation. J. Earth Sci. 2023, 34, 1201–1217. [Google Scholar] [CrossRef]
- Dong, T.; Liu, J.; Liu, D.; He, P.; Li, Z.; Shi, M.; Xu, J. Spatiotemporal variability characteristics of extreme climate events in Xinjiang during 1960–2019. Environ. Sci. Pollut. Res. 2023, 30, 57316–57330. [Google Scholar] [CrossRef]
- Zheng, J.; Fan, J.; Zhang, F. Spatiotemporal trends of temperature and precipitation extremes across contrasting climatic zones of China during 1956–2015. Theor. Appl. Climatol. 2019, 138, 1877–1897. [Google Scholar] [CrossRef]
- Deng, H.; Chen, Y.; Shi, X.; Li, W.; Wang, H.; Zhang, S.; Fang, G. Dynamics of temperature and precipitation extremes and their spatial variation in the arid region of northwest China. Atmos. Res. 2014, 138, 346–355. [Google Scholar] [CrossRef]
- Abbas, A.; Zhang, T.; He, Q.; Bo, L.; Jin, L.; Zhang, J.; Salam, A. Variations in different types and levels of daily precipitation in the Tarim Basin, Northwest China. Theor. Appl. Climatol. 2022, 149, 1509–1520. [Google Scholar] [CrossRef]
- Wang, X.; Liu, Q.; Liu, S.; Wei, J.; Jiang, Z. Heterogeneity of glacial lake expansion and its contrasting signals with climate change in Tarim Basin, Central Asia. Environ. Earth Sci. 2016, 75, 1–11. [Google Scholar] [CrossRef]
- Hu, W.; Yao, J.; He, Q.; Chen, J. Changes in precipitation amounts and extremes across Xinjiang (northwest China) and their connection to climate indices. PeerJ 2021, 9, e10792. [Google Scholar] [CrossRef] [PubMed]
- Aihaiti, A.; Wang, Y.; Ali, M.; Zhu, L.; Liu, J.; Zhang, H.; Gao, J.; Wen, C.; Song, M. Probability distribution characteristics of summer extreme precipitation in Xinjiang, China during 1970–2021. Theor. Appl. Climatol. 2023, 151, 753–766. [Google Scholar] [CrossRef]
- Zhang, Q.; Li, J.; Singh, V.P.; Bai, Y. SPI-based evaluation of drought events in Xinjiang, China. Nat. Hazards 2012, 64, 481–492. [Google Scholar] [CrossRef]
- Peng, D.; Zhou, T.; Zhang, L.; Zhang, W.; Chen, X. Observationally constrained projection of the reduced intensification of extreme climate events in Central Asia from 0.5 °C less global warming. Clim. Dyn. 2020, 54, 543–560. [Google Scholar] [CrossRef]
- Wonkka, C.L.; Twidwell, D.; Franz, T.E.; Taylor, C.A., Jr.; Rogers, W.E. Persistence of a severe drought increases desertification but not woody dieback in semiarid savanna. Rangel. Ecol. Manag. 2016, 69, 491–498. [Google Scholar] [CrossRef]
- Xu, X.; Jiang, H.; Guan, M.; Wang, L.; Huang, Y.; Jiang, Y.; Wang, A. Vegetation responses to extreme climatic indices in coastal China from 1986 to 2015. Sci. Total Environ. 2020, 744, 140784. [Google Scholar] [CrossRef]
- Liu, Y.; Li, L.; Chen, X.; Zhang, R.; Yang, J. Temporal-spatial variations and influencing factors of vegetation cover in Xinjiang from 1982 to 2013 based on GIMMS-NDVI3g. Glob. Planet. Chang. 2018, 169, 145–155. [Google Scholar] [CrossRef]
- Guan, J.; Yao, J.; Li, M.; Li, D.; Zheng, J. Historical changes and projected trends of extreme climate events in Xinjiang, China. Clim. Dyn. 2022, 59, 1753–1774. [Google Scholar] [CrossRef]
- Luo, M.; Sa, C.; Meng, F.; Duan, Y.; Liu, T.; Bao, Y. Assessing extreme climatic changes on a monthly scale and their implications for vegetation in Central Asia. J. Clean. Prod. 2020, 271, 122396. [Google Scholar] [CrossRef]
- Du, Z.; Zhao, J.; Pan, H.; Wu, Z.; Zhang, H. Responses of vegetation activity to the daytime and nighttime warming in Northwest China. Environ. Monit. Assess. 2019, 191, 721. [Google Scholar] [CrossRef] [PubMed]
- Tang, Z.; Ma, J.; Peng, H.; Wang, S.; Wei, J. Spatiotemporal changes of vegetation and their responses to temperature and precipitation in upper Shiyang river basin. Adv. Space Res. 2017, 60, 969–979. [Google Scholar] [CrossRef]
- Chen, L.; Halike, A.; Yao, K.; Wei, Q. Spatiotemporal variation in vegetation net primary productivity and its relationship with meteorological factors in the Tarim River Basin of China from 2001 to 2020 based on the Google Earth Engine. J. Arid Land 2022, 14, 1377–1394. [Google Scholar] [CrossRef]
- Yu, H.; Bian, Z.; Mu, S.; Yuan, J.; Chen, F. Effects of climate change on land cover change and vegetation dynamics in Xinjiang, China. Int. J. Environ. Res. Public Health 2020, 17, 4865. [Google Scholar] [CrossRef] [PubMed]
- Imin, B.; Dai, Y.; Shi, Q.; Guo, Y.; Li, H.; Nijat, M. Responses of two dominant desert plant species to the changes in groundwater depth in hinterland natural oasis, Tarim Basin. Ecol. Evol. 2021, 11, 9460–9471. [Google Scholar] [CrossRef] [PubMed]
- Zhou, H.; Chen, Y.; Zhu, C.; Li, Z.; Fang, G.; Li, Y.; Fu, A. Climate change may accelerate the decline of desert riparian forest in the lower Tarim River, Northwestern China: Evidence from tree-rings of Populus euphratica. Ecol. Indic. 2020, 111, 105997. [Google Scholar] [CrossRef]
- Duan, Y.; Liu, T.; Meng, F.; Yuan, Y.; Luo, M.; Huang, Y.; Xing, W.; Nzabarinda, V.; De Maeyer, P. Accurate simulation of ice and snow runoff for the mountainous terrain of the kunlun mountains, China. Remote Sens. 2020, 12, 179. [Google Scholar] [CrossRef]
- Guan, Q.; Yang, L.; Guan, W.; Wang, F.; Liu, Z.; Xu, C. Assessing vegetation response to climatic variations and human activities: Spatiotemporal NDVI variations in the Hexi Corridor and surrounding areas from 2000 to 2010. Theor. Appl. Climatol. 2019, 135, 1179–1193. [Google Scholar] [CrossRef]
- Shen, X.; Liu, B.; Jiang, M.; Wang, Y.; Wang, L.; Zhang, J.; Lu, X. Spatiotemporal change of marsh vegetation and its response to climate change in China from 2000 to 2019. J. Geophys. Res. Biogeosci. 2021, 126, e2020JG006154. [Google Scholar] [CrossRef]
- Li, X.; Song, Z.; Hu, Y.; Qiao, J.; Chen, Y.; Wang, S.; Yue, P.; Chen, M.; Ke, Y.; Xu, C. Drought intensity and post-drought precipitation determine vegetation recovery in a desert steppe in Inner Mongolia, China. Sci. Total Environ. 2024, 906, 167449. [Google Scholar] [CrossRef] [PubMed]
- Mu, X.; Zheng, X.; Huang, G.; Tang, L.; Li, Y. Responses of Ephemeral Plants to Precipitation Changes and Their Effects on Community in Central Asia Cold Desert. Plants 2023, 12, 2841. [Google Scholar] [CrossRef] [PubMed]
- Sun, W.; Song, X.; Mu, X.; Gao, P.; Wang, F.; Zhao, G. Spatiotemporal vegetation cover variations associated with climate change and ecological restoration in the Loess Plateau. Agric. For. Meteorol. 2015, 209, 87–99. [Google Scholar] [CrossRef]

Disclaimer/Publisher’s Note: The statements, opinions and data contained in all publications are solely those of the individual author(s) and contributor(s) and not of MDPI and/or the editor(s). MDPI and/or the editor(s) disclaim responsibility for any injury to people or property resulting from any ideas, methods, instructions or products referred to in the content. |
© 2024 by the authors. Licensee MDPI, Basel, Switzerland. This article is an open access article distributed under the terms and conditions of the Creative Commons Attribution (CC BY) license (https://creativecommons.org/licenses/by/4.0/).