Abstract
Adaptations to climate change rely on understanding the dynamics of plant biomass stocks on the planet. The high levels of deforestation in Cerrado have transformed this biome into the second-largest Brazilian source of carbon emissions. The objective of this study was to develop a method to accurately estimate aboveground and total biomass values among shrublands, savannas, and forests located in the Cerrado biome using an allometric equation adjusted from canopy height obtained through optical and laser sensors. The results show similarity between the estimates employed by our method and the data found in the literature review for different phytophysiognomies in the Cerrado biome. Shrubland formations showed higher biomass estimation uncertainties due to the discontinuity of isolated trees and the lower canopy height when compared to more clustered tree canopies in savannas and taller canopies in forests. Aboveground biomass estimates are related to expansion factors, and specific maps were developed for each compartment by root, litter, and necromass. The sum of these compartments is presented in the aboveground and below forest biomass map. This study presents, for the first time, the mapping of total biomass in 10 m pixels of all regions of the Cerrado biome.
1. Introduction
Savannas cover one-fifth of the global land surface, contributing one-third of total terrestrial net primary productivity, and are responsible for more than half of global carbon emissions caused by wildfires [1]. The savannas of South America, found in the Cerrado domain, present notable carbon sinks and remain threatened by expansion of agricultural activities and by changing fire regimes [2]. Although the Cerrado biome covers around 23% of the Brazilian territory, only 2.5% of this area is protected [3]. The native Cerrado vegetation is severely affected by degradation and deforestation and has consequently been fragmented since the 1970s [4]. The conversion of land use to agriculture in this biome is occurring significantly in vast native areas with great potential for terrestrial and soil carbon storage [5]. Despite the rich and complex biodiversity, there are still few studies to estimate the above- and below-ground biomass of Cerrado vegetation [6]. High rates of deforestation and changes in land use place the biome as the second largest Brazilian source of greenhouse gas (GHG) emissions [7]. Due to the heterogeneity of vegetation structure in Cerrado, the stocks and distribution of aerial biomass are highly variable, making mapping and monitoring efforts non-trivial [8].
Obtaining accurate estimates of the carbon stock in the different phyto-physiognomies that compose Cerrado is extremely important to support sustainable forest management plans [9]. Modeling growth and biomass production after the implementation of management systems in Cerrado areas is decisive for understanding vegetation succession process, especially regarding changes in biomass accumulation over time [10,11]. Data from multisensory remote sensing platforms combined with data from forest inventories, especially tree height, are efficient technological resources to quantify aerial biomass on a large scale [12]. The use of laser technology combined with remote sensing allows rapid mapping of biomass structure and density, relating forest fire regimes and vegetation dynamics, which is considered beneficial to achieve carbon emissions mitigation strategies in savannah ecosystems [8,13,14].
The predominant vegetation type in the Cerrado biome is Cerrado sensu stricto, which is identified as a savanna forest with 10% to 60% canopy cover and average tree height of 3 to 7 m [15]. In the central regions of Brazil, the distribution of plant biomass in different phytophysiognomies varies according to the structure of the formations, from shrubland, savannas, and dense forests [16]. Research carried out in the field to quantify plant biomass in transition zones between biomes is rare but essential for understanding carbon stocks in the different types of vegetation [17]. According to [18], surface litter biomass in tropical forests is affected by many variables, such as climate, edaphic and vegetation structure, with a rising litter production from grasslands to forests. This fact can further increase the variability of the relationship between the proportions of biomass parts, making it difficult to standardize the dynamics of biomass between herbaceous, shrub, and forest vegetation structures of different phytophysiognomies. The resilience of different types of tropical dry forests, commonly called Matas Secas (dry woods), within the Cerrado biome and in transition zones with the Caatinga is important for the maintenance and provision of ecosystem services [19]. Therefore, it is crucial to understand the ecological interactions between climate and biomass strata in the different phytophysiognomies of the Cerrado for the development of environmental management strategies in the context of climate change.
Thus, the present study assumes the existence of a linear relationship between tree height and forest biomass stocks in the different phytophysiognomies of the Cerrado biome and has as its main objectives to perform a systematic review of published Cerrado biomass reference values, applying this information to evaluate methodologies for the estimation of total forest biomass. Analyses are performed using two independent sampling data sets, based on past measurements and a recent systematic review of aboveground biomass with sample plot values. The estimate of aboveground biomass is tested using an allometric equation developed from canopy height obtained via a digital model and compared with the sample plots. The other biomass components (roots, litter, and necromass) are estimated to add up to the total biomass using aboveground expansion factors (BEF) obtained from different sources.
2. Materials and Methods
2.1. Methodology Flowchart and Study Area
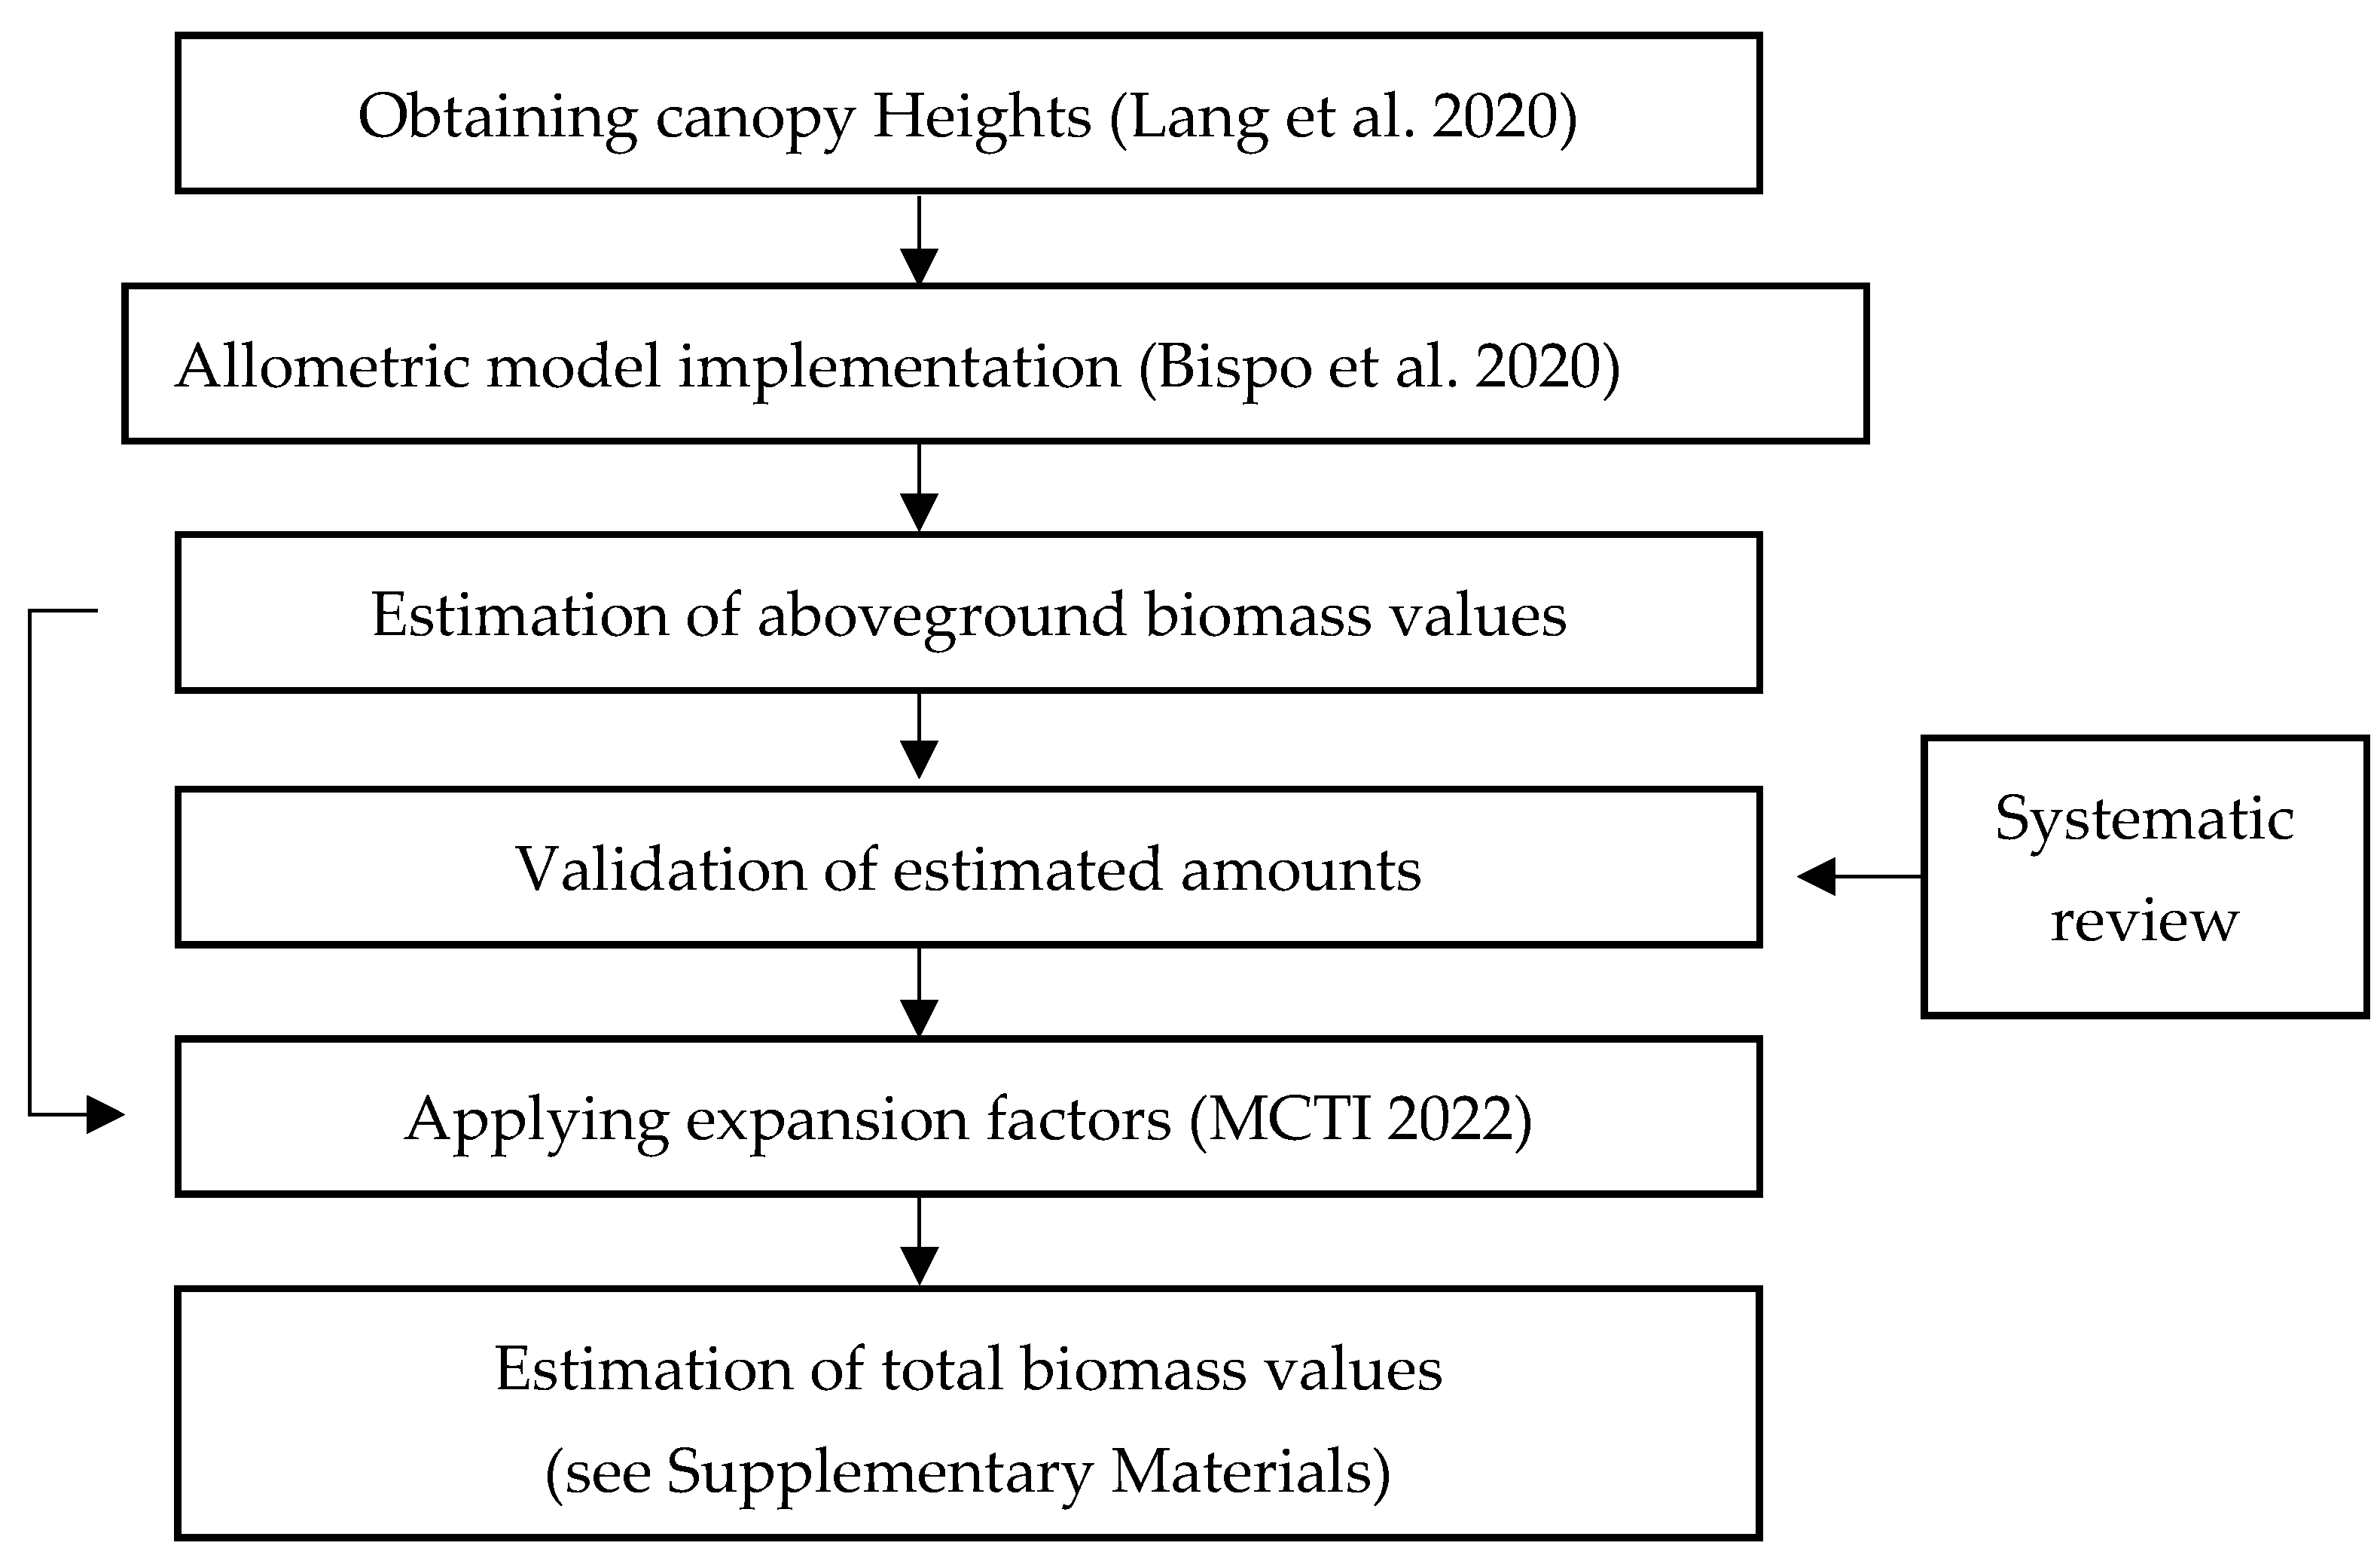
This study’s methodology involved a systematic review of biomass values reported for the Cerrado biome, as well as the comparison of variance in indirect estimates of aboveground biomass using linear allometric equation with canopy height through a digital model; Figure 1. For the estimation of aboveground biomass, the allometric equation proposed in [12] was implemented on the Google Earth Engine platform as a function of canopy height, which was obtained from the results provided in [20]. The pixel values of canopy heights were converted into aboveground biomass values, including the necromass in standing trees. Canopy height values defined the vertical strata for classifications of shrubland, savanna, and forest formations. To validate the estimated biomass values, two sample sets were tested: the first provided in [13] named Forest Inventory, and the second obtained by composing the mean values of each inventoried fragment found in the systematic review papers from the study area named Scientific Articles; Figure 2. The sample sets were evaluated through the analysis of variance using the F-test at 5% probability to identify whether there were significant differences between the sample sets and the estimated values. Proportions of biomass stock compartments relative to total aboveground biomass were estimated based on biomass expansion factors obtained in the 4th Communication Report of the National Greenhouse Gas Inventory [7]. A biomass expansion factor is a multiplication factor which permits the estimation of one biomass component from another biomass component. There are many different applications of biomass expansion factors; some common usages include estimation of aboveground biomass from wood volume [21] and estimation of total aboveground biomass (including bole, branches, and foliage) from bole biomass [22,23,24]. When belowground biomass is considered, a root-to-shoot ratio is used, dividing the root biomass by the corresponding aboveground biomass [24]. In this study, the expansion factor values obtained in [7] were grouped for shrubland, savanna, and forest formation structures by the classification of canopy heights. The total biomass for the entire Cerrado biome in Brazil was estimated by summing the compartments of aboveground biomass (obtained from the canopy heights and the regression model), necromass, litter, and belowground biomass of roots (obtained from the expansion factors), allowing for the derivation of relationships between above- and belowground parts and between living and dead components.

Figure 1.
Flowchart of the methodology used to estimate forest biomass in the Cerrado biome studied, cited references are [7,12,20].
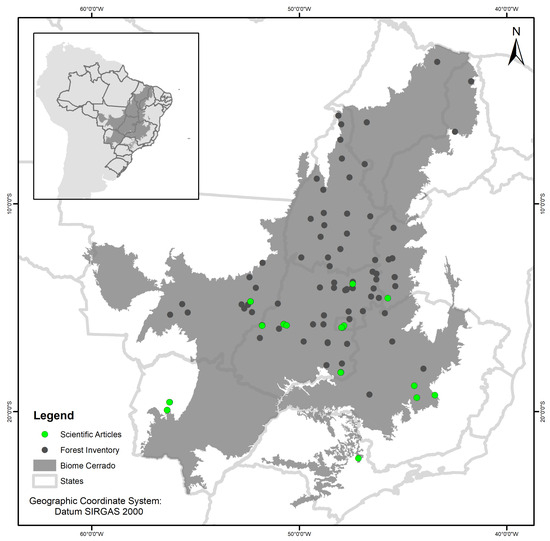
Figure 2.
Study area with two sample sets on aboveground biomass in the Cerrado.
2.2. Biomass Samples from Published Studies
The methodology used in this research was based on the systematic review recommendations proposed in [25]. The systematic survey utilized document resources in scientific journals that reported aboveground forest biomass values in the Cerrado, aiming to identify methodologies related to different phytophysiognomies within the biome. The systematic search for scientific article reviews was conducted in June 2023, using the CAPES Journals database platform with the “Advanced Search” feature, entering the terms “forest AND aboveground AND biomass AND cerrado”. All scientific articles with biomass estimation values from 1998 to 2023 were analyzed, including all publications available in the collections up to the date of June 2023. It is worth noting that the scope of forest biomass research in the Cerrado is broad, with a vast dataset available, and a systematic analysis is recommended to summarize the values found, possibly revealing relevant yet underexplored relationships [26].
The inclusion and exclusion criteria for the results of the articles were analyzed based on the potential use of presented biomass values, involving both live and dead aboveground biomass, with either field sampling or direct biomass estimation in the Cerrado biome. Only estimates from natural formations were considered, excluding plantations or exotic species. When available, the following information was compiled from the articles: location, plot area, sampling date, phytophysiognomy type, measurement method, tree diameter and height values, number of individuals per hectare, employed hypsometric, volumetric and allometric equations, wood basic density of dominant species, basal area, mean and standard deviation values of biomass (aboveground, roots, litter, and total).
The values of aboveground forest biomass were assessed according to the proportions of live and dead forest biomass, both above and below the ground. A total of 67 documents were reviewed based on the search criteria used, and 16 were selected for the analyses of the present study; see Figure 2 [2,4,5,6,8,9,11,12,13,14,16,17,18,19,27,28].
2.3. Canopy Height Values for the Cerrado Biome
The model proposed in [20] is the first global canopy height model estimating height values for the year 2020 as the reference date. This study employed scanning techniques with orbital laser data from the GEDI program to obtain surface models fused on terrain models and vegetation classifications from the Sentinel-2 imaging program. It developed a probabilistic model for estimation of the height of tree top canopies, including associated errors for estimation of canopy height values. The data are available in 10 m spatial resolution pixels in an open-source remote sensing program. These data can be accessed by anyone anywhere with internet access. Thus, it serves as a tool to support biomass and carbon monitoring for all types of forests, and it was used in this study to support biomass estimation.
2.4. Characterization of the Different Cerrado Phytophysiognomies
The Brazilian Cerrado occurs in altitudes ranging from 300 to 1600 m above sea level, with annual rainfall between 600 and 2000 mm and well-defined dry and wet seasons. It includes forest formations from Riparian and Gallery Forests, Dry Forest, Evergreen Forest, Semi-Deciduous Forest, Deciduous Forest to Cerradão. Meanwhile, savanna vegetation formations are categorized into Dense Cerrado, Typical Cerrado and Sparse Cerrado. The shrub and arboreal structures have median strata of approximately 2 m and are referred to as Campos Sujos [15]. The classification of phytophysiognomies in the many studies assessed employs distinct definitions, ranging from regional approaches with definitions of open to closed forest structures and canopy cover to global approaches resembling physiognomic–ecological definitions such as those of dry and wet seasonal forests in the altitude strata as used in Brazil by the authors of [29]. These two classifications are important because canopy coverage is related to tree height and ecological definitions are related to the proportions of biomass parts between phytophysiognomies.
The term “forest” adopted in Brazil considers vegetative cover with an area greater than 0.5 ha, trees of height exceeding 5 m, and canopy cover greater than 10%, or trees capable of reaching these parameters in situ. In the present study, height strata are determined according to the classification in [15], where trees with average canopy height of 1 to 3 m are designated as “campo”; savannas are stratified from 4 to 7 m; and forested areas with trees ≥ 8 m of average canopy height are labeled as arboreal canopy forests. These groupings are used for comparisons between biomass estimates (Table 1).

Table 1.
Definition of classifications applied in this study.
This study proposes a simplification to adjust the proportions of different biomass compartments in relation to canopy height. In this case, canopy heights are classified into shurblands, savannah, and forests. Then, the proportions of the different biomass compartments are related by expansion factors for each of the three canopy structures, so the biomass compartments are in relation to the proportion of aboveground biomass.
The definitions of steppe formations or variations with Steppe Savannas are not utilized in the classification by the authors of [15] (as shown in Table 1); these are associated with seasonal characteristics featuring herbaceous, shrubby, and tree vegetation typical of arid areas. These definitions may be confused with other regional designations such as Carrasco, Capoeira, or Caatinga. Global vegetation cover classifications simplify the grouping into forest and non-forest (shrubland) formations. Such simplification is employed in estimating carbon emissions and removals from plant biomass, as used in the IPCC Good Practice Guidance [30]. The canopy height grouping methodology in this study (Table 1) proposes to identify the forest component occurring in shrubland formations, typically overlooked in global mappings as non-forest.
2.5. Implementation of the Allometric Model of Aerial Biomass
The equation used to estimate aerial biomass selected in the systematic review was developed by the authors of [12] who related data from forest inventories obtained in the field with data on canopy heights using LIDAR performed employing high-precision aerial mapping. The minimum tree diameter inclusion was DBH ≥ 5 cm, excluding leaf and thin branch biomass. To estimate biomass from the forest inventory data (tree diameter and height), the mixed species biomass equation proposed in [31] for each phytophysiognomy sampled was used. Height data sampled by LIDAR ranged from 1.7 to 38 m in vegetation transitions between savannah and forest, with aerial biomass between 19 and 104 Mg·ha−1. The equation used to estimate the aerial biomass of living and dead trees and shrubs standing above the ground resulted in linear Equation (1), with an adjusted coefficient of determination (R2) of 0.89, root mean square error (RMSE) of 8.12 Mg·ha−1 and bias of 0.43 Mg·ha−1, where AGB is the standing live and dead aerial biomass and CHM is the canopy height model value.
AGB = 2.44 + 6.25 ∗ CHM
In this study, the biomass estimation was obtained from Equation (1). Canopy height input values were obtained using the JavaScript programming language for canopy height mapping, as developed in [20] and accessible through the Google Earth Engine geoprocessing platform for the ecoregions of the Cerrado biome. Total biomass results were generated by multiplying the aboveground biomass by expansion factors for litter and underground root biomass, in accordance with the groupings of shrubland, savanna, and forest formations stratified by canopy height (Table 1).
2.6. Validation of Estimated Aboveground Biomass Values
To assess aboveground biomass estimates, two sample sets were evaluated separately, and analysis of variance was conducted using the F-test at 5% probability used to test whether the variances between field inventory values from two sample sets (obtained from the data described in Section 2.2) and estimated values from the digital model based on canopy height are equal. The first sample set tested used forest inventory data from 77 sites, including 893 plots and 95,484 measured trees at different times, as made available in [13]. High-resolution spatial images were used to interpret shrubland, savanna, and forest formations and visually assess the conditions of phytophysiognomies at the 77 sites during the period of September 2020 (date of the canopy height records used in this study).
The second evaluated sample set used the geographic location of statistical parameters related to inventoried populations from 29 forest fragments in different phytophysiognomies, measured at different times, and distributed across the 16 scientific articles found in the Cerrado systematic review [2,4,5,6,8,9,11,12,13,14,16,17,18,19,27,28]. Classifications of shrubland, savanna, and forest formations were determined according to the authors’ classifications in the articles. All conditions of the fragments were visually assessed through high-resolution images from June to September 2020.
The forest fragments inventoried in the first and second sample sets were overlaid onto the canopy height model to obtain points corresponding to the average canopy height for each type of inventoried phytophysiognomy. Consequently, the mean canopy height values were used as input data in the allometric model to estimate aboveground biomass. The aboveground biomass values were grouped by author, phytophysiognomy, mean value, and standard deviation for comparison with the digital model results. Analysis of variance and F-test were used on the means of aboveground biomass in pairs of sample sets for each type of shrubland, savanna, and forest formation to test whether the variances of two populations were equal.
2.7. Proportions of Forest Biomass in Relation to Aboveground Biomass (AGB)
Table 2 presents dry biomass values in Mg·ha−1 available in the 4th national emissions report with the main biomass compartments by type of phytophysiognomy, using the vegetation classification adopted in [7]. Averages were calculated for each biomass compartment according to each type of plant formation structure.
Table 2.
Values of the main biomass compartments (Mg·ha−1) by phytophysiology in the Cerrado biome, where C is Shrubland, S is Savanna and F is Forest (Source [7]—Adapted).
The results are available in georeferenced images, so the aboveground biomass values and relationships with total, underground, and litter biomass from this study can be checked with 10 m pixels for any georeferenced field sampling.
3. Results
3.1. Biomass Systematic Review
Among the 16 selected articles (Table 1), 12 scientific journals are used as sources, with a notable emphasis on the journal Forest Ecology and Management containing 5 out of the 10 most relevant articles. These journals have a high international impact factor and involve 178 authors in the study topic, with only one review article and no articles with a single author. The most involved countries in the research of the addressed topic are Brazil, Germany, and the United States. When analyzing the publication history of articles from 1998 to 2023, there is a noticeable increase in the number of studies in the last 5 years, with an annual growth rate of 2.81%. The five most common keywords are Aboveground Biomass, Carbon, Savanna, Cerrado, and Vegetation. The articles present a broad geographical sampling coverage within the biome, contributing to the understanding of results on the variability of forest biomass in different phytophysiognomies. However, there are still regions with less sampling or phytophysiognomies without field sampling, with a lack of actual dendrometric values for the vegetation, as can be seen in Figure 2.
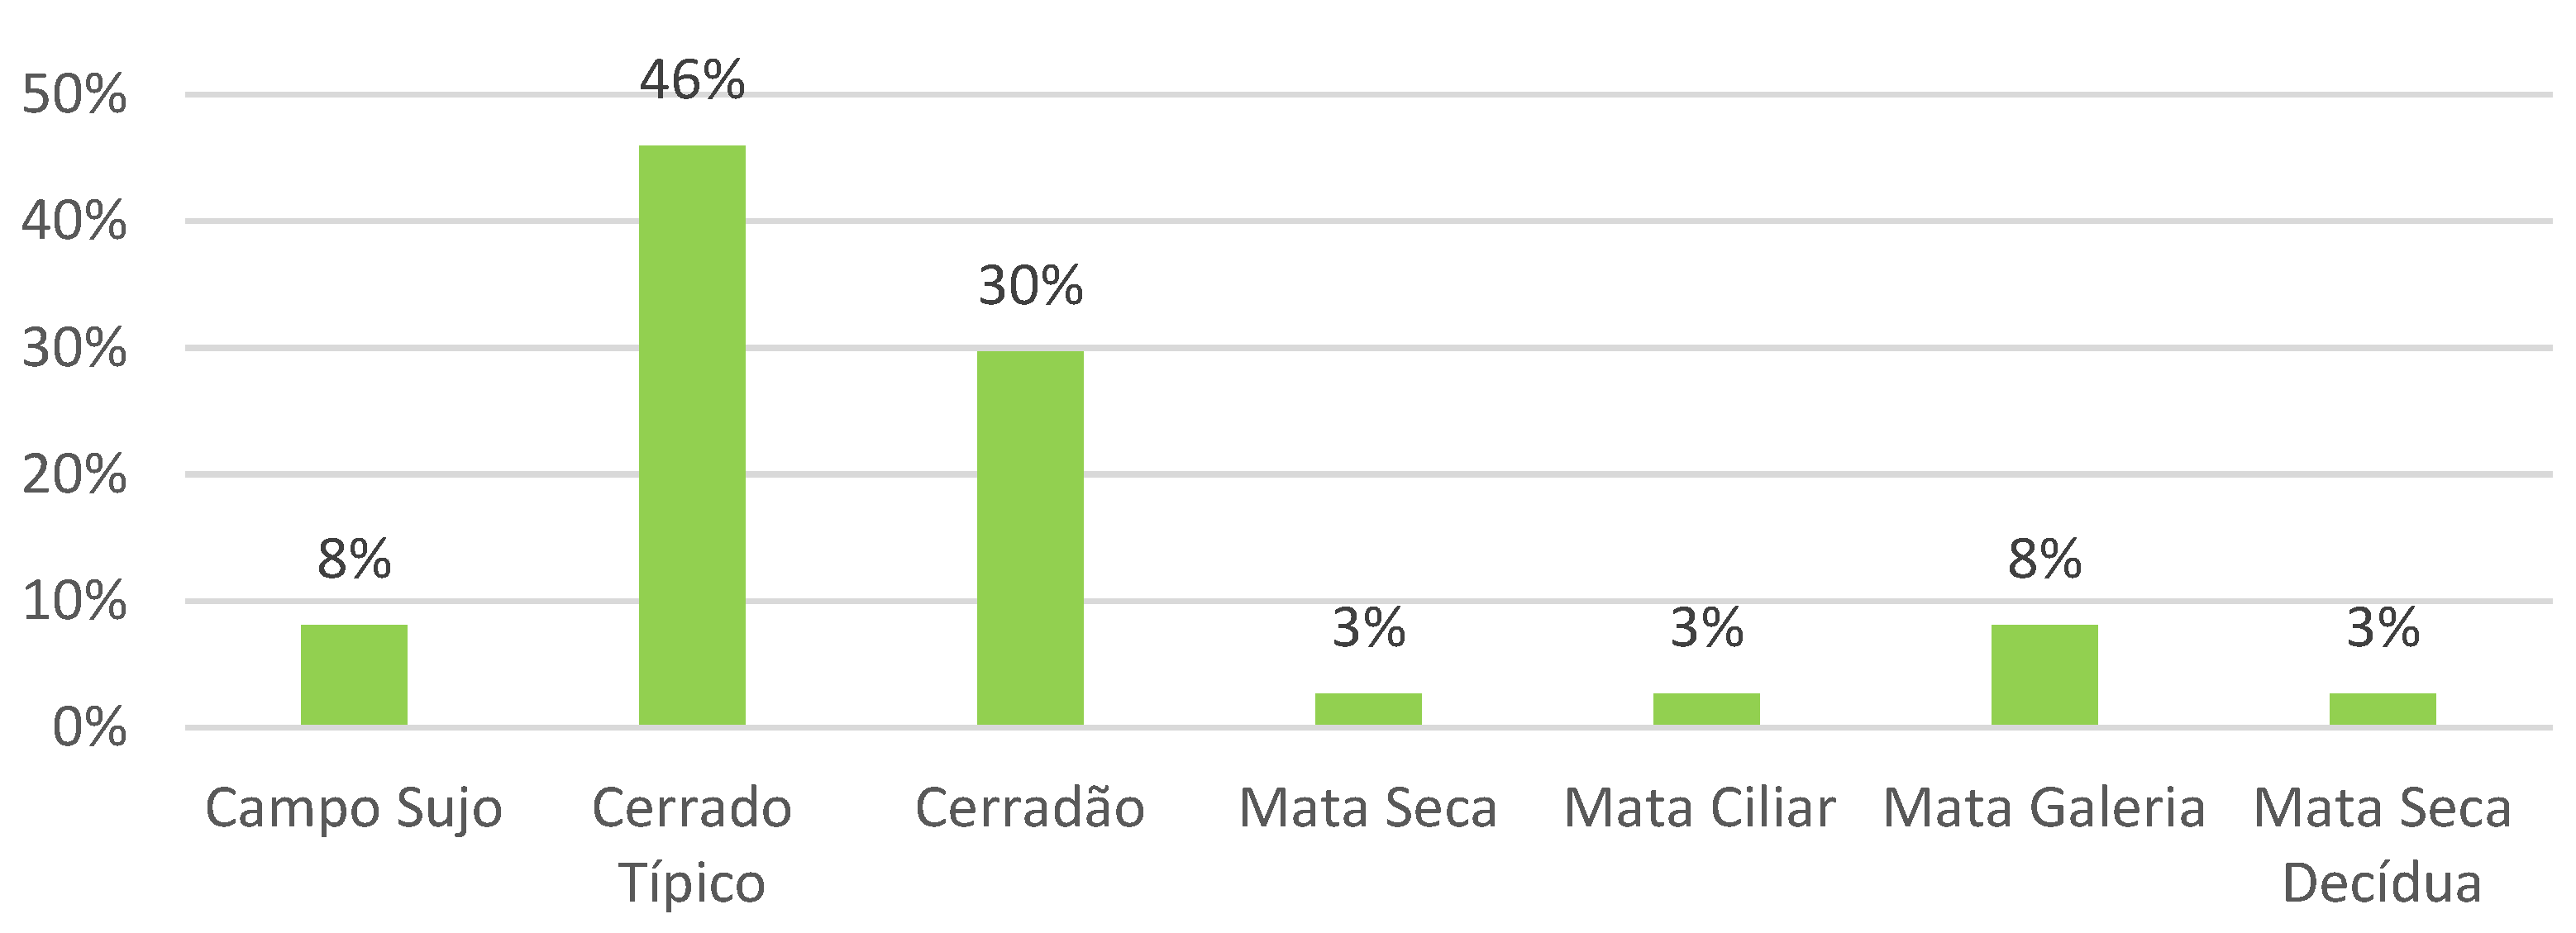
Sampling and data collection from inventories of forest fragments involve demarcating plot areas within the vegetation, systematically or randomly distributed, varying in size (400 to 1000 m2), typically with dimensions of 20 × 50 m. Subdivisions of the plots, often measuring 10 × 10 m, are used to sample herbaceous and shrubby components. Most studies conduct measurements in a single period or specific periods, and the locations of the individual plots are generally not disclosed. Some works include more than one type of sampled phytophysiognomy, such as [8,12,14]. Geographically, 37 forest fragments are identified and grouped into seven different Cerrado phytophysiognomies, with 17 sampling studies in Typical Cerrado and 11 in Cerradão (Figure 3).
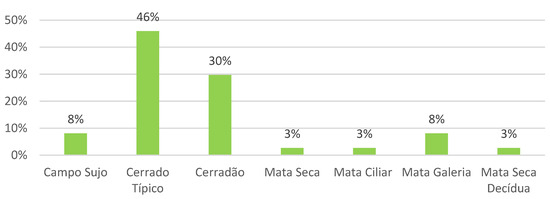
Figure 3.
Distribution of the total number of articles in the systematic review by types of phytophysiognomies.
3.2. Estimation of Aboveground Biomass in the Systematic Review and the Use of the Canopy Height Model
The measurements conducted in the reviewed articles were dated from 1988 to 2022. Among the evaluated articles, three studies used sequentially measured plots [2,11,27], and only one article mentioned vegetation increment values over time [11], reporting an aboveground biomass increase of 0.93 Mg·ha−1·year−1 in savanna. The research presented in [5] included measurements both before and after interventions such as wildfires. The remaining articles provided biomass stock values considering areas without human interventions, such as cutting and burning, during the measurements.
Among the reviewed articles, three studies were identified with direct measurements using destructive tree samples to adjust parameters of volumetric equations, along with wood density determinations in laboratory. In the Federal District of Brazil, 114 trees from eight species were used in 1990 [13]. In the state of Minas Gerais, 120 trees from the 18 most abundant species were selected in 2011 [4]. In Bahia, 60 trees from the eight main species were measured in 2019 [9]. The remaining articles employed an indirect methodology for biomass estimation, using existing allometric equations or adapting equations to the sampled phytophysiognomies. The aboveground biomass values reported in the reviewed articles are presented in Table 3.
Table 3.
Descriptive statistics of aboveground biomass values (Mg·ha−1) for different phytophysiognomies occurring in the Brazilian Cerrado biome as reported in the articles evaluated in the systematic review.
The 77 samples provided in [13] with different periods of measurements were distributed across the ecoregions of the Cerrado biome, and had land use and vegetation cover visually classified using satellite images in September 2020 to check whether the area was still covered by vegetation or underwent land-use change. The results excluded 12 locations that underwent changes, of which 2 were dam floodings, 9 were conversions to pasture and 1 to agriculture. Aboveground biomass values in the locations studied in [13] ranged from 4.77 to 50.22 Mg·ha−1, showing an average value of 24.54 Mg·ha−1. Vegetation cover varied across almost all phytophysiognomies, from open shrubland to riparian forests. The aboveground biomass values estimated by the canopy height model developed in the study ranged from 14.94 to 121.19 Mg·ha−1, with an average of 62.93 Mg·ha−1, substantially higher for all shrubland, savanna, and forest formations. When comparing the analysis of variance in a single factor for mean biomass values, the hypothesis of whether the variances of the biomass values found in the inventory plots by the authors of [13] and the mean estimates of the model proposed in [12] were equal with significant effect between groups, F(1, 110) = 2.53 at p < 0.05.
The comparison of aboveground biomass estimation by the canopy model in the review articles involved 29 locations of inventoried forest fragments verified through satellite images. A total of 2 shrubland fragments, 14 savanna fragments, and 13 forest fragments were sampled. The aboveground biomass values found in the articles ranged from 3.9 to 184.10 Mg·ha−1, with an overall mean of 60.24 Mg·ha−1, including phytophysiognomies distributed across shrubland, savanna, and forest formations. The aboveground biomass values estimated by the canopy height model ranged from 14.94 to 152 Mg·ha−1, with an overall mean of 63.67 Mg·ha−1, and tree heights varying from 2 to 24 m.
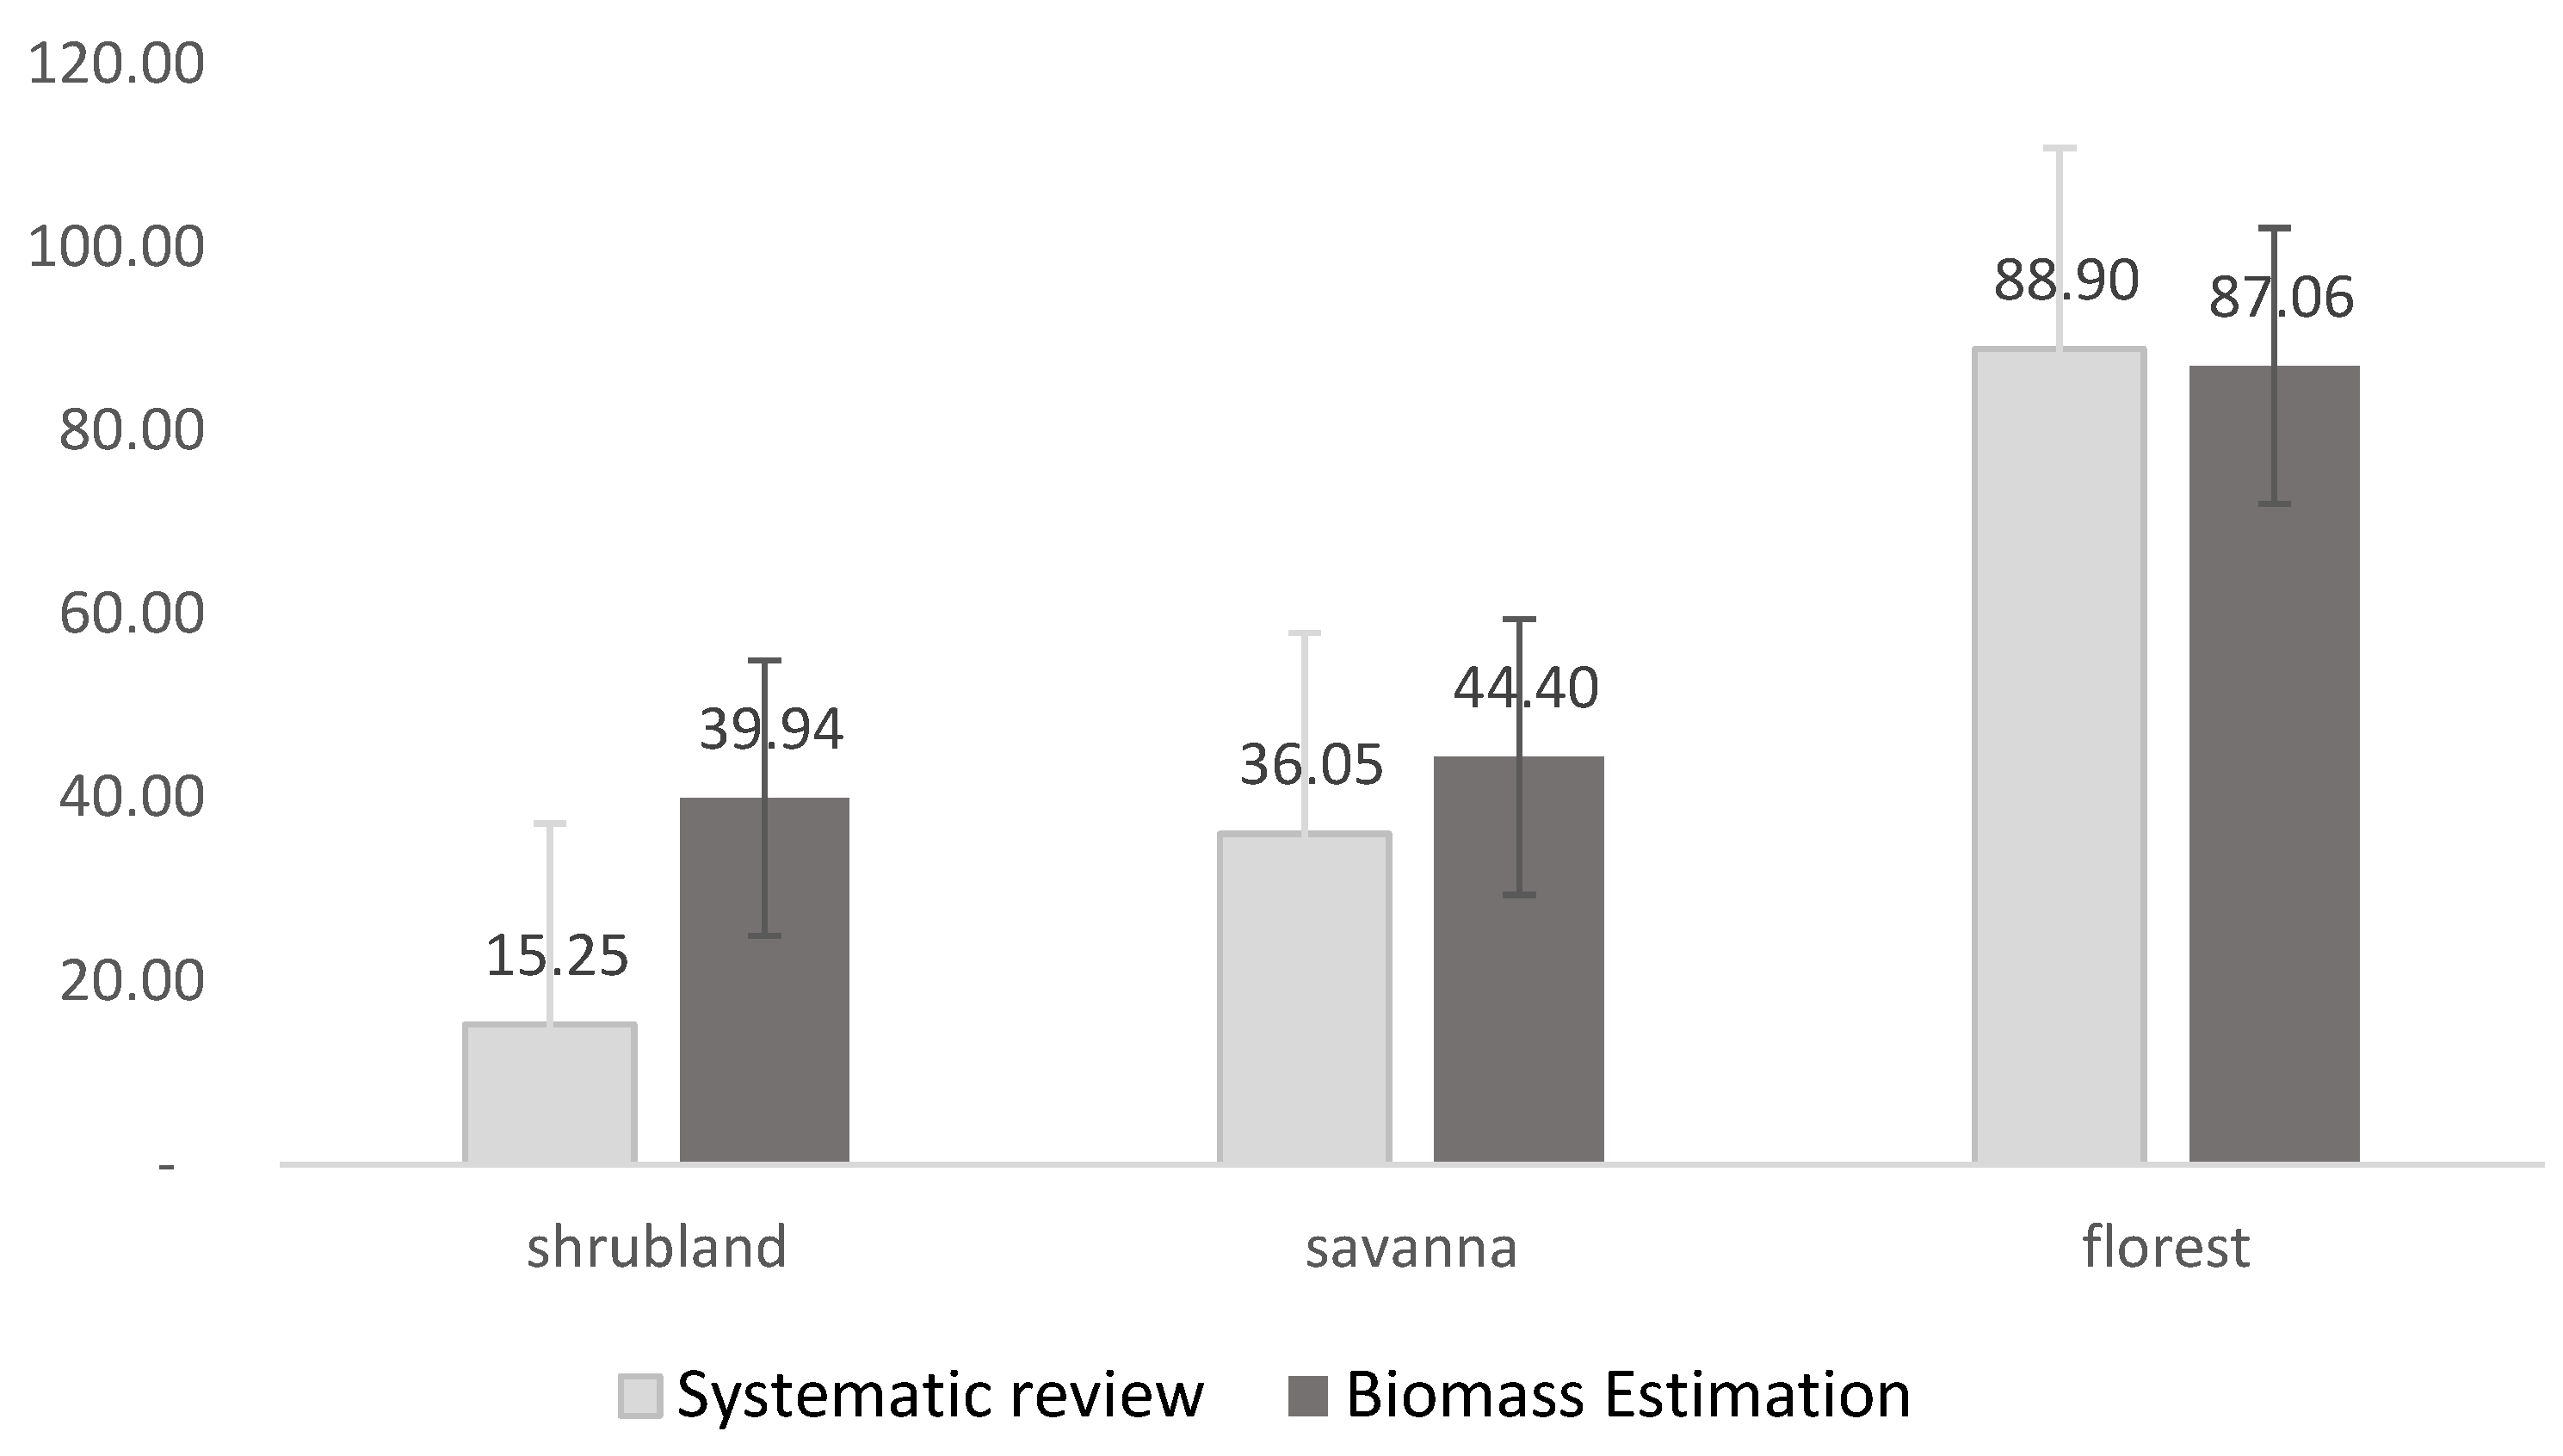
Figure 4 presents variations in means and standard deviations across shrubland, savanna, and forest formations between the mean values and respective standard deviations found in scientific articles and the values of aboveground biomass estimated by the canopy height model developed in this study. When comparing the analysis of variance in a single factor for mean biomass values, the hypothesis of variability between the review scientific articles and the values estimated by the digital model of biomass values could be rejected without significant effect between groups, F(1, 54) = 0.77 at p < 0.05, considering the tabulated value lower than the critical value. Therefore, this means that the values estimated by the canopy height model are statistically equal to the mean values found in scientific articles.

Figure 4.
Comparison of estimated mean values and their standard deviations (bar) of aboveground biomass (Mg·ha−1) from the reviewed scientific articles and the biomass estimate using the canopy height model developed in this study.
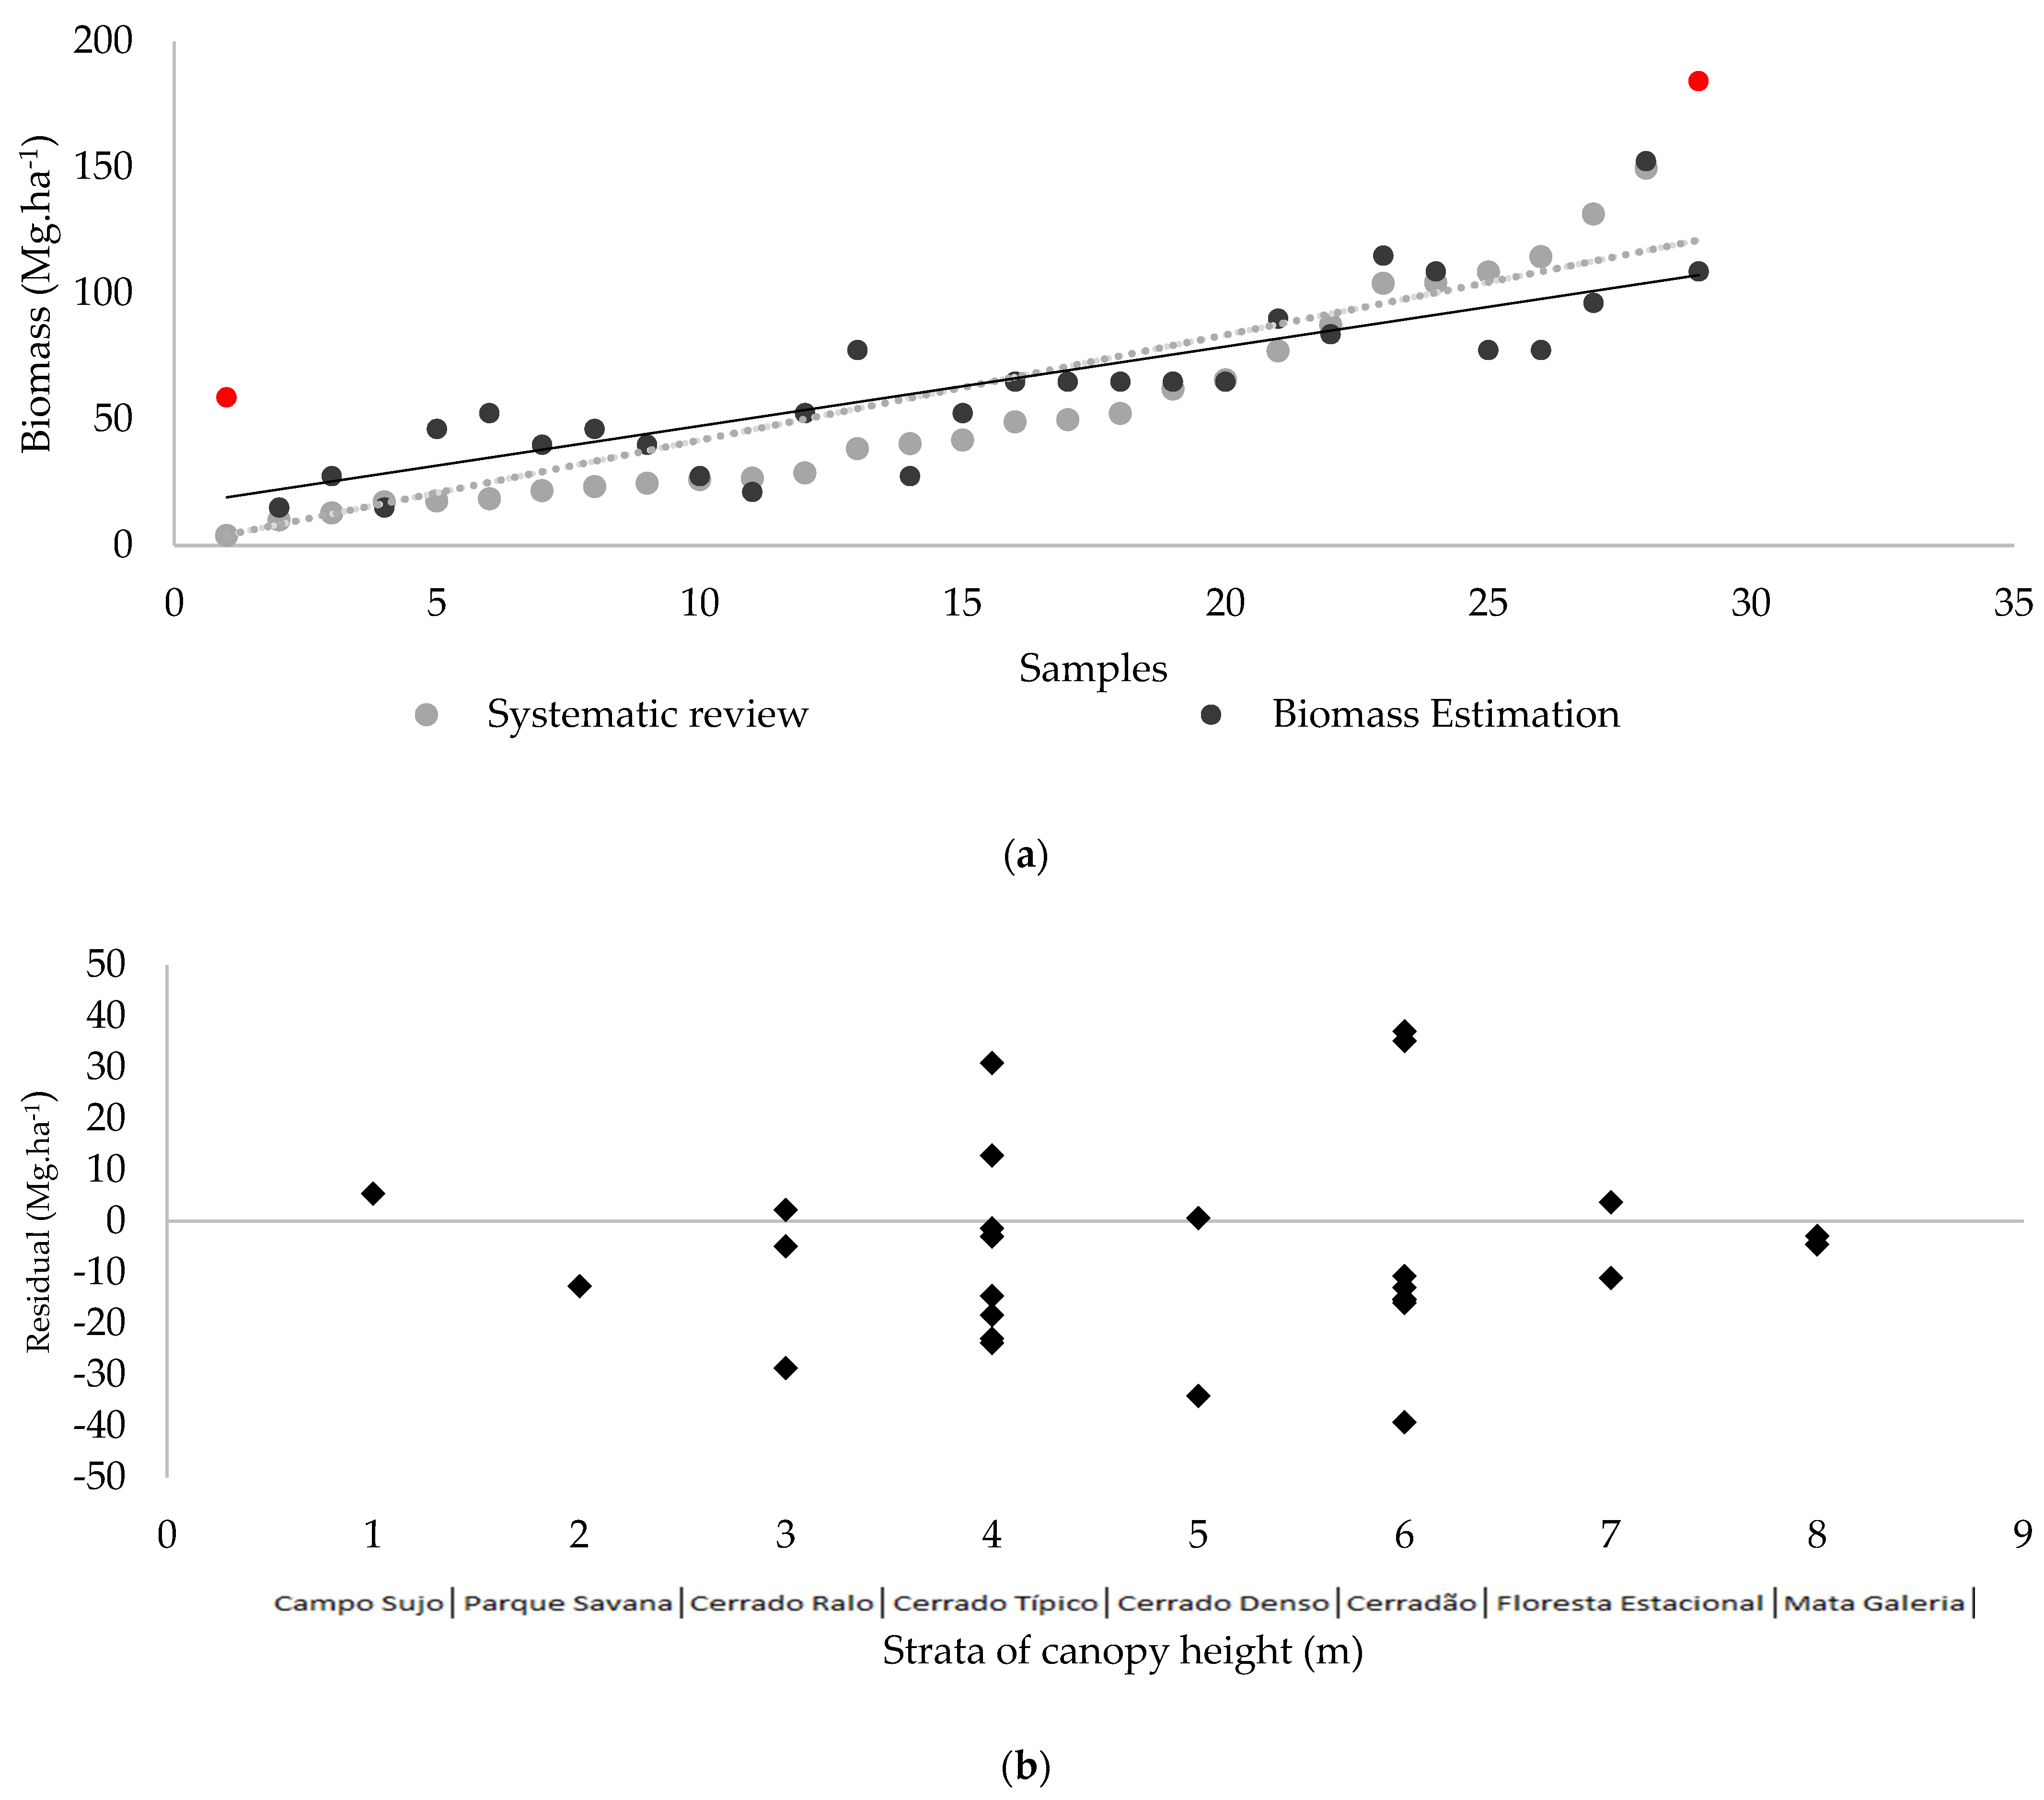
Figure 5a represents the results of aboveground biomass values in Mg·ha−1 from the 29 samples, comparing the values reported in the scientific article review with the values estimated by the canopy height model developed in this study. The two extreme values (shown in red in Figure 5a) were inspected in the images and found to be in the Pantanal biome, close to the limit with the Cerrado biome; hence, they were considered outliers because they were outside the Cerrado biome and were excluded from the analyses related to research [2]. In Figure 5b, the distributions of residuals are depicted without these outliers.
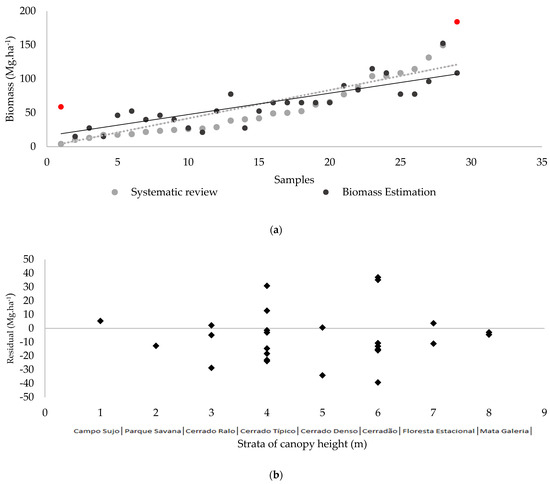
Figure 5.
(a) Sampled plot distribution with aboveground biomass values estimated by the canopy height model (black circles) overlapping with aboveground biomass values obtained in the systematic review of scientific articles (grey circles), the red dots indicate the estimated biomass value for the two largest differences between the estimated and observed values, while the solid and dotted lines represent the mean trends for the estimated and observed biomass values, respectively. (b) Black squares represent the residual distribution between the reported and estimated aboveground biomass in Mg·ha−1.
3.3. Assessment of Aerial Biomass in Different Phytophysiognomies
Figure 6 presents pixel values in pairs of comparisons from aboveground biomass units Mg·ha−1 within the three variations of phytophysiognomies (campo, savanna, and forest formations) in the Cerrado biome related to the experimental farm. The image pairs illustrate vegetation formations, with forests represented by Riparian Forest (Figure 6a,b), savanna represented by Typical Cerrado (Figure 6c,d), and Shrublands (Figure 6e,f). The images on the left side (Figure 6a,c,e) represent the sampled fragments from the systematic review of scientific articles. Fragments with the results of the estimated biomass values are overlaid on the images on the right side (Figure 6b,d,f). In each image, arrows with coincident points in the two images can be observed. Each point represents the values of aboveground biomass estimates, with the left side showing averages of the fragments sampled in the articles, and the right side showing the pixel of the average canopy height of the fragment and its respective estimated aboveground biomass value using the canopy height allometric model developed in this study.
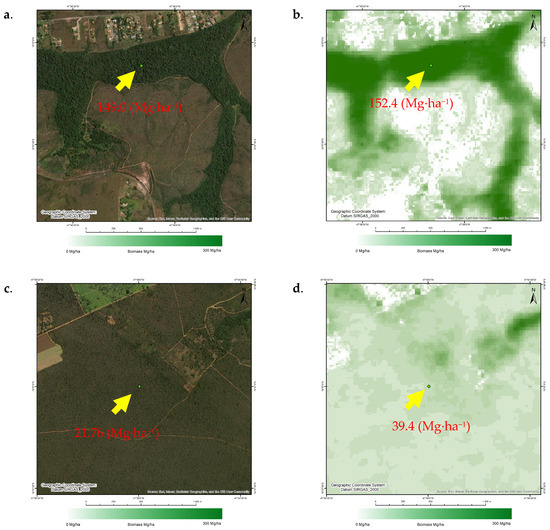
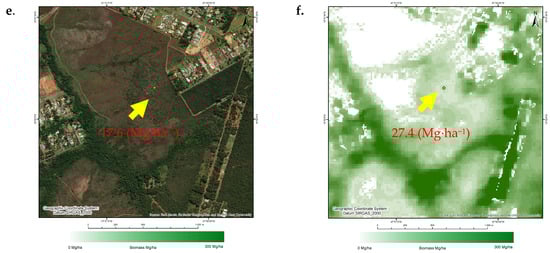
Figure 6.
Biomass comparisons in Forest vegetation formations (a), Savanna (c) and Shrublands (e), considering the images on the left as the average values of the aerial biomass of the fragment and on the right (b,d,f) as the average canopy heights and the respective values estimated by the canopy height model.
Figure 6a illustrates the Mata de Galeria fragment, with data obtained from [27], presenting average tree height values of 12.7 m with a standard deviation of 1.6 m and maximum height of 33.0 m. The fragment’s aerial biomass was estimated as 149.0 Mg·ha−1 and the standard deviation was 74.5 Mg·ha−1. The coordinate points −47.9694 and −15.9519, referring to the average canopy height (Figure 6b), present a pixel value of 24 m and a standard deviation of 6 m with an estimated aerial biomass of 152.44 Mg·ha−1. The illustration of the Typical Cerrado (Figure 6c,d), also sampled in [27] on the same area, represented the savanna fragment with average tree height values of 2.8 m, standard deviation of 1.4 m and maximum height of 10 m. The aerial biomass value was estimated as 21.7 Mg·ha−1, with a standard deviation of 11.6 Mg·ha−1. The point sampled by the average canopy height to estimate aerial biomass (Figure 6d) with coordinates −47.8461, −15.8641, resulted in a canopy height of 6 m and a standard deviation of 3 m, with aerial biomass estimated at 39.9 Mg·ha−1. The comparison with the results from the shrublands, carried out on the same farm by the authors of [5], resulted in values from the sampled fragments with an average vegetation height of 2.5 m and a deviation of 0.35 m, with a maximum height of 6 m and an estimated aerial biomass value of 17.6 Mg·ha−1. The estimation data at the coordinate point −47.9166, −15.9500 in this study were 4 m of average canopy height, with 4 m of standard deviation and aerial biomass of 27.4 Mg·ha−1.
3.4. Assessment of Total Biomass
From the canopy height relationships, it was possible to understand the structure of plant formation in the shrublands, savannah, and forests and infer the other proportions of biomass in the Cerrado biome. All the aboveground biomass values reposted and estimated up to this point contain living and dead aerial biomass; thus, they already include the percentage of standing necromass. Therefore, to calculate only live aerial biomass, the necromass must be subtracted from the aerial biomass. Thus, to estimate the total biomass of the Cerrado biome, the aerial biomasses with dead and living parts were used to expand to the biomass of roots and litter. Table 4 summarizes the groupings of expansion factors for estimates of total biomass using the main compartments of forest biomass in relation to aerial biomass for the underground parts (fine and thick roots), litter, necromass, and the possible relationships between the underground part and the total aerial part.
Table 4.
Expansion factors (proportion) of biomass compartments in relation to total aerial biomass by type of vegetation (AGB is aboveground biomass and BGB. Total AGB is the ratio between the belowground biomass and the total aboveground biomass).
Using the aboveground biomass estimated by the canopy height model, expansion factors were applied to each type of vegetation formation. Thus, expansion factors for shrublands were applied to canopy heights from 1 to 3 m, savanna factors to canopy heights from 4 to 7 m, and forest factors to canopy heights above 8 m. To calculate the total biomass value in a forest of 100 Mg·ha−1, factors corresponding to 27 Mg·ha−1 for roots and 9 Mg·ha−1 for litter were applied, resulting in a total biomass of 136 Mg·ha−1. It is considered that a part of the total biomass corresponds to 9 Mg·ha−1 of necromass and 91 Mg·ha−1 of live aboveground biomass. Figure 7 presents the map of total biomass for all regions of the Cerrado biome in 10 m spatial resolution pixels and can be accessed through the Google Earth Engine platform through the link in Supplementary Materials.
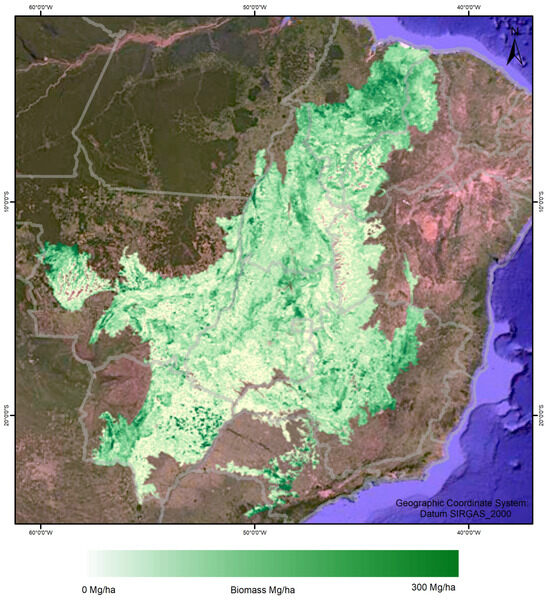
Figure 7.
Total biomass estimate including aerial, necromass, litter, and root compartments in all ecoregions of the Cerrado biome in Brazil.
The results of the systematic review on underground biomass estimation presented uneven sampling methodologies. Due to the complexity of measuring the compartment of thick roots beneath trees, especially in larger trees found in forests, there is significant variability in averages and a lack of research on roots in forest formations in the Cerrado. The results on sample plots in this study, using root biomass expansion factors multiplied by the aboveground biomass in shrubland formations, resulted in 12.3 Mg·ha−1. In savanna formations, average root values of 13.3 Mg·ha−1 were found, and in forest formations, the average was 18.63 Mg·ha−1.
4. Discussion
The distribution of the samples from the field plots and the inventoried fragments in the scientific articles did not adequately represent the northern portion of the Cerrado biome, specifically in the geographical regions of Alto Parnaíba and to the south in Paraná Guimarães, leaving gaps in these important areas which could be prioritized for future studies. The standardization of sampling with explicit geographical locations and spatial precision overlaid on pixels in high-resolution images could contribute to increasing the accuracy of digital models for biomass estimates. A possible limitation of the methods employed in this study concerns the use of the canopy height information obtained from the year 2020, as described in [20]. Thus, the application of the biomass estimation strategies presented in this work is better suited for areas with climax vegetation during the year 2020, and estimates recorded for areas that present a canopy height that is too divergent from 2020 (e.g., areas under forest regeneration) might present biased estimation results.
Thus, improvement in the temporal availability of the canopy height input values could improve the biomass estimation values. Still regarding the height input data, another improvement that is warranted is further refinement to permit distinction between native and planted forests. The application of the current biomass estimation procedure may be difficult to estimate total biomass values per unit of area (e.g., per biome, state, or city) that only contains native vegetation, considering that the biomass estimation model is calibrated for native forests.
The definitions of minimum diameters and the concepts of trees and shrubs showed variability in the application of volumetric and biomass equations, which may impact aerial biomass estimation. In [5], the authors considered as shrubs individuals with a basal diameter (BD, measured at 0.30 m above the ground), with minimum values of ≤5 cm and a total height of up to 2 m. Trees, on the other hand, were defined by diameter at breast height (DBH, obtained at 1.3 m (above the ground)) with values greater than or equal to 10 cm [5]. In general, the definition of trees and shrubs established DBH ≥ 5 cm and height > 2 m [2]. Some studies use DBH > 1.6 cm to include shrubs [6,17], while others employ intermediate diameters and separate diameters into classes > 10 cm to improve adjustments and reduce errors associated with biomass estimation equation fittings [8,14].
Plots sampled in earlier dates did not maintain linear correlations over the decades of measurements between the vegetation structures estimated with the digital model in the year 2020. According to [11], the biomass increment in the typical Cerrado can reach 26.11 ± 0.15 Mg·ha−1 after 28 years of clear-cutting. In this context, the fragments inventoried in 1993, grouped in [13], found significant differences between the values of the plots and the values from the digital biomass model. On the other hand, the samples found in the scientific articles showed homogeneity in aerial biomass estimates using the digital canopy height model.
The savanna formation produced more samples than the forest formation followed by the shrubland formation. It was observed in the results that deviations in heights are more influential in canopies of lower height. For the savanna and forest formations, the deviations in canopy heights were less significant. The results found in [8,18] and in aerial biomass mapping in the Cerrado also indicated greater uncertainties with overestimations of values for lower heights in shrubland formations. Field measurements for forest biomass estimation indicated the need for differentiation of allometric models between the shrubland and savanna.
Among the biomass compartments evaluated in this study, the underground root compartment was the most variable. The study of [2] presented an average for savannas of 14.2 Mg·ha−1, which is the closest value to the present study (12.3 Mg·ha−1). On the other hand, the study of [6] only estimated values for fine roots at 0.7 Mg·ha−1, and in the study of [28], a contrasting value of 3.5 Mg·ha−1 was reported, also for fine roots. For total root estimates, in [5], the authors estimated high values of 30.1 Mg·ha−1 for shrubland formations and 52.9 Mg·ha−1 for savannas, whereas in [4], the authors found a value for total roots in savanna formations of 37.5 Mg·ha−1. The results of litter biomass were proportionally less representative of the total biomass and showed significant variation across different regions of the biome and measurements in several seasons. The sampling of necromass in general was not addressed in the inventories of review articles. The sampling of standing and fallen dead trees still confounds the inclusion of this biomass portion among the compartments of surface and aerial parts inventoried in review articles.
5. Conclusions
The allometric equation proposed in [12] for the estimation of total aboveground woody biomass, adjusted with the model employing canopy height developed in [20], showed similarity to the results found in 16 scientific articles distributed across the Cerrado biome. The results of these estimates can be accessed freely in georeferenced images with a pixel spatial resolution of 10 m. The mapping of aboveground biomass and associated errors was conducted for all canopy heights in the Cerrado biome. The expansion factors grouped for each vegetation structure of shrubland, savanna, and forest were related to the other compartments for estimation of underground biomass, litter, and total biomass. They proved to be effective and yielded satisfactory results, but improvements in variability control are required. The next steps will involve evaluations and classifications of native vegetation remnants, distinguishing them from silvicultural activities, and will be assessed through overlays in conservation units or rural properties for more accurate estimates of carbon stocks in the Cerrado biome.
Supplementary Materials
The supporting information can be used with the code, https://code.earthengine.google.com/9e9a502d080f05e783d080b6cf31a826 (accessed on 22 January 2024), and these applications for consultation of various pools combined: https://ee-gutoton.projects.earthengine.app/view/biomassa---distrito-federal (accessed on 22 January 2024). For the map in Figure 7, https://ee-gutoton.projects.earthengine.app/view/biomassa-cerrado (accessed on 22 January 2024).
Author Contributions
Conceptualization, C.A.Z.T., F.P.S. and R.d.C.C.M.; methodology, C.A.Z.T., A.R. and A.C.F.F.; software, C.A.Z.T. and E.A.T.M.; validation, C.A.Z.T. and A.C.F.F.; formal analysis, C.A.Z.T.; investigation, C.A.Z.T.; resources, C.A.Z.T. and A.C.F.F.; data curation, C.A.Z.T.; writing—original draft preparation, C.A.Z.T.; writing—review and editing, C.A.Z.T., A.R. and A.C.F.F.; visualization, C.A.Z.T.; supervision, F.P.S., R.d.C.C.M. and A.C.F.F.; project administration, C.A.Z.T. and A.C.F.F.; funding acquisition, A.C.F.F. All authors have read and agreed to the published version of the manuscript.
Funding
This research was partially funded by the Piauí State Research Support Foundation—FAPEPI (grant numbers 7449.PGR288.59939.08082022 and 7317.PGR288.58294.07082022) and the National Council for Scientific and Technological Development (CNPq), grant number 305377/2021-3.
Data Availability Statement
The data presented in this study are available upon request from the corresponding author.
Conflicts of Interest
The authors declare no conflicts of interest.
References
- Zhou, Y.; Singh, J.; Butnor, J.R.; Coetsee, C.; Boucher, P.B.; Case, M.F.; Hockridge, E.G.; Davies, A.B.; Staver, A.C. Limited Increases in Savanna Carbon Stocks over Decades of Fire Suppression. Nature 2022, 603, 445–449. [Google Scholar] [CrossRef] [PubMed]
- Terra, M.C.; Nunes, M.H.; Souza, C.R.; Ferreira, G.W.; do Prado-Junior, J.A.; Rezende, V.L.; Maciel, R.; Mantovani, V.; Rodrigues, A.; Morais, V.A.; et al. The Inverted Forest: Aboveground and Notably Large Belowground Carbon Stocks and Their Drivers in Brazilian Savannas. Sci. Total. Environ. 2023, 867, 161320. [Google Scholar] [CrossRef]
- Sano, S.M.; Pedrosa de Almeida, S.P.; Ribeiro, J.F. Cerrado: Ecologia e Flora; Embrapa Informação Tecnológica: Brasília, Brazil, 2007. [Google Scholar]
- Ribeiro, S.C.; Fehrmann, L.; Soares, C.P.B.; Jacovine, L.A.G.; Kleinn, C.; de Oliveira Gaspar, R. Above- and Belowground Biomass in a Brazilian Cerrado. For. Ecol. Manag. 2011, 262, 491–499. [Google Scholar] [CrossRef]
- De Castro, E.A.; Kauffman, J.B. Ecosystem Structure in the Brazilian Cerrado: A Vegetation Gradient of Aboveground Biomass, Root Mass and Consumption by Fire. J. Trop. Ecol. 1998, 14, 263–283. [Google Scholar] [CrossRef]
- Righi, C.A.; de Oliveira Risante, A.P.; Packer, A.P.; Couto, H.T.Z.D. Biodiversity and Biomass Relationships in a Cerrado Stricto Sensu in Southeastern Brazil. Environ. Monit. Assess. 2023, 195, 492. [Google Scholar] [CrossRef] [PubMed]
- Ministério da Ciência, Tecnologia e Inovações. Quarta Comunicação Nacional do Brasil à Convenção Quadro das Nações Unidas sobre Mudança do Clima; Ministério da Ciência, Tecnologia e Inovações: Brasília, Brazil, 2022.
- Zimbres, B.; Rodríguez-Veiga, P.; Shimbo, J.Z.; Bispo, P.d.C.; Balzter, H.; Bustamante, M.; Roitman, I.; Haidar, R.; Miranda, S.; Gomes, L.; et al. Mapping the Stock and Spatial Distribution of Aboveground Woody Biomass in the Native Vegetation of the Brazilian Cerrado Biome. For. Ecol. Manag. 2021, 499, 119615. [Google Scholar] [CrossRef]
- de Oliveira, C.P.; Francelino, M.R.; Daher, M.; de Araújo, E.J.G.; de Souza Sanches, L.; de Andrade, K.D.C.; de Campos, J.S.N. Estimation of the Aboveground Biomass and Carbon Stocks in Open Brazilian Savannah Developed on Sandy Soils. Carbon Balance Manag. 2019, 14, 5. [Google Scholar] [CrossRef] [PubMed]
- Laurin, G.V.; Ding, J.; Disney, M.; Bartholomeus, H.; Herold, M.; Papale, D.; Valentini, R. Tree Height in Tropical Forest as Measured by Different Ground, Proximal, and Remote Sensing Instruments, and Impacts on above Ground Biomass Estimates. Int. J. Appl. Earth Obs. Geoinf. 2019, 82, 101899. [Google Scholar]
- de Azevedo, G.B.; Rezende, A.V.; de Oliveira Sousa Azevedo, G.T.; Miguel, E.P.; de Gois Aquino, F.; Teodoro, L.P.R.; Teodoro, P.E. Prognosis of Aboveground Woody Biomass in a Central Brazilian Cerrado Monitored for 27 Years after the Implementation of Management Systems. Eur. J. For. Res. 2021, 141, 1–15. [Google Scholar] [CrossRef]
- Bispo, P.d.C.; Rodríguez-Veiga, P.; Zimbres, B.; de Miranda, S.D.C.; Cezare, C.H.G.; Fleming, S.; Baldacchino, F.; Louis, V.; Rains, D.; Garcia, M.; et al. Woody Aboveground Biomass Mapping of the Brazilian Savanna with a Multi-Sensor and Machine Learning Approach. Remote Sens. 2020, 12, 2685. [Google Scholar] [CrossRef]
- Roitman, I.; Bustamante, M.M.C.; Haidar, R.F.; Shimbo, J.Z.; Abdala, G.C.; Eiten, G.; Fagg, C.W.; Felfili, M.C.; Felfili, J.M.; Jacobson, T.K.B.; et al. Optimizing Biomass Estimates of Savanna Woodland at Different Spatial Scales in the Brazilian Cerrado: Re-evaluating Allometric Equations and Environmental Influences. PLoS ONE 2018, 13, e0196742. [Google Scholar] [CrossRef]
- da Costa, M.B.T.; Silva, C.A.; Broadbent, E.N.; Leite, R.V.; Mohan, M.; Liesenberg, V.; Stoddart, J.; Amaral, C.H.D.; de Almeida, D.R.A.; da Silva, A.L.; et al. Beyond Trees: Mapping Total Aboveground Biomass Density in the Brazilian Savanna Using High-Density UAV-Lidar Data. For. Ecol. Manag. 2021, 491, 119155. [Google Scholar] [CrossRef]
- Ribeiro, J.F.; Teles Walter, B.M. Fitofisionomias do Bioma Cerrado, 1st ed.; Embrapa: Brasília, Brazil, 1998. [Google Scholar]
- de Miranda, S.D.C.; Bustamante, M.; Palace, M.; Hagen, S.; Keller, M.; Ferreira, L.G. Regional Variations in Biomass Distribution in Brazilian Savanna Woodland. Biotropica 2014, 46, 125–138. [Google Scholar] [CrossRef]
- Barros, J.H.S.; Ayres, F.M.; Chambó, E.D.; Constantino, M.; de Moraes, P.M.; Skowronski, L.; Barcelos, S.T.V.; Fava, W.S.; Costa, R.B. Aboveground Carbon Stock in Phytophysiognomies of the Southeast Pantanal, Brazil. Braz. J. Bot. 2022, 45, 755–762. [Google Scholar] [CrossRef]
- Costa, A.N.; Souza, J.R.; Alves, K.M.; Penna-Oliveira, A.; Paula-Silva, G.; Becker, I.S.; Marinho-Vieira, K.; Bonfim, A.L.; Bartimachi, A.; Vieira-Neto, E.H.M. Linking the Spatiotemporal Variation Of Litterfall to Standing Vegetation Biomass in Brazilian Savannas. J. Plant Ecol. 2020, 13, 517–524. [Google Scholar] [CrossRef]
- Maia, V.A.; de Souza, C.R.; de Aguiar-Campos, N.; Fagundes, N.C.A.; Santos, A.B.M.; de Paula, G.G.P.; Santos, P.F.; Silva, W.B.; de Oliveira Menino, G.C.; dos Santos, R.M. Interactions between Climate and Soil Shape Tree Community Assembly and Above-ground Woody Biomass of Tropical Dry Forests. For. Ecol. Manag. 2020, 474, 118348. [Google Scholar] [CrossRef]
- Lang, N.; Jetz, W.; Schindler, K.; Wegner, J.D. A High-resolution Canopy Height Model of the Earth. Nat. Ecol. Evol. 2023, 7, 1778–1789. [Google Scholar] [CrossRef]
- Wu, L.; Shi, Y.; Zhang, F.; Zhou, Y.; Ding, Z.; Lv, S.; Xu, L. Estimating Carbon Stocks and Biomass Expansion Factors of Urban Greening Trees Using Terrestrial Laser Scanning. Forests 2022, 13, 1389. [Google Scholar] [CrossRef]
- Andrade, H.J.; Segura, M.; Somarriba, E. Above-Ground Biomass Models for Dominant Trees Species in Cacao agroforestry Systems in Talamanca, Costa Rica. Agrofor. Syst. 2022, 96, 787–797. [Google Scholar] [CrossRef]
- Lisboa, S.N.; Guedes, B.S.; Ribeiro, N.; Sitoe, A. Biomass Allometric Equation and Expansion Factor for a Mountain Moist Evergreen Forest in Mozambique. Carbon Balance Manag. 2018, 13, 23. [Google Scholar] [CrossRef]
- Sanquetta, C.R.; Corte, A.P.; da Silva, F. Biomass Expansion Factor and Root-to-Shoot Ratio for Pinus in Brazil. Carbon Balance Manag. 2011, 6, 6. [Google Scholar] [CrossRef]
- Gonçalves, J.R. Como Escrever Um Artigo de Revisão de Literatura. Rev. JRG Estud. Acadêmicos 2019, 2, 29–55. [Google Scholar] [CrossRef]
- Donthu, N.; Kumar, S.; Mukherjee, D.; Pandey, N.; Lim, W.M. How to Conduct a Bibliometric Analysis: An Overview and Guidelines. J. Bus. Res. 2021, 133, 285–296. [Google Scholar] [CrossRef]
- Zimbres, B.; Shimbo, J.; Bustamante, M.; Levick, S.; Miranda, S.; Roitman, I.; Silvério, D.; Gomes, L.; Fagg, C.; Alencar, A. Savanna Vegetation Structure in the Brazilian Cerrado Allows for the Accurate Estimation of Aboveground Biomass Using Terrestrial Laser Scanning. For. Ecol. Manag. 2019, 458, 117798. [Google Scholar] [CrossRef]
- Peixoto, K.S.; Marimon-Junior, B.H.; Marimon, B.S.; Elias, F.; de Farias, J.; Freitag, R.; Mews, H.A.; das Neves, E.C.; Prestes, N.C.C.; Malhi, Y. Unravelling Ecosystem Functions at the Amazonia-Cerrado Transition: II. Carbon Stocks and CO2 Soil Efflux in Cerradão Forest Undergoing Ecological Succession. Acta Oecologica 2017, 82, 23–31. [Google Scholar] [CrossRef]
- Instituto Brasileiro de Geografia e Estatística (Ed.) Manual Técnico Da Vegetação Brasileira; 2a edição revista e ampliada. Manuais Técnicos Em Geociências, número 1; Instituto Brasileiro de Geografia e Estatística-IBGE: Rio de Janeiro, Brazil, 2012.
- Intergovernmental Panel on Climate Change (Ed.) Climate Change 2013—The Physical Science Basis: Working Group I Contribution to the Fifth Assessment Report of the Intergovernmental Panel on Climate Change, 1st ed.; Cambridge University Press: Cambridge UK, 2014. [Google Scholar] [CrossRef]
- Scolforo, J.R.; de Tavares Carvalho, L.M. Inventário Florestal de Minas Gerais; Universidade Federal de Lavras, Ed.; Editora UFLA, Universidade Federal de Lavras: Lavras, Brazil, 2008. [Google Scholar]


Disclaimer/Publisher’s Note: The statements, opinions and data contained in all publications are solely those of the individual author(s) and contributor(s) and not of MDPI and/or the editor(s). MDPI and/or the editor(s) disclaim responsibility for any injury to people or property resulting from any ideas, methods, instructions or products referred to in the content. |
© 2024 by the authors. Licensee MDPI, Basel, Switzerland. This article is an open access article distributed under the terms and conditions of the Creative Commons Attribution (CC BY) license (https://creativecommons.org/licenses/by/4.0/).