
The Contributions of Climate and Human Activities to Water Use Efficiency in China’s Drylands
Abstract
:1. Introduction
2. Materials and Method
2.1. Study Area
2.2. Data and Pre-Processing
2.3. Method
2.3.1. Calculation of WUE
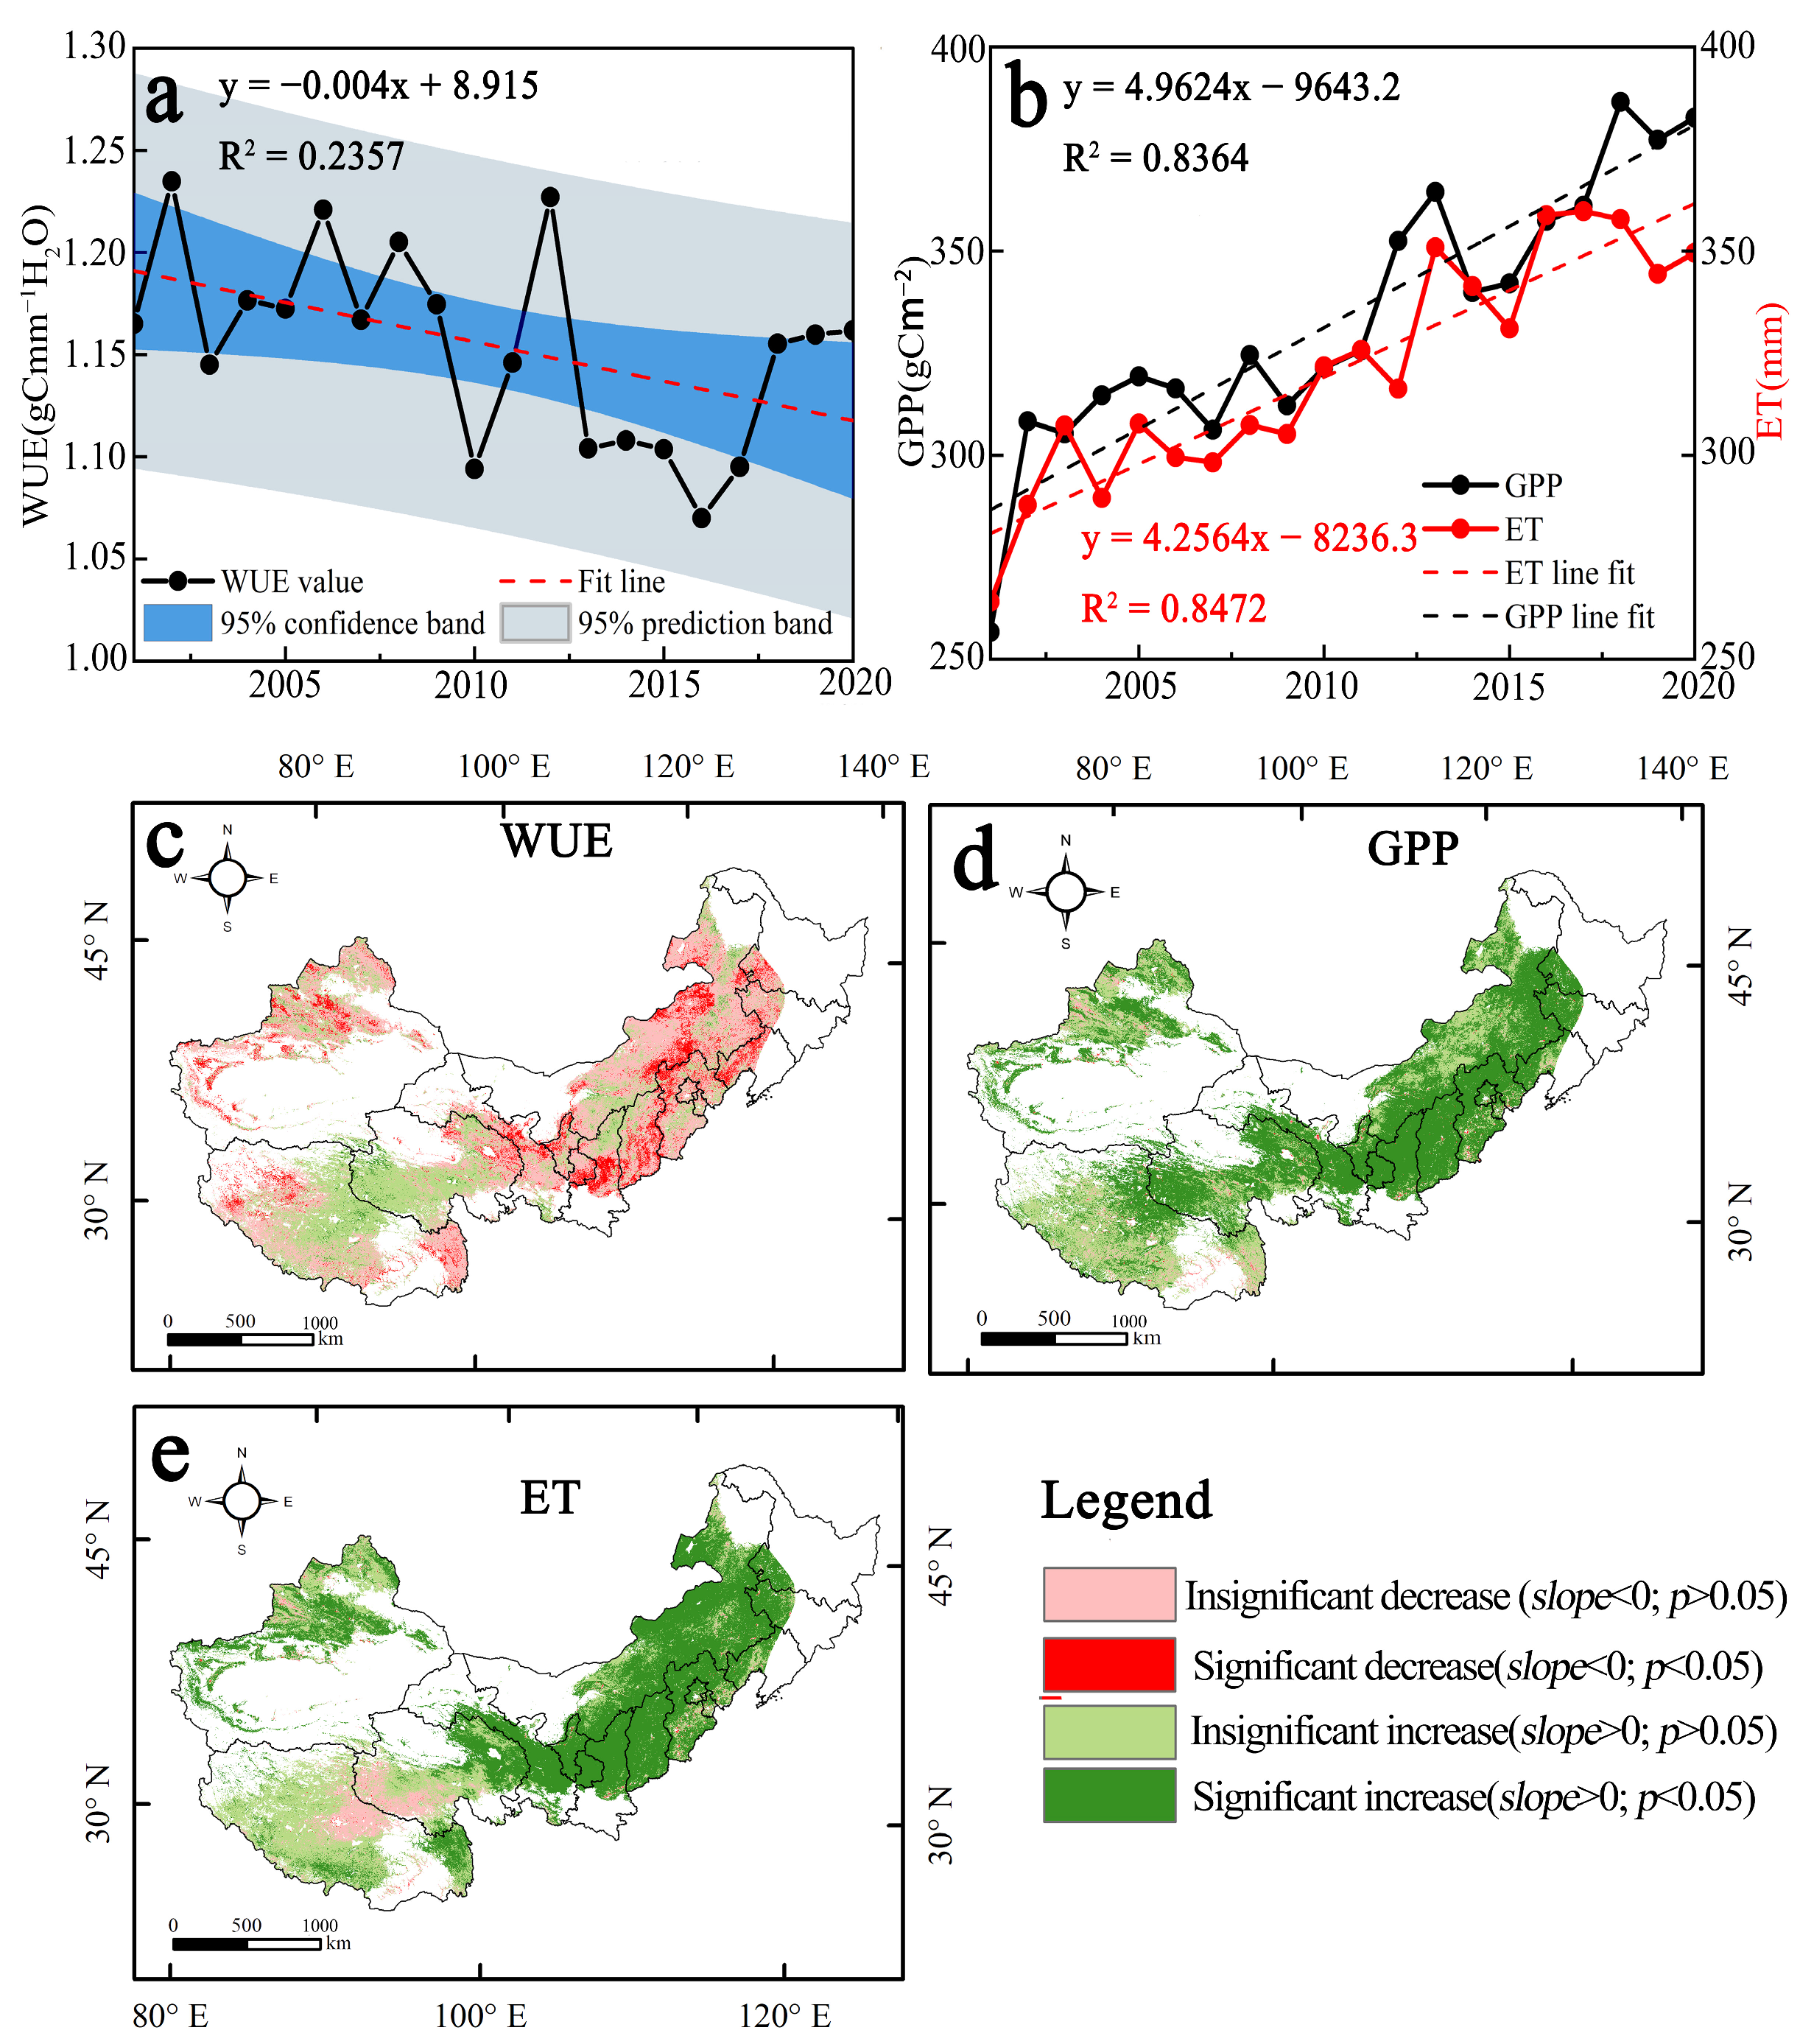
2.3.2. Temporal and Spatial Trend Analysis of WUE, GPP, and ET
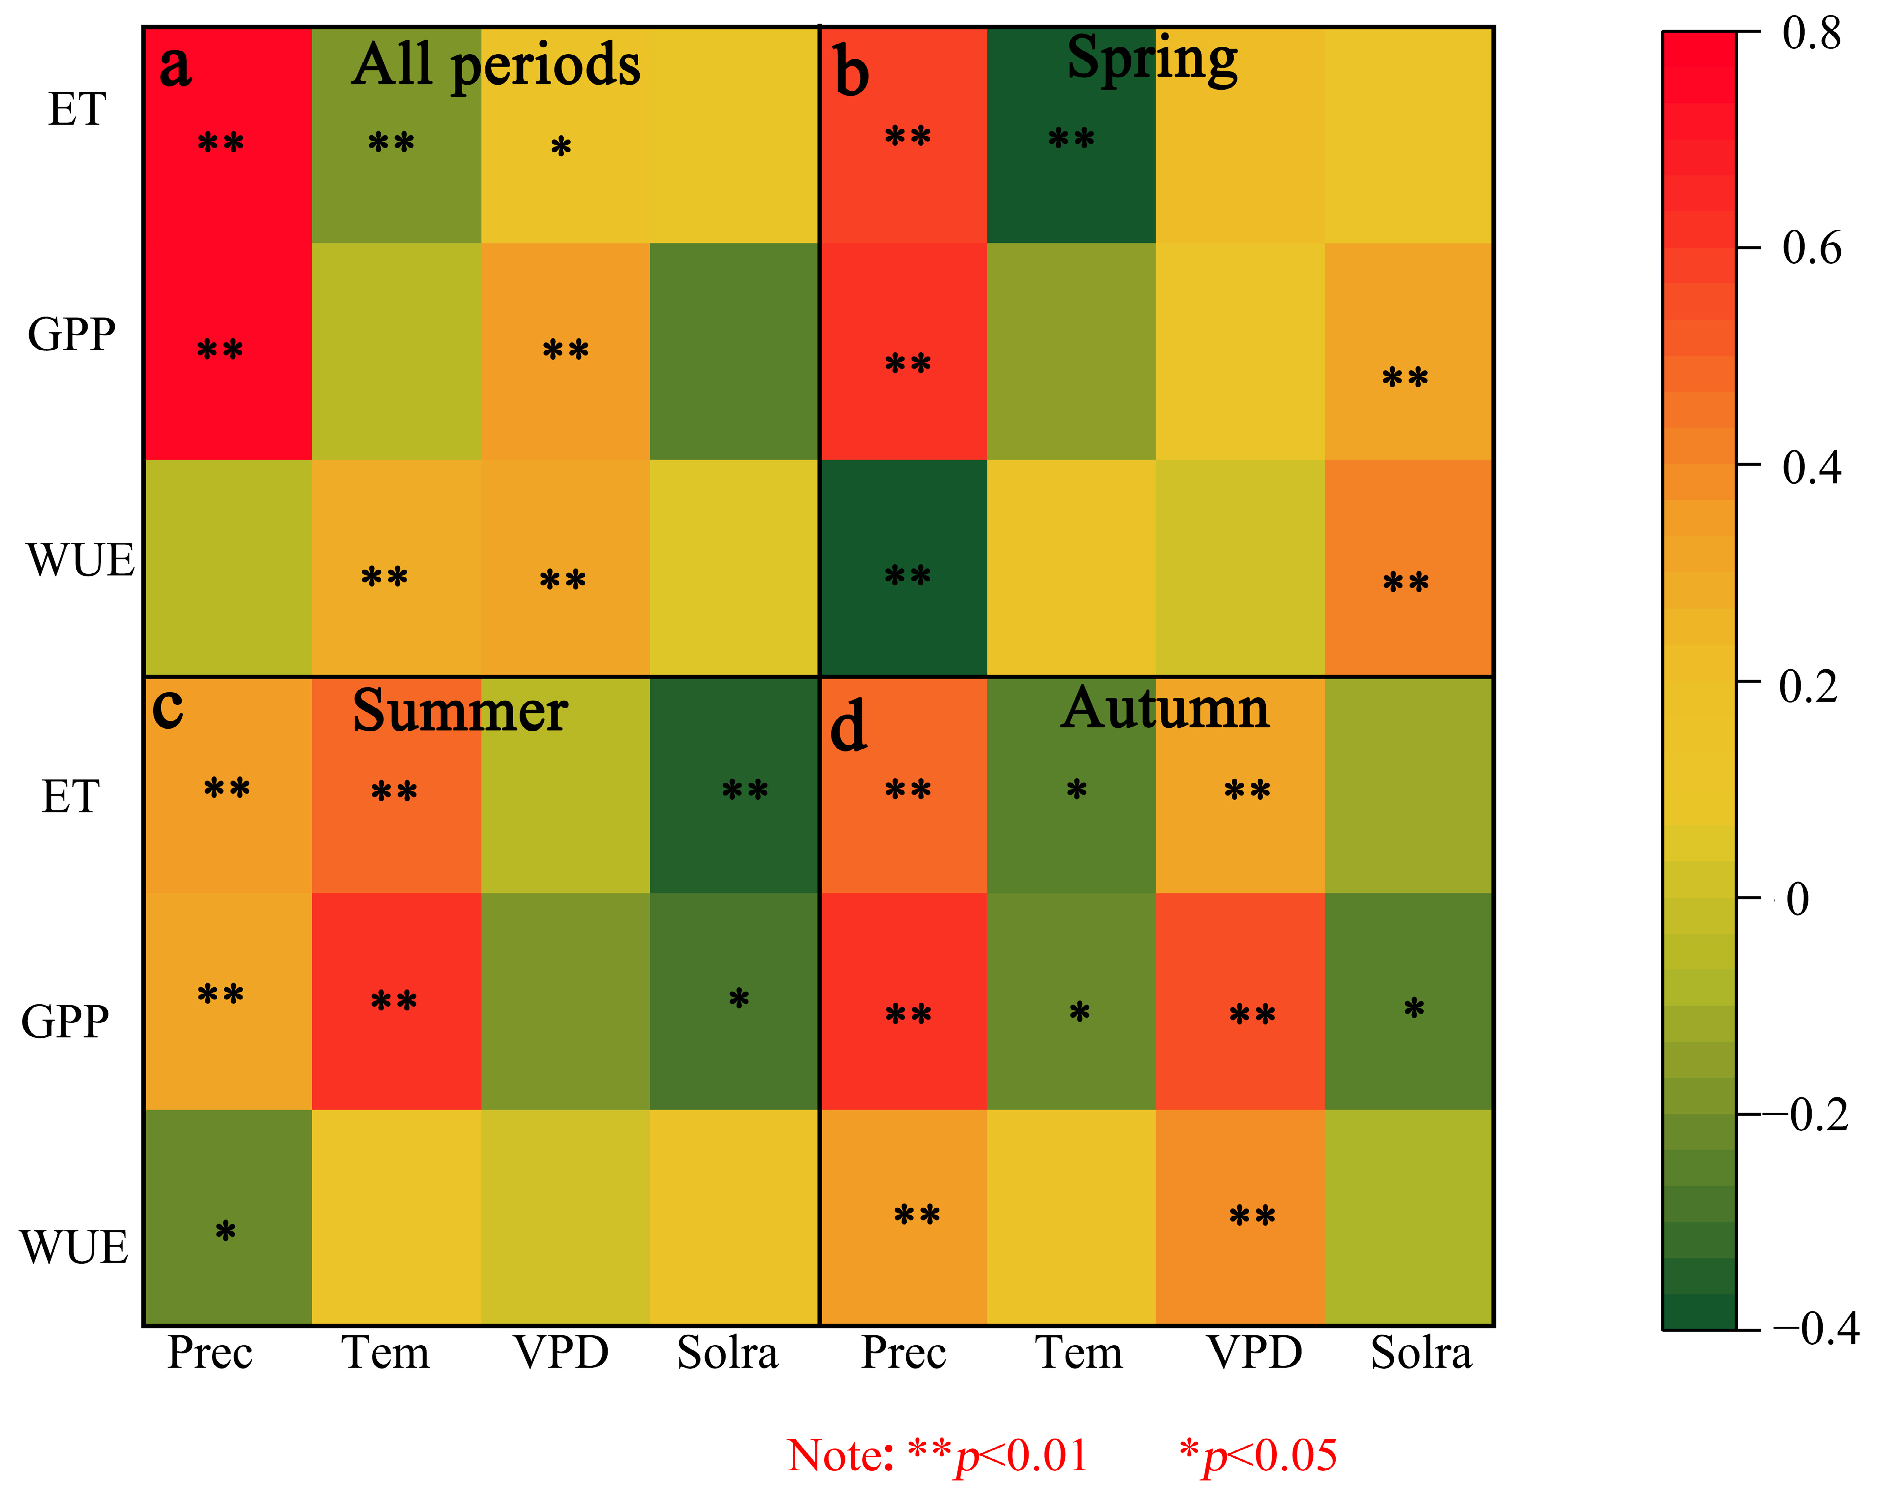
2.3.3. The Quantitative Relationships between Climatic Factors and WUE, GPP, and ET
2.3.4. Multiple Linear Regression and Residual Analysis
2.3.5. Geographical Detector
2.3.6. Hurst Index
3. Result
3.1. Temporal and Spatial Variations of WUE
3.2. Analysis of Driving Factors on Temporal Dynamics of WUE
3.3. Contribution of Climate Change and Human Activities to WUE Interannual Changes
3.4. Factors Affecting Spatial Differentiation of WUE in China’s Drylands
3.4.1. Dominant Factors of Spatial Differences in WUE
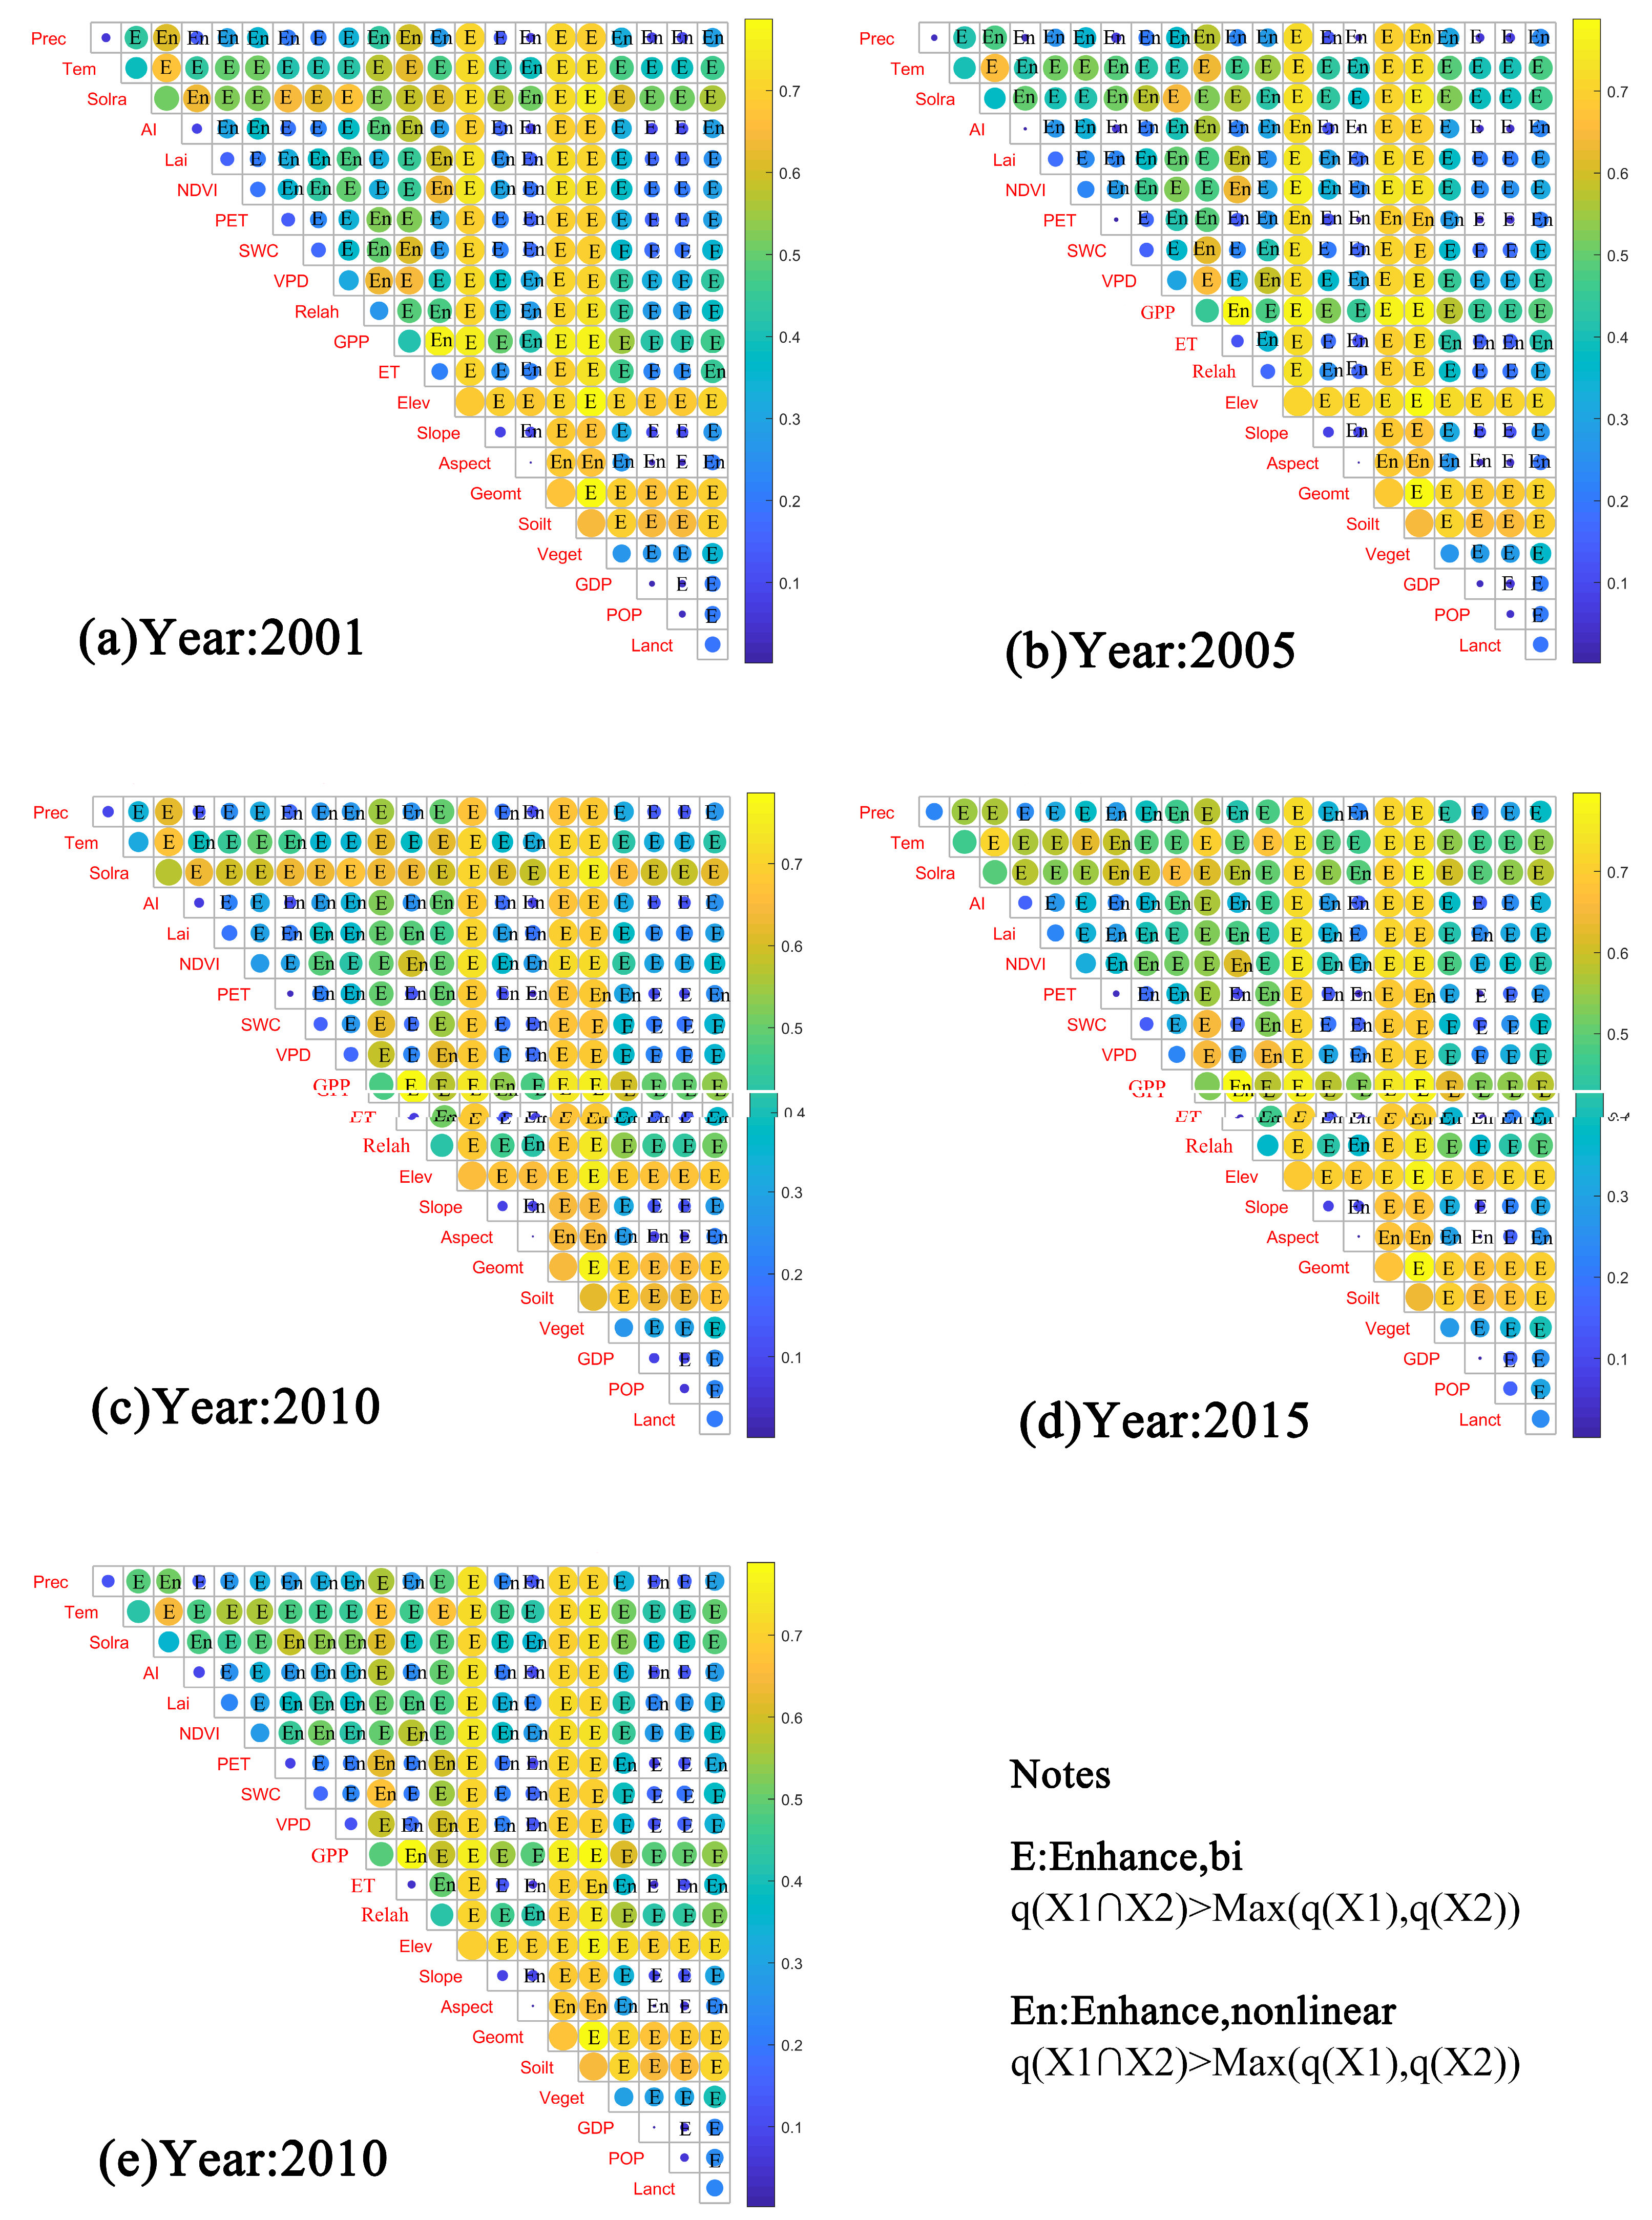
3.4.2. Interactions between Factors Affecting WUE
3.5. Future Trends in WUE Dynamics
4. Discussion
4.1. Temporal and Spatial Variations in WUE and Attribution
4.2. Sensitivity of WUE and GPP to Climate Change
4.3. Role of Human Activities in the Temporal Variation of WUE
4.4. Factors in the Spatial Drivers of WUE
4.5. Future Trend in WUE
5. Conclusions
Author Contributions
Funding
Data Availability Statement
Acknowledgments
Conflicts of Interest
Appendix A
References
- Ponce-Campos, G.E.; Moran, M.S.; Huete, A.; Zhang, Y.; Bresloff, C.; Huxman, T.E.; Eamus, D.; Bosch, D.D.; Buda, A.R.; Gunter, S.A.; et al. Ecosystem Resilience despite Large-Scale Altered Hydroclimatic Conditions. Nature 2013, 494, 349–352. [Google Scholar] [CrossRef] [PubMed]
- Tian, H.; Chen, G.; Liu, M.; Zhang, C.; Sun, G.; Lu, C.; Xu, X.; Ren, W.; Pan, S.; Chappelka, A. Model Estimates of Net Primary Productivity, Evapotranspiration, and Water Use Efficiency in the Terrestrial Ecosystems of the Southern United States during 1895–2007. For. Ecol. Manag. 2010, 259, 1311–1327. [Google Scholar] [CrossRef]
- Beer, C.; Reichstein, M.; Tomelleri, E.; Ciais, P.; Jung, M.; Carvalhais, N.; Rodenbeck, C.; Arain, M.A.; Baldocchi, D.; Bonan, G.B.; et al. Terrestrial Gross Carbon Dioxide Uptake: Global Distribution and Covariation with Climate. Science 2010, 329, 834–838. [Google Scholar] [CrossRef] [PubMed]
- Wang, L.; Wu, X.; Guo, J.; Zhou, J.; Wu, X.; Huang, J. Spatiotemporal Pattern of Vegetation Water Use Efficiency between 2003 and 2017 and Its Coupling Relationship with Artificial Carbon Sequestration in the Karst Region of Southwestern China. Ecol. Indic. 2023, 154, 110566. [Google Scholar] [CrossRef]
- Law, B.E.; Falge, E.; Gu, L.; Baldocchi, D.D.; Bakwin, P.; Berbigier, P.; Davis, K.; Dolman, A.J.; Falk, M.; Fuentes, J.D.; et al. Environmental Controls over Carbon Dioxide and Water Vapor Exchange of Terrestrial Vegetation. Agric. For. Meteorol. 2002, 113, 97–120. [Google Scholar] [CrossRef]
- Huang, M.; Piao, S.; Sun, Y.; Ciais, P.; Cheng, L.; Mao, J.; Poulter, B.; Shi, X.; Zeng, Z.; Wang, Y. Change in Terrestrial Ecosystem Water-Use Efficiency over the Last Three Decades. Glob. Chang. Biol. 2015, 21, 2366–2378. [Google Scholar] [CrossRef] [PubMed]
- Huang, M.; Piao, S.; Zeng, Z.; Peng, S.; Ciais, P.; Cheng, L.; Mao, J.; Poulter, B.; Shi, X.; Yao, Y.; et al. Seasonal Responses of Terrestrial Ecosystem Water-Use Efficiency to Climate Change. Glob. Chang. Biol. 2016, 22, 2165–2177. [Google Scholar] [CrossRef] [PubMed]
- Lian, X.; Piao, S.; Chen, A.; Huntingford, C.; Fu, B.; Li, L.; Huang, J.C.; Sheffield, J.; Berg, A.; Keenan, T.F.; et al. Multifaceted Characteristics of Dryland Aridity Changes in a Warming World. Nat. Rev. Earth Environ. 2021, 2, 232–250. [Google Scholar] [CrossRef]
- Short Gianotti, D.J.; Rigden, A.J.; Salvucci, G.D.; Entekhabi, D. Satellite and Station Observations Demonstrate Water Availability’s Effect on Continental-Scale Evaporative and Photosynthetic Land Surface Dynamics. Water Resour. Res. 2019, 55, 540–554. [Google Scholar] [CrossRef]
- Knapp, A.K.; Carroll, C.J.W.; Denton, E.M.; La Pierre, K.J.; Collins, S.L.; Smith, M.D. Differential Sensitivity to Regional-Scale Drought in Six Central US Grasslands. Oecologia 2015, 177, 949–957. [Google Scholar] [CrossRef]
- Beer, C.; Ciais, P.; Reichstein, M.; Baldocchi, D.; Law, B.E.; Papale, D.; Soussana, J.-F.; Ammann, C.; Buchmann, N.; Frank, D.; et al. Temporal and Among-Site Variability of Inherent Water Use Efficiency at the Ecosystem Level. Glob. Biogeochem. Cycles 2009, 23, 1–13. [Google Scholar] [CrossRef]
- Jia, X.; Zha, T.; Gong, J.; Wang, B.; Zhang, Y.; Wu, B.; Qin, S.; Peltola, H. Carbon and Water Exchange over a Temperate Semi-Arid Shrubland during Three Years of Contrasting Precipitation and Soil Moisture Patterns. Agric. For. Meteorol. 2016, 228–229, 120–129. [Google Scholar] [CrossRef]
- Niu, S.; Xing, X.; Zhang, Z.; Xia, J.; Zhou, X.; Song, B.; Li, L.; Wan, S. Water-Use Efficiency in Response to Climate Change: From Leaf to Ecosystem in a Temperate Steppe. Glob. Chang. Biol. 2011, 17, 1073–1082. [Google Scholar] [CrossRef]
- Ponton, S.; Flanagan, L.B.; Alstad, K.P.; Johnson, B.G.; Morgenstern, K.; Kljun, N.; Black, T.A.; Barr, A.G. Comparison of Ecosystem Water-Use Efficiency among Douglas-Fir Forest, Aspen Forest and Grassland Using Eddy Covariance and Carbon Isotope Techniques. Glob. Chang. Biol. 2006, 12, 294–310. [Google Scholar] [CrossRef]
- Yu, G.; Song, X.; Wang, Q.; Liu, Y.; Guan, D.; Yan, J.; Sun, X.; Zhang, L.; Wen, X. Water-Use Efficiency of Forest Ecosystems in Eastern China and Its Relations to Climatic Variables. New Phytol. 2008, 177, 927–937. [Google Scholar] [CrossRef] [PubMed]
- Cheng, L.; Zhang, L.; Wang, Y.-P.; Canadell, J.G.; Chiew, F.H.S.; Beringer, J.; Li, L.; Miralles, D.G.; Piao, S.; Zhang, Y. Recent Increases in Terrestrial Carbon Uptake at Little Cost to the Water Cycle. Nat. Commun. 2017, 8, 110. [Google Scholar] [CrossRef]
- Sun, Y.; Piao, S.; Huang, M.; Ciais, P.; Zeng, Z.; Cheng, L.; Li, X.; Zhang, X.; Mao, J.; Peng, S.-M.; et al. Global Patterns and Climate Drivers of Water-Use Efficiency in Terrestrial Ecosystems Deduced from Satellite-Based Datasets and Carbon Cycle Models. Glob. Ecol. Biogeogr. 2016, 25, 311–323. [Google Scholar] [CrossRef]
- Xue, B.-L.; Guo, Q.; Otto, A.; Xiao, J.; Tao, S.; Li, L. Global Patterns, Trends, and Drivers of Water Use Efficiency from 2000 to 2013. Ecosphere 2015, 6, 174. [Google Scholar] [CrossRef]
- Williams, A.P.; Allen, C.D.; Millar, C.I.; Swetnam, T.W.; Michaelsen, J.; Still, C.J.; Leavitt, S.W. Forest Responses to Increasing Aridity and Warmth in the Southwestern United States. Proc. Natl. Acad. Sci. USA 2010, 107, 21289–21294. [Google Scholar] [CrossRef]
- Liu, Y.; Xiao, J.; Ju, W.; Zhou, Y.; Wang, S.; Wu, X. Water Use Efficiency of China’s Terrestrial Ecosystems and Responses to Drought. Sci. Rep. 2015, 5, 13799. [Google Scholar] [CrossRef]
- Mei, L.; Tong, S.; Yin, S.; Bao, Y.; Huang, X.; Alateng, T. Variation Characteristics of Ecosystem Water Use Efficiency and Its Response to Human Activity and Climate Change in Inner Mongolia. Remote Sens. 2022, 14, 5422. [Google Scholar] [CrossRef]
- D’Odorico, P.; Bhattachan, A.; Davis, K.F.; Ravi, S.; Runyan, C.W. Global Desertification: Drivers and Feedbacks. Adv. Water Resour. 2013, 51, 326–344. [Google Scholar] [CrossRef]
- Du, X.; Zhao, X.; Zhou, T.; Jiang, B.; Xu, P.; Wu, D.; Tang, B. Effects of Climate Factors and Human Activities on the Ecosystem Water Use Efficiency throughout Northern China. Remote Sens. 2019, 11, 2766. [Google Scholar] [CrossRef]
- Wang, L.; Li, M.; Wang, J.; Li, X.; Wang, L. An Analytical Reductionist Framework to Separate the Effects of Climate Change and Human Activities on Variation in Water Use Efficiency. Sci. Total Environ. 2020, 727, 138306. [Google Scholar] [CrossRef] [PubMed]
- Cai, H.; Yang, X.; Xu, X. Human-Induced Grassland Degradation/Restoration in the Central Tibetan Plateau: The Effects of Ecological Protection and Restoration Projects. Ecol. Eng. 2015, 83, 112–119. [Google Scholar] [CrossRef]
- He, L.; Guo, J.; Jiang, Q.; Zhang, Z.; Yu, S. How Did the Chinese Loess Plateau Turn Green from 2001 to 2020? An Explanation Using Satellite Data. Catena 2022, 214, 106246. [Google Scholar] [CrossRef]
- He, L.; Guo, J.; Yang, W.; Jiang, Q.; Chen, L.; Tang, K. Multifaceted Responses of Vegetation to Average and Extreme Climate Change over Global Drylands. Sci. Total Environ. 2023, 858, 159942. [Google Scholar] [CrossRef] [PubMed]
- Huang, L.; Shao, M. Advances and Perspectives on Soil Water Research in China’s Loess Plateau. Earth-Sci. Rev. 2019, 199, 102962. [Google Scholar] [CrossRef]
- Li, C.; Fu, B.; Wang, S.; Stringer, L.C.; Wang, Y.; Li, Z.; Liu, Y.; Zhou, W. Drivers and Impacts of Changes in China’s Drylands. Nat. Rev. Earth Environ. 2021, 2, 858–873. [Google Scholar] [CrossRef]
- Bai, Y.; Zha, T.; Bourque, C.P.-A.; Jia, X.; Ma, J.; Liu, P.; Yang, R.; Li, C.; Du, T.; Wu, Y. Variation in Ecosystem Water Use Efficiency along a Southwest-To-Northeast Aridity Gradient in China. Ecol. Indic. 2020, 110, 105932. [Google Scholar] [CrossRef]
- Jia, B.; Luo, X.; Wang, L.; Lai, X. Changes in Water Use Efficiency Caused by Climate Change, CO2 Fertilization, and Land Use Changes on the Tibetan Plateau. Adv. Atmos. Sci. 2022, 40, 144–154. [Google Scholar] [CrossRef]
- Zhang, J.; Li, Z.; Duan, W.; Zhao, H.; Hao, H.; Xiang, Y.; Zhang, Q. Assessing Restoration and Degradation of Natural and Artificial Vegetation in the Arid Zone of Northwest China. Front. Ecol. Evol. 2023, 11, 1131210. [Google Scholar] [CrossRef]
- Feng, S.; Fu, Q. Expansion of Global Drylands under a Warming Climate. Atmos. Chem. Phys. Discuss. 2013, 13, 14637–14665. [Google Scholar] [CrossRef]
- Huang, J.; Yu, H.; Guan, X.; Wang, G.; Guo, R. Accelerated Dryland Expansion under Climate Change. Nat. Clim. Chang. 2015, 6, 166–171. [Google Scholar] [CrossRef]
- Tarek, M.; Brissette, F.P.; Arsenault, R. Evaluation of the ERA5 Reanalysis as a Potential Reference Dataset for Hydrological Modelling over North America. Hydrol. Earth Syst. Sci. 2020, 24, 2527–2544. [Google Scholar] [CrossRef]
- Cheng, X.; Huang, M.; Shao, M.; Warrington, D.N. A Comparison of Fine Root Distribution and Water Consumption of Mature Caragana Korshinkii Kom Grown in Two Soils in a Semiarid Region, China. Plant Soil 2009, 315, 149–161. [Google Scholar] [CrossRef]
- Deng, L.; Yan, W.; Zhang, Y.; Shangguan, Z. Severe Depletion of Soil Moisture Following Land-Use Changes for Ecological Restoration: Evidence from Northern China. For. Ecol. Manag. 2016, 366, 1–10. [Google Scholar] [CrossRef]
- Jin, T.; Fu, B.; Liu, G.H.; Zhi, W. Hydrologic Feasibility of Artificial Forestation in the Semi-Arid Loess Plateau of China. Hydrol. Earth Syst. Sci. 2011, 15, 2519–2530. [Google Scholar] [CrossRef]
- Horion, S.; Prishchepov, A.V.; Verbesselt, J.; de Beurs, K.; Tagesson, T.; Fensholt, R. Revealing Turning Points in Ecosystem Functioning over the Northern Eurasian Agricultural Frontier. Glob. Chang. Biol. 2016, 22, 2801–2817. [Google Scholar] [CrossRef]
- Khalifa, M.; Elagib, N.A.; Ribbe, L.; Schneider, K. Spatio-Temporal Variations in Climate, Primary Productivity and Efficiency of Water and Carbon Use of the Land Cover Types in Sudan and Ethiopia. Sci. Total Environ. 2018, 624, 790–806. [Google Scholar] [CrossRef]
- Ge, W.; Deng, L.; Wang, F.; Han, J. Quantifying the Contributions of Human Activities and Climate Change to Vegetation Net Primary Productivity Dynamics in China from 2001 to 2016. Sci. Total Environ. 2021, 773, 145648. [Google Scholar] [CrossRef] [PubMed]
- Xiao, B.; Bai, X.; Zhao, C.; Tan, Q.; Li, Y.; Luo, G.; Wu, L.; Chen, F.; Li, C.-J.; Chen, R.; et al. Responses of Carbon and Water Use Efficiencies to Climate and Land Use Changes in China’s Karst Areas. J. Hydrol. 2023, 617, 128968. [Google Scholar] [CrossRef]
- Evans, J.; Geerken, R. Discrimination between Climate and Human-Induced Dryland Degradation. J. Arid. Environ. 2004, 57, 535–554. [Google Scholar] [CrossRef]
- Mei, L.; Tong, S.; Yin, S.; Bao, Y.; Huang, X.; Alateng, T.; Wang, Y.; Guo, E.; Yuan, Z.; Nashun, D.; et al. Spatiotemporal Variations of Water Use Efficiency and Its Driving Factors in Inner Mongolia from 2001 to 2020. J. Geogr. Sci. 2023, 33, 169–194. [Google Scholar] [CrossRef]
- Lin, S.; Wang, G.; Hu, Z.; Huang, K.; Sun, J.; Sun, X. Spatiotemporal Variability and Driving Factors of Tibetan Plateau Water Use Efficiency. J. Geophys. Res. Atmos. 2020, 125, e2020JD032642. [Google Scholar] [CrossRef]
- Zhang, Q.; Chen, W. Ecosystem Water Use Efficiency in the Three-North Region of China Based on Long-Term Satellite Data. Sustainability 2021, 13, 7977. [Google Scholar] [CrossRef]
- Chen, J.; Jönsson, P.; Tamura, M.; Gu, Z.; Matsushita, B.; Eklundh, L. A Simple Method for Reconstructing a High-Quality NDVI Time-Series Data Set Based on the Savitzky–Golay Filter. Remote Sens. Environ. 2004, 91, 332–344. [Google Scholar] [CrossRef]
- Seneviratne, S.I.; Corti, T.; Davin, E.L.; Hirschi, M.; Jaeger, E.B.; Lehner, I.; Orlowsky, B.; Teuling, A.J. Investigating Soil Moisture–Climate Interactions in a Changing Climate: A Review. Earth-Sci. Rev. 2010, 99, 125–161. [Google Scholar] [CrossRef]
- Xie, J.; Zha, T.; Zhou, C.; Jia, X.; Yu, H.; Yang, B.; Chen, J.; Zhang, F.; Wang, B.; Bourque, C.P.-A.; et al. Seasonal Variation in Ecosystem Water Use Efficiency in an Urban-Forest Reserve Affected by Periodic Drought. Agric. For. Meteorol. 2016, 221, 142–151. [Google Scholar] [CrossRef]
- Wang, X.M.; Zhang, C.X.; Hasi, E.; Dong, Z.B. Has the Three Norths Forest Shelterbelt Program Solved the Desertification and Dust Storm Problems in Arid and Semiarid China? J. Arid. Environ. 2010, 74, 13–22. [Google Scholar] [CrossRef]
- Hu, Z.; Yu, G.; Fu, Y.; Sun, X.; Li, Y.; Shi, P.; Wang, Y.; Zheng, Z. Effects of Vegetation Control on Ecosystem Water Use Efficiency within and among Four Grassland Ecosystems in China. Glob. Chang. Biol. 2008, 14, 1609–1619. [Google Scholar] [CrossRef]
- Ma, J.; Jia, X.; Zha, T.; Charles, P.-A.B.; Tian, Y.; Bai, Y.; Liu, P.; Yang, R.; Li, C.; Li, C.; et al. Ecosystem Water Use Efficiency in a Young Plantation in Northern China and Its Relationship to Drought. Agric. For. Meteorol. 2019, 275, 1–10. [Google Scholar] [CrossRef]
- Wang, H.; Li, X.; Xiao, J.; Ma, M. Evapotranspiration Components and Water Use Efficiency from Desert to Alpine Ecosystems in Drylands. Agric. For. Meteorol. 2021, 298–299, 108283. [Google Scholar] [CrossRef]
- Zheng, C.; Wang, S.; Chen, J.; Xiang, N.; Sun, L.; Chen, B.; Fu, Z.; Zhu, K.; He, X. Divergent Impacts of VPD and SWC on Ecosystem Carbon-Water Coupling under Different Dryness Conditions. Sci. Total Environ. 2023, 905, 167007. [Google Scholar] [CrossRef] [PubMed]
- Sulman, B.N.; Roman, D.T.; Yi, K.; Wang, L.; Phillips, R.P.; Novick, K.A. High Atmospheric Demand for Water Can Limit Forest Carbon Uptake and Transpiration as Severely as Dry Soil. Geophys. Res. Lett. 2016, 43, 9686–9695. [Google Scholar] [CrossRef]
- Li, M.; Liu, A.; Zou, C.; Xu, W.; Shimizu, H.; Wang, K. An Overview of the “Three-North” Shelterbelt Project in China. For. Stud. China 2012, 14, 70–79. [Google Scholar] [CrossRef]
- Sugden, A.M. Global Ecosystem Thresholds Driven by Aridity. Science 2020, 367, 787–790. [Google Scholar] [CrossRef]
- Feng, X.; Fu, B.; Piao, S.; Wang, S.; Ciais, P.; Zeng, Z.; Lü, Y.; Zeng, Y.; Li, Y.; Jiang, X.; et al. Revegetation in China’s Loess Plateau Is Approaching Sustainable Water Resource Limits. Nat. Clim. Chang. 2016, 6, 1019–1022. [Google Scholar] [CrossRef]


| Type | Source | Product | Resolution | Time Series |
|---|---|---|---|---|
| Meteorological data | China Meteorological Data Service Center (https://data.cma.cn/) | V3 Datest | 1 day | 2001–2020 |
| GPP | Google Earth Engine (GEE) (https://earthengine.google.com) | NASA LP DAAC MOD17A2H | 500 m 8 days | 2001–2020 |
| ET | Google Earth Engine (GEE) (https://earthengine.google.com) | NASA LP DAAC MOD16A2 | 500 m 8 days | 2001–2020 |
| LAI | Google Earth Engine (GEE) (https://earthengine.google.com) | NASA LP DAAC MOD15A2H | 500 m 8 days | 2001–2020 |
| SWC | European Centre for Medium-Range Weather Forecasts (ECMWF) (https://www.ecmwf.int/) | Global Climate Atmospheric Reanalysis (ERA5) | 0.1° 1 month | 2001–2020 |
| Land Cover (Lanct) | Zenodo (https://zenodo.org/) | CLCD (Yang and Huang, 2021) | 30 m 1 year | 2001–2020 |
| Vegetation type (Veget) | https://www.resdc.cn/ | 1 km | 2001 (Publication time) | |
| Soil type (Soilt) | https://www.resdc.cn/ | 1 km | 1995 | |
| Geomorphic type (Geomt) | https://www.resdc.cn/ | 1 km | 2009 (Publication time) | |
| Elevation data (Elev) | Geospatial Data Cloud (https://www.gscloud.cn) | SRTMDEMUTM 90M | 90 m | — |
| Gross Domestic Product (GDP) | Recourse and Environment Science and Date Center (https://www.resdc.cn/) | Kilometer Grid Dataset of China’s GDP Spatial Distribution | 1 km | 2000, 2005, 2010, 2015, 2019 |
| Population (POP) | Recourse and Environment Science and Date Center (https://www.resdc.cn/) | Kilometer Gridded Dataset of Chinese Population Spatial Distribution | 1 km | 2000, 2005, 2010, 2015, 2019 |
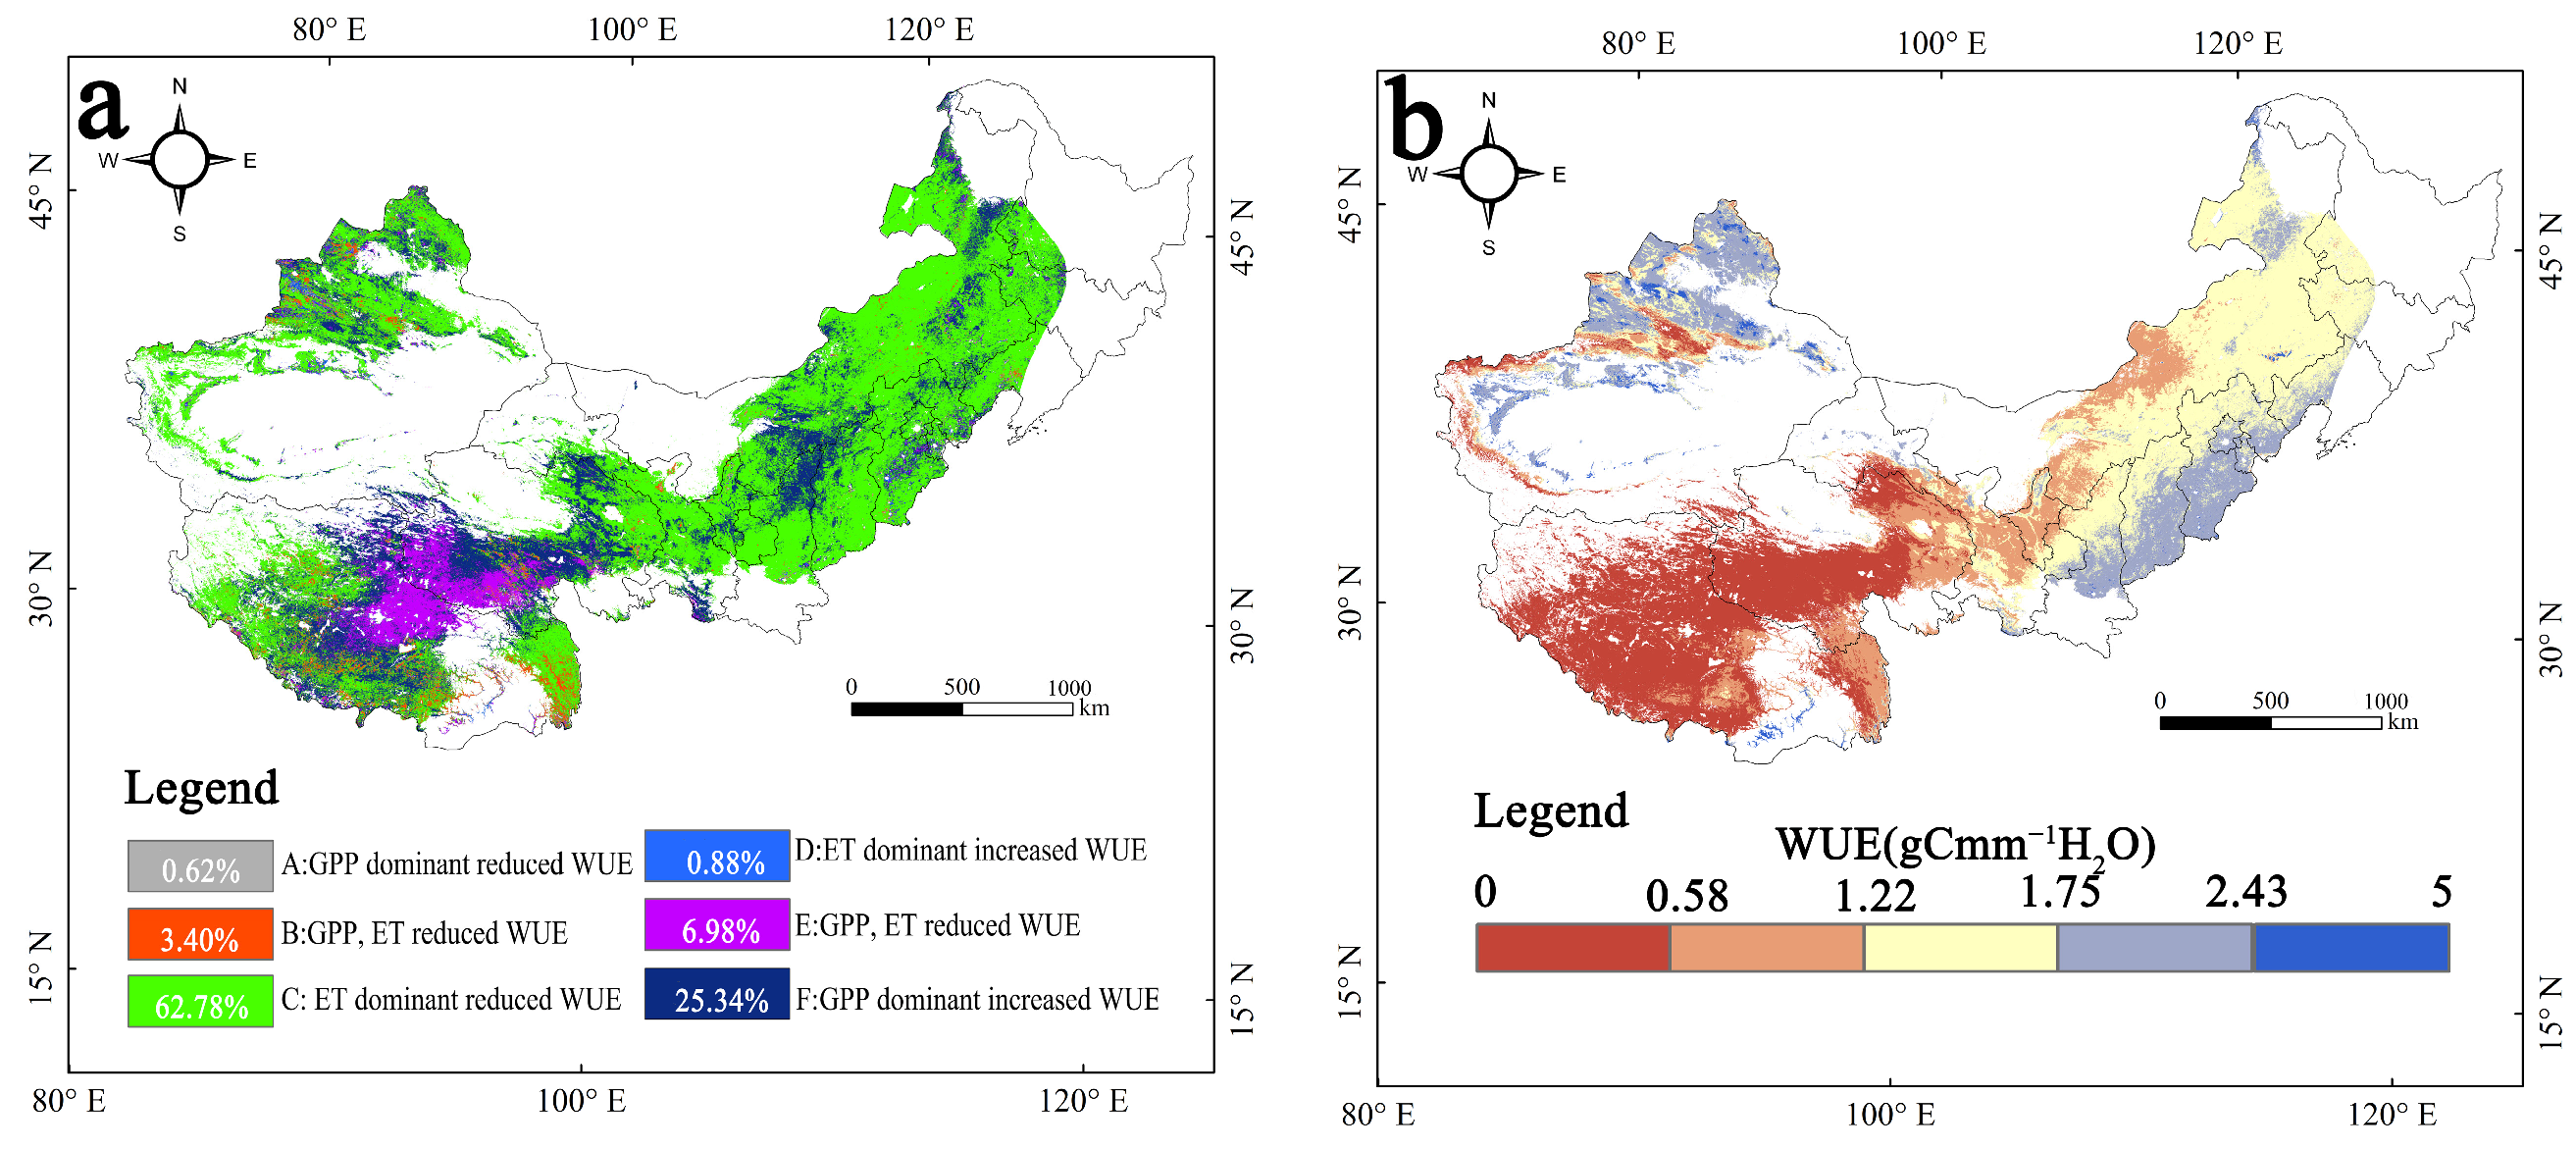
| Pattern Name | Trend | |
|---|---|---|
| Pattern A | 0 | GPP dominant reduced WUE |
| Pattern B | 0 | GPP, ET reduced WUE |
| Pattern C | 0 | ET dominant reduced WUE |
| Pattern D | 0 | ET dominant increased WUE |
| Pattern E | 0 | GPP, ET increased WUE |
| Pattern F | 0 | GPP dominant increased WUE |
| Driving Force Partition | Contribution of Driving Forces/% | |||
|---|---|---|---|---|
| SlopeWUEobs | SlopeWUEcli | SlopeWUEres | Climate Change | Human Activities |
| >0 | >0 | >0 | SlopeNPPcli/Slope NPPobs | Slopewueres/slopewueobs |
| >0 | <0 | 100 | 0 | |
| <0 | >0 | 0 | 100 | |
| <0 | <0 | <0 | −slopewueobs/slopewueobs | −Slopewueres/slopewueobs |
| <0 | >0 | −100 | 0 | |
| >0 | <0 | 0 | −100 | |
| Judgment Criteria | Type |
|---|---|
| q(X1 ∩ X2) < Min(q(X1), q(X2)) | Weaken, nonlinear |
| Min(q(X1), q(X2))) < q(X1∩X2)) < Max(q(X1), q(X2)) | Weaken, uni- |
| q(X1 ∩ X2) > Max(q(X1), q(X2)) | Enhance, bi- |
| q(X1 ∩ X2) = q(X1) + q(X2) | Independent |
| q(X1 ∩ X2) > q(X1) + q(X2) | Enhance, nonlinear |
| WUE | GPP | ET | ||||||||||
|---|---|---|---|---|---|---|---|---|---|---|---|---|
| Prec | Tem | VPD | Solra | Prec | Tem | VPD | Solra | Prec | Tem | VPD | Solra | |
| China’s drylands | 25.58% | 24.96% | 23.54% | 25.92% | 31.47% | 21.82% | 22.78% | 23.93% | 33.31% | 24.14% | 20.96% | 21.59% |
| Coniferous forest | 25.93% | 23.63% | 24.35% | 26.09% | 28.18% | 23.39% | 23.67% | 24.76% | 29.68% | 24.32% | 22.34% | 23.66% |
| Mixed forest | 25.01% | 24.70% | 27.63% | 22.65% | 26.49% | 15.95% | 26.44% | 31.12% | 23.02% | 22.21% | 26.55% | 28.22% |
| Broadleaf forest | 26.30% | 22.78% | 22.80% | 28.12% | 33.56% | 19.88% | 23.26% | 23.30% | 33.04% | 21.93% | 22.29% | 22.74% |
| Shrub | 25.45% | 25.16% | 24.05% | 25.34% | 31.57% | 20.61% | 23.98% | 23.83% | 32.08% | 23.09% | 22.11% | 22.72% |
| Desert | 25.67% | 27.15% | 23.28% | 23.90% | 29.26% | 23.37% | 26.14% | 21.23% | 29.53% | 26.71% | 22.97% | 20.79% |
| Grassland | 25.23% | 24.73% | 23.99% | 26.05% | 31.35% | 22.06% | 22.98% | 23.61% | 34.20% | 24.78% | 20.57% | 20.45% |
| Swamp | 28.34% | 24.70% | 24.19% | 22.77% | 23.12% | 19.13% | 25.33% | 32.42% | 24.91% | 21.60% | 25.76% | 27.73% |
| Alpine vegetation | 27.42% | 24.57% | 22.42% | 25.59% | 23.91% | 25.50% | 24.80% | 25.79% | 31.46% | 26.21% | 21.47% | 20.86% |
| Cultivated vegetation | 25.66% | 25.47% | 22.67% | 26.20% | 35.14% | 20.05% | 19.84% | 24.97% | 33.67% | 21.97% | 20.25% | 24.11% |
| Year | Rank of Interactive Explanatory Power (Top Seven) |
|---|---|
| 2001 | Soilt∩Geomt = 0.787 > Soilt∩Elev = 0.780 > GPP∩ET = 0.766 > Soilt∩GPP = 0.765 > GPP∩Geomt = 0.760 > Soilt∩Solra = 0.758 > GPP∩Elev = 0.757 |
| 2005 | GPP∩ET = 0.788 > Soilt∩Geomt = 0.785 > Soilt∩Elev = 0.780 > GPP∩Elev = 0.774 > Soilt∩GPP = 0.771 > GPP∩Geomt = 0.763 > Elev∩NDVI = 0.758 |
| 2010 | GPP∩ET = 0.786 > Soilt∩Geomt = 0.769 > Soilt∩Solra = 0.758 > Soilt∩GPP = 0.757 > Soilt∩Elev = 0.752 > GPP∩Geomt = 0.745 > GPP∩Elev = 0.741 |
| 2015 | GPP∩ET = 0.797 > Soilt∩Geomt = 0.785 > Soilt∩Elev = 0.778 > Soilt∩GPP = 0.775 > GPP∩Elev = 0.761 > Soilt∩Solra = 0.760 > GPP∩Geomt = 0.753 |
| 2020 | GPP∩ET = 0.789 > Soilt∩Geomt = 0.784 > Soilt∩GPP = 0.779 > Soilt∩Elev = 0.775 > GPP∩Elev = 0.761 > GPP∩Geomt = 0.755 > Relah∩Soilt = 0.744 |
Disclaimer/Publisher’s Note: The statements, opinions and data contained in all publications are solely those of the individual author(s) and contributor(s) and not of MDPI and/or the editor(s). MDPI and/or the editor(s) disclaim responsibility for any injury to people or property resulting from any ideas, methods, instructions or products referred to in the content. |
© 2024 by the authors. Licensee MDPI, Basel, Switzerland. This article is an open access article distributed under the terms and conditions of the Creative Commons Attribution (CC BY) license (https://creativecommons.org/licenses/by/4.0/).
Share and Cite
Tang, K.; He, L.; Guo, J.; Jiang, Q.; Wan, L. The Contributions of Climate and Human Activities to Water Use Efficiency in China’s Drylands. Forests 2024, 15, 528. https://doi.org/10.3390/f15030528
Tang K, He L, Guo J, Jiang Q, Wan L. The Contributions of Climate and Human Activities to Water Use Efficiency in China’s Drylands. Forests. 2024; 15(3):528. https://doi.org/10.3390/f15030528
Chicago/Turabian StyleTang, Kexin, Liang He, Jianbin Guo, Qunou Jiang, and Long Wan. 2024. "The Contributions of Climate and Human Activities to Water Use Efficiency in China’s Drylands" Forests 15, no. 3: 528. https://doi.org/10.3390/f15030528