
Impact of Forest Management on Wood Production under Climate Change in the Bonis Catchment


Abstract
:1. Introduction
2. Methodology
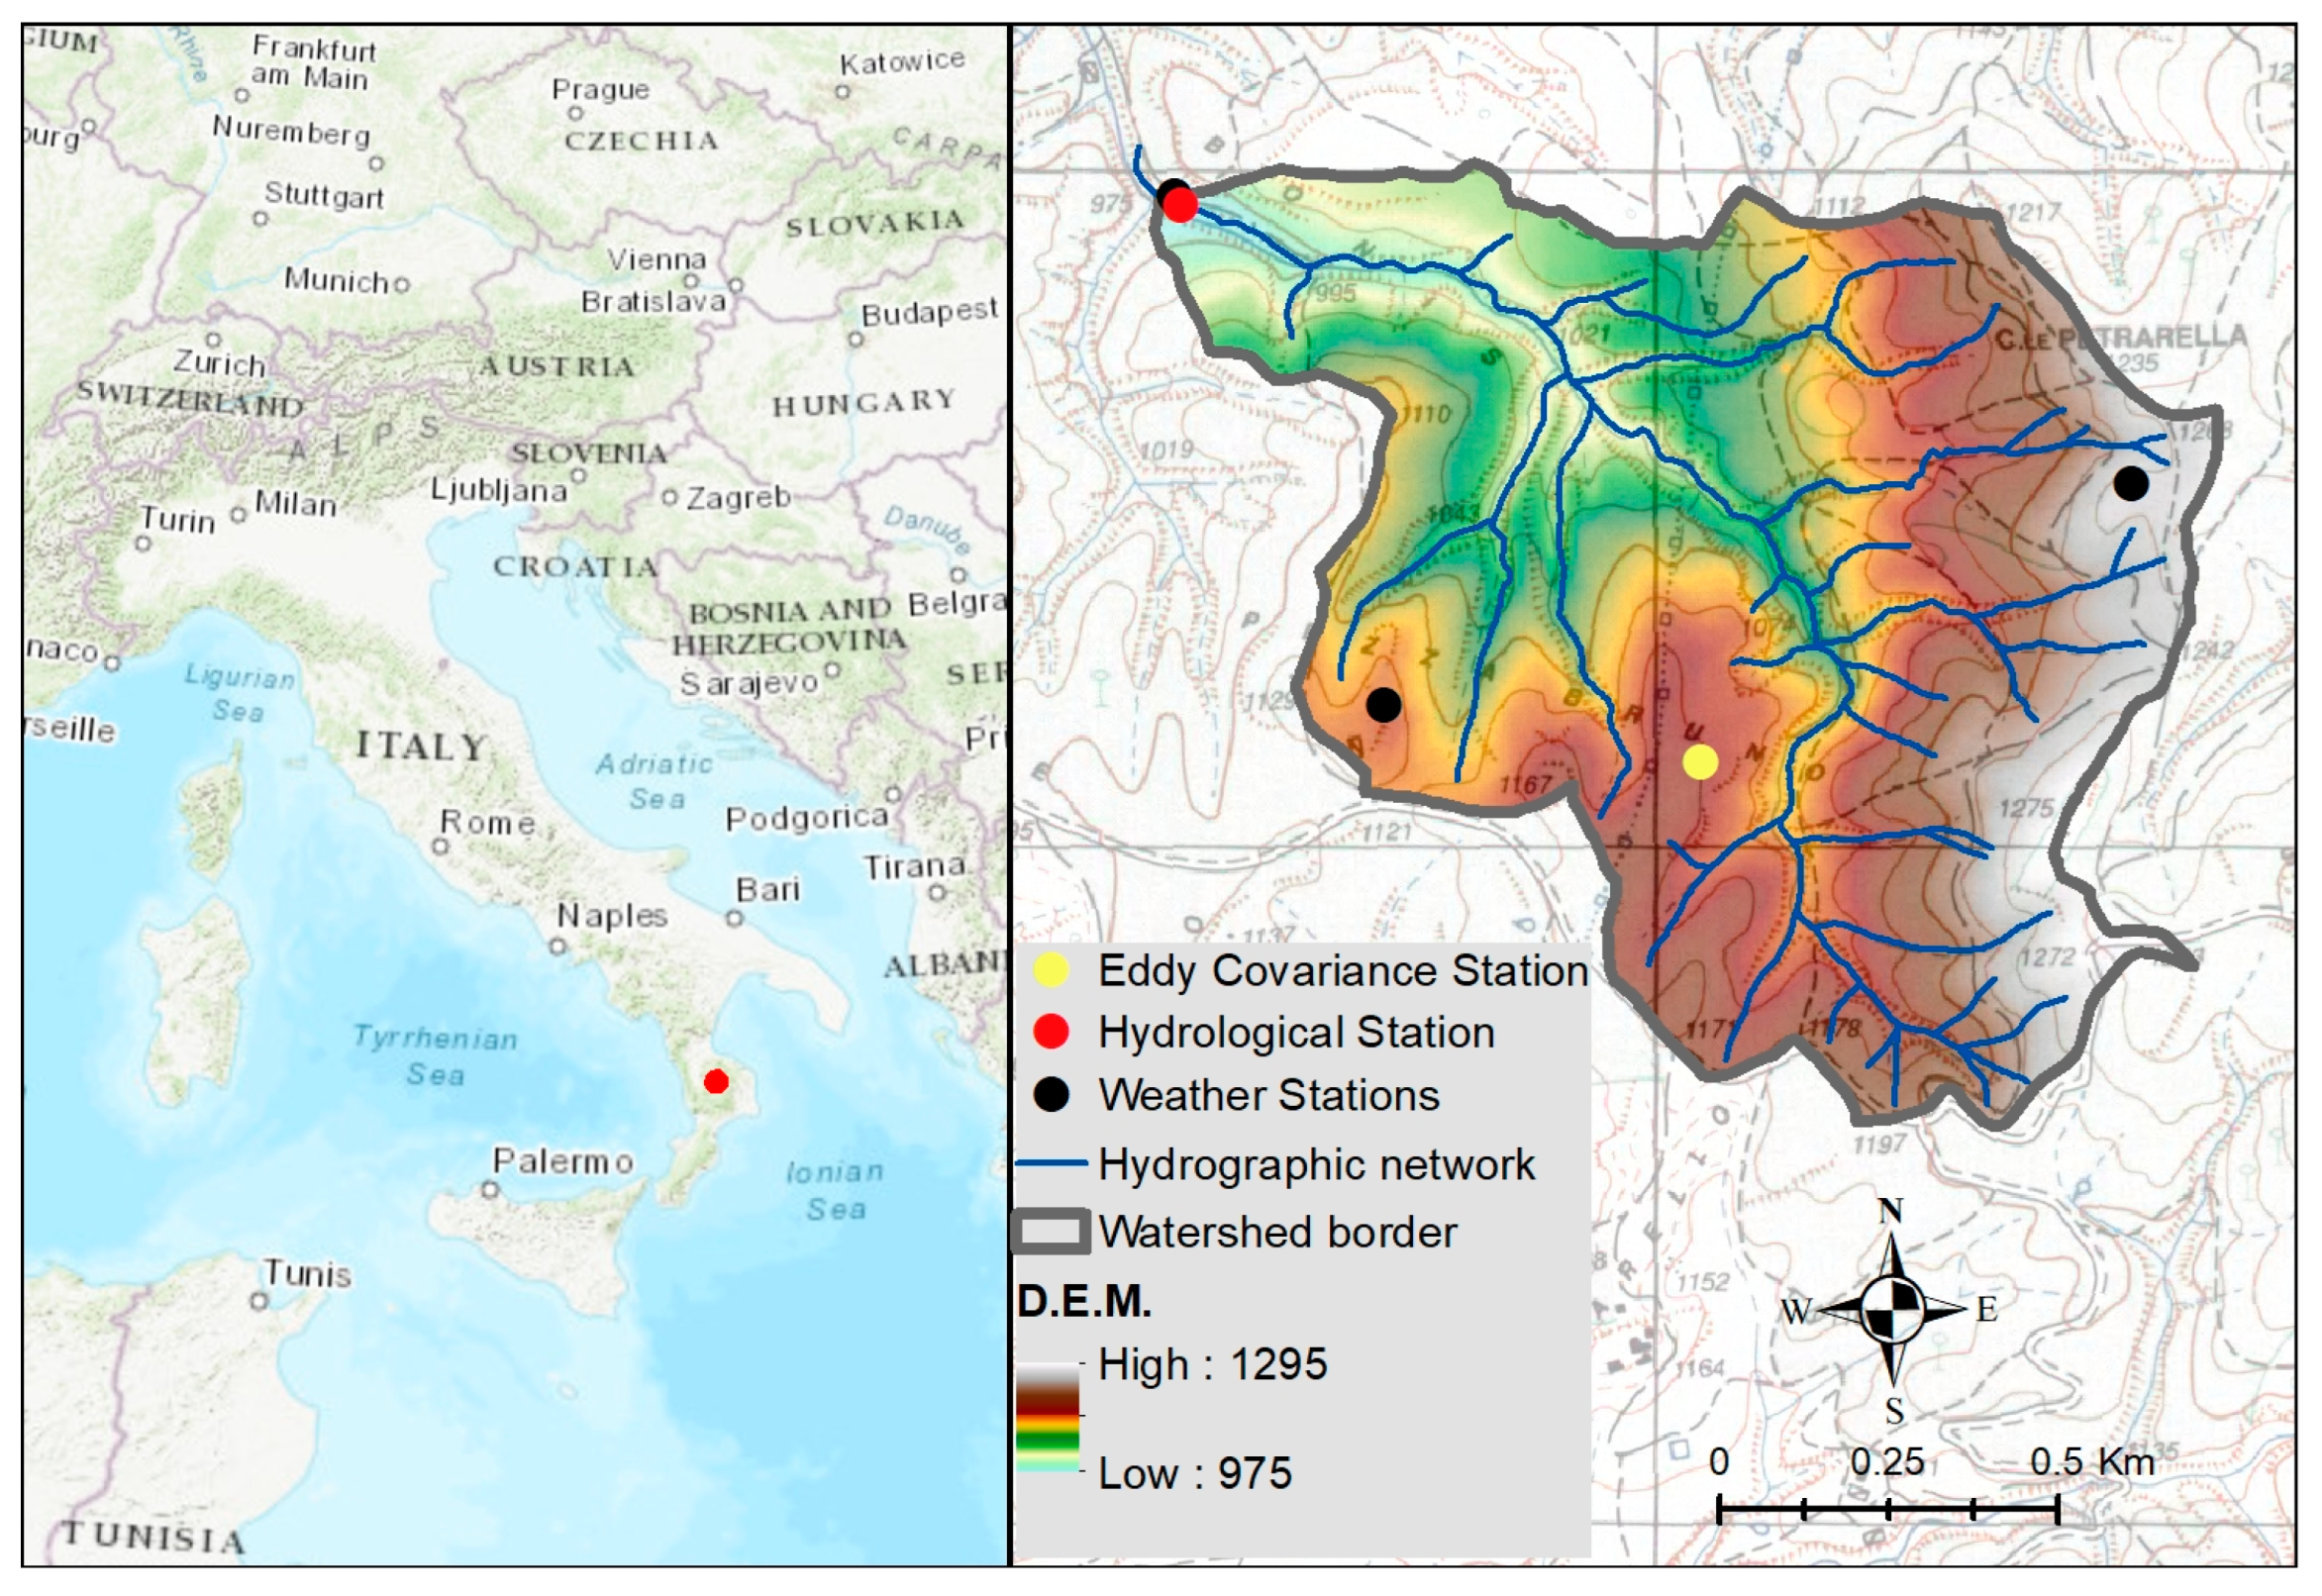
2.1. Study Site
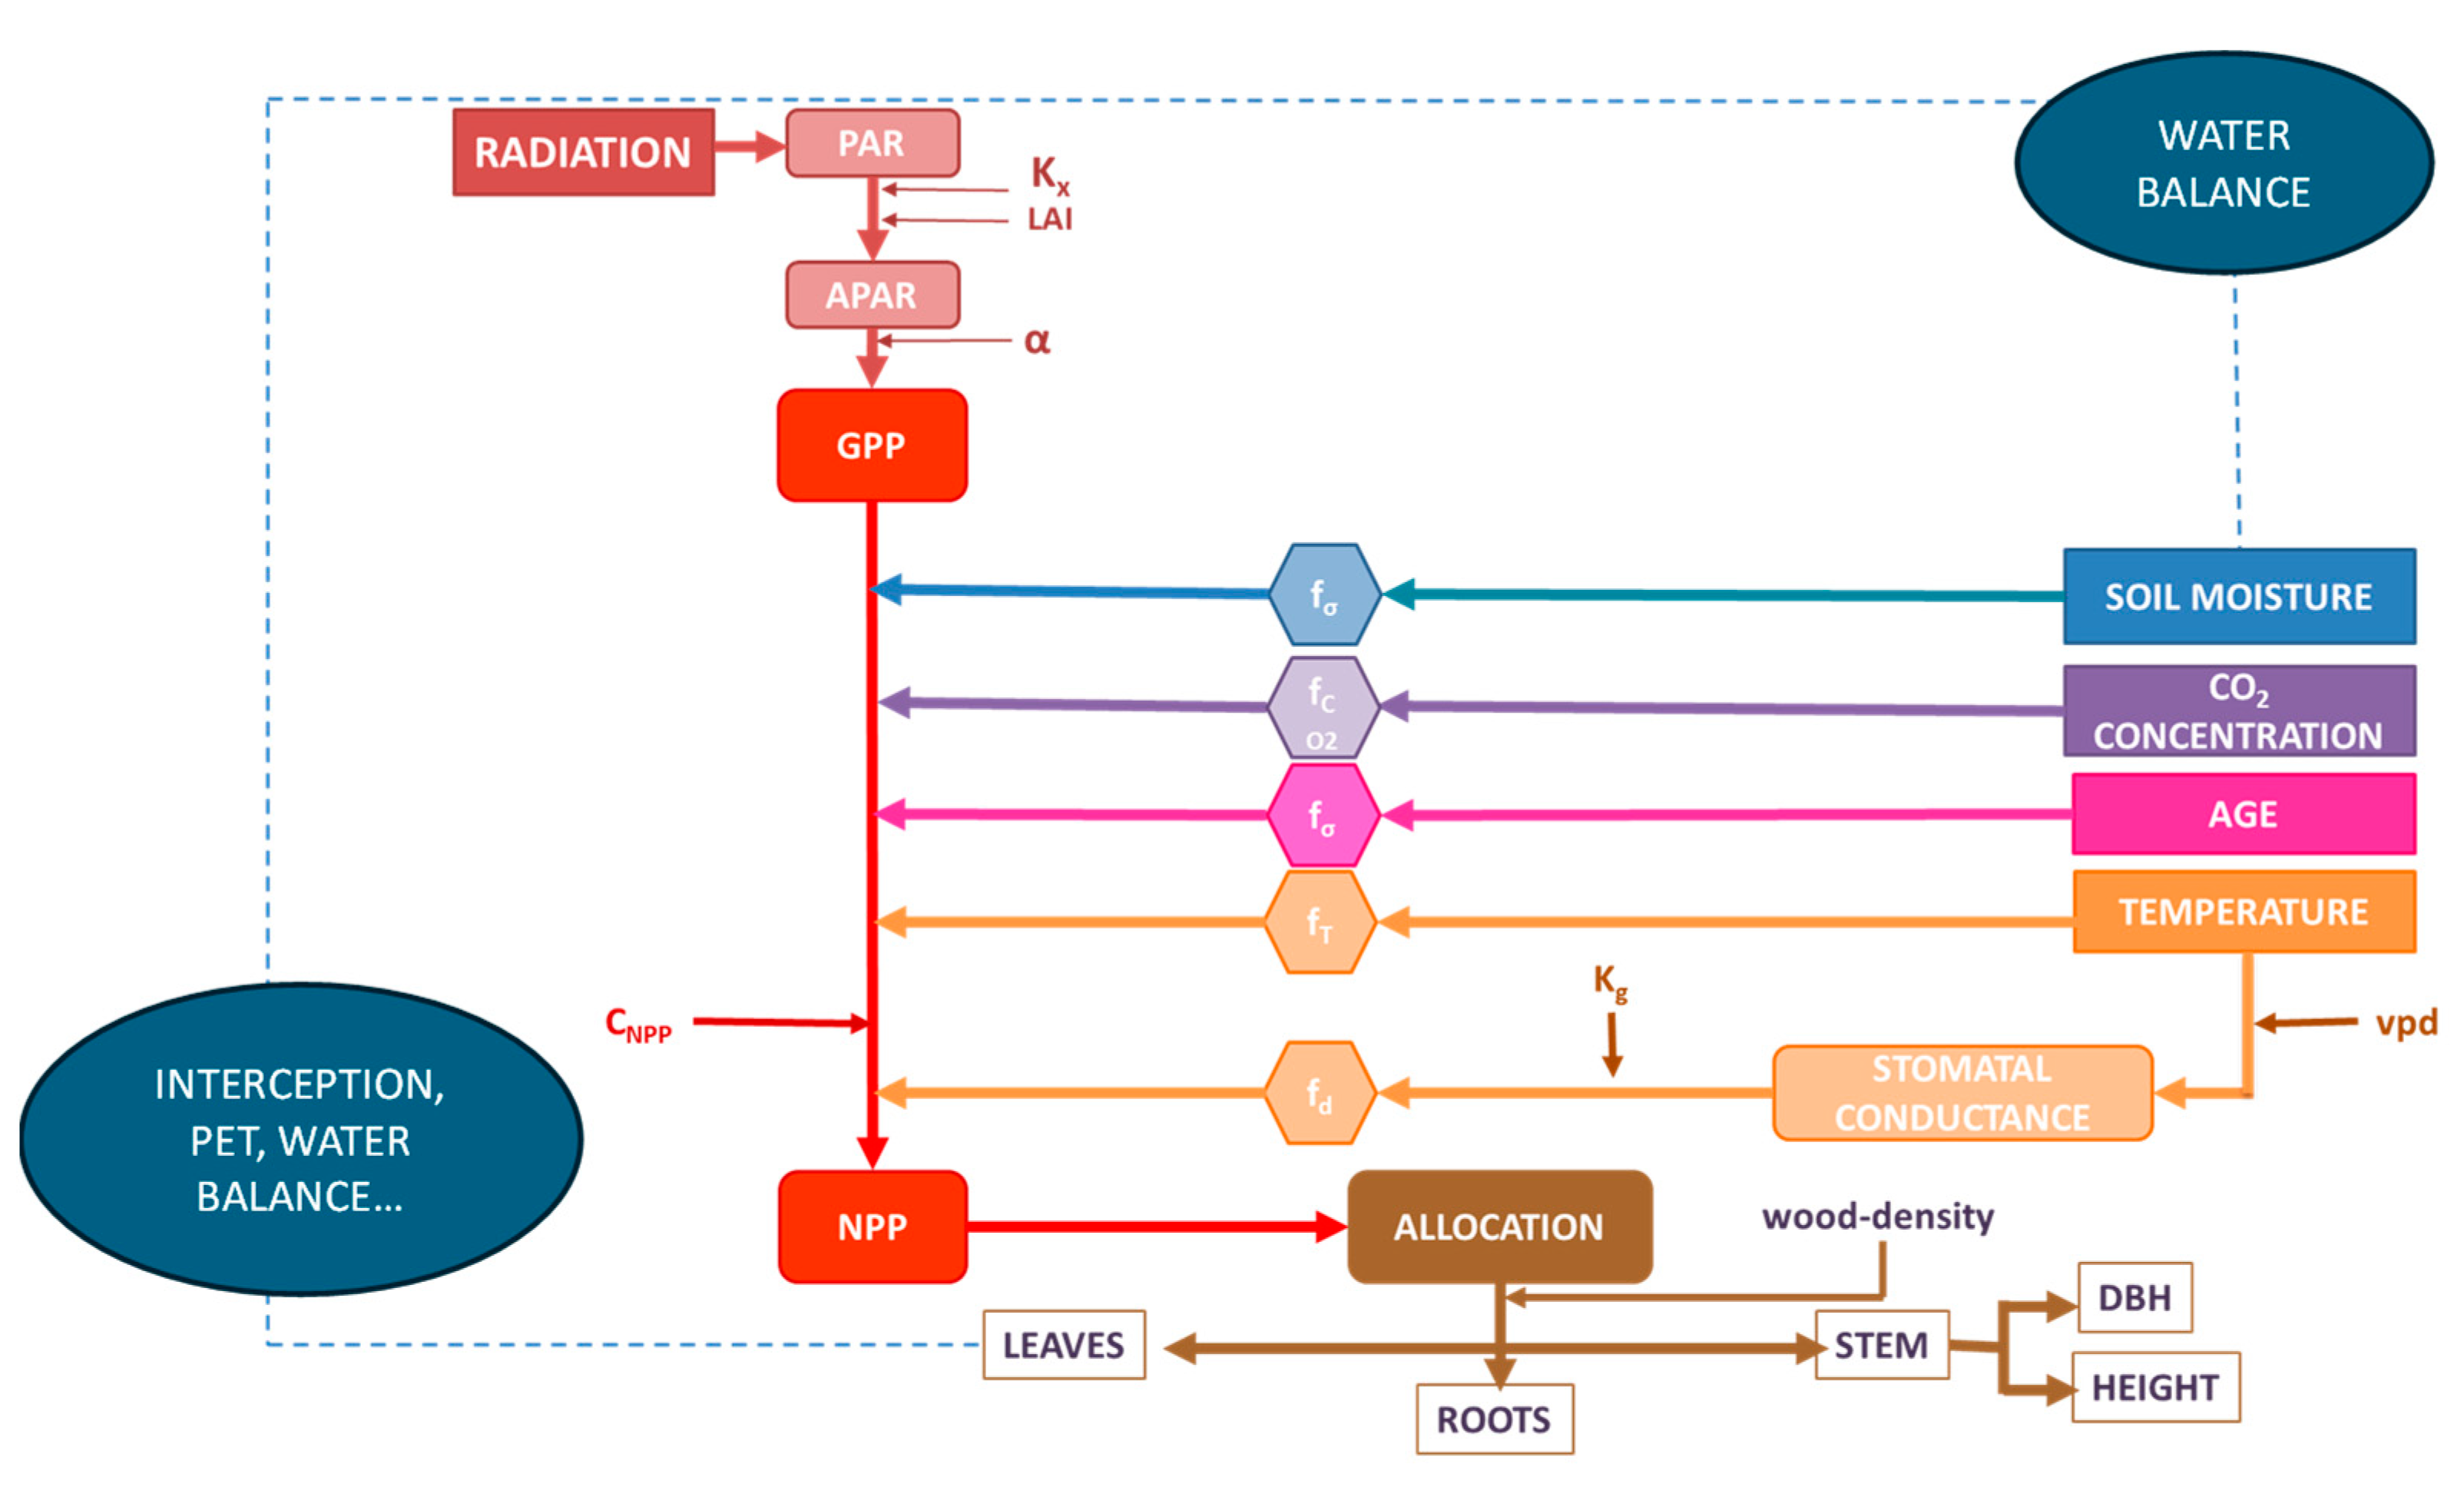
2.2. Model Description
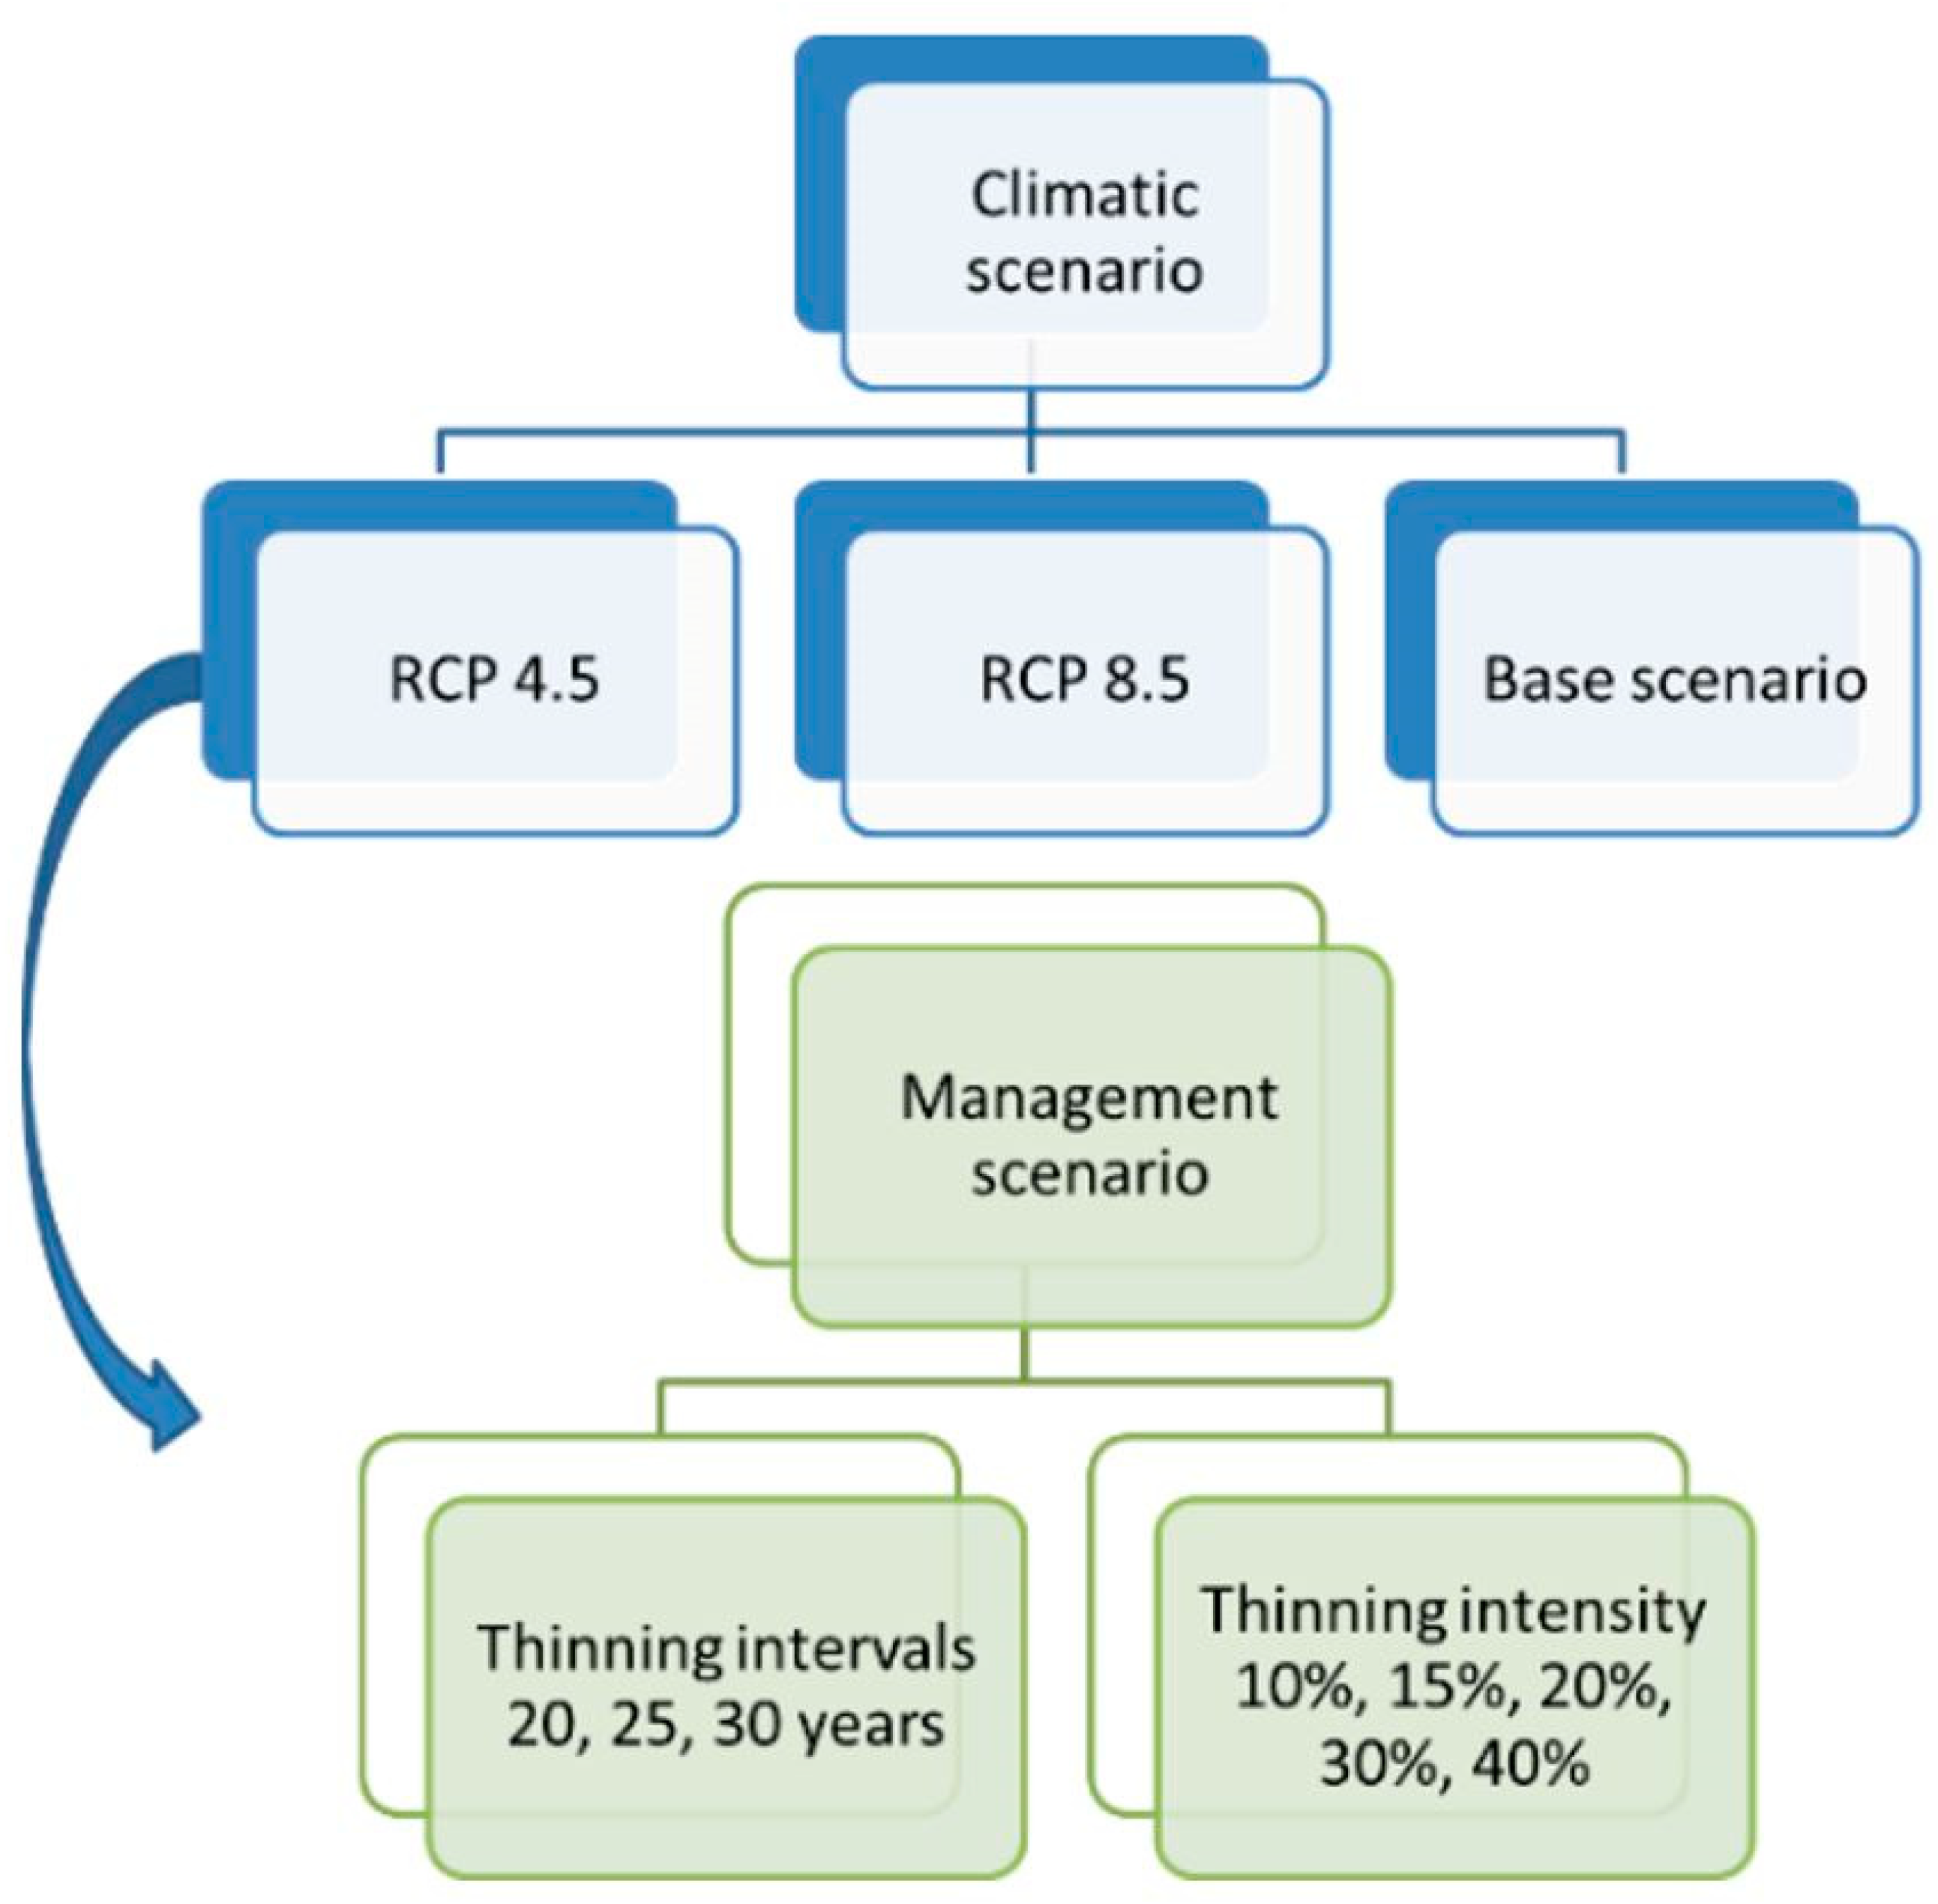
2.3. Management Scenarios
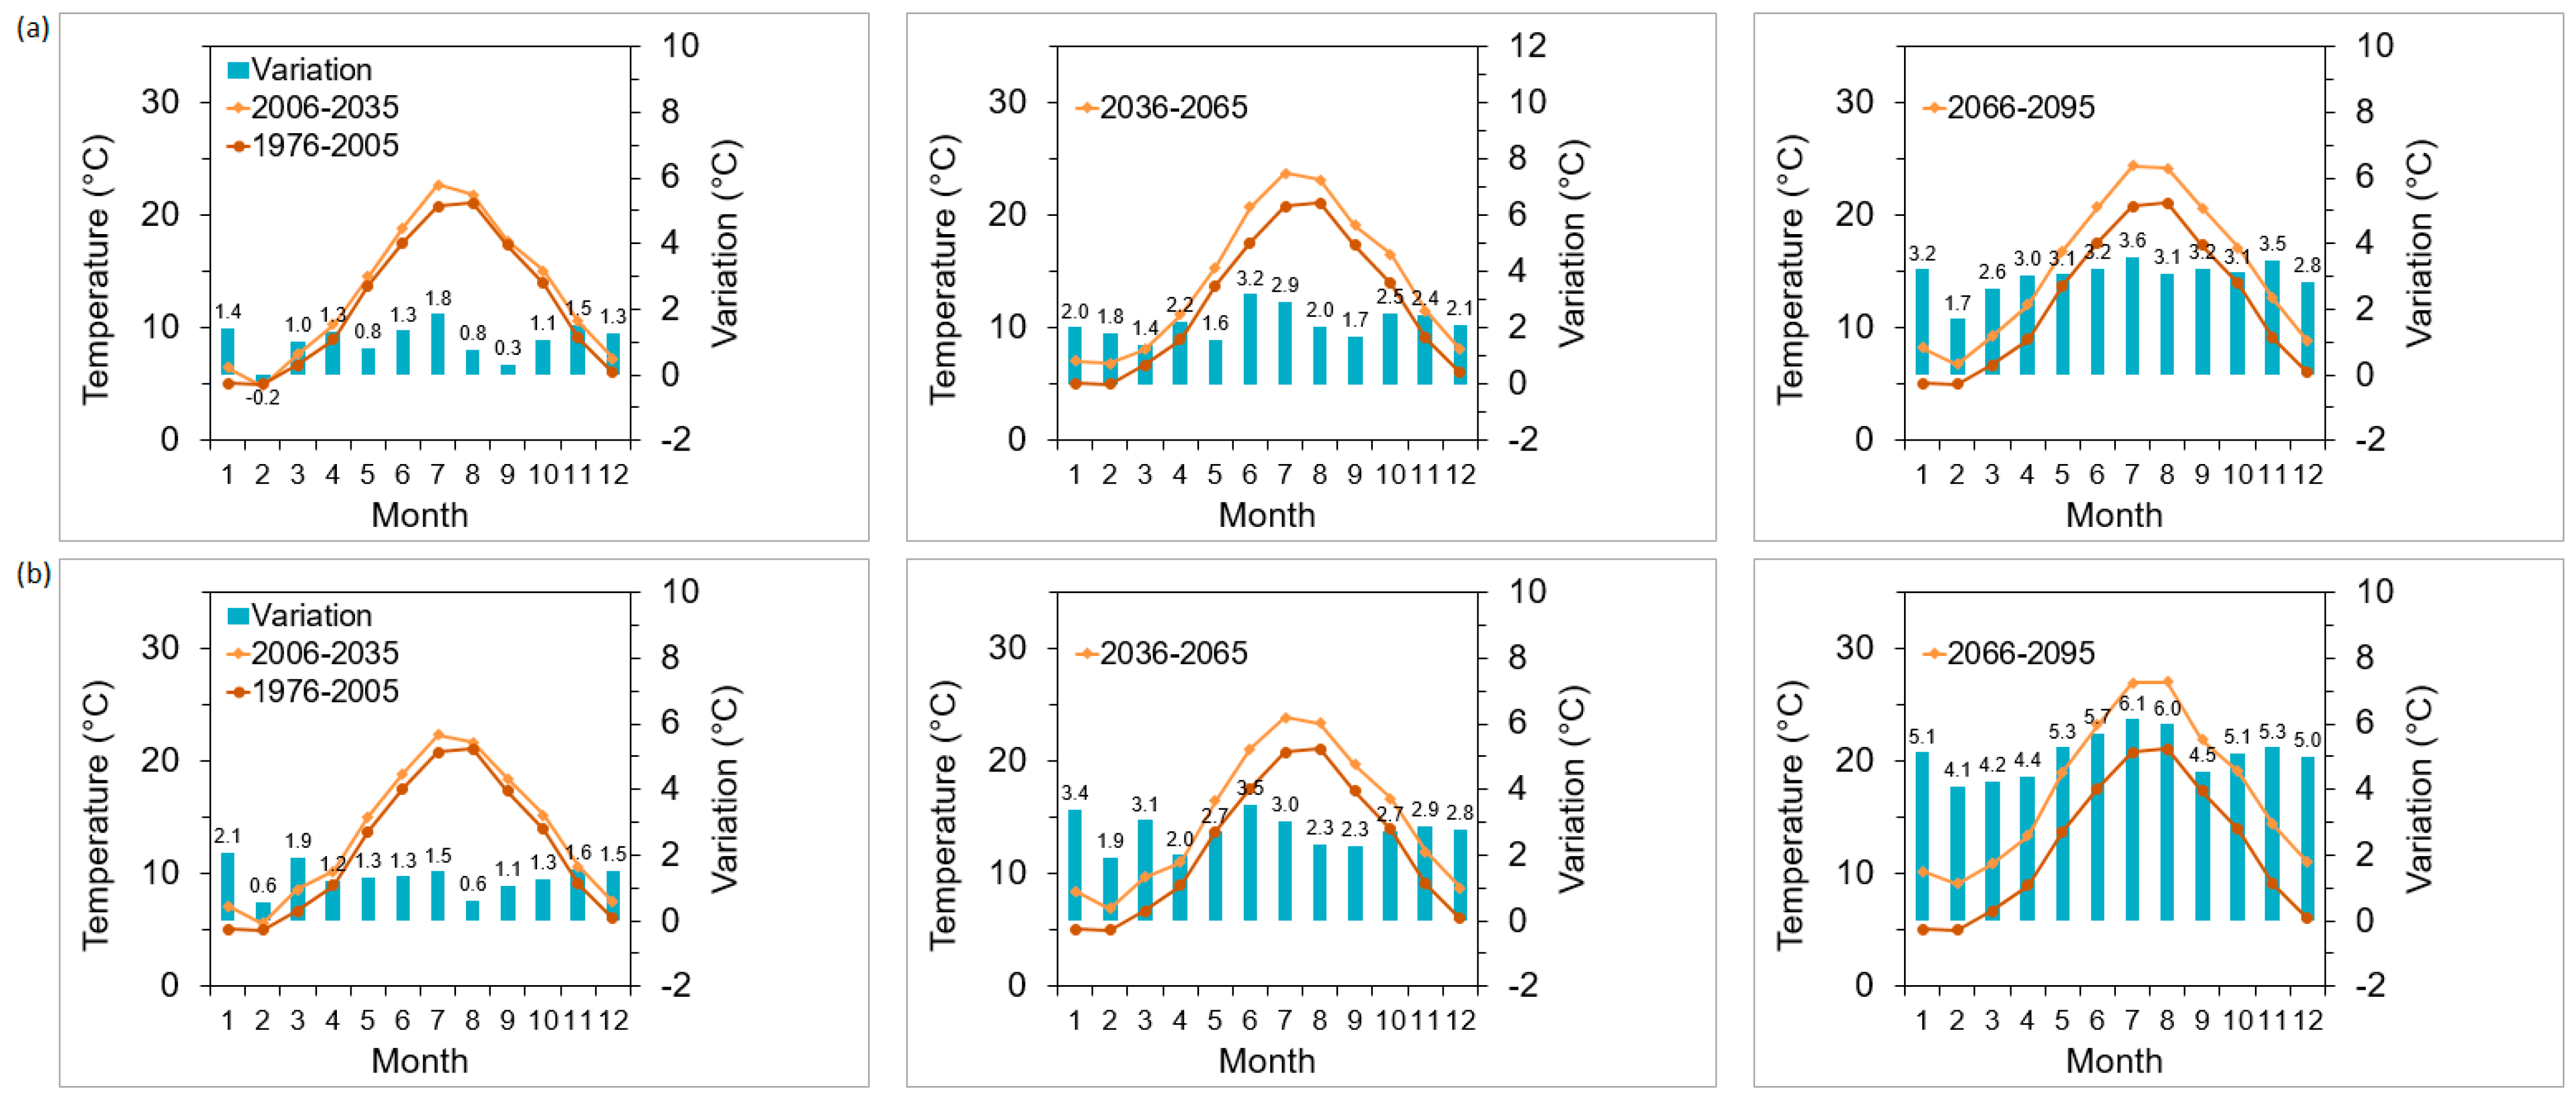
2.4. Climate Scenarios
3. Results and Discussion
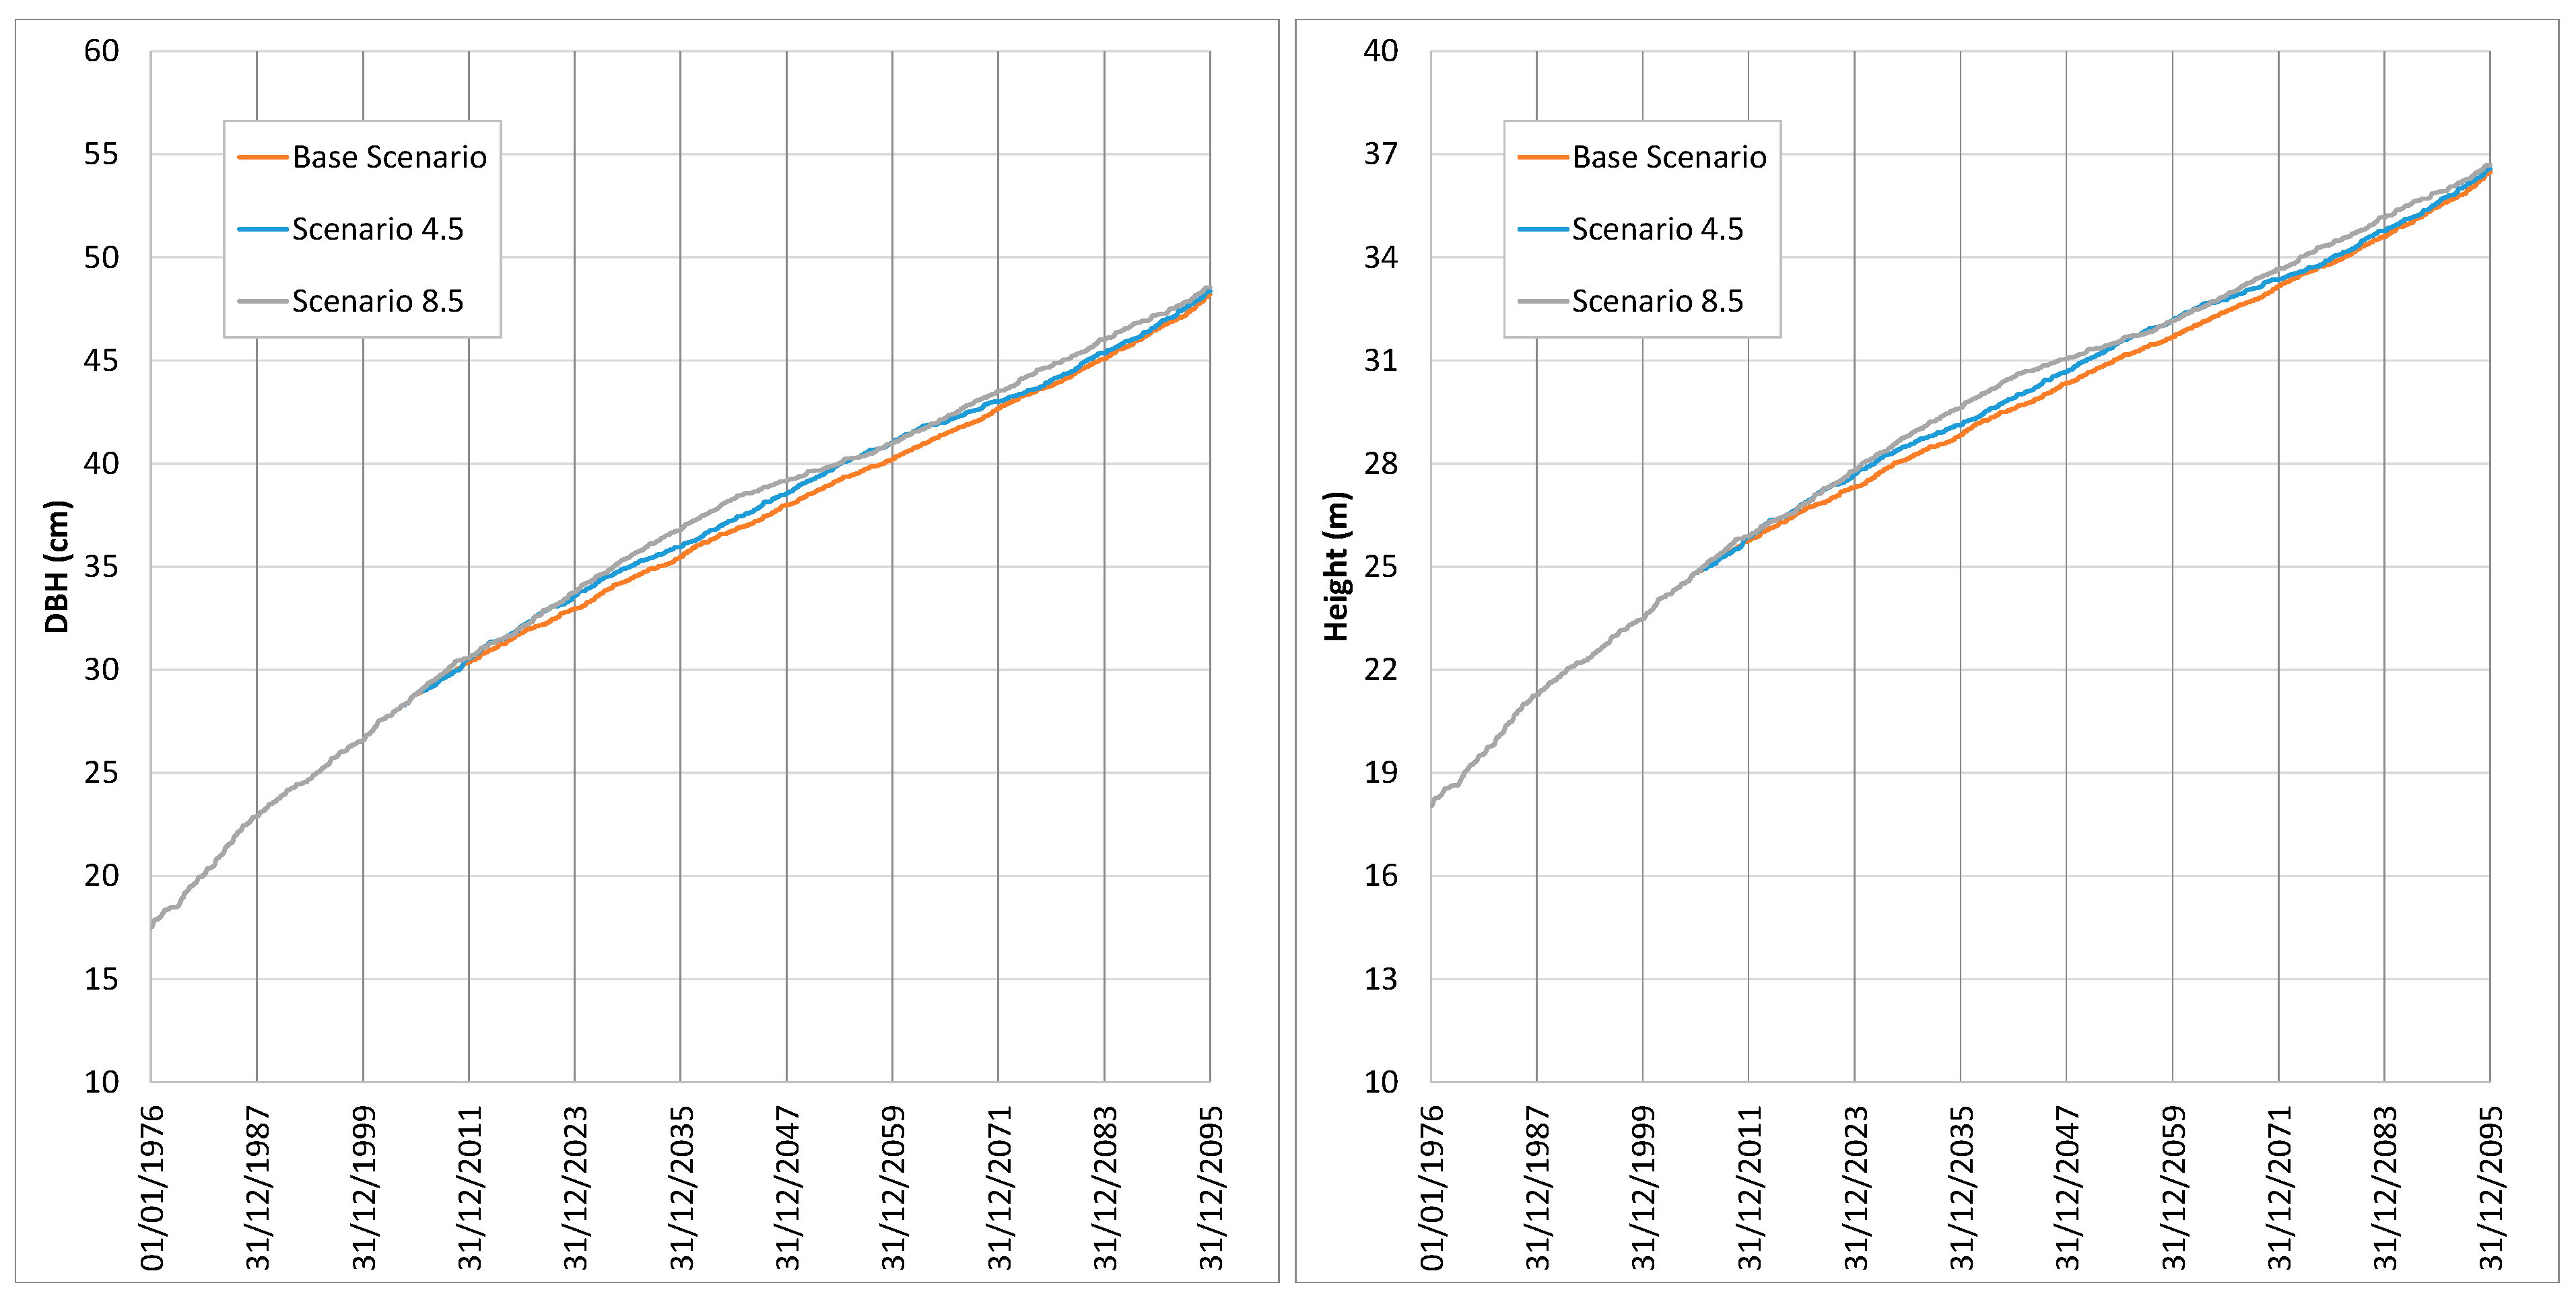
3.1. No-Management Option with Climate Scenario Simulations
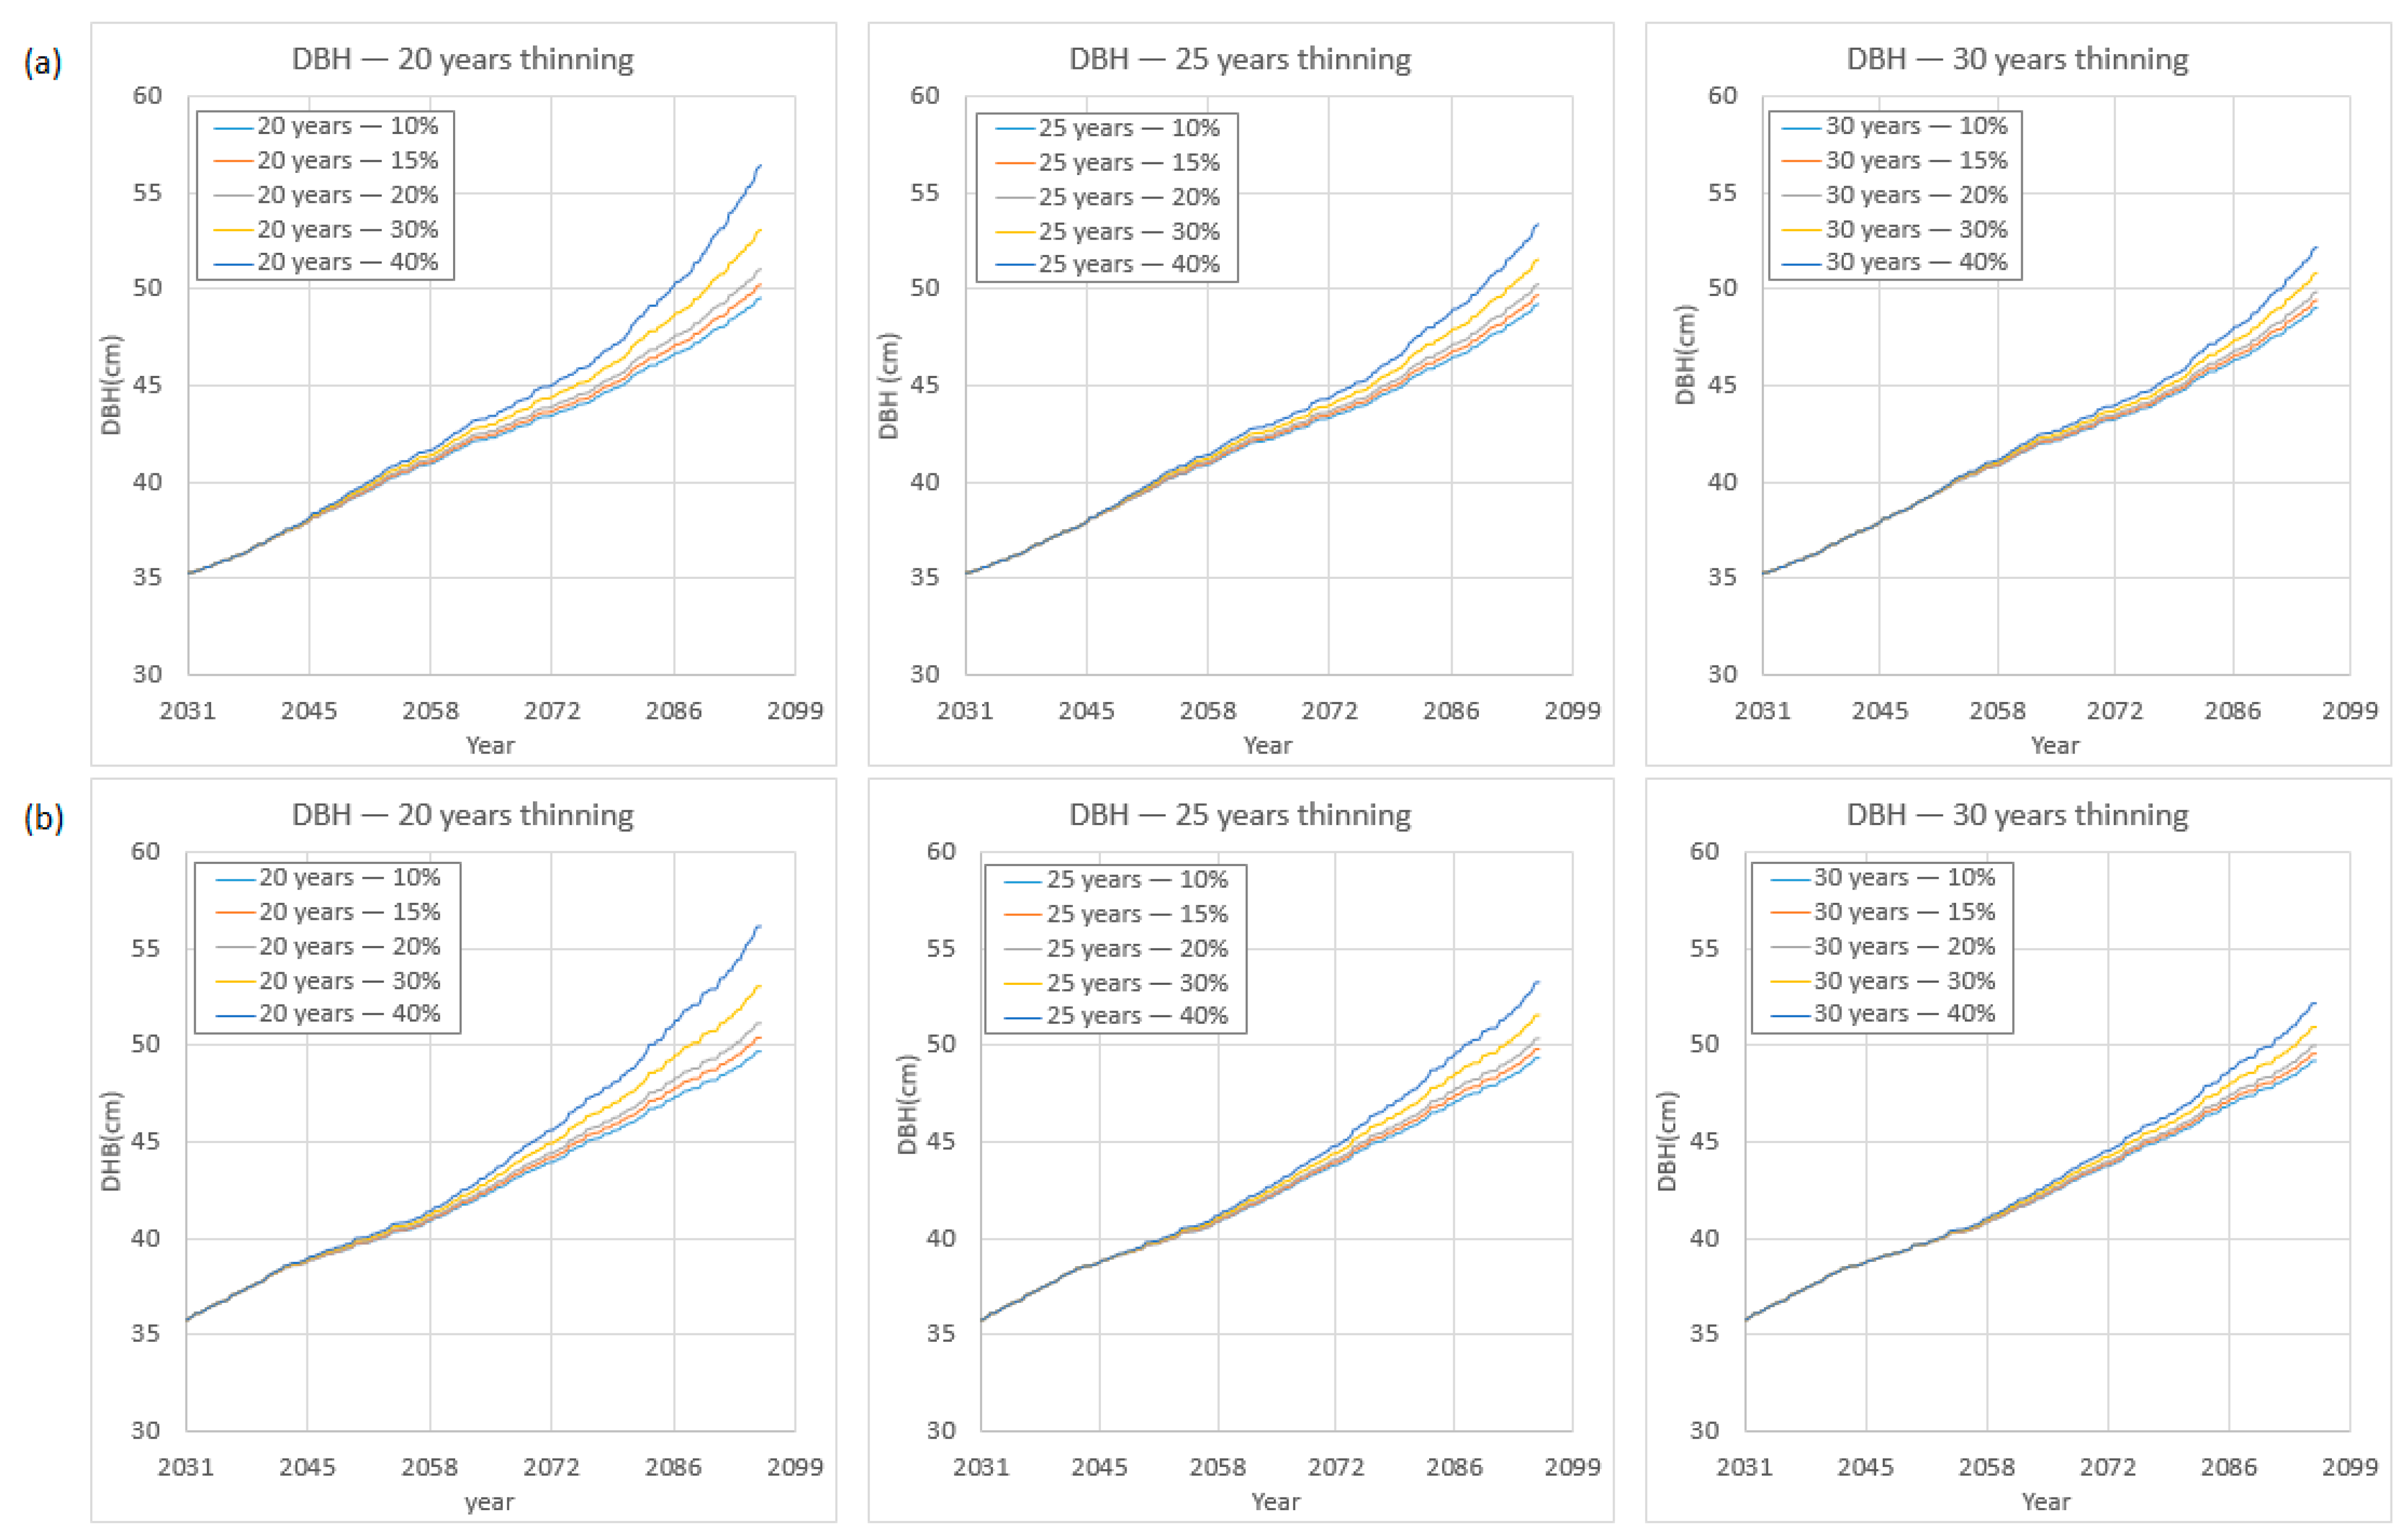
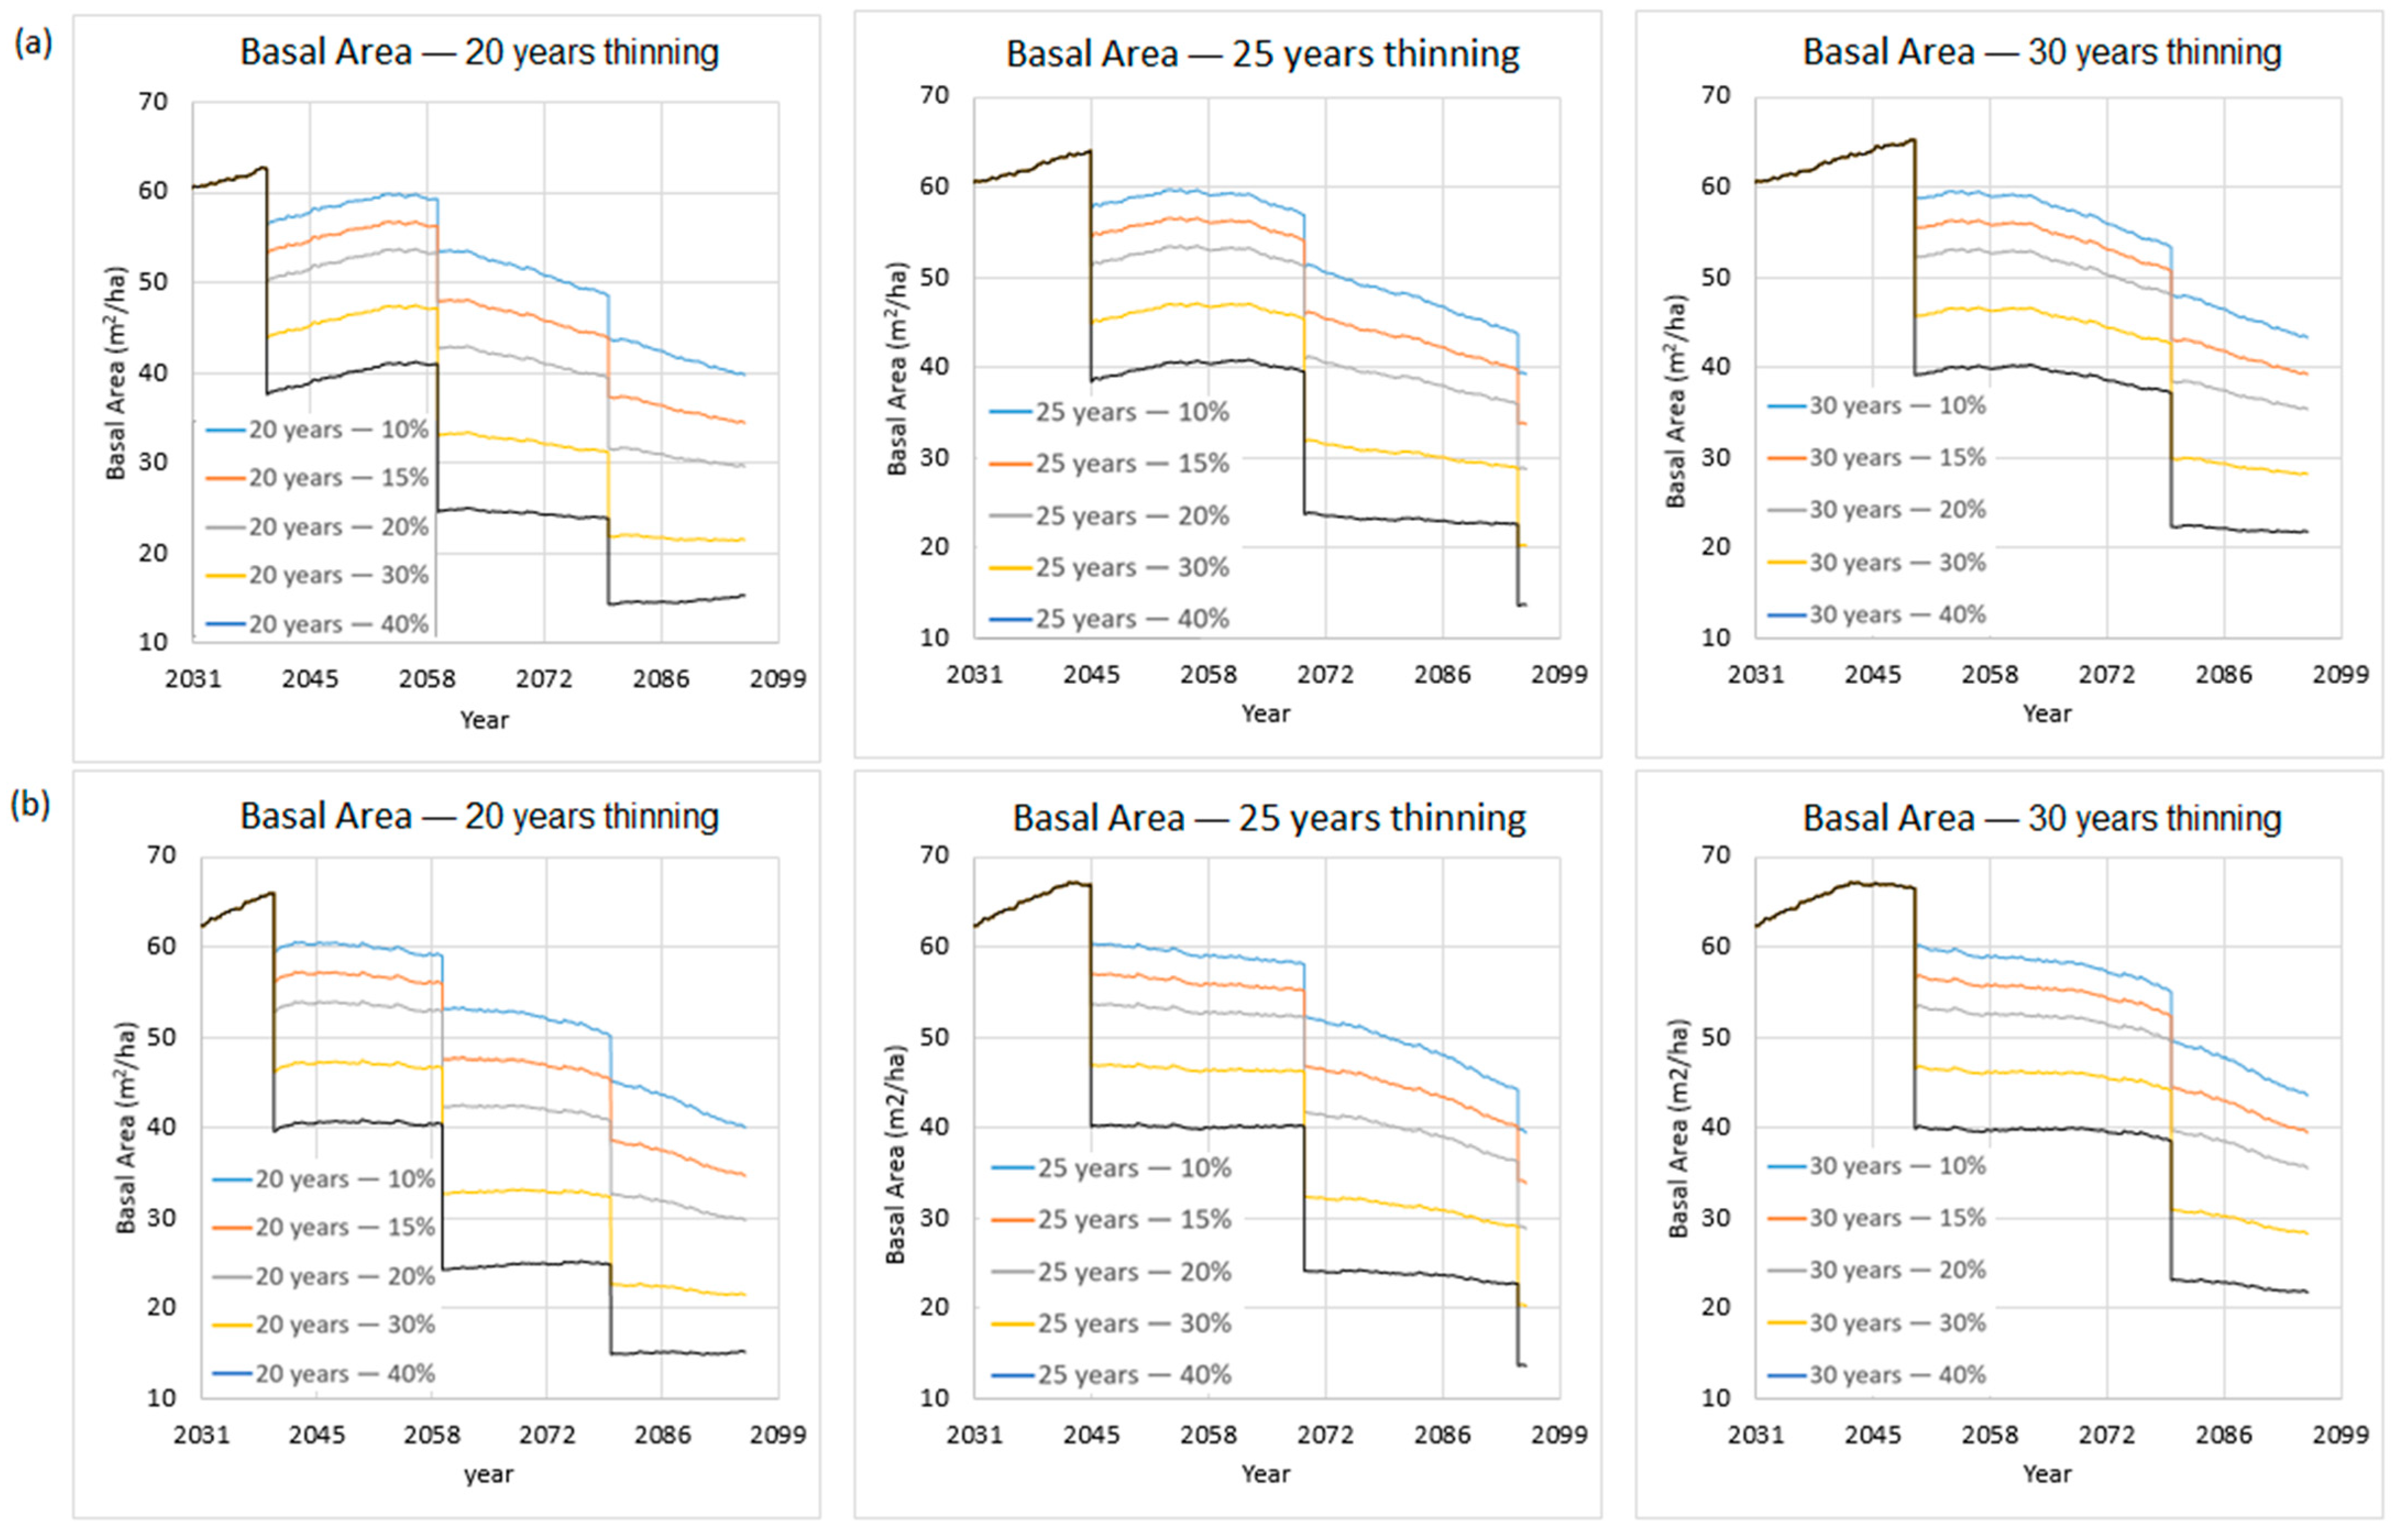
3.2. Management Options and Climate Change Scenario Simulations
4. Conclusions
Author Contributions
Funding
Data Availability Statement
Acknowledgments
Conflicts of Interest
References
- Bossel, H. TREEDYN3 forest simulation model. Ecol. Model. 1996, 90, 187–227. [Google Scholar] [CrossRef]
- Yousefpour, R.; Temperli, C.; Jacobsen, J.B.; Thorsen, B.J.; Meilby, H.; Lexer, M.J.; Lindner, M.; Bugmann, H.; Borges, J.G.; Palma, J.H.N.; et al. A framework for modeling adaptive forest management and decision making under climate change. Ecol. Soc. 2017, 22. Available online: https://www.jstor.org/stable/26799027 (accessed on 15 November 2022). [CrossRef]
- Sharma, M. Modelling climate effects on diameter growth of red pine trees in boreal Ontario, Canada. Trees For. People 2021, 4, 100064. [Google Scholar] [CrossRef]
- Aaheim, A.; Chaturvedi, R.K.; Sagadevan, A.A. Integrated modelling approaches to analysis of climate change impacts on forests and forest management. Mitig. Adapt. Strateg. Glob. Chang. 2011, 16, 247–266. [Google Scholar] [CrossRef]
- WCED. Our Common Future. Report of the World Commission on Environment and Development; United Nations: Geneva, Switzerland, 1987.
- Mäkelä, A.; Del Río, M.; Hynynen, J.; Hawkins, M.J.; Reyer, C.; Soares, P.; van Oijen, M.; Tomé, M. Using stand-scale forest models for estimating indicators of sustainable forest management. For. Ecol. Manag. 2012, 285, 164–178. [Google Scholar] [CrossRef]
- Caputo, J. Commoditization and the origins of American silviculture. Bull. Sci. Technol. Soc. 2012, 32, 86–95. [Google Scholar] [CrossRef]
- Niemelä, J.; Young, J.; Alard, D.; Askasibar, M.; Henle, K.; Johnson, R.; Kurttila, M.; Larsson, T.; Matouch, S.; Nowicki, P.; et al. Identifying, managing and monitoring conflicts between forest biodiversity conservation and other human interests in Europe. For. Policy Econ. 2005, 7, 877–890. [Google Scholar] [CrossRef]
- Fouqueray, T.; Latune, J.; Michel, T.; Frascaria-Lacoste, N. Interdisciplinary modeling and participatory simulation of forest management to foster adaptation to climate change. Environ. Model. Softw. 2022, 151, 105338. [Google Scholar] [CrossRef]
- Furstenau, C.; Badeck, F.W.; Lasch, P.; Lexer, M.J.; Lindner, M.; Mohr, P.; Suckow, F. Multiple-use forest management in consideration of climate change and the interests of stakeholder groups. Eur. J. For. Res. 2006, 126, 225–239. [Google Scholar] [CrossRef]
- Moreno, G.; Cubera, E. Impact of stand density on water status and leaf gas exchange in Quercus ilex. For. Ecol. Manag. 2008, 254, 74–84. [Google Scholar] [CrossRef]
- Sohn, J.A.; Saha, S.; Bauhus, J. Potential of forest thinning to mitigate drought stress: A meta-analysis. For. Ecol. Manag. 2016, 380, 261–273. [Google Scholar] [CrossRef]
- Navarro-Cerrillo, R.M.; Sánchez-Salguero, R.; Rodriguez, C.; Duque Lazo, J.; Moreno-Rojas, J.M.; Palacios-Rodriguez, G.; Camarero, J.J. Is thinning an alternative when trees could die in response to drought? The case of planted Pinus nigra and P. sylvestris stands in southern Spain. For. Ecol. Manag. 2019, 433, 313–324. [Google Scholar] [CrossRef]
- Vilà-Cabrera, A.; Coll, L.; Martínez-Vilalta, J.; Retana, J. Forest management for adaptation to climate change in the Mediterranean basin: A synthesis of evidence. For. Ecol. Manag. 2018, 407, 16–22. [Google Scholar] [CrossRef]
- Reyna, T.; Garcia-Chevesich, P.; Neary, D.G.; Scott, D.F.; Benyon, R.G.; Reyna, S.M.; Lábaque, M.; Amani, C.; Pizarro, R.; Iroumé, A.; et al. Forest Management and the Impact on Water Resources: A Review of 13 Countries; United Nations Educational, Scientific and Cultural Organization (UNESCO): Paris, France, 2017; p. 204.
- Chen, L.; Wang, L.; Ma, Y.; Liu, P. Overview of Ecohydrological Models and Systems at the Watershed Scale. IEEE Syst. J. 2015, 9, 1091–1099. [Google Scholar] [CrossRef]
- Pretzsch, H.; Grote, R.; Reineking, B.; Rötzer, T.; Seifert, S. Models for forest ecosystem management: A European perspective. Ann. Bot. 2008, 101, 1065–1087. [Google Scholar] [CrossRef] [PubMed]
- Xu, Z.X.; Li, L.; Zhao, J. A distributed eco-hydrological model and its application. Water Sci. Eng. 2017, 10, 257–264. [Google Scholar] [CrossRef]
- Feki, M.; Ravazzani, G.; Ceppi, A.; Pellicone, G.; Caloiero, T. Integration of Forest Growth Component in the FEST-WB Distributed Hydrological Model: The Bonis Catchment Case Study. Forests 2021, 12, 1794. [Google Scholar] [CrossRef]
- Moresi, F.V.; Maesano, M.; Matteucci, G.; Romagnoli, M.; Sidle, R.C.; Scarascia Mugnozza, G. Root Biomechanical Traits in a Montane Mediterranean Forest Watershed: Variations with Species Diversity and Soil Depth. Forests 2019, 10, 341. [Google Scholar] [CrossRef]
- Coscarelli, R.; Gaudio, R.; Caloiero, T. Climatic trends: An investigation for a Calabrian basin (southern Italy). In The Basis of Civilization–Water Science? Rodda, J.C., Ubertini, L., Eds.; IAHS Publish: Wallingford, UK, 2004; pp. 255–266. [Google Scholar]
- Mastrorilli, M.; Rana, G.; Verdiani, G.; Tedeschi, G.; Fumai, A.; Russo, G. Economic Evaluation of Hydrological Ecosystem Services in Mediterranean River Basins Applied to a Case Study in Southern Italy. Water 2018, 10, 241. [Google Scholar] [CrossRef]
- Rabuffetti, D.; Ravazzani, G.; Corbari, C.; Mancini, M. Verification of operational quantitative discharge forecast (QDF) for a regional warning system—The AMPHORE case studies in the upper Po river. Nat. Hazards Earth Syst. Sci. 2008, 8, 161–173. [Google Scholar] [CrossRef]
- Landsberg, J.J.; Waring, R.H. A generalized model of forest productivity using simplified concepts of radiation-use efficiency, carbon balance and partitioning. For. Ecol. Manag. 1997, 95, 209–228. [Google Scholar] [CrossRef]
- Maneta, M.; Silverman, N. A spatially-distributed model to simulate water, energy and vegetation dynamics using information from regional climate models. Earth Interact. 2013, 17, 1–44. [Google Scholar] [CrossRef]
- Arnold, J.G.; Srinivasan, R.; Muttiah, R.S.; Williams, J.R. Large area hydrologic modelling and assessment, part 1: Model development. J. Am. Water Resour. Assoc. 1998, 34, 73–90. [Google Scholar] [CrossRef]
- Veroustraete, F.; Sabbe, H.; Eerens, H. Estimation of carbon mass fluxes over Europe using the C-Fix model and Euroflux data. Remote Sens. Environ. 2002, 83, 376–399. [Google Scholar] [CrossRef]
- Scoccimarro, E.; Gualdi, S.; Bellucci, A.; Sanna, A.; Giuseppe Fogli, P.; Manzini, E.; Vichi, M.; Oddo, P.; Navarra, A. Effects of tropical cyclones on ocean heat transport in a high-resolution coupled general circulation model. J. Clim. 2011, 24, 4368–4384. [Google Scholar] [CrossRef]
- Buras, A.; Menzel, A. Projecting Tree Species Composition Changes of European Forests for 2061–2090 Under RCP 4.5 and RCP 8.5 Scenarios. Front. Plant Sci. 2019, 9, 1986. [Google Scholar] [CrossRef] [PubMed]
- Pellicone, G. Climate Change Mitigation by Forests: A Case Study on the Role of Management on Carbon Dynamics of a Pine Forest in South Italy. Ph.D. Thesis, Università degli studi della Tuscia–Viterbo, Viterbo, Italy, 2018. [Google Scholar]
- Collalti, A.; Perugini, L.; Santini, M.; Chiti, T.; Nolè, A.; Matteucci, G.; Valentini, R. A process-based model to simulate growth in forests with complex structure: Evaluation and use of 3D-CMCC Forest Ecosystem Model in a deciduous forest in Central Italy. Ecol. Model. 2014, 272, 362–378. [Google Scholar] [CrossRef]
- Thornley, J.H.M.; Cannell, M.G.R. Managing forests for wood yield and carbon storage: A theoretical study. Tree Physiol. 2000, 20, 477–484. [Google Scholar] [CrossRef] [PubMed]
- Dore, S.; Montes-Helu, M.; Hart, S.C.; Hungate, B.A.; Koch, G.W.; Moon, J.B.; Finkral, A.J.; Kolb, T.E. Recovery of ponderosa pine ecosystem carbon and water fluxes from thinning and stand-replacing fire. Glob. Chang. Biol. 2012, 18, 3171–3185. [Google Scholar] [CrossRef]
- Saunders, M.; Tobin, B.; Black, K.; Gioria, M.; Nieuwenhuis, M.; Osborne, B.A. Thinning effects on the net ecosystem carbon exchange of a Sitka spruce forest are temperature-dependent. Agric. For. Meteorol. 2012, 157, 1. [Google Scholar] [CrossRef]
- Del Campo, A.D.; Otsuki, K.; Serengil, Y.; Blanco, J.A.; Yousefpour, R.; Wei, X. A global synthesis on the effects of thinning on hydrological processes: Implications for forest management. For. Ecol. Manag. 2022, 519, 120324. [Google Scholar] [CrossRef]
- Cardil, A.; Imbert, J.B.; Camarero, J.J.; Primicia, I.; Castillo, F. Temporal interactions among throughfall, type of canopy and thinning drive radial growth in an Iberian mixed pine-beech forest. Agric. For. Meteorol. 2018, 252, 62–74. [Google Scholar] [CrossRef]
- Perry, T.D.; Jones, J.A. Summer streamflow deficits from regenerating Douglas-fir forest in the Pacific Northwest USA. Ecohydrology 2017, 10, 1–13. [Google Scholar] [CrossRef]
- Cheng, X.; Bai, Y.; Zhu, J.; Han, H. Effects of forest thinning on interception and surface runoff in Larix principis-rupprechtii plantation during the growing season. J. Arid Environ. 2020, 181, 104222. [Google Scholar] [CrossRef]


| Parameter | Description |
|---|---|
| Fprn | Parameter to compute allocation factors |
| Sprn | Parameter to compute allocation factors |
| GPP-NPP | GPP/NPP ratio |
| Alpha | Parameter to compute allocation factors |
| wood-density | Wood density |
| Agemax | Maximum age of the plant |
| hdmin: | H/D ratio in carbon partitioning for low |
| phi-theta | Density |
| K | Empirical coefficient of the soil moisture efficiency |
| Albedo | Function for canopy resistance |
| Fpra | H/D ratio in carbon partitioning for low |
| Spra | Density |
| Sla | Plant albedo |
| phi-ea | Parameter to compute allocation factors |
| Canopymax | Parameter to compute allocation factors |
| laimax | Specific leaf area |
| hdmax | Empirical coefficient of the vapor pressure efficiency |
| tcold-leaf | Function for canopy resistance |
| dbhdcmax | Maximum canopy storage capacity |
| dbhdcmin | Maximum leaf area index used |
| denmax | Precipitation interception |
| denmin | H/D ratio in low carbon partitioning |
Disclaimer/Publisher’s Note: The statements, opinions and data contained in all publications are solely those of the individual author(s) and contributor(s) and not of MDPI and/or the editor(s). MDPI and/or the editor(s) disclaim responsibility for any injury to people or property resulting from any ideas, methods, instructions or products referred to in the content. |
© 2024 by the authors. Licensee MDPI, Basel, Switzerland. This article is an open access article distributed under the terms and conditions of the Creative Commons Attribution (CC BY) license (https://creativecommons.org/licenses/by/4.0/).
Share and Cite
Feki, M.; Ravazzani, G.; Pellicone, G.; Caloiero, T. Impact of Forest Management on Wood Production under Climate Change in the Bonis Catchment. Forests 2024, 15, 539. https://doi.org/10.3390/f15030539
Feki M, Ravazzani G, Pellicone G, Caloiero T. Impact of Forest Management on Wood Production under Climate Change in the Bonis Catchment. Forests. 2024; 15(3):539. https://doi.org/10.3390/f15030539
Chicago/Turabian StyleFeki, Mouna, Giovanni Ravazzani, Gaetano Pellicone, and Tommaso Caloiero. 2024. "Impact of Forest Management on Wood Production under Climate Change in the Bonis Catchment" Forests 15, no. 3: 539. https://doi.org/10.3390/f15030539