Abstract
Evaluating the carbon storage of forests and identifying the factors that influence it are essential in working towards the “dual carbon” goal. This assessment will facilitate research on carbon neutrality and promote regional ecological protection and development. This study utilized the “One Map” data of forest resources (2020) and the first year (2017) of the establishment of the national park in Wuyi Mountain National Park (WMNP). The continuous biomass expansion factor method, in conjunction with the vegetation carbon content coefficient, was employed to estimate the forest carbon storage within the park’s forested areas. Subsequently, the distribution of forest carbon storage was analyzed using remote sensing estimation methods, and a comparison was made between the forest carbon storage of these two years. Finally, correlation analysis and path analysis were conducted to identify the primary factors influencing forest carbon storage. The study findings reveal that in 2020, the total carbon storage in forests reached 4.851 × 10⁶ t C, with an average carbon density of 49.55 t C·hm−2. Furthermore, the study identified positive correlations between dominant tree species, age groups, and elevation with carbon storage, whereas slope length and aspect were found to have negative correlations. Dominant tree species were observed to have the greatest impact on forest carbon storage in both 2017 and 2020, followed by age groups. These findings offer valuable scientific insights for the implementation of forest carbon storage pilot projects in WMNP.
1. Introduction
The forest carbon sink is a process through which forest ecosystems absorb and sequester carbon dioxide, making it a crucial factor in reducing atmospheric carbon dioxide concentrations [1,2]. As the largest carbon pool in terrestrial ecosystems, forest plays an vital role in promoting economic and social development and environmental protection [3,4]. According to the inventory data of seven forest resources in China from 1977 to 2013, the raw carbon storage of China’s forests has increased by 72.62%, reaching 7.27 Pg C, of which the carbon storage of natural forests accounts for about 85%, and is expected to continue to increase in the future [5]. China has a longstanding commitment to developing green industries and mitigating climate change. This commitment is manifested through various measures, including optimizing forest management, and strengthening natural resource protection. In comparison to industrial emission reduction, forest carbon storage is considered a more cost-effective approach to reducing emissions due to its simplicity and comprehensive benefits [6]. Consequently, the relationship between forest carbon sinks and industrial carbon sources has become a crucial aspect of carbon emission trading mechanisms, leading to a broader and more comprehensive focus on research related to forest carbon sinks.
Similarly, studying the influencing factors of forest carbon sinks is also crucial for predicting future changes in forest carbon storage and formulating relevant forest management strategies [7]. The carbon storage of various vegetation types in forests was primarily influenced by variations in carbon content. As forests age, forest carbon storage generally increases, although the specific amount can vary depending on the vegetation types present in different regions [8]. The study by Cavanaugh et al. indicated that aboveground carbon storage in tropical forests increases with the dominance of genera with larger maximum diameters [9]. Xu et al. found that canopy density and forest age are key driving factors for carbon storage in subtropical forest vegetation [10]. Furthermore, Li et al. [11] investigated carbon storage and driving factors in trees within 480 plots of subtropical forests in China. Their study indicated that forest age is the most influential factor in tree carbon storage [11]. At the same time, forest carbon storage driven by site conditions and environment was also influenced by factors such as terrain, elevation, and plant diversity [12,13,14]. In addition to the inherent attributes of natural environmental conditions and forest ecosystems, socio-economic conditions also have a significant impact on the supply of forest carbon sinks [15]. Therefore, revealing the main influencing factors of forest carbon storage can contribute to guide forest management, further promote the development of forest carbon sinks, and achieve the protection and utilization of forest resources.
National forest parks and nature reserves are among the oldest and most common types of national parks within China’s national park system. They serve as the primary zones for the protection of natural resources in the country [16]. From 1982 to 2017, the implementation of protection measures has led to an increase in forest carbon storage within these national forest parks and nature reserves [17]. The forests within these regions exhibit higher average carbon density and carbon storage compared to other forest resources, making them a significant carbon sink within China’s forest ecosystem [16,17,18]. Since 2016, the pilot project for establishing a national park system in China has not only promoted the overall development of national forest parks and nature reserves but also played a pivotal role in setting an example for the establishment of natural protected areas with national parks as their focal point [16]. Therefore, it is of great importance to understand the status of plant productivity and carbon sink functions within national forest parks. This will enable a comprehensive evaluation of the ecosystem service functions of national forest parks and their contribution to carbon neutrality.
In 2017, Wuyi Mountain National Park (WMNP) was first established and the relevant regulations and management systems for the pilot work of the Wuyi Mountain National Park System were organized and drafted. In addition, WMNP is fully responsible for the protection, management, planning, and construction of various natural resources within its jurisdiction. As one of the first five national parks in China in 2021, WMNP is not only a protected zone located in a World Heritage-Mixed Property in China but also the most complete, typical, and largest subtropical forest ecosystem in China [19]. This national park has high plant diversity, which is mainly composed of mature forests [20]. Similarly, mature forests have a high carbon density and relatively stable carbon storage [14,21,22]. Since most forests in WMNP are relatively mature and the dominant tree species are mainly subtropical evergreen broadleaved trees and conifers [23,24], their carbon storage may play a dominant role in WMNP. Therefore, these superior conditions provide a natural experimental platform for research work on forest carbon sinks. In addition, many studies have shown that, due to strict conservation measures, fast-growing young plants will become the main body for future increases in forest carbon sinks [25,26,27].
However, previous research on the carbon sink of WMNP mainly focused on soil organic carbon [28,29,30], as was incomplete research on the carbon storage capacity of typical forests [19]. Consequently, there still exists a significant knowledge gap pertaining to the present state of forest carbon storage and carbon sink potential in WMNP. Here, we took WMNP as the research object, evaluated the variations of forest carbon storage and its influencing factors based on the continuous biomass expansion factor method, correlation analysis, and path analysis, respectively. We attempt to answer the following two scientific questions: (1) Will the forest carbon storage of WMNP increase from 2017 to 2020 (i.e., in the early stages and three years after the establishment of the national park)? (2) What are the primary factors that dominate the variations of forest carbon storage in WMNP? The purpose is to deepen our understanding of forest carbon storage and its influencing factors in WMNP, and provide a theoretical basis for carbon sink decision-making and forest management.
2. Materials and Methods
2.1. Study Site
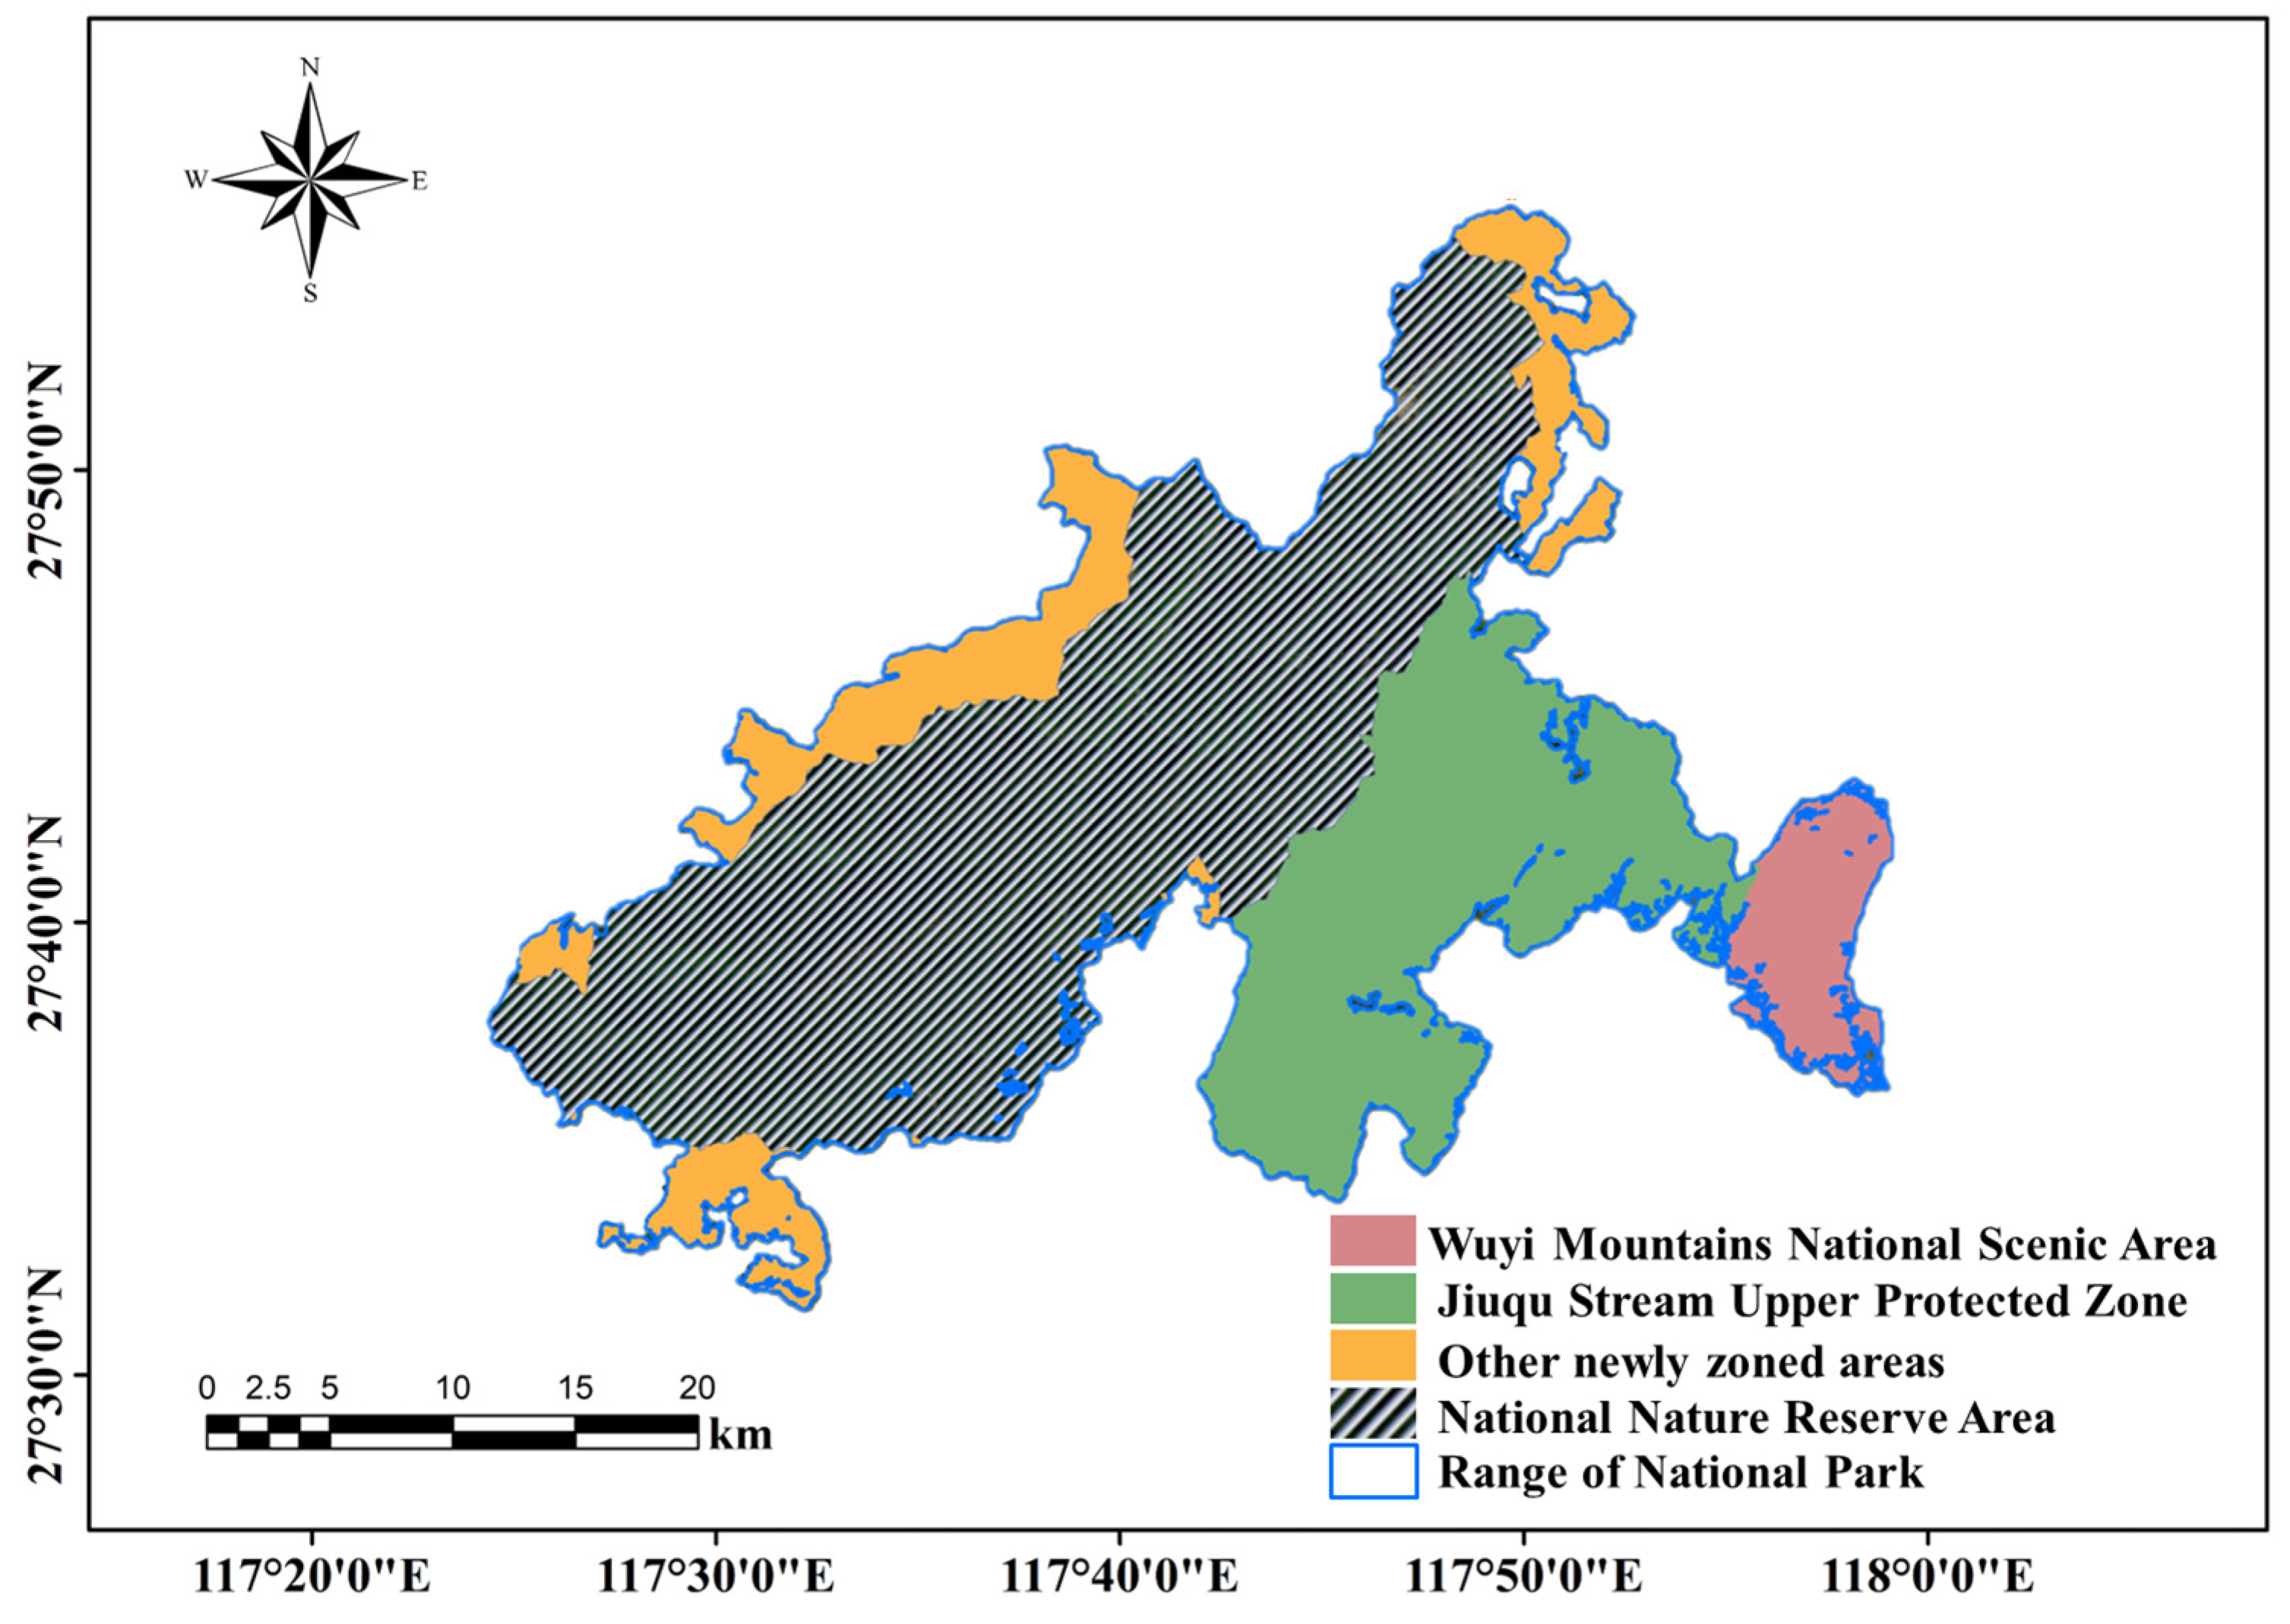
WMNP located in the northern part of Fujian Province, China, ranges from 117°24′13″ to 117°59′19″ longitude and 27°31′20″ to 27°55′49″ latitude [20], and was listed as a World Cultural and Natural Heritage Site by the United Nations Educational, Scientific, and Cultural Organization (UNESCO) in 1999. Wuyi Mountain contains the largest and most representative forest types with higher diversity of the subtropical forest of China. This region is the most outstanding zone for biodiversity conservation in southeast China and a refuge for many ancient relict species, many of them endemic to China [31]. WMNP encompasses Fujian Wuyi Mountain National Nature Reserve (56,474.20 hm2), Wuyi Mountain National Scenic Zone (5357.53 hm2), Jiuqu Stream Upper Protected Zone (25,084.16 hm2), and other newly zoned areas (13,225.16 hm2) that include adjacent public welfare forests (Figure 1). According to the document “Wuyi Mountain National Park Master Plan (2017–2025)” and the forest resources data in “One Map” of WMNP, the total land area of the park is 100,141.52 hm2, with a forest coverage rate of 96.7%.

Figure 1.
Regional distribution of study sites in Wuyi Mountain National Park.
2.2. Forest Resource Data
In this study, the forest resource data for the year 2017 was collected based on the Forest Resource Inventory and Planning (FRIP) survey in the early stages of WMNP. Additionally, the forest resource “One Map” data for the year 2020 is derived from the fourth Forest Resource Inventory and Planning survey conducted in Fujian Province in 2018, along with the annual update of forest resources in 2019. It is important to note that the forest resource survey data for these years were all obtained from the FRIP survey.
In addition, the FRIP conducted in WMNP in 2018 utilized new technologies such as RS (Trimble, Sunnyvale, CA, USA), GIS (Esri, Redlands, CA, USA), GPS (Garmin, Olathe, KS, USA), and mobile terminals to accurately record forest resource survey data. High-resolution aerial imagery with a precision of 1:1000 obtained in 2019 served as the base map and was combined with a topographic map at a scale of 1:10,000 to establish sub-compartment divisions. GPS technology was employed to determine the coordinates of each sub-compartment, facilitating the assessment of various factors based on technical specifications. The survey data was collected using a paperless approach and processed in conformity with the Fujian Provincial Forest Resource Management Information System.
According to the zoning technical regulations of the FRIP, the forest area includes a tree layer, special shrub layer, and bamboo forest. However, certain forest areas, such as sparse forests, general shrublands, unfinished forests, nurseries, and fallow land, are not considered in forest statistics. These excluded forests only represent 1.48% of the total forest area (Table S1). Therefore, this study focused on collecting data specifically for tree forests, bamboo forests, and special shrub forests (including shrub economic forests) within the WMNP. The research in this article is centered around the forest resources found in WMNP, utilizing factors such as stand volume from the resource database. The data acquisition objects consist of tree stands, bamboo forests, and special shrub forests (including shrub economic forests), as specified by the state.
2.3. Classification Methods for Various Types of Factors in Forest Resources
In the WMNP forest resources database, the forest resource data encompasses the following information: forest type and area, forest origin and age groups, site quality grades, terrain, elevation, sub-compartment volume, and related information data. Forest types are divided into five categories based on the main tree species and vegetation structure of the forest, including broad-leaved forest, coniferous forest, shrub forest, economic forest, and bamboo forest. Forest origins are divided into natural forests and artificial forests. Natural forests arise from naturally fallen seeds or are artificially established through natural regeneration or germination. In contrast, artificial forests are created through techniques such as seedling planting, direct seeding, aerial seeding, or through the natural growth of previously logged artificial forest areas. Tree forests are further categorized into five age groups based on the average age of dominant tree species: young forest, medium-mature forest, near-mature forest, mature forest, and over-mature forest. Site quality grades are classified into four categories based on the second national soil survey and related standards: fertile, sub-fertile, moderately fertile, and barren. Terrain factors include slope length, slope, aspect, and elevation data.
In addition, the classification of dominant tree species was based on several decades of field surveys, the collection of plant specimens, identification, and statistical analysis conducted in the Wuyi Mountains area. Data collected from field surveys and previous studies were used to determine the dominant tree species. Information on the main dominant tree species in the WMNP can be found in Table S2. This table displays the main dominant tree species, including Pinus massoniana, P. taiwanensis, Cunninghamia lanceolate, broad-leaved hardwood, broad-leaved softwood. At the same time, we also searched relevant literature and found that the main species of broad-leaved hardwood with large carbon storage mainly included Castanopsis eyrei, C. carlesii, Engelhardtia fenzlii, Cyclobalanopsis myrsinifolia, and C. fordii, etc. [23].
2.4. Data Analysis
2.4.1. Estimation of Forest Biomass
Forest biomass is estimated using the continuous biomass expansion factor method based on the area and growing stock of different forest types in the inventory data of forest resources. The biomass expansion factor was calculated based on the conversion relationship between growth stock and biomass [32,33,34]. The regression equation for biomass estimation was:
where B is biomass per unit area (t·hm−2), V is the growing stock per unit area (m3·hm−2), and a and b are parameters. The parameters of the biomass conversion model for some of the main dominant tree species of WMNP are shown in Table S3.
B = a × V + b
2.4.2. Estimation of Forest Carbon Storage
According to the Victorian Forest Monitoring Program (VFMP) [35], forest carbon pools encompass aboveground biomass, subsurface biomass, litter, dead wood, and soil organic charcoal. The carbon content rate in plants refers to the carbon content of dry matter per unit mass, which can vary depending on factors such as species, origin, age, and site type [32]. The carbon density of woody plants in China varies based on tree species and organs, with an average carbon sequestration rate ranging from 0.47 to 0.53 for the entire plant [36]. In this study, the carbon content coefficient (Cc) was calculated using the commonly used default value of 0.5 internationally [37]. The carbon storage was estimated as the product of stand biomass and the carbon content rate of different forest types. The calculation formula is as follows:
where C is the carbon storage, Y is the biomass, and Cc is the carbon content rate. Stand carbon density is the ratio of stand carbon storage to stand area.
C = Y × CC
2.4.3. Path Analysis between Forest Carbon Storage and Influencing Factors
To identify the primary influencing factors of forest carbon storage and understand their relationship between the influencing factors and forest carbon storage, we conducted correlation analysis (Pearson correlation coefficient) and path analysis. In this analysis, the forest carbon storage data from 2017 and 2020 were considered, where carbon storage per unit area was the dependent variable (y), and factors such as slope length, aspect, site quality grades, dominant tree species, origin, age groups, and forest types were considered independent variables (x). Notably, since the estimation of carbon storage was based on the average diameter at breast height and tree height, these variables were not included as independent variables. We initially established a stepwise regression equation and applied the Akaike Information Criterion (AIC) to identify the optimal influencing factors. The results of the stepwise regression screening showed that the independent variables for forest carbon storage in 2017 were slope length (x1), site quality grades (x2), dominant tree species (x3), forest origins (x4), age groups (x5), and elevation (x6). Similarly, for forest carbon storage in 2020, the independent variables were aspect (z1), dominant tree species (z2), age groups (z3), and elevation (z3). Subsequently, we calculated the pearson correlation coefficient among these independent variables. Finally, based on the correlation analysis, we employed path analysis to decompose the correlation coefficient of the impact factor. The direct, indirect, and combined effects of the independent variables on the dependent variable were determined through the direct path, indirect path, and total path coefficients [38].
2.4.4. Calculation of Decision Coefficients for Influencing Factors
The comprehensive effect of each variable factor on the dependent variable through the decision coefficient was calculated, and then the independent variables were ranked based on the comprehensive effect score for better macro level decision-making [39]. The calculation formula for the decision coefficient was as follows:
where is the decision coefficient, bi is the direct path coefficient between y and influencing factors, and riy is the Pearson’s correlation coefficient between y and influencing factors.
3. Results
3.1. Estimation of Forest Carbon Storage in WMNP
From 2017 to 2020, the forest area and biomass of WMNP increased by 3954.35 hm2 and 3.947 × 10⁵ t, respectively (Table 1). The total carbon storage of the forests in 2017 and 2020 was 4.654 × 10⁶ t C and 4.851 × 10⁶ t C, respectively, with an increase of 1.97 × 10⁵ t C (Table 1). Among these, broad-leaved trees exhibited the highest carbon storage and carbon density (Table 1). Furthermore, the carbon storage results of different dominant tree species in the tree layer indicated (Table S2) that broad-leaved hardwood makes the greatest contribution to overall carbon storage, accounting for 57.93% of the total carbon storage. These findings emphasized the dominant role played by broad-leaved hardwood species in the forest carbon storage of WMNP. Based on the total forest area and carbon storage mentioned above, the average forest carbon density for the two years was calculated to be 49.54 t C · hm−2 (2017) and 49.55 t C · hm−2 (2020), respectively.

Table 1.
Forest biomass and carbon storage of WMNP in 2017 and 2020.
3.2. Changes in Forest Carbon Storage of WMNP from 2017 to 2020
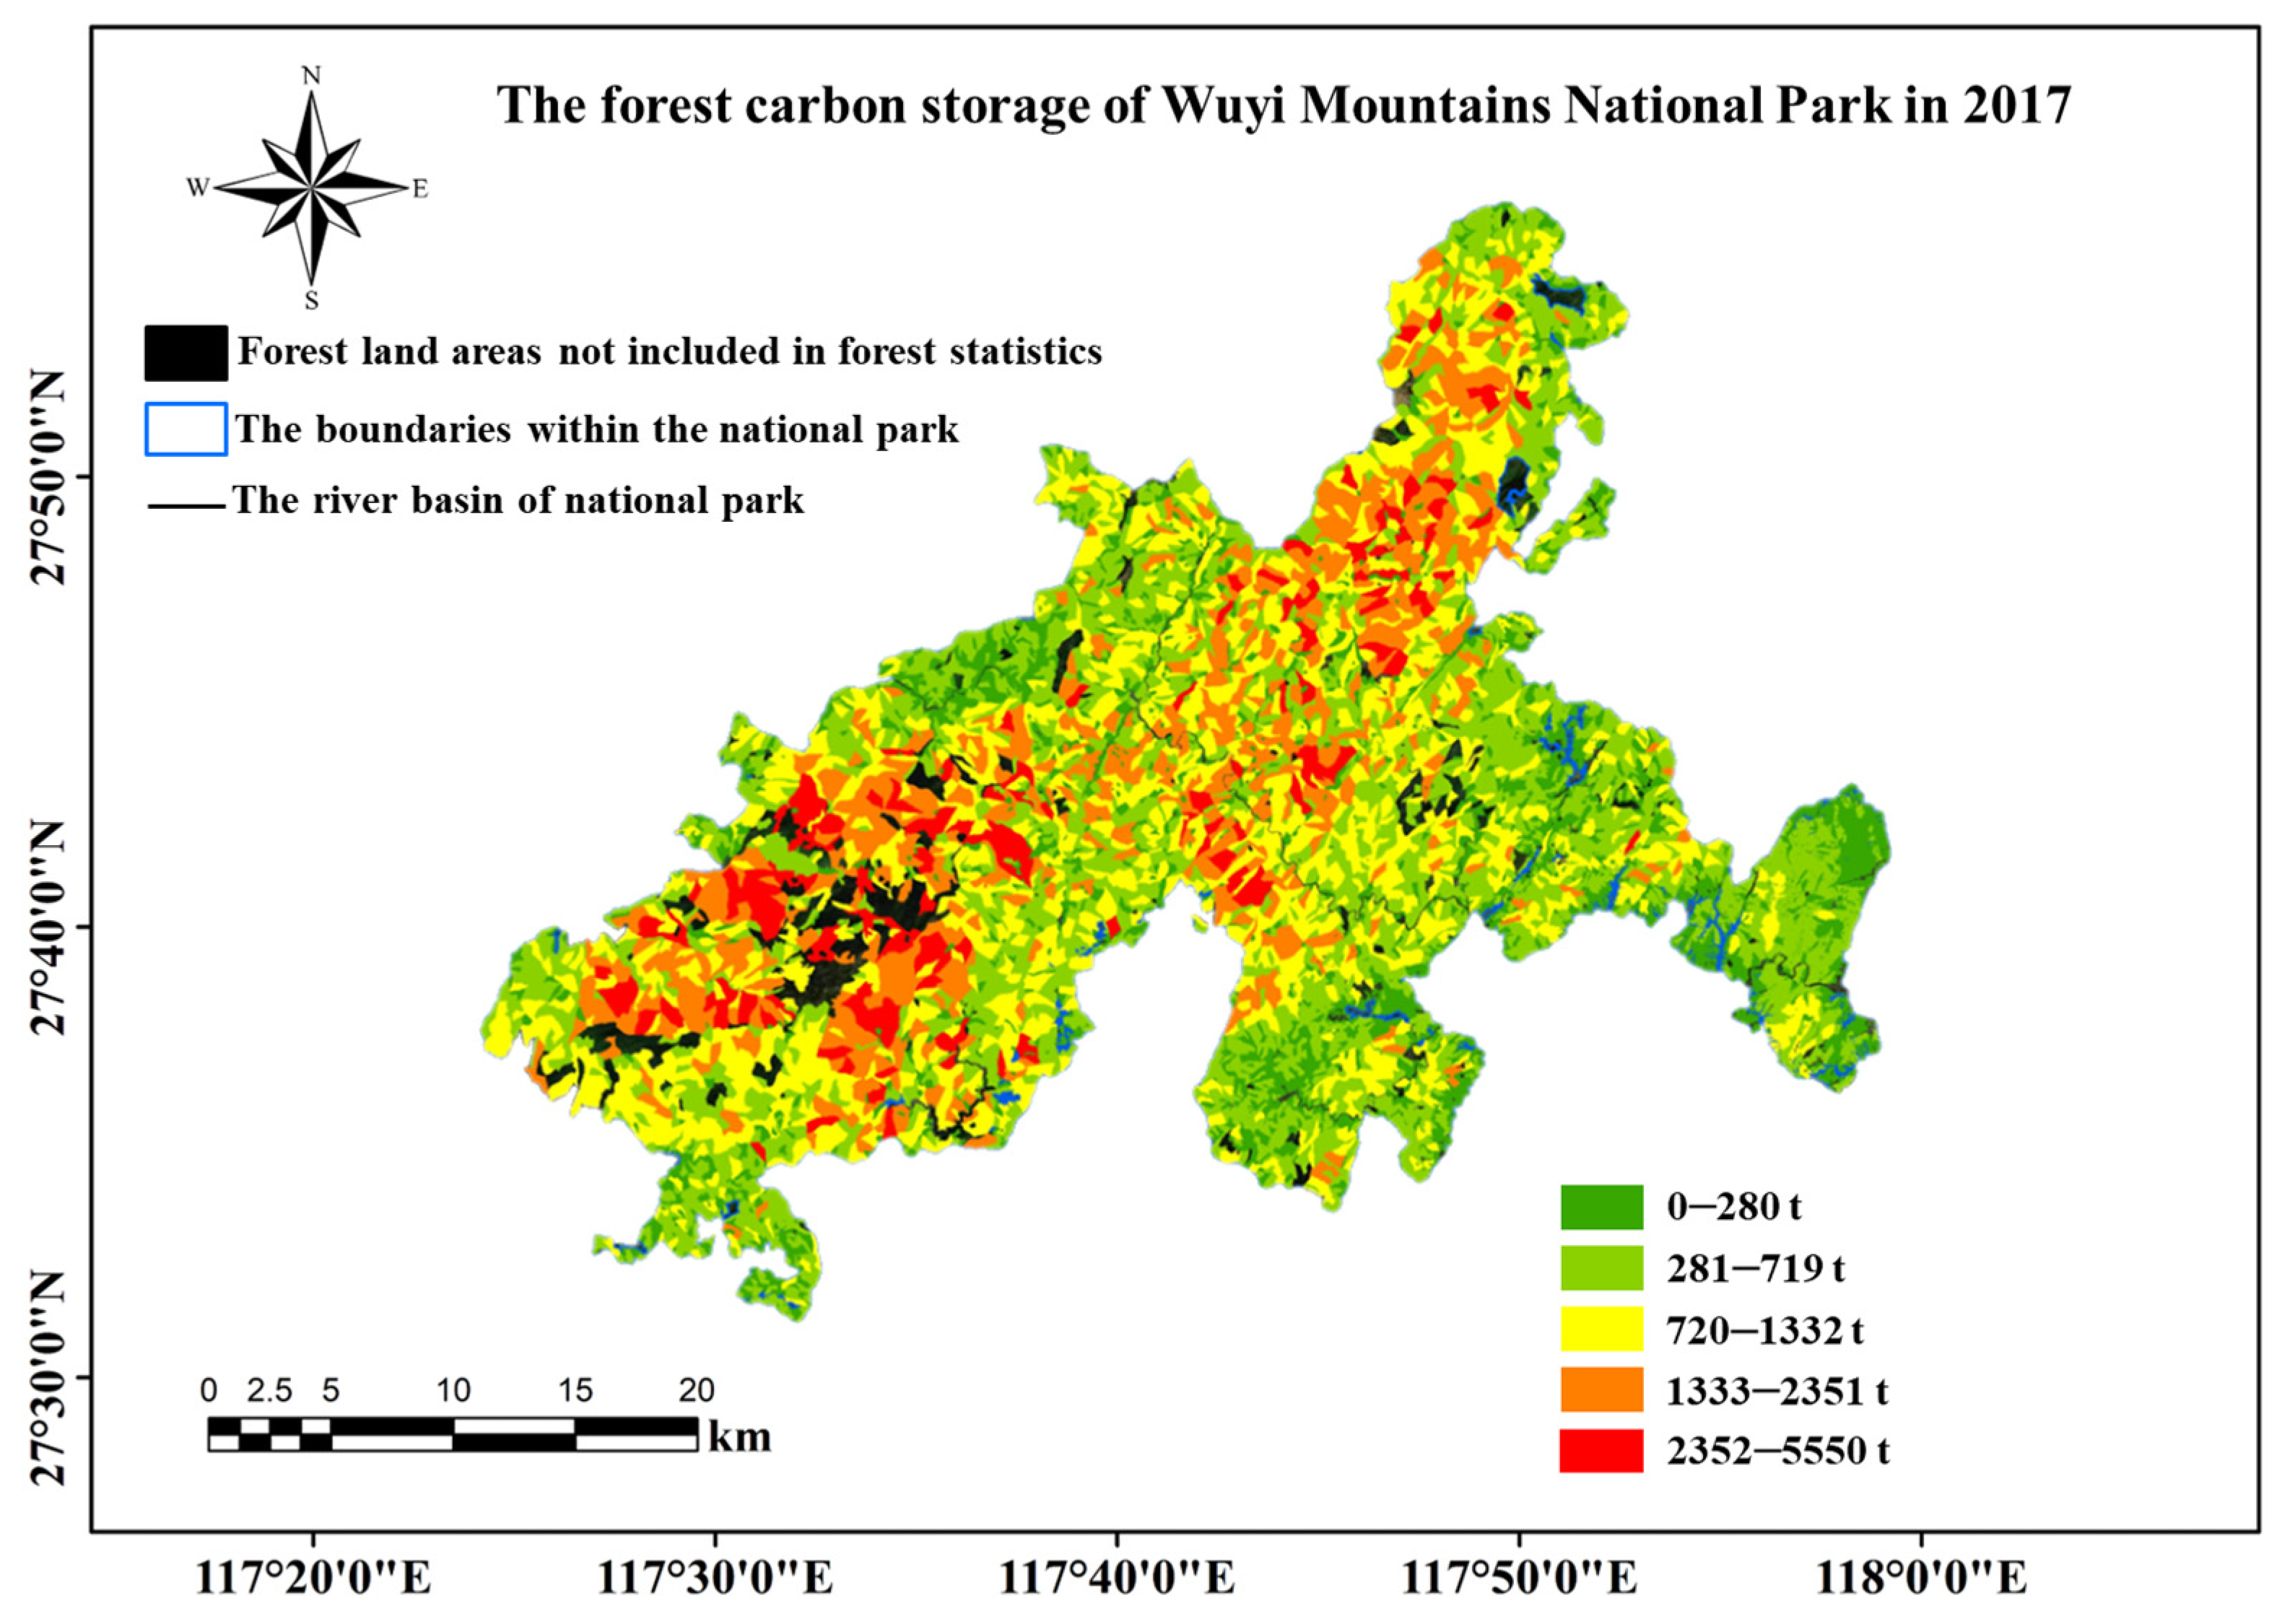
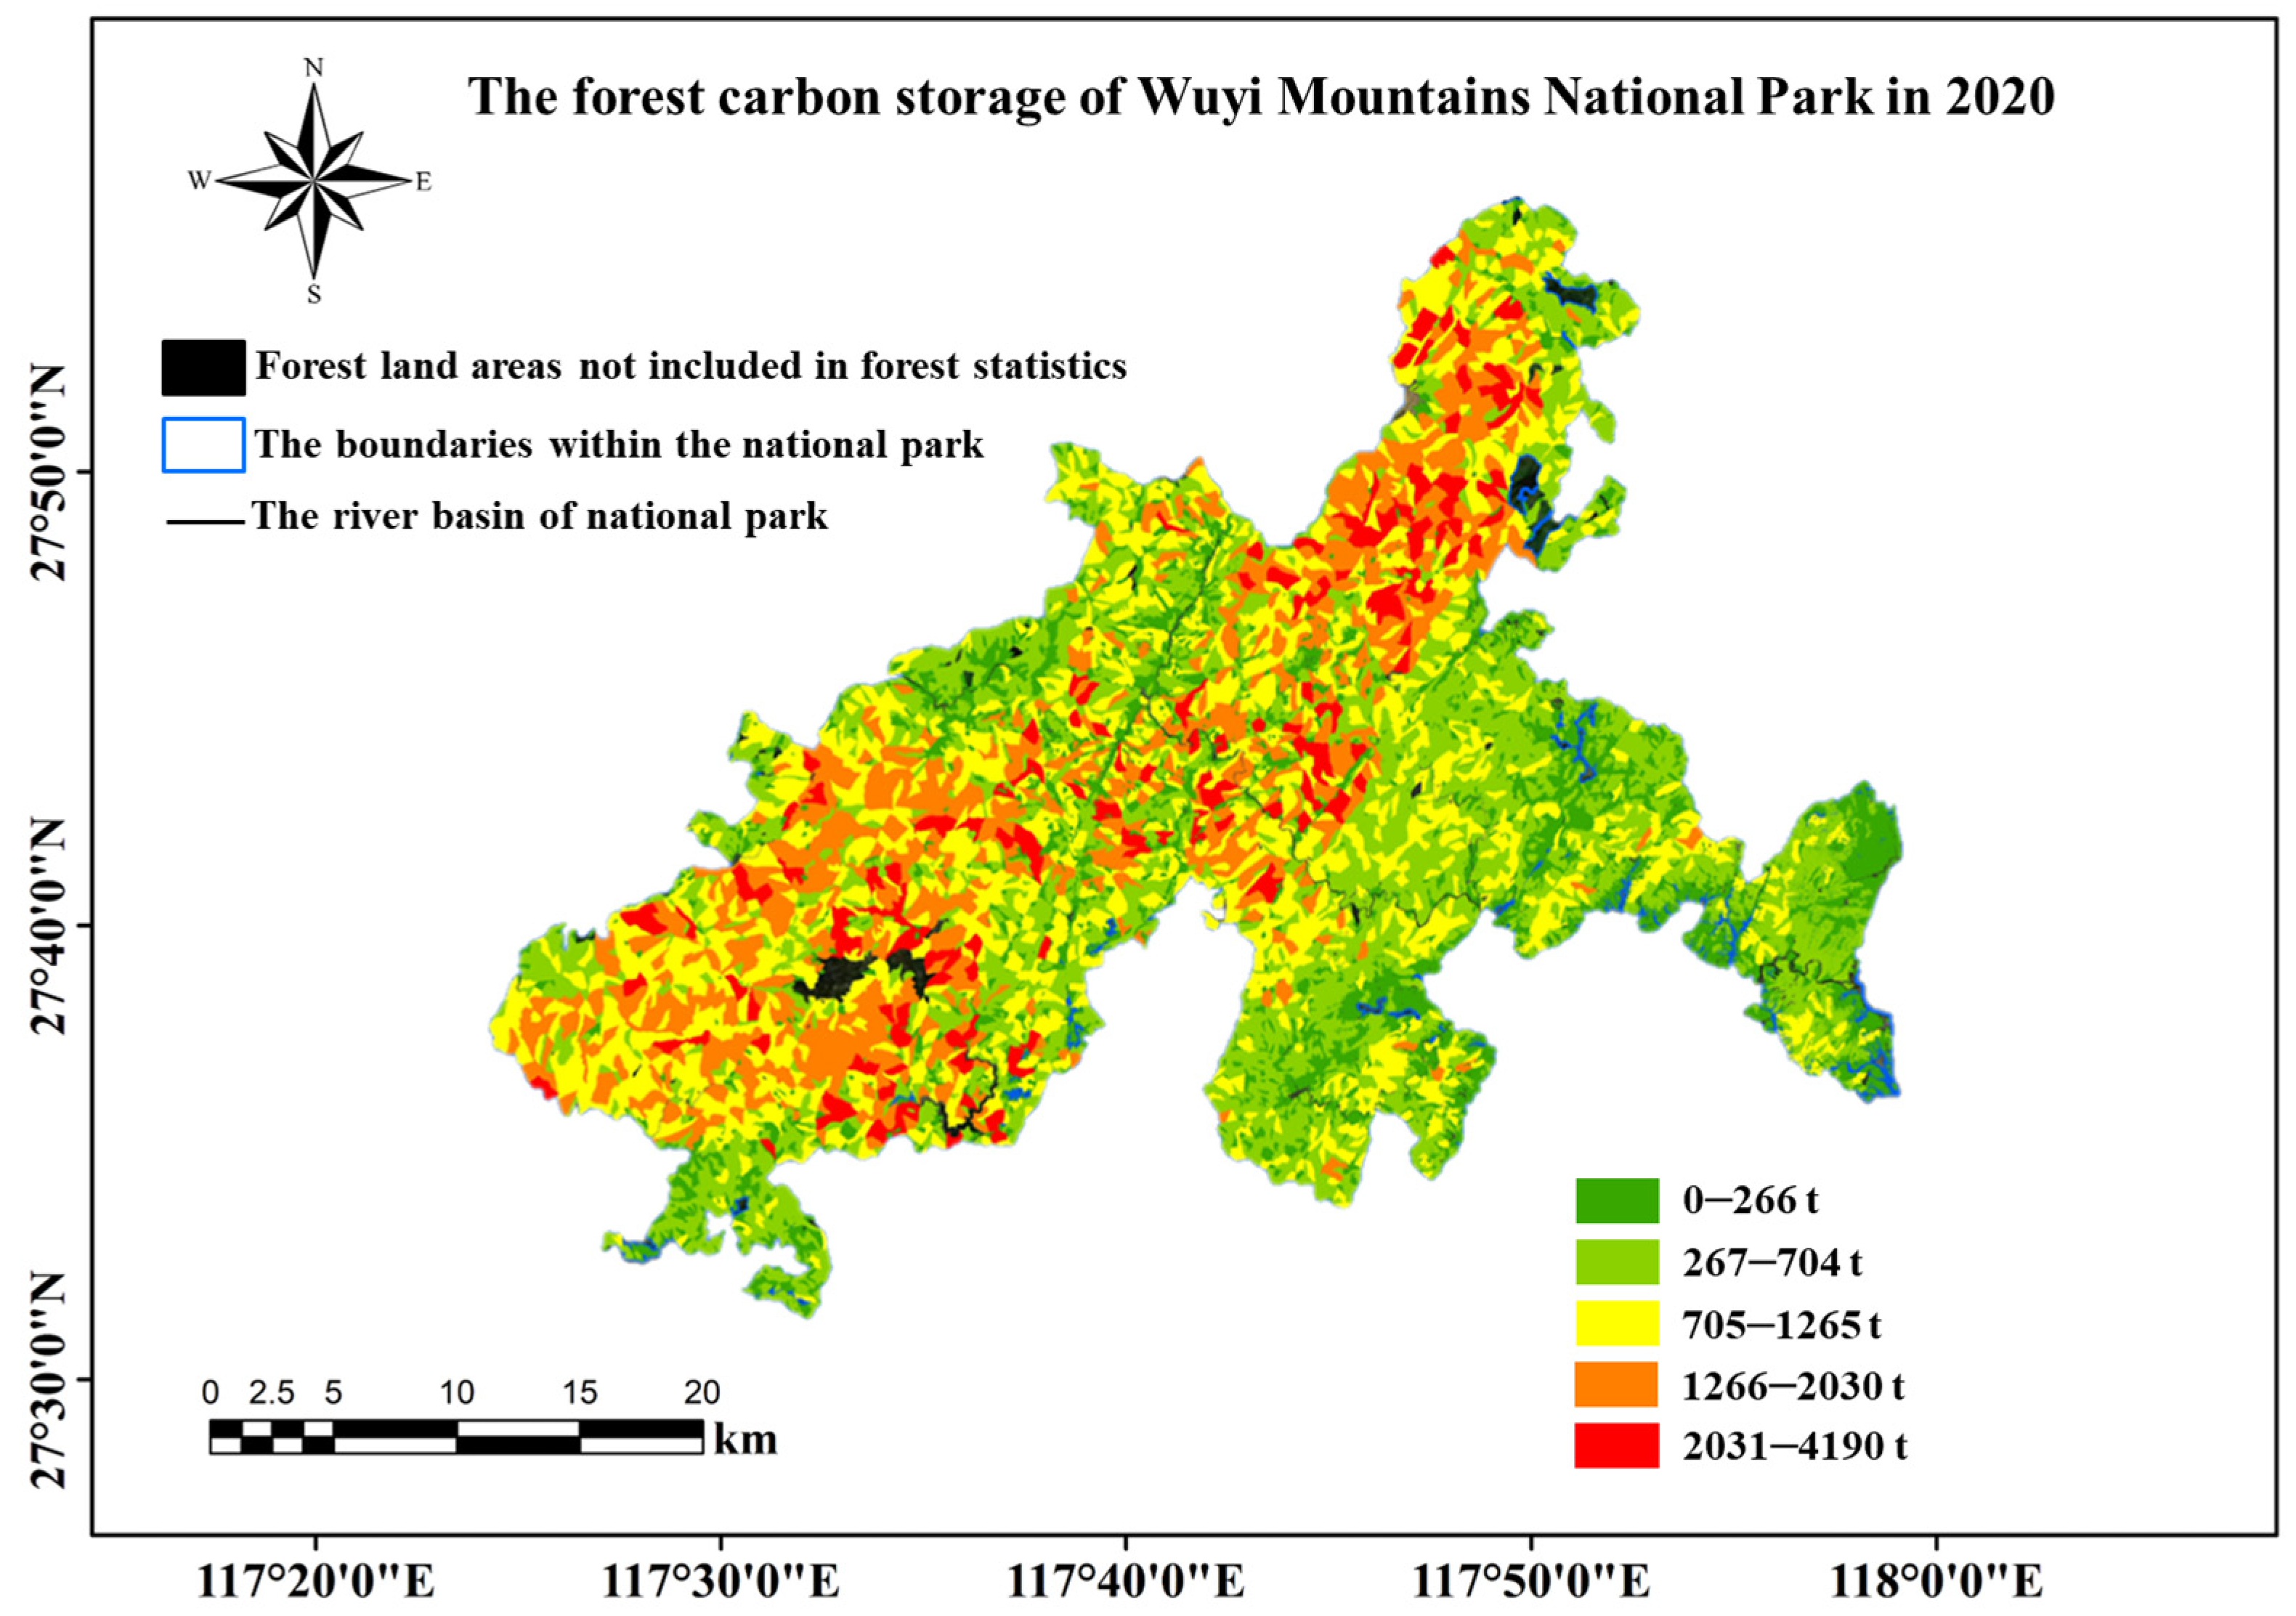
According to Table 1, the forest carbon storage in WMNP has shown an overall increase from 2017 to 2020. Furthermore, areas with high forest carbon storage were primarily found in Wuyi Mountain National Nature Reserve, followed by the Jiuqu Stream Upper Protected Zone. Lower concentrations were observed in Wuyi Mountain National Scenic Zone and other newly zoned areas (Figure 1, Figure 2 and Figure 3). Overall, the average carbon density remained relatively stable as the total carbon storage and forest area increase simultaneously.
Figure 2.
The forest carbon storage of WMNP in 2017. Note: The blue line indicates the boundary lines within the WMNP. Forest carbon storage size and distribution are depicted through patches of various colors, ranging from green to red, categorized according to the GPS coordinates of the patches and their corresponding forest carbon storage. Black patches within the WMNP denote forest land not accounted for in the forest statistics. The curved and narrow black line represents the river basin within the WMNP, with its carbon storage not factored into the statistics. The same applies below.

Figure 3.
The forest carbon storage of WMNP in 2020.
3.3. Path Analysis between Forest Carbon Storage and Influencing Factors
The path analysis was conducted to evaluate the influencing factors of forest carbon storage in WMNP in 2017 (Table 2). The results showed that the correlation coefficients for slope length, site quality grades, dominant tree species, origin, age groups, and elevation were −0.2831, 0.0970, 0.7292, 0.4869, 0.6387, and 0.3555, respectively. Their direct effects on forest carbon storage were −0.0356, 0.1079, 0.5444, 0.1135, 0.1333, and 0.0567, respectively. It was observed that slope length had an overall negative influence on forest carbon storage through both direct and indirect effects. Conversely, site quality grades, dominant tree species, origin, age groups, and elevation had overall positive effects on forest carbon storage, with dominant tree species having the highest positive effect, followed by age groups.
Table 2.
Path analysis of influencing factors for forest carbon storage in 2017.
Similarly, the path analysis results for the influencing factors of forest carbon storage in WMNP in 2020 (Table 3) indicated that the correlation coefficients for aspect, dominant tree species, age groups, and elevation were −0.0359, 0.1797, 0.1688, and 0.1160, respectively. The direct effects were −0.0163, 0.1159, 0.0485, and 0.0431, respectively. The overall influence of aspect on forest carbon storage, considering both direct and indirect effects, was negative. However, the overall positive effects of dominant tree species, age groups, and elevation on forest carbon storage were observed, with dominant tree species having the highest overall positive effect, followed by age groups. These findings align with the results of the correlation coefficient analysis (Tables S4 and S5).
Table 3.
Path analysis of influencing factors forest carbon storage in 2020.
3.4. Analysis of Decision Coefficients for Influencing Factors
The analysis of decision coefficients for influencing factors in 2017 revealed that the dominant tree species had the highest coefficient, followed by age groups, origin, elevation, slope length, and site quality grades (Table 4). This indicated that dominant tree species have the most significant impact on forest carbon storage, with age groups being the next influential factor. Remarkably, the decision coefficient analysis of influencing factors in 2020 yielded similar results (Table 5).
Table 4.
Analysis of decision coefficients for each influencing factor in 2017.
Table 5.
Analysis of decision coefficients for each influencing factor in 2020.
4. Discussion
4.1. Forest Carbon Storage and Carbon Density of WMNP
The assessment of carbon storage and carbon density in China’s national forest parks is crucial for understanding their status and implementing policies related to carbon peaking and carbon neutrality. Previous research has indicated that the total carbon storage of forests in China is approximately 28.90 Pg C, with an average vegetation carbon density of 42.04 ± 5.39 t C·hm−2 [36]. It is important to note that China’s average carbon density is lower than the global average of 71.60 t C·hm−2 [40]. However, the carbon storage and average carbon density in the 881 national forest parks of China are 3.56 Pg C and 255.18 t C·hm−2, respectively [17]. This difference is likely attributable to protective measures that have increased the preservation rate and maturity of forest stands, indirectly leading to higher carbon storage and density. Moreover, the implementation of protective measures and reduction in external disturbances have supported the gradual growth of young trees, contributing to carbon storage in national forest parks [41]. These findings underscore the significant carbon storage capacity of national forest parks in China, enabling them to effectively absorb and store carbon dioxide.
The total carbon storage and average carbon density of forests in WMNP were 4.851 × 10⁶ t C and 49.55 t C·hm−2, respectively, in 2020. Notably, these values are comparatively lower than the forest vegetation in the Hainan Tropical Rainforest National Park (39.38 × 10⁶ t C) [42] and the overall ecosystem carbon storage in the Giant Panda National Park (60.5 × 10⁶ t) [43]. Furthermore, the average carbon density of forests in WMNP is also lower than that found in the forest vegetation of Hainan Tropical Rainforest National Park (95.91 t C·hm−2) [42] and the Qinghai spruce forest in the northeast edge of the Qilian Mountains (82.70 t C·hm−2) [44]. These discrepancies in carbon storage and density can be attributed to variations in climate, soil conditions, and the carbon storage capacity of plants at different developmental stages [45,46]. For instance, Hainan Tropical Rainforest National Park covers an area of 4269 km2, which is four times larger than WMNP’s 1001.41 km2. Consequently, notable discrepancies in forest carbon storage resulting from differing spatial scales are apparent. The warm and humid climate conditions in tropical regions, such as Hainan, typically foster more fertile soil [9,47], which is more conducive to biodegradation and biomass accumulation, ultimately augmenting forest carbon storage and density [42]. In contrast, WMNP is situated in subtropical regions where soil may be influenced by more pronounced seasonal climate fluctuations, like droughts or rainy seasons, leading to substantial changes in soil texture and moisture content, ultimately impeding the accumulation of forest carbon storage [11,19,22]. Additionally, well-established vegetation generally maintains higher carbon storage. The Wuyi Mountain National Nature Reserve, under prolonged strict protection, harbors mature forests with abundant carbon storage (Figure 1, Figure 2 and Figure 3). Conversely, the carbon storage in the remaining three regions of WMNP (e.g., Wuyi Mountain National Scenic Zone, Jiuqu Stream Upper Protected Zone, and other newly zoned areas) is relatively low (Figure 1, Figure 2 and Figure 3), possibly due to less stringent forest protection measures and frequent human activities in these zones. Consequently, these factors contribute to a decline in the overall carbon storage capacity of forests in WMNP.
From 2017 to 2020, the total forest carbon storage in WMNP exhibited an upward trend, with an increase of 1.97 × 10⁵ t C (Table 1). Notably, broadleaf trees and shrubs layers played a crucial role in the augmentation of forest carbon storage (Table 1), particularly in the canopy layer, where the carbon storage and density of broadleaf tree species were the highest (Table S2). These findings emphasize the superior carbon storage capacity and carbon storage ability of broadleaf trees. However, the overall forest carbon density in WMNP was diminished due to the relatively lower carbon density found in bamboo forests and shrub forests. Extensive research has demonstrated that niche complementarity and mass ratio effects are vital mechanisms for sustaining the carbon storage of subtropical forest trees [48,49,50]. These mechanisms likely facilitate carbon storage in subtropical forest trees by optimizing resource utilization. In particular, the effective occupation of limited space by the canopy and understory layers enhances light availability, thereby increasing carbon capture [11]. Simultaneously, dominant species in the canopy layer are located at the top of the tree crown, which receives the greatest abundance of light resources and further contributes to forest carbon accumulation [51,52].
WMNP belongs to the subtropical evergreen broad-leaf forest region, characterized by diverse natural environments and vegetation types. It is the largest subtropical forest ecosystem at the same latitude globally [20]. Studies have revealed that biodiversity and complex forest structures can maximize carbon storage in subtropical forests [11]. Additionally, the results indicate significant variations in carbon storage between young and mature forests, with carbon storage in young forests more than doubling from 2017 to 2020 (Table S6). Other studies have also demonstrated a rapid increase in forest carbon storage in young forests during the first 10–20 years after afforestation [26,27,53]. Therefore, afforestation efforts and promoting the growth of young forests hold great potential for increasing forest carbon storage in the future [25]. Recent research indicates that plants with different types of mycorrhizal fungi, such as ectomycorrhizal (EcM) and arbuscular mycorrhizal (AM) fungi, exhibit differences in aboveground carbon storage [54,55]. Particularly, as dominant species in the evergreen broadleaf forest, EcM tree species have significantly higher aboveground carbon storage compared to AM species [54]. Moreover, under climate warming conditions, the proportion of carbon storage in AM trees is likely to increase, potentially promoting an overall increase in forest carbon storage [55].
4.2. Main Influencing Factors of Forest Carbon Storage in WMNP
Currently, most national forest parks consist of undisturbed or slightly disturbed old-growth forests, and the carbon storage of these forests may increasingly be affected by climate change. As our understanding of the ecological processes underlying carbon sinks and sources in forest ecosystems has deepened, the accuracy of estimating forest carbon storage and density has improved, along with a more detailed quantification of estimation uncertainties [22,56]. Consequently, understanding the factors influencing changes in forest carbon storage plays a crucial role in accurately estimating the carbon storage of forest ecosystems [47]. Climate conditions, forest age, species composition, terrain, elevation, and soil conditions have a profound impact on the biomass and carbon storage of community vegetation [57,58]. Our findings also suggest that slope length, aspect, site quality grades, dominant tree species, origin, age groups, and elevation are the main influencing factors of forest carbon storage in WNMP. Dominant tree species, age groups, and elevation consistently emerged as the common influencing factors for both years studied. Due to their superior ecological niche, tree species in the tree layer tend to exhibit higher carbon storage capacity, ultimately occupying the majority of forest carbon storage, with the carbon storage ratio increasing as forest age increases [11,53]. Wuyi Mountain National Nature Reserve is situated in the central zone of WMNP, where forest vegetation has been strictly protected for an extended period, resulting in relatively old trees with limited human disturbances. The reserve’s vegetation primarily consists of subtropical evergreen broad-leaved trees and conifers in the late succession period [23,24]. Therefore, these dominant forest vegetation types have become the principal components of forest carbon storage in Wuyi Mountain National Nature Reserve, and the combined influence of the dominant tree species and age groups drives the dynamic changes of forest carbon storage in WMNP [59]. This result aligns with the findings on the dominant factors of carbon storage in subtropical forests [53] and the tropical forests globally [9]. Overall, a comprehensive understanding of the carbon storage capacity of forest vegetation and its influencing factors, serving as a theoretical foundation for implementing carbon peak and carbon-neutral policies, and carbon emission trading [60]. When evaluating forest carbon storage and its influencing factors, attention should be given to the carbon storage of dominant tree species in the forest tree layer. Additionally, it is necessary to consider the variations in forest carbon storage and density across different plant ages.
4.3. Challenges and Solutions for the Future Development of Forest Carbon Sinks in WMNP
WMNP possesses abundant forest resources, including subtropical native evergreen broad-leaved forests and native vegetation communities in China, which present enormous potential for the development of forest carbon sinks [20]. Leveraging its favorable forest resources, robust development of forest carbon sinks, and the carbon storage function of forest ecosystems are crucial for increasing carbon sink increments. Monetizing and commercializing forest ecological benefits through vegetation carbon sequestration in WMNP represent a novel approach. The development of forest carbon sinks in WMNP can enhance biodiversity conservation, improve the quality of ecological barriers, increase the regional ecological carrying capacity, and promote the virtuous cycle of ecosystems [61].
However, forest carbon storage and the factors influencing it in WMNP are still in the exploratory stage. It is necessary to gather the following information about WMNP: (1) A better understanding of carbon cycling processes in forest ecosystems is necessary, including the rates of carbon absorption, storage, and release, as well as their response to climate change and other factors. (2) WMNP has experienced rapid land use changes that will impact its carbon storage capacity. Further research is needed to investigate how land use change affects carbon cycling and how to manage land use to maximize carbon storage. (3) The rich biodiversity of WMNP plays a crucial role in carbon storage. More research is needed to explore how biodiversity affects carbon cycling and to develop methods for protecting and managing biodiversity to enhance carbon storage.
These challenges, arising from climate and land use changes, pose significant obstacles to forest carbon storage. Considering these challenges, this study proposes the following solutions for the development of forest carbon sinks in WMNP: (1) Strengthen the forest resource protection and management through measures such as zoning control, law enforcement, forest fire prevention, and pest and disease control. These measures aim to preserve the naturalness, stability, and sustainability of the ecosystem in WMNP. (2) Optimize afforestation plans by selecting suitable tree species for reforestation. Implement targeted cultivation measures for forests at different age stages to promote an increase in forest carbon storage. (3) Enhance theoretical research on forest carbon storage in WMNP, including the development of accurate measurement methods and the determination of carbon storage values. This research can serve as the basis for formulating relevant guidelines, improving management systems, and conducting scientific experiments and verification. (4) Establish government-supported ecological compensation mechanisms by increasing subsidies for natural commodity forests and ecological public welfare forests. This will incentivize the active participation of local indigenous communities in forest conservation, thereby promoting the development and improvement of the forest carbon storage system. It is important to note that these solutions will contribute to the development of forest carbon sinks in WMNP while considering their sustainability and long-term benefits.
5. Conclusions
National parks play a crucial role in conserving essential resources and habitats. Moreover, they provide an ideal framework for assessing forest carbon sinks and ecosystem service functions. Our study reveals that from 2017 to 2020, the overall forest carbon storage in WMNP exhibited an upward trend. The dominant tree species emerged as the primary factor influencing forest carbon storage in WMNP, and age groups was also assumed to play a significant role. Building upon the results, we put forward several measures to promote forest carbon storage. On the one hand, these included implementing reasonable measures (such as zoning control systems, strengthening forest fire prevention and pest control, etc.) to maintain and protect forest carbon storage. On the other hand, these included selecting appropriate tree species (such as native species of the family Fagaceae with high carbon storage) to optimize reforestation plans. Furthermore, targeted planting measures are implemented for trees of different ages (such as regularly watering, fertilizing, and weeding young trees to promote their growth and development, and for mature trees, maintaining soil nutrients and moisture, promoting natural regeneration of trees, etc.) to increase forest carbon storage. In summary, these findings offer valuable perspectives for advancing forest resource conservation and carbon sink development in WMNP.
Supplementary Materials
The following supporting information can be downloaded at: https://www.mdpi.com/article/10.3390/f15030546/s1, Table S1: List of forest land types of WMNP; Table S2: Contribution of different dominant tree species in the tree layer to the total carbon storage of WMNP; Table S3: Model parameters for biomass conversion and storage of main dominant tree species; Table S4: Correlation coefficient of influencing factors to the forest carbon storage in 2017; Table S5: Correlation coefficient of influencing factors to the forest carbon storage in 2020; Table S6: Carbon stock of different ages group of forest stands in 2017 and 2020.
Author Contributions
Conceptualization, X.J. and J.Z.; methodology, X.J., S.L. and J.Z.; formal analysis, X.J. and J.Z.; investigation, X.J., S.L., Q.C., Y.H. and J.Z.; data curation, H.Z. and Y.H.; writing—original draft preparation, X.J. and J.Z.; writing—review and editing, F.T., D.X., J.L. and Z.H.; funding acquisition, D.X., J.L. and Z.H.; supervision, F.T. and D.X. All authors have read and agreed to the published version of the manuscript.
Funding
This work was sponsored by Fujian Province Forestry Science and Technology Project of China (grant number 2022FKJ26, 2022FKJ02), Forestry Peak Discipline Construction Project of Fujian Agriculture and Forestry University of China (72202200205).
Data Availability Statement
Data will be made available on request.
Acknowledgments
We are grateful for the assistance provided by Junjie Chen and Chengjin Zhang, from the Wuyi Mountain National Park Administration, in conducting the forest resource investigation.
Conflicts of Interest
The authors declare that they have no known competing financial interests or personal relationships that could have appeared to influence the work reported in this paper.
References
- Wei, J.M.; Shen, M.H. Analysis of the efficiency of forest carbon sinks and its influencing factors—Evidence from China. Sustainability 2022, 14, 11155. [Google Scholar] [CrossRef]
- Li, T.; Zou, Y.; Liu, Y.; Luo, P.; Xiong, Q.L.; Lu, H.; Lai, C.H.; Axmacher, J.C. Mountain forest biomass dynamics and its drivers in southwestern China between 1979 and 2017. Ecol. Indic. 2022, 142, 109289. [Google Scholar] [CrossRef]
- Njoroge, B.; Li, Y.L.; Wei, S.M.; Meng, Z.; Liu, S.Z.; Zhang, Q.M.; Tang, X.L.; Zhang, D.Q.; Liu, J.X.; Chu, G.W. An interannual comparative study on ecosystem carbon exchange characteristics in the Dinghushan Biosphere Reserve, a dominant subtropical evergreen forest ecosystem. Front. Plant Sci. 2021, 12, 715340. [Google Scholar] [CrossRef]
- Ge, J.M.; Lin, B.Q. Does the Kyoto Protocol as an international environmental policy promote forest carbon sinks? J. Glob. Inf. Manag. 2021, 30, 1–22. [Google Scholar] [CrossRef]
- Zhao, M.M.; Yang, J.L.; Zhao, N.; Liu, Y.; Wang, Y.F.; Wilson, J.P.; Yue, T.X. Estimation of China’s forest stand biomass carbon sequestration based on the continuous biomass expansion factor model and seven forest inventories from 1977 to 2013. For. Ecol. Manag. 2019, 448, 528–534. [Google Scholar] [CrossRef]
- Adetoye, A.M.; Okojie, L.O.; Akerele, D. Forest carbon sequestration supply function for African countries: An econometric modelling approach. For. Policy. Econ. 2018, 90, 59–66. [Google Scholar] [CrossRef]
- Nyirenda, A. Estimation of the aboveground carbon stock in Kanonge Local Forest of Kaputa District in Northern Province, Zambia. Int. J. Environ. Sci. 2023, 6, 14–31. [Google Scholar] [CrossRef]
- Liang, B.Y.; Wang, J.; Zhang, Z.Y.; Zhang, J.; Zhang, J.P.; Cressey, E.L.; Wang, Z. Planted forest is catching up with natural forest in China in terms of carbon density and carbon storage. Fundam. Res. 2022, 2, 688–696. [Google Scholar] [CrossRef]
- Cavanaugh, K.C.; Gosnell, J.S.; Davis, S.L.; Ahumada, J.; Boundja, P.; Clark, D.B.; Mugerwa, B.; Jansen, P.A.; O’Brien, T.G.; Rovero, F.; et al. Carbon storage in tropical forests correlates with taxonomic diversity and functional dominance on a global scale. Glob. Ecol. Biogeogr. 2014, 23, 563–573. [Google Scholar] [CrossRef]
- Xu, B.; Guo, Z.D.; Piao, S.L.; Fang, J.Y. Biomass carbon stocks in China’s forests between 2000 and 2050: A prediction based on forest biomass-age relationships. Sci China Life Sci. 2010, 53, 776–783. [Google Scholar] [CrossRef] [PubMed]
- Li, Y.; Bao, W.K.; Bongers, F.; Chen, B.; Chen, G.K.; Guo, K.; Jiang, M.X.; Lai, J.S.; Lin, D.M.; Liu, C.J.; et al. Drivers of tree carbon storage in subtropical forests. Sci. Total. Environ. 2019, 654, 684–693. [Google Scholar] [CrossRef]
- Gebeyehu, G.; Soromessa, T.; Bekele, T.; Teketay, D. Carbon stocks and factors affecting their storage in dry Afromontane forests of Awi Zone, northwestern Ethiopia. J. Ecol. Environ. 2019, 43, 7. [Google Scholar] [CrossRef]
- Mewded, B.; Lemessa, D. Factors affecting woody carbon stock in Sirso moist evergreen Afromontane forest, southern Ethiopia: Implications for climate change mitigation. Environ. Dev. Sustain. 2020, 22, 6363–6378. [Google Scholar] [CrossRef]
- Wen, D.; He, N.P. Forest carbon storage along the north-south transect of eastern China: Spatial patterns, allocation, and influencing factors. Ecol. Indic. 2016, 61, 960–967. [Google Scholar] [CrossRef]
- Mngadi, M.; Odindi, J.; Mutanga, O. The utility of sentinel-2 spectral data in quantifying above-ground carbon stock in an urban reforested landscape. Remote Sens. 2021, 13, 4281. [Google Scholar] [CrossRef]
- Zeng, Z.X.; Zhang, A.W.; Wang, Q.T. A research on the problems and solutions in the development of the forest parks in China. Appl. Mech. Mater. 2013, 295, 2343–2346. [Google Scholar] [CrossRef]
- Li, W.; Huang, M.; Zhang, Y.D.; Gu, F.X.; Gong, H.M.; Guo, R.; Zhong, X.; Yan, C.R. Spatial-temporal variations of carbon storage and carbon sequestration rate in China’s national forest parks. J. Appl. Ecol. 2021, 32, 799–809. [Google Scholar]
- Luo, F.; Moyle, B.D.; Bao, J.G.; Zhong, Y.D. The role of institutions in the production of space for tourism: National Forest Parks in China. For. Policy. Econ. 2016, 70, 47–55. [Google Scholar] [CrossRef]
- Chen, S.F.; Xie, L.; Zhou, W.L.; Chen, H.; Xu, X.J.; Jiang, S.; Zang, M.Y.; Peng, Y.; Chen, X.; Duan, Y.F.; et al. Species diversity has a positive interrelationship with aboveground biomass and a mismatch with productivity in a subtropical broadleaf forest on the Wuyi Mountains, China. Diversity 2022, 14, 952. [Google Scholar] [CrossRef]
- Xie, Z.Y.; Li, C.S.; Lin, Y.; Liu, J.F.; He, Z.S. The lagging effect of precipitation on NAIs concentrations on rainy days in Wuyi Mountain National Park, China. Atmosphere 2023, 14, 377. [Google Scholar] [CrossRef]
- Pan, Y.; Birdsey, R.A.; Fang, J.Y.; Houghton, R.; Kauppi, P.E.; Kurz, W.A.; Phillips, O.L.; Shvidenko, A.; Lewis, S.L.; Canadell, J.G.; et al. A large and persistent carbon sink in the world’s forests. Science 2011, 333, 988–993. [Google Scholar] [CrossRef] [PubMed]
- Zhang, Q.G.; Ye, H.; Ding, Y.; Cao, Q.; Zhang, Y.J.; Huang, K. Carbon storage dynamics of subtropical forests estimated with multi-period forest inventories at a regional scale: The case of Jiangxi forests. J. For. Res. (Harbin) 2020, 31, 1247–1254. [Google Scholar] [CrossRef]
- Ding, H.; Fang, Y.M.; Yang, Q.; Chen, X.; Yuan, F.Y.; Xu, H.; He, L.H.; Yan, J.; Chen, T.T.; Yu, C.J.; et al. Community characteristics of a mid-subtropical evergreen broad-leaved forest plot in the Wuyi Mountains, Fujian Province, southeastern China. Biodivers. Sci. 2015, 23, 479. [Google Scholar] [CrossRef]
- Xu, L.; Shi, Y.G.; Fang, H.Y.; Zhou, G.M.; Xu, X.J.; Zhou, Y.F.; Tao, J.X.; Ji, B.Y.; Xu, J.; Li, C.; et al. Vegetation carbon stocks driven by canopy density and forest age in subtropical forest ecosystems. Sci. Total Environ. 2018, 631, 619–626. [Google Scholar] [CrossRef] [PubMed]
- Ge, Z.P.; Wen, W.S.; Xu, L.; Chen, G.S.; Zhou, G.M.; Ji, B.Y.; Zhou, Y.F.; Zhu, G.L.; Shi, Y.J. Vegetation carbon accumulation driven by stand characteristics and climatic factors in subtropical forests of southeastern China. J. Sustain. For. 2022, 41, 941–958. [Google Scholar] [CrossRef]
- Doughty, C.E.; Metcalfe, D.B.; Girardin, C.A.J.; Amézquita, F.F.; Cabrera, D.G.; Huasco, W.H.; Silva-Espejo, J.E.; Araujo-Murakami, A.; da Costa, M.C.; Rocha, W.; et al. Drought impact on forest carbon dynamics and fluxes in Amazonia. Nature 2015, 519, 78–82. [Google Scholar] [CrossRef] [PubMed]
- Fissore, C.; Dalzell, B.J.; Berhe, A.A.; Voegtle, M.; Evans, M.; Wu, A. Influence of topography on soil organic carbon dynamics in a Southern California grassland. Catena 2017, 149, 140–149. [Google Scholar] [CrossRef]
- Li, Q.; Cheng, X.L.; Luo, Y.Q.; Xu, Z.K.; Xu, L.; Ruan, H.H.; Xu, X. Consistent temperature sensitivity of labile soil organic carbon mineralization along an elevation gradient in the Wuyi Mountains, China. Appl. Soil Ecol. 2017, 117, 32–37. [Google Scholar] [CrossRef]
- Li, L.G.; Vogel, J.; He, Z.L.; Zou, X.M.; Ruan, H.H.; Huang, W.; Wang, J.S.; Bianchi, T.S. Association of soil aggregation with the distribution and quality of organic carbon in soil along an elevation gradient on Wuyi Mountain in China. PLoS ONE 2016, 11, e0150898. [Google Scholar] [CrossRef]
- Huang, W.; McDowell, W.H.; Zou, X.M.; Ruan, H.H.; Wang, J.S.; Li, L.G. Dissolved organic carbon in headwater streams and riparian soil organic carbon along an altitudinal gradient in the Wuyi Mountains, China. PLoS ONE 2013, 8, e78973. [Google Scholar] [CrossRef] [PubMed]
- He, S.Y.; Su, Y. Understanding residents’ perceptions of the ecosystem to improve park–people relationships in Wuyishan National Park, China. Land 2022, 11, 532. [Google Scholar] [CrossRef]
- Fang, J.Y.; Chen, A.P.; Peng, C.H.; Zhao, S.Q.; Ci, L.J. Changes in forest biomass carbon storage in China between 1949 and 1998. Science 2001, 292, 2320–2322. [Google Scholar] [CrossRef]
- Pan, Y.D.; Luo, T.; Birdsey, R.; Hom, J.; Melillo, J. New estimates of carbon storage and sequestration in China’s forests: Effects of age–class and method on inventory-based carbon estimation. Clim. Chang. 2004, 67, 211–236. [Google Scholar] [CrossRef]
- Zhou, G.S.; Wang, Y.H.; Jiang, Y.L.; Yang, Z.Y. Estimating biomass and net primary production from forest inventory data: A case study of China’s Larix forests. For. Ecol. Manag. 2002, 169, 149–157. [Google Scholar] [CrossRef]
- Haywood, A.; Mellor, A.; Stone, C. A strategic forest inventory for public land in Victoria, Australia. For. Ecol. Manag. 2016, 367, 86–96. [Google Scholar] [CrossRef]
- Sun, W.L.; Liu, X.H. Review on carbon storage estimation of forest ecosystem and applications in China. For. Ecosyst. 2020, 7, 4. [Google Scholar] [CrossRef]
- Nandal, A.; Yadav, S.S.; Rao, A.S.; Meena, R.S.; Lal, R. Advance methodological approaches for carbon stock estimation in forest ecosystems. Environ. Monit. Assess. 2023, 195, 315. [Google Scholar] [CrossRef] [PubMed]
- Timilsina, N.; Escobedo, F.J.; Staudhammer, C.L.; Brandeis, T. Analyzing the causal factors of carbon stores in a subtropical urban forest. Ecol. Complex. 2014, 20, 23–32. [Google Scholar] [CrossRef]
- Qian, F.; Song, H.Y.; Chen, M.; Zeng, J.Q.; Dang, C.Q.; Tao, J.P. Multivariate path analysis of the relationships between seedling regeneration and environmental factors beneath a dwarf bamboo understory. Ecol. Evol. 2019, 9, 10277–10290. [Google Scholar] [CrossRef]
- Tang, X.L.; Zhao, X.; Bai, Y.; Tang, Z.Y.; Wang, W.T.; Zhao, Y.N.; Wan, H.S.; Xie, Z.Q.; Shi, X.Z.; Wu, B.F.; et al. Carbon pools in China’s terrestrial ecosystems: New estimates based on an intensive field survey. Proc. Natl. Acad. Sci. USA 2018, 115, 4021–4026. [Google Scholar] [CrossRef]
- Ali, A.; Ashraf, M.I.; Gulzar, S.; Akmal, M. Estimation of forest carbon stocks in temperate and subtropical mountain systems of Pakistan: Implications for REDD+ and climate change mitigation. Environ. Monit. Assess. 2020, 192, 198. [Google Scholar] [CrossRef]
- Liu, Q.; Zhou, Z.; Chen, D.X.; Chen, Z.Z.; Lei, J.R.; Xu, H.; Wu, G.L.; Li, Y.D. Carbon storage and variation characteristics of the forest ecosystem in Hainan Tropical Rainforest National Park. Nat. Prot. Areas 2023, 3, 1–10. [Google Scholar]
- Li, Z.G.; Zhu, J.X. Assessment and spatial partitioning of ecosystem services importance in Giant Panda National Park: To provide targeted ecological protection. PLoS ONE 2022, 17, e0278877. [Google Scholar] [CrossRef]
- Wagner, B.; Liang, E.; Li, X.X.; Dulamsuren, C.; Leuschner, C.; Hauck, M. Carbon pools of semi-arid Picea crassifolia forests in the Qilian Mountains (north-eastern Tibetan Plateau). For. Ecol. Manag. 2015, 343, 136–143. [Google Scholar] [CrossRef]
- Borchard, N.; Schirrmann, M.; von Hebel, C.; Schmidt, M.; Baatz, R.; Firbank, L.; Vereecken, H.; Herbst, M. Spatio-temporal drivers of soil and ecosystem carbon fluxes at field scale in an upland grassland in Germany. Agric. Ecosyst. Environ. 2015, 211, 84–93. [Google Scholar] [CrossRef]
- Wang, K.B.; Deng, L.; Ren, Z.P.; Shi, W.Y.; Chen, Y.P.; Shang-Guan, Z.P. Dynamics of ecosystem carbon stocks during vegetation restoration on the Loess Plateau of China. J. Arid. Land. 2016, 8, 207–220. [Google Scholar] [CrossRef]
- Borah, M.; Das, D.; Kalita, J.; Boruah, H.P.D.; Phukan, B.; Neog, B. Tree species composition, biomass and carbon stocks in two tropical forest of Assam. Biomass Bioenergy 2015, 78, 25–35. [Google Scholar] [CrossRef]
- Reich, P.B.; Tilman, D.; Isbell, F.; Mueller, K.; Hobbie, S.E.; Flynn, D.F.B.; Eisenhauer, N. Impacts of biodiversity loss escalate through time as redundancy fades. Science 2012, 336, 589–592. [Google Scholar] [CrossRef]
- Zhang, Y.; Chen, H.Y.H.; Reich, P.B. Forest productivity increases with evenness, species richness and trait variation: A global meta-analysis. J. Ecol. 2012, 100, 742–749. [Google Scholar] [CrossRef]
- Zhang, Y.; Chen, H.Y.H. Individual size inequality links forest diversity and above-ground biomass. J. Ecol. 2015, 103, 1245–1252. [Google Scholar] [CrossRef]
- Forrester, D.I. The spatial and temporal dynamics of species interactions in mixed-species forests: From pattern to process. For. Ecol. Manag. 2014, 312, 282–292. [Google Scholar] [CrossRef]
- Yachi, S.; Loreau, M. Does complementary resource use enhance ecosystem functioning? A model of light competition in plant communities. Ecol. Lett. 2007, 10, 54–62. [Google Scholar] [CrossRef] [PubMed]
- Zhang, Z.R.; Zhong, Q.L.; Cheng, D.L.; Huang, Z.Q.; Xu, C.B.; Yu, H.; Xiao, S.H. Carbon dynamics in three subtropical forest ecosystems in China. Environ. Sci. Pollut. Res. 2020, 27, 15552–15564. [Google Scholar] [CrossRef] [PubMed]
- Luo, Y.H.; Ma, L.L.; Seibold, S.; Cadotte, M.W.; Burgess, K.S.; Tan, S.L.; Ye, L.J.; Zheng, W.; Zou, J.Y.; Chen, Z.F.; et al. The diversity of mycorrhiza associated fungi and trees shapes subtropical mountain forest ecosystem functioning. J. Biogeogr. 2023, 50, 715–729. [Google Scholar] [CrossRef]
- Yan, G.Y.; Bongers, F.J.; Trogisch, S.; Li, Y.; Chen, G.K.; Yan, H.R.; Deng, X.L.; Ma, K.P.; Liu, X.J. Climate and mycorrhizae mediate the relationship of tree species diversity and carbon stocks in subtropical forests. J. Ecol. 2022, 110, 2462–2474. [Google Scholar] [CrossRef]
- Domke, G.M.; Perry, C.H.; Walters, B.F.; Woodall, C.W.; Russell, M.B.; Smith, J.E. Estimating litter carbon stocks on forest land in the United States. Sci. Total. Environ. 2016, 557, 469–478. [Google Scholar] [CrossRef]
- Park, A. Carbon storage and stand conversion in a pine-dominated boreal forest landscape. For. Ecol. Manag. 2015, 340, 70–81. [Google Scholar] [CrossRef]
- Bradford, J.B.; Jensen, N.R.; Domke, G.M.; D’Amato, A.W. Potential increases in natural disturbance rates could offset forest management impacts on ecosystem carbon stocks. For. Ecol. Manag. 2013, 308, 178–187. [Google Scholar] [CrossRef]
- Wei, H.; Man, X.L. Carbon storage and its allocation in Betula platyphylla forests of different ages in cold temperate zone of China. J. Plant. Ecol. 2019, 43, 843. [Google Scholar] [CrossRef]
- Fan, T.J.; Luo, R.L.; Xia, H.Y.; Li, X.P. Using LMDI method to analyze the influencing factors of carbon emissions in China’s petrochemical industries. Nat. Hazards 2015, 75, 319–332. [Google Scholar] [CrossRef]
- Feng, B. Forest carbon sink resource asset evaluation with case study of Fujian Province in China. Math. Probl. Eng. 2022, 2022, 7391473. [Google Scholar] [CrossRef]
Disclaimer/Publisher’s Note: The statements, opinions and data contained in all publications are solely those of the individual author(s) and contributor(s) and not of MDPI and/or the editor(s). MDPI and/or the editor(s) disclaim responsibility for any injury to people or property resulting from any ideas, methods, instructions or products referred to in the content. |
© 2024 by the authors. Licensee MDPI, Basel, Switzerland. This article is an open access article distributed under the terms and conditions of the Creative Commons Attribution (CC BY) license (https://creativecommons.org/licenses/by/4.0/).