Abstract
Although a growing number of studies have suggested the relevance of greenspace exposure to respiratory health, most have explored single greenfield indicators or selected disease outcomes. This systematic review aimed to comprehensively assess the evidence that greenspace exposure is associated with chronic obstructive pulmonary disease (COPD) incidence, prevalence, mortality, and related lung function indicators and to explore the impact of greenspace exposure on COPD-related disease outcomes. We searched the literature published before 28 September 2023, using six electronic databases and snowball searches. After screening 3689 studies, 16 eligible studies were included. These studies examined various greenspace indicators such as the Normalized Difference Vegetation Index (NDVI), canopy coverage, greenspace coverage, and land cover conditions. Most studies have reported the positive effects of greenspace exposure. However, the findings had significant heterogeneity, with large differences in the greenness assessment, COPD identification methods, and population characteristics. The mechanisms of this impact have not been conclusively determined, but we propose several hypotheses to explain the pathways by which greenspace exposure affects COPD. Overall, our findings contribute valuable knowledge for understanding the relationship between greenspace exposure and COPD, informing future research in this field.
1. Introduction
Chronic Obstructive Pulmonary Disease (COPD) is a major global public health challenge and a leading cause of chronic morbidity and mortality worldwide [1]. Chronic respiratory symptoms characterize this heterogeneous lung disease, including dyspnea, cough, and sputum production [2]. The worsening of these symptoms is associated with airway abnormalities (bronchitis and bronchiolitis) and/or alveolar abnormalities (emphysema), leading to persistent and often progressive airflow obstruction [3]. Based on data from the Burden of Obstructive Lung Diseases (BOLD) and other large-scale epidemiological studies, the estimated global prevalence of COPD is 10.3% (95% CI: 8.2%, 12.8%) [4]. Owing to the increasing prevalence of smoking in low- and middle-income countries and the aging population in high-income countries, the prevalence of COPD is projected to increase. According to the Global Burden of Disease study, COPD accounted for 4.72% of all-cause mortality in 2017, or approximately 42 deaths per 100,000 individuals [5,6,7]. It is estimated that approximately 3 million people die from COPD globally annually [8].
The primary environmental exposure that contributes to COPD is toxic gases and particles caused by indoor and outdoor air pollution. Other environmental and host factors may also contribute to the increased prevalence and mortality associated with COPD [4,9,10]. However, among the relevant environmental factors, exposure to greenspaces has been found to benefit respiratory health [11,12,13]. Greenspaces are open, visible, and accessible areas within urban areas that primarily consist of plants, grass, trees, and other greenery [14,15,16]. In recent years, many researchers have begun to study whether exposure to green areas or spaces benefits human respiratory health [17,18,19,20]. Some studies have shown that greenery can reduce the risk of lung disease by reducing exposure to environmental hazards (e.g., air pollution and allergens) [21,22,23]. Greenspaces can provide venues for increasing physical activity [24], enhancing opportunities for social participation [19,25], and reducing stress [26], all of which can strengthen lung function and promote good health [27].
Over the past 15 years, many epidemiological studies have provided evidence of the relationship between exposure to green environments and COPD. However, these studies have presented inconsistent or contradictory results. Some studies have reported beneficial associations between greenspaces and COPD prevalence and mortality [28,29,30], whereas others have found no correlation [31] or harmful associations [32,33]. Three previous systematic reviews and meta-analyses have summarized the evidence on the association between urban green spaces and respiratory health, Lambert et al. [34] only included studies focused on children’s populations. Mueller et al. [35] conducted an overall review of studies on urban greenspaces and respiratory health pathways; however, the summary was incomplete, as only four cross-sectional studies were included in the COPD-specific report, which included only a partial set of health outcomes. Tang et al. [36] did a synthesis of chronic respiratory diseases and found that increased exposure to green space was associated with reduced mortality from COPD (RR = 0.95, 95% CI: 0.92–0.99), but not with COPD incidence and prevalence. Due to the condition of the study methodology, the included literature only used objective indicators of continuous NDVI to evaluate green space exposure, with high heterogeneity. Given the rapidly increasing number of studies published in recent years on green space and COPD outcomes, the type and range of indicators of green space exposure varied. Therefore, there is a need for comprehensive studies involving a wider range of COPD-related disease outcomes using a more comprehensive system of quality evaluation indicators [37].
Therefore, we reviewed evidence on the relationship between greenspace exposure and COPD incidence, prevalence, and mortality. We used a more comprehensive evaluation tool focused on the Greenspace Indicator (GSI) statistic and a systematic review of the existing evidence in the context of studies related to COPD rehabilitation and treatment [38]. The objectives of this review are: (1) to investigate the overall correlation of the results from all relevant studies and explore the impact of greenspace exposure on COPD-related disease outcomes. (2) To analyze and summarize the reasons for heterogeneity in the findings of relevant studies and provide recommendations for future research, and (3) to utilize existing evidence to explore possible pathways through which greenspace exposure may affect COPD.
We expect this review to provide professionals, policymakers, and practitioners with an illuminating direction and a more comprehensive basis for demonstrating the link between exposure to greenspaces and the risk of COPD-related diseases from greenspace quality and green exposure perspectives [39]. Integrating evidence from multiple disciplines, such as public health, medicine, epidemiology, and the environment, highlights the critical importance of interdisciplinary and multi-sectoral/agency collaboration, including the fields/sectors of public health, urban planning, and transportation, to enable the development of more effective non-pharmacological intervention strategies that can contribute to greater concern for one’s health and the prevention or control of COPD.
2. Materials and Methods
This review was conducted per the Preferred Reporting Items for Systematic Evaluation and Meta-Analysis (PRISMA) guidelines [40] and was registered on the PROSPERO registry platform (ID: CRD42023478558).
2.1. Search Strategy
To ensure the comprehensiveness of the review, we first conducted a free search. We constructed an extensive list of keywords to capture as much literature on greenspace exposure and COPD as possible. The search terms were based on a combination of keywords from the research themes ‘greenspace’ and ‘COPD’. ‘Greenspace’ keywords include (natural environment*, natural area*, natural space*, natural scene*, natural setting*, natural view*, greenness, greenery, greenspace*, etc.). ‘COPD’ keywords include (Pulmonary Disease, Chronic Obstructive, Chronic Obstructive Lung Disease, Chronic Obstructive Pulmonary Diseases, COAD, COPD, etc.). The search was conducted in September 2023 using a series of systematic literature searches of six databases: Web of Science, PubMed, Scopus, Cochrane Library, Embase, and EBSCOhost. In addition, we used the snowballing technique to search for all eligible studies and consulted the reference lists of relevant systematic reviews for potentially relevant studies (details of the full search strategy are shown in Table S1).
2.2. Eligibility Criteria
The criteria for inclusion and exclusion in our study are as follows: (1) Literature types: inclusion of studies or conference papers published in peer-reviewed journals. (2) Language: Only English articles were included. (3) Research topic: inclusion of studies reported on the relationship between greenspace and COPD. (4) Research methods: inclusion of studies assessed greenspace exposure using subjective (e.g., subjective proximity to greenspace, subjective perception of greenspace, etc.) or objective (e.g., NDVI, canopy cover, greenspace per capita, etc.) metrics not limited to the evaluation by professional reviewers using Geographic Information Systems (GIS) or a unified tool. Studies lacking greenspace measurement indicators or where greenspace was treated as a covariate rather than an independent variable, and studies using indoor greenness assessments or climate indicators unrelated to greenness, such as heat exposure, were excluded. (5) Research results: inclusion of studies reported on results related to COPD, such as prevalence, incidence, mortality, and so on. Studies on the quality of life of people with COPD were excluded, as these results did not provide information on whether greenspaces correlate with COPD. (6) Study types: Qualitative studies were excluded.
2.3. Study Selection
The retrieved articles were imported into the online tool EndnoteX9 (Thomson ResearchSoft Co. Ltd., Stamford, CT, USA) to screen and manage search results, and duplicates were removed from the combined search results. Titles and abstracts were screened to exclude articles not meeting the inclusion criteria. Two reviewers (Y.G. and K.P.) independently conducted a full-text analysis of the remaining articles to determine their eligibility for inclusion in the final review. In cases of disagreement between the reviewers, the paper was referred to a third reviewer (Z.B.) for discussion and resolution until a consensus was reached.
2.4. Data Extraction
The following information was extracted from eligible studies by two independent researchers (Y.G. and K.P.): author, publication year, study location (minimum administrative unit: city), period, study design, sample size, sample sex, sample age, sample group attributes, statistical methods, greenspace type, greenspace measurement methods, greenspace exposure, intervention methods and procedures (intervention studies only), outcome estimation, COPD outcomes, confounders/covariates, and main results. Any differences in opinion were resolved through a joint discussion to reach a consensus.
2.5. Quality Evaluation
To evaluate the design and implementation of each study, including the assessment of threats to validity, reliability, generalizability, risk of bias, and quality of reporting. We modified and revised the quality assessment frameworks of Gascon et al. [41], Lachowycz et al. [38], and de Keijzer et al. [42] Based on this, we established evaluation criteria for research on greenspaces and COPD; refer to the Supplementary Materials for detailed information (Table S2). The quality assessment of the scale was based on research methods, greenspace exposure assessment, and outcome evaluation. The quality assessment of the scale (Table S3) was based on research methods, greenspace exposure assessment, and outcome evaluation, and a total of 15 criteria with a total score of 0–22 were set for the study quality assessment and peer-reviewed by the researchers according to the question categories. To summarize the studies included in this review, the following grades were determined: low-quality studies (0–14), medium-quality studies (15–17), and high-quality studies (18–22). Two independent reviewers assessed the quality of each included study, while a third reviewer assisted in resolving evaluation inconsistencies. The review also included two experimental studies evaluated for the risk of bias using the Cochrane Risk of Bias 2.0.
3. Results
3.1. Identification of Studies
The literature search selection process and summary results are shown in Figure 1. We conducted an initial search across six databases using the predetermined list of keywords described earlier, which retrieved 3680 articles, and we added 9 studies from the manually retrieved references. After removing 1407 duplicate articles, 2282 unique articles remained. We performed title and abstract screening and excluded 2251 irrelevant articles, leaving 31 records for a full-text review. After full-text screening, 15 articles were excluded, and 16 eligible papers were identified for the final analysis. These papers were classified based on the study type.
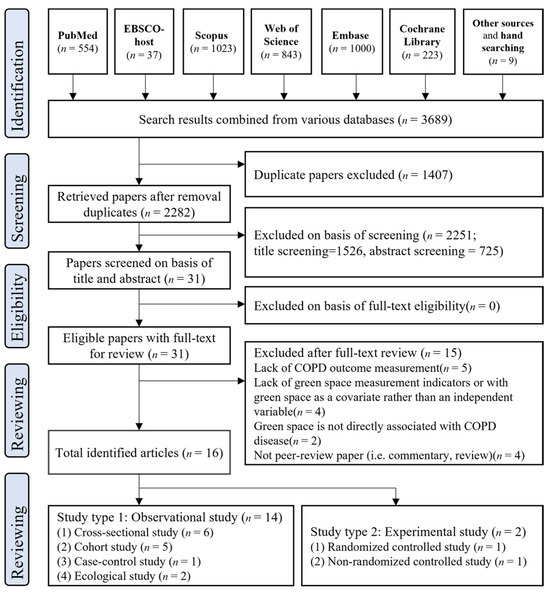
Figure 1.
Study selection procedure using the PRISMA guidelines.
3.2. Study Characteristics
Table 1 and Table S4 provide the characteristics of the studies included in this review, and Table 2 summarizes the studies’ characteristics for study type, study location, study period, and publication year.

Table 1.
Characteristics of the included studies.
Table 2.
Summary of study characteristics across 16 studies included in this review.
Among the 16 studies included in the final review analysis, the most eligible studies (n = 14) were observational, with six cross-sectional [29,30,32,33,43,44], five cohort [27,28,31,46,47], one case-control [45], and two ecological studies [48,49]. The remaining two studies were experimental (one randomized controlled study [50] and one non-randomized controlled study [51]).
The years since the publication of these studies ranged from 2009 (n = 1) [29] to 2023 (n = 3) [44,47,48]. It is worth noting that after the study by J. Maas et al. [29], there was a gap of nearly six years, with no relevant studies until after 2016 when researchers started to pay gradual attention and conduct studies in the direction of the correlation between greenspace exposure and COPD. The number of relevant studies gradually increased after 2021, with five studies published in 2022 [27,43,45,46,49], the year with the highest number of publications. Among the included studies, seven were conducted in China [31,32,43,44,46,48,50], eight in Europe (the United Kingdom [27,30,47], Belgium [28], the Netherlands [29], Poland [45], Greece [49], and Germany [51]), and one in Atlanta [33].
Sample sizes varied widely across studies, ranging from 18 [50] to nearly 2.2 million [28]. More than half of the studies had sample sizes numbers greater than 50,000 (n = 10; 62.5%). The sample population in most studies included children, adults, older adults, and the general population, with some studies (n = 5) [29,43,45,50,51] using a sample size restricted to COPD patients registered in healthcare facilities such as hospitals and clinics. The average age of participants ranged from 12 to 89 years. All studies included both sexes, and in studies with specific data presentation (n = 10) [27,28,30,31,32,43,44,45,47,50], the male-to-female sample size ratio was evenly split.
3.3. Greenspace Indicators
Table 3 summarizes the characteristics of the greenspace indicators used in the 2 experimental and 14 observational studies, based on whether single or multiple greenspace indicators were used, the measurement methods for greenspace indicators, the sources of greenspace data, and the spatial resolution and buffer size. A higher percentage of studies (63%) [29,30,32,43,45,47,48,49,50,51] used a single greenspace indicator.
Table 3.
Summary of greenspace indicators.
For the experimental studies, the type of greenspace involved was forest, specifically using the forest bathing intervention for the experiments, and the control group relied on urban and indoor spaces as control environments. Jia et al. conducted a controlled experiment in Hangzhou by randomly dividing 20 people into two groups, both of which had the same experimental items, starting with blood collection after waking up in the morning, breakfast, walking, hotel leisure time, hotel lunch, and rest time; afternoon walking, afternoon hotel leisure time, hotel dinner, evening hotel leisure time, and sleep [50]. The only difference was the location of the walks, forests, and cities. Another experimental study by Janik et al. was conducted in Mecklenburg-Vorpommern, Germany, in 2017. A rehabilitation forest (HF) has been established for patients with specific medication requirements. All patients underwent a standard inpatient pulmonary rehabilitation program for 21 days. The intervention group received five ‘expert-guided 60-min HF exercise and relaxation modules’, and the control group received five ‘expert-guided indoor activities’. The number of sessions in both studies was one, and the duration of exposure to the forest area was 4 and 21 days, respectively [51].
Observational studies have generally included residential greenspaces, community greenspaces, private residential garden greenspaces, and large-scale public greenspaces. The literature included in this review has different signs of greenspace measurement methods for different greenspace types, which can be broadly divided into the following three categories:
3.3.1. Overall Greenness or Vegetation—NDVI
Many indicators defined greenspace exposure, the most common being NDVI (n = 9) [28,30,31,32,43,44,47,48,49]. The NDVI is a measure of greenness at the regional level using GIS and is based on calculations from satellite imagery [52]. It is commonly used to assess vegetation growth status, monitor drought conditions, monitor crops, and conduct land use studies, and has been proven useful in epidemiological research. NDVI takes values between −1 and 1, with values close to −1 indicating that the land cover is predominantly water or wetlands, close to 0 indicating that the land surface is essentially devoid of vegetative cover, and close to 1 indicating dense vegetative cover, such as in temperate and tropical rainforest areas [53]. Greenness measured by the NDVI refers to all vegetation, including structured spaces within parks, community greenspaces, and unstructured spaces such as forests.
3.3.2. Canopy Cover, Greenspace Cover (Percentage of Greenspace) and Land Cover
Six research articles defined greenness as the amount of greenspace/land coverage [27,29,46] or canopy coverage [33,45]. Canopy cover is the area of public and private land covered by a canopy of trees, and it can be measured using various methods [54], among which remote sensing techniques such as aerial photography, satellite imagery, and drone imagery are commonly used. Greenspace and land cover reflect the proportion of land covered by some vegetation, but the definitions of vegetation types vary between studies. Roscoe et al., in a research paper on the association of greenspace exposure with COPD mortality in England, used Ordnance Survey (OS) Master Map™ (Landmark Information Group Ltd., Exeter, UK) greenspace data to assess greenspace exposure around participants’ geocoded residential addresses at baseline and to differentiate between total greenspace cover, private residential garden cover, and greenspace cover outside of private gardens (e.g., parks, sports pitches, etc.) [27]. Zhao et al. examined the impact of greenspaces on mitigating COPD mortality, used greenspace measurements for Chinese provincial administrative districts (https://www.mohurd.gov.cn/) to estimate urban greenspace exposure, and assessed urban greenspace coverage based on urban remote sensing surveys and testing standards [46]. The authors also used the planar projected area to calculate greenspace coverage and the vertical projected area of vegetation to calculate the three-dimensional greenspace [46].
3.3.3. Other Greenness Measures
In addition, this review includes several papers that incorporate other measures of greenspace exposure, including (1) Park access [33]. (2) The Enhanced Vegetation Index (EVI) reflects more detailed surface vegetation characteristics of densely vegetated areas [44]. (3) Modified Soil-Adjusted Vegetation Index 2 (MSAVI2) [28]. (4) Subjective perceptions of community greening based on the percentage of households in each Belgian census area reporting a good supply of greenspace in their neighborhood in the 2001 census, with the question (‘What do you think of neighborhood facilities? The greenspace’) and rated on a three-point Likert scale (‘poor facilities’, ‘fair facilities’, or ‘very good facilities’) [28].
3.4. Associations between Greenspace Exposure and COPD Outcomes
Table 4 summarizes the relevance of the impact of greenspace exposure on each COPD outcome. As some studies investigated multiple outcomes, aggregated outcomes were higher than the number of scientific articles included. The outcome indicators for all the studies were divided into four categories: prevalence (n = 4) [30,32,33,43], incidence or disease exacerbation (n = 3) [29,45,47], mortality (n = 6) [27,28,31,46,48,49], and lung function indicators in COPD (n = 4) [43,44,50,51]. Three studies assessed the correlation between greenspace exposure and COPD prevalence using the odds ratio (OR) of the NDVI per quartile increment to the odds of COPD [30,32,43]. Another study examined the influence of different forms of greenspace exposure, including tree canopy cover and other spatial types, on prevalence through Pearson’s correlation coefficients [33]. One cross-sectional study, one cohort study, and one case-control study were conducted to determine the incidence and exacerbation of the disease. This cross-sectional study examined the correlation between a 10% increase in greenspace area within 1 km and the OR for COPD prevalence [29]. A case-control study from Poland assessed the impact of greenspaces on COPD exacerbation in middle-aged and elderly individuals using the OR of forest cover inpatient residential areas and the likelihood of COPD exacerbation [45]. A cohort study utilized hazard ratios (HR) of the incremental quartile increase in NDVI within a 500 m buffer zone to evaluate the association between residential greenery and COPD incidence [47]. Four studies investigated the direct association between greenspaces and COPD mortality, and two included mediating variables related to air pollution. Sun et al. investigated the short-term association between residential greening and COPD mortality due to air pollution [31]. Zhao et al. investigated the association between greenspace and COPD mortality due to Particulate Matter 2.5 (PM2.5) [46]. As COPD affects the airways and structures, lung function indicators are crucial markers of respiratory health. Obstructive abnormalities can be assessed using parameters such as Forced Expiratory Volume in 1 s (FEV1) and Forced Vital Capacity (FVC). The four studies used different markers for the relevant pulmonary function parameters, with FVC and FEV1 included twice and commonly used as typical indicators.
Table 4.
Summary of associations between greenspace exposure and COPD outcomes.
3.4.1. COPD Prevalence
Four original studies included in this review focused on the prevalence of COPD. All these were cross-sectional studies. The results presented in existing research reveal inconsistent effects of green spaces on the prevalence of COPD. Sarkar et al. [30] found that residential greening was associated with an 11.4% reduction in COPD prevalence per quartile of the reported increase in NDVI greening. This finding was similarly confirmed in a study by Xiao et al. [43], where NDVI within a 500 m buffer of residential greenery was associated with a 10% reduction in COPD prevalence. Still, the study also noted that this association was only significant in young and middle-aged adults, females, and nonsmokers. In the remaining two COPD prevalence-related articles, Fan et al. [32] found that community greening may be a risk factor for COPD. Similar conclusions were reached by Servadio et al. [33] who found that greater canopy cover and accessibility to greenspaces were associated with a higher COPD prevalence.
3.4.2. COPD Incidence and Exacerbations
The evaluation of the results of the three studies on the impact of greenspaces on COPD differed; two studies demonstrated the positive benefits of greenspaces. Yu et al. [47] researched individuals aged 38–70 in 22 cities in the UK and found that long-term exposure to residential greenness was associated with a decrease in the incidence of COPD. J. Maas et al. [29] reported similar findings, showing that people had a lower annual incidence of COPD in living environments with a higher proportion of greenspace within a 1 km radius. The results of the remaining study [45], which explored the worsening of COPD, did not reveal any statistically significant effects.
3.4.3. COPD Mortality
Among the six cohort studies focused on COPD mortality, four found a protective association between greenspaces and mortality rates, one found no association, and one found a mixed association. In studies with negative correlations, Bauwelinck et al. [28] found a statistically significant negative correlation between COPD mortality rates and indicators of residential greenness. The strongest correlation was observed between COPD mortality rates and subjectively perceived greenness in residential neighborhoods compared to surrounding residential greenness/landscapes. Roscoe et al. [27] found a particularly strong negative correlation between the total greenspace area, private residential garden area, and COPD mortality. Zhao et al. [46] found that increased exposure to greenspace was associated with reduced COPD mortality due to PM2.5 when PM2.5 was used as a mediator. In a study of greenspaces and COPD mortality in Chongqing, China, Gou et al. [48] found a negative correlation, but only in the northeastern and northwestern regions. In contrast, a positive correlation was found in the remaining 63% of the cities. However, Sun et al. [31] showed no correlation between greenspaces and COPD-related deaths caused by air pollution.
3.4.4. Indicators of Lung Function with COPD
In this review, four studies focused on greenspace exposure and the above lung function indicators: two cross-sectional studies [43,44], and two experimental studies [50,51]. Lung function indices included four major categories: indicators of obstructive ventilatory dysfunction (FEV1, FVC, and FEV1/FVC) [55,56], large airway dysfunction (PEF) [43,57], small airway dysfunction (FEF25%–75% and FEV3/FEV6) [43,55,58], and other indicators. FEV1, FVC, and FEV1/FVC ratio are the main indices for diagnosing COPD, and their reduction may reflect obstructive ventilation dysfunction. Zhang et al. [44] found that an increase in each quartile of NDVI was associated with improved lung function in people under 60 years of age, females, urban populations, nonsmokers, areas with moderate PM2.5, and individuals with a BMI of less than 28 kg/m2, i.e., greenspaces had a positive effect on COPD. Two experimental studies have discussed the effects of forest bathing on the health of patients with COPD. Jia et al. [50] conducted an intervention study on 20 elderly patients with COPD who had not experienced acute exacerbations for at least six weeks. They compared indicators such as perforin and granzyme B expression, pro-inflammatory cytokine and stress hormone levels, and Profile of Mood States (POMS) negative subscale scores before and after forest bathing. The results showed a decrease in these indicators, indicating that forest bathing has a beneficial effect on reducing inflammation and stress levels in elderly patients with COPD. Janik et al. [51] conducted a study measuring FEV1 before and after forest bathing in patients with COPD and concluded that forest bathing positively impacts COPD.
3.5. Quality Assessment and Risk of Bias
Fourteen observational studies were evaluated using a previously described quality assessment scale. Overall, the methodological quality of the observational studies was relatively high, with most studies (n = 10, 71%) scoring ≥ 15. Eight studies were of moderate quality [28,31,32,33,43,45,46,47], and two were of high quality [27,44]. Four studies scored less than 15 [29,30,50,51], and the lower scores were because they used only one green space exposure indicator in their studies. The accessibility, quality, and utilization of green spaces are not assessed or quantified. For example, J. Maas et al. [29] used the percentage of green areas as evaluation data for green spaces. In contrast, Sarkar et al. [30], Gou et al. [48], and Kasdagli et al. [49] only used NDVI to measure green exposure. Most studies with moderate scores have used relatively single-dimensional indicators regarding greenspace. Using only one greenspace indicator cannot fully represent the multidimensional impact of greenspaces on human health, which deepens the limitations of this study. Therefore, considering various aspects of greenspace quality and usage, or adopting multiple indicators to measure greenspace exposure will result in higher assessment scores. One cross-sectional study and one cohort study both scored 18. Zhang et al. [44] and Roscoe et al. [27] conducted a comprehensive assessment of greenspaces by measuring and evaluating various aspects such as type, quality, and use of greenspaces.
The Cochrane Risk of Bias 2.0 was used to evaluate the two experimental studies. Neither of the studies provided specific descriptions of the randomization methods. One study only stated that it was randomized [50], whereas it was unclear whether the other study was randomized, raising the suspicion that it was a non-randomized controlled experiment [51]. Neither of the studies also provided information on whether allocation concealment was implemented. However, in both studies, no significant baseline differences were found between the intervention groups, so despite the lack of clarity about the randomization methods and the distribution of hidden information, the study by Jia et al. received a rating of ‘some concern’ in the ‘Randomization process’ item [50], while the other study [51] was rated as ‘high.’ For the item ‘Selection of the reported result,’ neither of the studies mentioned whether the data aligned with the pre-specified study plans of the analysts. However, both studies provided detailed descriptions of the experimental analysis methods and reported multiple outcomes. Therefore, both studies were rated as having ‘some concerns.’ Considering the risk of bias assessment, the first study had an overall risk of bias rated as ‘some concern’ [50]. In contrast, the second study had an overall risk of bias rated as ‘high risk’ [51].
4. Discussion
To our knowledge, this is the first systematic review to assess the possible association between multiple greenspace exposure indicators and COPD. The aim of our study was to summarize the published evidence on the associations between multiple greenspace exposure metrics and COPD outcomes, as well as the causal pathways that may shape these associations. We identified 11 studies out of 16 that showed a protective effect of green space exposure on COPD, and the green space metrics involved included NDVI, greenspace/land cover, three-dimensional greenspace, park access, EVI, MSAVI2, perceived green space, and forest bathing [27,28,29,30,43,44,46,47,49,50,51]. In this review, we found that having more opportunities for green exposure or greater exposure to green spaces was associated with a decreased risk of COPD incidence, prevalence, exacerbation, and mortality, despite the heterogeneity of the included study results. This review included a wide range of study types and comprehensively evaluated the impact of multiple greenspace types on COPD. Based on a pooled analysis of the included studies, several weak aspects of the available empirical evidence are revealed, and possible reasons for the heterogeneity of results are explained.
4.1. Assessment of Greenness
While analyzing the included articles, we found significant differences among the studies’ features, including the definition and measurement of green exposure, data sources, spatial resolution, and buffer zones.
Of the 14 observational studies, nine utilized NDVI and EVI as metrics for green exposure. First, regarding current global availability and applicability, NDVI measurement has higher usage and represents greenness to a certain extent. A previous meta-analysis study used NDVI as a definition of green space exposure to analyze its relationship with chronic respiratory health [36]. However, the NDVI estimates are a general measure of the surrounding vegetation and do not reflect the quality or type of vegetation. It does not accurately represent participants’ actual exposure to greenness, their perception and use of greenspaces, or the quality and type of green structures. Different vegetation types or structures can also impact respiratory health, but neither NDVI nor EVI can accurately reflect this [59,60]. Second, the buffers used to measure residential greening varied across studies, with studies examining NDVI using a variety of spatial buffer ranges (from 100 to 5000 m) to explore NDVI correlations and assess the degree of greening at administrative boundaries (e.g., at the county level, at the level of census blocks). However, sensitivity analyses and comparisons of the study results showed that these variations in spatial resolution and buffer zone size did not significantly affect the associations. Generally, studies measure greenness in areas surrounding participants’ residential addresses, and most use geocoded addresses or spatial units at the individual level for greenness assessments. Third, the nine studies that used NDVI to measure greenness differed in their scaling methods for estimating residential greenness. Most studies provided estimates of the increase based on the interquartile range of the data. However, one study used a pixel-wise dichotomous model to retrieve vegetation cover from NDVI data and categorized it based on minimum, median, and maximum values [48]. Fourth, seasonal variation in greenspaces is an important factor to consider. The morphology of greenspaces varies greatly across countries and regions, and the magnitude of change differs across areas. Of the nine studies that used NDVI, four calculated the average NDVI for the entire year [31,43,44,48], and one used NDVI for the five years before the survey, with images of cloud-free days in January, April, June, and October selected for each year to represent the four seasons. Calculating the monthly or annual averages prevented potential temporal mismatches and the influence of seasonal greenness changes [32]. The remaining four studies calculated the greenness index for each region or cohort based on cloud-free images during the summer [28,30,47,49]. Greenness may vary significantly between seasons, depending on the climate and vegetation distribution. To address this issue, researchers can consider using multiple images, either averaged or repeated measurements, and adjusting the time of day or season of the measurement.
A limited number of studies have utilized land cover/land use databases to assess greenness, for example, the percentage of greenspace [29], forest cover [45], and greenspace cover [27,46]. Other studies have assessed multiple green indicators, such as tree canopy coverage and park access [33], objective green indicators, and subjectively perceived neighborhood greenness [28].
It is worth noting that these indicators cannot represent all the dimensions of greening, and factors such as low spatial resolution, buffer size, and different types of green space may affect assessment accuracy [61]. Additionally, among the 16 studies included, only 2 incorporated greenspace quality and used it in their research design. In their study, Coppel et al. [62] pointed out that how urban residents use and access greenspaces can impact their physical health. Although the ‘quality’ of greenspaces can be subjective, several studies have assessed the different characteristics associated with the ‘quality’ of greenspaces, including accessibility, maintenance, variability, landscape color, presence of pet areas, and safety. Other factors, such as accessibility to walking paths and lighting conditions, are also associated with greenspace quality [63,64]. Therefore, future research needs to consider more detailed information, such as the type of greenspace used, accessibility, and quality of local greenspaces, to better understand the relationship between greenspaces and respiratory diseases.
4.2. Possible Causes of Heterogeneity in Greenspace Exposure Impact Outcomes
We found that most studies concluded that greenspace exposure positively affected COPD outcomes. Still, some studies had the opposite conclusion or found no evidence to support a correlation between greenspace and COPD outcomes. Our findings suggest that the lack of a standardized method for defining COPD outcomes may have contributed to the heterogeneity of the study results. The six studies on COPD mortality were all cohort studies, and mortality data were obtained from census data or death detection data provided by regional CDCs. The results obtained for the correlation between greenspace exposure and COPD mortality were relatively uniform (4 positive effects [27,28,46,49], 1 no effect [31], and 1 mixed correlation [48]). However, of the 10 studies (8 observational, 2 experimental) addressing COPD incidence, prevalence, disease exacerbations, and measures of lung function indices, 6 studies used spirometry to determine the prevalence of COPD in experimental participants [30,32,43,44,47,49]. Eligible participants inhaled a bronchodilator (salbutamol 400 μg) for 15–20 min before being administered a bronchodilator by trained Staff performed post-bronchodilator spirometry using a spirometer according to the standardized protocol recommended by the American Thoracic Society, and relevant lung function indices were obtained [2,65]. COPD is defined as a post-bronchodilator FEV1 to FVC ratio of less than 0.7, according to the Global Initiative for Chronic Obstructive Lung Disease definition criteria [2]. The study by Sarkar et al. [30] did not mention conducting the spirometry trial mentioned above but required available spirometry data to include participants. Two experimental studies used relevant lung function indices to determine the experimental effects of forest bathing. It has also been suggested that bronchodilator reversibility trials are not completely reliable, as the results may be affected by the trial date, the severity of baseline lung function impairment before the trial, and the number of medications used in the trial [66]. The remaining four observational studies used electronic medical records, disease database searches, and census data to determine the participants’ COPD outcomes. The diagnostic data’s quality, coverage, and completeness may vary depending on the data source. Therefore, different methods of determining COPD outcomes may have impacted the study results.
Our findings also indicate that regional differences may contribute to the heterogeneity of the results. The 16 studies included in our analysis were conducted in 8 different countries, and significant variations in the association between greenspaces and COPD outcomes were observed across different regions. Even within the same city, mixed correlations were observed in different areas. For example, in a study by Gou et al. [48] examining the spatial relationship between greenspaces and COPD mortality in Chongqing, China, they found that vegetation coverage had a positive impact on COPD mortality in 63% of townships but a negative impact in 37.0% of townships. One explanation based on geographic regional differences may be that the composition of vegetation and the quality of the environment are not consistent over a wide geographic range. The dominant vegetation types vary from region to region, and differences in vegetation diversity and green space structure can also have different effects on respiratory health [67]. Some studies have suggested that areas with superior natural environments and well-developed greenspaces can act as natural barriers, optimize air quality, mitigate air pollution, provide favorable environments, and reduce the risk of respiratory diseases [68,69]. However, high levels of greenspace exposure do not always have positive effects, may even lead to environmental burdens in some areas [70,71]. For example, it has been found that Pinus pollen, a major pollen type in Southern China, may have adverse effects on human lung function [71,72]. Areas with larger tree canopies can lead to an increased risk of respiratory disease in populations exposed to more allergens, particulate matter, or ozone [73]. Most of the studies included in this review used measurements such as NDVI and EVI, which cannot directly reflect the diversity of vegetation types and greenspace structures, and we were not able to perform more in-depth categorical descriptions and analyses. Therefore, we hope that researchers from more countries or regions can provide more detailed research data on green space composition and vegetation types in the future in order to attempt to seek more comprehensive evidence.
In this study, socioeconomic status was considered a major potential source of heterogeneity. Roscoe et al. [27] observed that the beneficial impact of greenspaces on respiratory disease mortality was stronger for participants living in poverty-stricken areas with relatively low incomes. J. Maas et al. [29] found similar results in their study, showing that for low-income groups, particularly those with lower educational attainment, increased exposure to greenspaces was associated with a lower prevalence of COPD than higher education groups (OR 0.98; 95% CI 0.96 to 1.00). This may be because poorer people have less access to green spaces due to their work or living conditions [74], and therefore, the benefits of increased green space exposure may be more pronounced in such circumstances [75,76]. Conversely, more studies have reported different results. One study suggests that economically well-off individuals generally have higher survival rates and better health outcomes compared to less affluent populations [28]. Among the patients with COPD, those with higher incomes are less likely to experience exacerbations of COPD compared to lower-income patients (OR 0.601; 95% CI 0.385 to 0.939) [45]. The variability can be explained by a variety of mechanisms. For example, lower socioeconomic populations often exhibit poorer health-related behaviors, such as unhealthy dietary habits, excessive alcohol and tobacco consumption, and low levels of physical activity, or a lack of social resources, including housing conditions, work environments, healthcare access, and educational opportunities [28,77]. Xiao et al. [43] suggest that groups with higher levels of education or economic status may have stronger subjective awareness of and conditions for accessing greenspaces for better health benefits. Interactions between socioeconomic status, and other demographic characteristics may contribute to inconsistencies in health outcomes through multiple pathways. Therefore, the complex interplay of these potential pathways in specific regional settings should be further elucidated in the future, and more research is needed to explore potential correlates that may modify the relationship between greenspace and COPD outcomes.
4.3. Impact Pathways
The mechanisms by which greenspace affects COPD outcomes have not been clearly demonstrated; however, we have summarized several hypotheses from our research to explain the pathways by which greenspace exposure affects respiratory health (Figure 2). First, some studies have reported a protective effect of greenspace exposure on COPD, suggesting that green spaces can absorb or deposit air pollutants (including atmospheric particulate matter and ozone) in urban environments [78,79], thereby providing ventilation corridors and reducing exposure to air pollution [5]. This can lead to a lower incidence of respiratory diseases. Second, the incidence of COPD may be related to systemic inflammation, particularly in the lungs. Exposure to green spaces can effectively reduce the level of oxidative stress in the human body [80], regulate the immune system, and reduce the risk of systemic inflammation, thereby reducing the incidence of COPD [81]. Furthermore, greenspaces (e.g., lawns and parks) can provide more opportunities for increased physical activity, improving lung function, and boosting the immune system [24,82,83]. Finally, greening may increase microbial diversity and exposure to beneficial environmental microbes. According to the biodiversity hypothesis, living in a biodiverse environment can improve the immune system by modulating species composition in the human microbiome, boosting the body’s resistance to pathogens, and reducing the incidence and prevalence of respiratory diseases [84,85]. Conversely, there is evidence for a positive correlation between greenspace exposure and COPD outcomes. Firstly, previous research has shown that plants continuously release a wide range of volatile organic compounds (VOCs) that impact the human body [86]. These compounds can easily be converted into gases to participate in metabolic processes. Vegetation types and the plant composition of green spaces vary across the globe, resulting in different types and amounts of VOCs. Some plant VOCs decrease lung function and increase the risk of COPD [87,88]. Second, higher greenspace exposure increased the pollen concentration. Although COPD is considered a non-allergic respiratory disease, excessive exposure to pollen can damage the respiratory system and increase its incidence [89] and mortality rates [90].
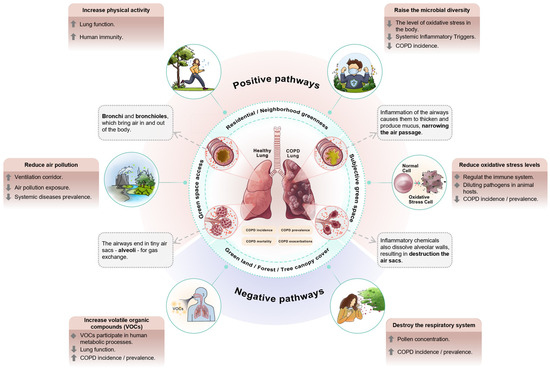
Figure 2.
Impact pathways of greenspace exposure and COPD.
4.4. Strengths and Limitations
We systematically reviewed comprehensive and up-to-date evidence on the association between greenfield exposure and COPD outcomes. An important strength of this review is that we statistically and categorically categorized the various metrics assessed in greenspaces to explore their relationships with COPD outcomes. In addition, this review covers a wide range of study types, examining not only observational studies but also existing experimental studies related to green exposure. This study may provide additional ideas and avenues for establishing future interventions that use greenspaces to improve COPD outcomes. However, this study has some limitations. The included studies used different methods to assess, measure, and define greenspace exposure and had different pathways for determining COPD outcomes; therefore, we could not quantitatively combine the estimates through meta-analysis. Instead, we have provided detailed information on each study, providing valuable knowledge on the effect of greenfield exposure on COPD, which will contribute to the discussion on the risk of bias in future studies. Secondly, the quality criteria used to assess each study, although adapted based on existing/published tools, were innovated in the greenfield exposure metrics section, the criteria of which have not yet been validated. However, it also provides a method to systematically assess the methodological strengths of the study design, samples, measurements, and statistical analyses.
4.5. Recommendations for Future Research
Considering that the exact mechanisms linking greenspace exposure to COPD outcomes are unclear and that previous studies have taken multiple biopsychosocial perspectives to explore the potential pathways through which exposure to greenspace can affect COPD, future high-quality studies should further adopt analytical models such as mediation or moderation, build on existing studies to screen for possible multidimensional mediators or modifiers, and further analyze the specific mechanisms of action. Second, we found only two experimental studies that met the inclusion criteria using fewer measures and a valid number of articles, which can lead to limitations in the derived causal pathways. Therefore, further experimental studies are required. Additionally, we found that most studies were conducted in Asia, Europe, and North America, with very limited evidence from other regions, especially Africa and South America. This may lead to a lack of in-depth understanding of issues and challenges related to developing countries and hinder the development and improvement of these countries in the face of adversity. Future research should focus on a broader scope and scale of investigation. Finally, future research could attempt to use internationally harmonized standards for measuring COPD and defining outcomes, making the evidence more comparable.
5. Conclusions
We summarized the research on greenspace exposure and its potential pathways affecting COPD outcomes. The review included 16 identified studies that varied in greenspace exposure indicators, COPD outcomes, and research methods. Overall, our review indicates that greenery may positively impact COPD-related health outcomes, although some studies have yielded different results. The potential pathways discussed are consistent but not conclusive. Potential protective mechanisms may be associated with the ability of greenspaces to reduce air pollution, increase physical activity, reduce oxidative stress, and improve immune functions. Potentially hazardous mechanisms may be linked to excessive exposure to allergens (such as pollen) and the detrimental effects of volatile organic compounds emitted by plants on human health. The heterogeneity of research findings emphasizes the potential importance of measuring greenspace exposure indicators and considering other environmental factors. Future studies should consider multiple relevant factors and pathways to better understand the characteristics, mechanisms, and potential mediators associated with the impact of greenspace exposure on COPD outcomes.
Supplementary Materials
The following supporting information can be downloaded at: https://www.mdpi.com/article/10.3390/f15040634/s1, Table S1: Search strategies for electronic databases; Table S2: Quality criteria; Table S3: Quality assessment results; Table S4: Additional characteristics of the studies included in the systematic review.
Author Contributions
Y.G.: conceptualization, methodology, data curation, software, visualization, writing—original draft, and writing—review and editing. K.P.: data curation, visualization, writing—review and editing. H.L.: methodology, writing—review and editing. B.Z.: conceptualization, project administration, resources, supervision, and validation. All authors have read and agreed to the published version of the manuscript.
Funding
This work was supported by the Priority Academic Program Development of Jiangsu Higher Educations Institutions (No. 164120230).
Data Availability Statement
The data used in this study are included in the Supplementary Material, and any additional inquiries can be directed to the corresponding authors.
Acknowledgments
We are very grateful for the contributions of Gascon, Lachowycz and de Keijzer to the article quality assessment framework.
Conflicts of Interest
The authors declare no conflicts of interest.
References
- WHO. Global Health Estimates: Life Expectancy and Leading Causes of Death and Disability; World Health Organization: Geneva, Switzerland, 2019; Available online: https://www.who.int/data/gho/data/themes/mortality-and-global-health-estimates (accessed on 23 November 2023).
- Vogelmeier, C.F.; Criner, G.J.; Martinez, F.J.; Anzueto, A.; Barnes, P.J.; Bourbeau, J.; Celli, B.R.; Chen, R.; Decramer, M.; Fabbri, L.M. Global strategy for the diagnosis, management, and prevention of chronic obstructive lung disease 2017 report. GOLD executive summary. Am. J. Respir. Crit. Care Med. 2017, 195, 557–582. [Google Scholar] [CrossRef]
- Wang, X.; Meng, X.; Yu, Z.; Zhang, Y.; Li, Y.; Yu, X.; He, J.; Zhang, J.; Wang, L. Pulmonary rehabilitation assessment in COPD based on the ICF brief core set: A latent profile analysis. Ann. Med. 2023, 55, 2231843. [Google Scholar] [CrossRef]
- GOLD. Global Strategy for Prevention, Diagnosis and Management of COPD: 2024 Report. 2024. Available online: https://goldcopd.org/2024-gold-report/ (accessed on 25 December 2023).
- Lin, H.; Qian, Z.M.; Guo, Y.; Zheng, Y.; Ai, S.; Hang, J.; Wang, X.; Zhang, L.; Liu, T.; Guan, W. The attributable risk of chronic obstructive pulmonary disease due to ambient fine particulate pollution among older adults. Environ. Int. 2018, 113, 143–148. [Google Scholar] [CrossRef]
- Salvi, S. Tobacco smoking and environmental risk factors for chronic obstructive pulmonary disease. Clin. Chest Med. 2014, 35, 17–27. [Google Scholar] [CrossRef]
- Soriano, J.B.; Abajobir, A.A.; Abate, K.H.; Abera, S.F.; Agrawal, A.; Ahmed, M.B.; Aichour, A.N.; Aichour, I.; Aichour, M.T.E.; Alam, K.J.T.L.R.M. Global, regional, and national deaths, prevalence, disability-adjusted life years, and years lived with disability for chronic obstructive pulmonary disease and asthma, 1990–2015: A systematic analysis for the Global Burden of Disease Study 2015. Lancet Respir. Med. 2017, 5, 691–706. [Google Scholar] [CrossRef]
- Lee, H.W.; Park, J.; Jo, J.; Jang, E.J.; Lee, C.-H. Comparisons of exacerbations and mortality among regular inhaled therapies for patients with stable chronic obstructive pulmonary disease: Systematic review and Bayesian network meta-analysis. PLoS Med. 2019, 16, e1002958. [Google Scholar] [CrossRef]
- Hwang, B.-F.; Chen, Y.-H.; Lin, Y.-T.; Wu, X.-T.; Lee, Y.L. Relationship between exposure to fine particulates and ozone and reduced lung function in children. Environ. Res. 2015, 137, 382–390. [Google Scholar] [CrossRef]
- Thacher, J.D.; Schultz, E.S.; Hallberg, J.; Hellberg, U.; Kull, I.; Thunqvist, P.; Pershagen, G.; Gustafsson, P.M.; Melén, E.; Bergström, A. Tobacco smoke exposure in early life and adolescence in relation to lung function. Eur. Respir. J. 2018, 51, 1702111. [Google Scholar] [CrossRef]
- Depledge, M.H.; Stone, R.J.; Bird, W. Can natural and virtual environments be used to promote improved human health and wellbeing? Environ. Sci. Technol. 2011, 45, 4660–4665. [Google Scholar] [CrossRef]
- Gascon, M.; Triguero-Mas, M.; Martínez, D.; Dadvand, P.; Rojas-Rueda, D.; Plasència, A.; Nieuwenhuijsen, M.J. Residential green spaces and mortality: A systematic review. Environ. Int. 2016, 86, 60–67. [Google Scholar] [CrossRef] [PubMed]
- van Dorn, A. Urban planning and respiratory health. Lancet Respir. Med. 2017, 5, 781–782. [Google Scholar] [CrossRef] [PubMed]
- Astell-Burt, T.; Mitchell, R.; Hartig, T. The association between green space and mental health varies across the lifecourse. A longitudinal study. J. Epidemiol. Community Health 2014, 68, 578–583. [Google Scholar] [CrossRef] [PubMed]
- Grigsby-Toussaint, D.S.; Chi, S.-H.; Fiese, B.H. Where they live, how they play: Neighborhood greenness and outdoor physical activity among preschoolers. Int. J. Health Geogr. 2011, 10, 66. [Google Scholar] [CrossRef] [PubMed]
- Maas, J.; Verheij, R.A.; Groenewegen, P.P.; De Vries, S.; Spreeuwenberg, P. Green space, urbanity, and health: How strong is the relation? J. Epidemiol. Community Health 2006, 60, 587. [Google Scholar] [CrossRef] [PubMed]
- Jakubowski, B.; Frumkin, H. Peer reviewed: Environmental metrics for community health improvement. Prev. Chronic Dis. 2010, 7, A76. [Google Scholar] [PubMed]
- James, P.; Banay, R.F.; Hart, J.E.; Laden, F. A review of the health benefits of greenness. Curr. Epidemiol. Rep. 2015, 2, 131–142. [Google Scholar] [CrossRef]
- Markevych, I.; Schoierer, J.; Hartig, T.; Chudnovsky, A.; Hystad, P.; Dzhambov, A.M.; De Vries, S.; Triguero-Mas, M.; Brauer, M.; Nieuwenhuijsen, M.J. Exploring pathways linking greenspace to health: Theoretical and methodological guidance. Environ. Res. 2017, 158, 301–317. [Google Scholar] [CrossRef]
- Zhang, J.; Zhou, S.; Xia, T.; Yin, Y.; Wang, X.; Cheng, Y.; Mao, Y.; Zhao, B. Residential greenspace exposure, particularly green window-views, is associated with improved sleep quality among older adults: Evidence from a high-density city. Build. Environ. 2024, 253, 111315. [Google Scholar] [CrossRef]
- Nowak, D.J.; Hirabayashi, S.; Bodine, A.; Greenfield, E. Tree and forest effects on air quality and human health in the United States. Environ. Pollut. 2014, 193, 119–129. [Google Scholar] [CrossRef]
- Van Renterghem, T.; Forssén, J.; Attenborough, K.; Jean, P.; Defrance, J.; Hornikx, M.; Kang, J. Using natural means to reduce surface transport noise during propagation outdoors. Appl. Acoust. 2015, 92, 86–101. [Google Scholar] [CrossRef]
- Venter, Z.S.; Krog, N.H.; Barton, D.N. Linking green infrastructure to urban heat and human health risk mitigation in Oslo, Norway. Sci. Total Environ. 2020, 709, 136193. [Google Scholar] [CrossRef] [PubMed]
- McMorris, O.; Villeneuve, P.J.; Su, J.; Jerrett, M. Urban greenness and physical activity in a national survey of Canadians. Environ. Res. 2015, 137, 94–100. [Google Scholar] [CrossRef]
- Weeland, J.; Laceulle, O.M.; Nederhof, E.; Overbeek, G.; Reijneveld, S.A. The greener the better? Does neighborhood greenness buffer the effects of stressful life events on externalizing behavior in late adolescence? Health Place 2019, 58, 102163. [Google Scholar] [CrossRef]
- Van den Berg, A.E.; Hartig, T.; Staats, H. Preference for nature in urbanized societies: Stress, restoration, and the pursuit of sustainability. J. Soc. Issues 2007, 63, 79–96. [Google Scholar] [CrossRef]
- Roscoe, C.; Mackay, C.; Gulliver, J.; Hodgson, S.; Cai, Y.; Vineis, P.; Fecht, D. Associations of private residential gardens versus other greenspace types with cardiovascular and respiratory disease mortality: Observational evidence from UK Biobank. Environ. Int. 2022, 167, 107427. [Google Scholar] [CrossRef] [PubMed]
- Bauwelinck, M.; Casas, L.; Nawrot, T.S.; Nemery, B.; Trabelsi, S.; Thomas, I.; Aerts, R.; Lefebvre, W.; Vanpoucke, C.; Van Nieuwenhuyse, A.; et al. Residing in urban areas with higher green space is associated with lower mortality risk: A census-based cohort study with ten years of follow-up. Environ. Int. 2021, 148, 106365. [Google Scholar] [CrossRef] [PubMed]
- Maas, J.; Verheij, R.A.; de Vries, S.; Spreeuwenberg, P.; Schellevis, F.G.; Groenewegen, P.P. Morbidity is related to a green living environment. J. Epidemiol. Community Health 2009, 63, 967–973. [Google Scholar] [CrossRef] [PubMed]
- Sarkar, C.; Zhang, B.; Ni, M.; Kumari, S.; Bauermeister, S.; Gallacher, J.; Webster, C. Environmental correlates of chronic obstructive pulmonary disease in 96 779 participants from the UK Biobank: A cross-sectional, observational study. Lancet Planet. Health 2019, 3, e478–e490. [Google Scholar] [CrossRef] [PubMed]
- Sun, S.; Sarkar, C.; Kumari, S.; James, P.; Cao, W.; Lee, R.S.-y.; Tian, L.; Webster, C. Air pollution associated respiratory mortality risk alleviated by residential greenness in the Chinese Elderly Health Service Cohort. Environ. Res. 2020, 183, 109139. [Google Scholar] [CrossRef] [PubMed]
- Fan, J.; Guo, Y.; Cao, Z.; Cong, S.; Wang, N.; Lin, H.; Wang, C.; Bao, H.; Lv, X.; Wang, B.; et al. Neighborhood greenness associated with chronic obstructive pulmonary disease: A nationwide cross-sectional study in China. Environ. Int. 2020, 144, 106042. [Google Scholar] [CrossRef]
- Servadio, J.L.; Lawal, A.S.; Davis, T.; Bates, J.; Russell, A.G.; Ramaswami, A.; Convertino, M.; Botchwey, N. Demographic Inequities in Health Outcomes and Air Pollution Exposure in the Atlanta Area and its Relationship to Urban Infrastructure. J. Urban Health 2018, 96, 219–234. [Google Scholar] [CrossRef]
- Lambert, K.A.; Bowatte, G.; Tham, R.; Lodge, C.; Prendergast, L.; Heinrich, J.; Abramson, M.J.; Dharmage, S.C.; Erbas, B. Residential greenness and allergic respiratory diseases in children and adolescents—A systematic review and meta-analysis. Environ. Res. 2017, 159, 212–221. [Google Scholar] [CrossRef]
- Mueller, W.; Milner, J.; Loh, M.; Vardoulakis, S.; Wilkinson, P. Exposure to urban greenspace and pathways to respiratory health: An exploratory systematic review. Sci. Total Environ. 2022, 829, 154447. [Google Scholar] [CrossRef]
- Tang, M.; Liu, W.; Li, H.; Li, F. Greenness and chronic respiratory health issues: A systematic review and meta-analysis. Front. Public Health 2023, 11, 1279322. [Google Scholar] [CrossRef]
- Liu, X.-X.; Ma, X.-L.; Huang, W.-Z.; Luo, Y.-N.; He, C.-J.; Zhong, X.-M.; Dadvand, P.; Browning, M.H.; Li, L.; Zou, X.-G. Green space and cardiovascular disease: A systematic review with meta-analysis. Environ. Pollut. 2022, 301, 118990. [Google Scholar] [CrossRef]
- Lachowycz, K.; Jones, A.P. Greenspace and obesity: A systematic review of the evidence. Obes. Rev. 2011, 12, e183–e189. [Google Scholar] [CrossRef]
- Yang, Y.; Jiang, B. Green spaces in highly urbanized tracts tied to lower prevalence of chronic respiratory diseases: A nationwide study across levels of urbanicity. Urban For. Urban Green. 2023, 90, 128149. [Google Scholar] [CrossRef]
- Moher, D.; Liberati, A.; Tetzlaff, J.; Altman, D.G.; PRISMA Group. Preferred reporting items for systematic reviews and meta-analyses: The PRISMA statement. Ann. Intern. Med. 2009, 151, 264–269. [Google Scholar] [CrossRef]
- Gascon, M.; Triguero-Mas, M.; Martínez, D.; Dadvand, P.; Forns, J.; Plasència, A.; Nieuwenhuijsen, M.J. Mental health benefits of long-term exposure to residential green and blue spaces: A systematic review. Int. J. Environ. Res. Public Health 2015, 12, 4354–4379. [Google Scholar] [CrossRef]
- de Keijzer, C.; Bauwelinck, M.; Dadvand, P. Long-term exposure to residential greenspace and healthy ageing: A systematic review. Curr. Environ. Health Rep. 2020, 7, 65–88. [Google Scholar] [CrossRef]
- Xiao, Y.; Gu, X.; Niu, H.; Meng, X.; Zhang, L.; Xu, J.; Yang, L.; Zhao, J.; Zhang, X.; Bai, C.; et al. Associations of residential greenness with lung function and chronic obstructive pulmonary disease in China. Environ. Res. 2022, 209, 112877. [Google Scholar] [CrossRef]
- Zhang, W.; Peng, W.; Cai, J.; Jiang, Y.; Zhou, C.; Zha, Z.; Mi, J. Residential surrounding greenness is associated with improved lung function in adults: A cross-sectional study in eastern China. BMC Public Health 2023, 23, 632. [Google Scholar] [CrossRef]
- Kowalczyk, A.; Kosiek, K.; Godycki-Cwirko, M.; Zakowska, I. Community determinants of COPD exacerbations in elderly patients in Lodz province, Poland: A retrospective observational Big Data cohort study. BMJ Open 2022, 12, e060247. [Google Scholar] [CrossRef]
- Zhao, C.; Wang, W.; Wen, H.; Huang, Z.; Wang, X.; Jiao, K.; Chen, Q.; Feng, H.; Wang, Y.; Liao, J.; et al. Effects of green spaces on alleviating mortality attributable to PM2.5 in China. Environ. Sci. Pollut. Res. 2022, 30, 14402–14412. [Google Scholar] [CrossRef]
- Yu, K.; Zhang, Q.; Meng, X.; Zhang, L.; Kan, H.; Chen, R. Association of residential greenness with incident chronic obstructive pulmonary disease: A prospective cohort study in the UK Biobank. Environ. Int. 2023, 171, 107654. [Google Scholar] [CrossRef]
- Gou, A.; Tan, G.; Ding, X.; Wang, J.; Jiao, Y.; Gou, C.; Tan, Q. Spatial association between green space and COPD mortality: A township-level ecological study in Chongqing, China. BMC Pulm. Med. 2023, 23, 89. [Google Scholar] [CrossRef]
- Kasdagli, M.-I.; Katsouyanni, K.; de Hoogh, K.; Lagiou, P.; Samoli, E. Investigating the association between long-term exposure to air pollution and greenness with mortality from neurological, cardio-metabolic and chronic obstructive pulmonary diseases in Greece. Environ. Pollut. 2022, 292, 118372. [Google Scholar] [CrossRef]
- Jia, B.B.; Yang, Z.X.; Mao, G.X.; Lyu, Y.D.; Wen, X.L.; Xu, W.H.; Lyu, X.L.; Cao, Y.B.; Wang, G.F. Health effect of forest bathing trip on elderly patients with chronic obstructive pulmonary disease. Biomed. Environ. Sci. 2016, 29, 212–218. [Google Scholar] [CrossRef]
- Janik, H.; Kraft, K.; Trabandt, A. Efficacy of healing forest therapy for patients with chronic obstructive pulmonary disease (COPD). Eur. J. Integr. Med. 2021, 48, 101944. [Google Scholar] [CrossRef]
- Rhew, I.C.; Vander Stoep, A.; Kearney, A.; Smith, N.L.; Dunbar, M.D. Validation of the normalized difference vegetation index as a measure of neighborhood greenness. Ann. Epidemiol. 2011, 21, 946–952. [Google Scholar] [CrossRef]
- Yuan, F.; Bauer, M.E. Comparison of impervious surface area and normalized difference vegetation index as indicators of surface urban heat island effects in Landsat imagery. Remote Sens. Environ. 2007, 106, 375–386. [Google Scholar] [CrossRef]
- Jennings, S.; Brown, N.; Sheil, D. Assessing forest canopies and understorey illumination: Canopy closure, canopy cover and other measures. Forestry 1999, 72, 59–74. [Google Scholar] [CrossRef]
- Hansen, J.E.; Porszasz, J.; Casaburi, R.; Stringer, W.W. Re-defining lower limit of normal for FEV1/FEV6, FEV1/FVC, FEV3/FEV6 and FEV3/FVC to improve detection of airway obstruction. Chronic Obstr. Pulm. Dis. 2015, 2, 94. [Google Scholar] [CrossRef][Green Version]
- Kuiper, I.N.; Svanes, C.; Markevych, I.; Accordini, S.; Bertelsen, R.J.; Bråbäck, L.; Christensen, J.H.; Forsberg, B.; Halvorsen, T.; Heinrich, J. Lifelong exposure to air pollution and greenness in relation to asthma, rhinitis and lung function in adulthood. Environ. Int. 2021, 146, 106219. [Google Scholar] [CrossRef]
- Lin, Z.; Gu, Y.; Liu, C.; Song, Y.; Bai, C.; Chen, R.; Chen, S.; Kan, H. Effects of ambient temperature on lung function in patients with chronic obstructive pulmonary disease: A time-series panel study. Sci. Total Environ. 2018, 619, 360–365. [Google Scholar] [CrossRef]
- Fuertes, E.; Markevych, I.; Thomas, R.; Boyd, A.; Granell, R.; Mahmoud, O.; Heinrich, J.; Garcia-Aymerich, J.; Roda, C.; Henderson, J. Residential greenspace and lung function up to 24 years of age: The ALSPAC birth cohort. Environ. Int. 2020, 140, 105749. [Google Scholar] [CrossRef]
- Dong, Y.; Liu, H.; Zheng, T. Association between green space structure and the prevalence of asthma: A case study of Toronto. Int. J. Environ. Res. Public Health 2021, 18, 5852. [Google Scholar] [CrossRef]
- Donovan, G.H.; Gatziolis, D.; Longley, I.; Douwes, J. Vegetation diversity protects against childhood asthma: Results from a large New Zealand birth cohort. Nat. Plants 2018, 4, 358–364. [Google Scholar] [CrossRef] [PubMed]
- Xia, T.; Zhao, B.; Yu, J.; Gao, Y.; Wang, X.; Mao, Y.; Zhang, J. Making residential green space exposure evaluation more accurate: A composite assessment framework that integrates objective and subjective indicators. Urban For. Urban Green. 2024, 95, 128290. [Google Scholar] [CrossRef]
- Coppel, G.; Wüstemann, H.J.L. The impact of urban green space on health in Berlin, Germany: Empirical findings and implications for urban planning. Landsc. Urban Plan. 2017, 167, 410–418. [Google Scholar] [CrossRef]
- De Vries, S.; Van Dillen, S.M.; Groenewegen, P.P.; Spreeuwenberg, P. Streetscape greenery and health: Stress, social cohesion and physical activity as mediators. Soc. Sci. Med. 2013, 94, 26–33. [Google Scholar] [CrossRef] [PubMed]
- Sugiyama, T.; Leslie, E.; Giles-Corti, B.; Owen, N. Associations of neighbourhood greenness with physical and mental health: Do walking, social coherence and local social interaction explain the relationships? J. Epidemiol. Community Health 2008, 62, e9. [Google Scholar] [CrossRef] [PubMed]
- Miller, M.R.; Hankinson, J.; Brusasco, V.; Burgos, F.; Casaburi, R.; Coates, A.; Crapo, R.; Enright, P.; Van Der Grinten, C.; Gustafsson, P. Standardisation of spirometry. Eur. Respir. J. 2005, 26, 319–338. [Google Scholar] [CrossRef] [PubMed]
- Albert, P.; Agusti, A.; Edwards, L.; Tal-Singer, R.; Yates, J.; Bakke, P.; Celli, B.R.; Coxson, H.O.; Crim, C.; Lomas, D.A. Bronchodilator responsiveness as a phenotypic characteristic of established chronic obstructive pulmonary disease. Thorax 2012, 67, 701–708. [Google Scholar] [CrossRef] [PubMed]
- Fong, K.C.; Hart, J.E.; James, P. A review of epidemiologic studies on greenness and health: Updated literature through 2017. Curr. Environ. Health Rep. 2018, 5, 77–87. [Google Scholar] [CrossRef] [PubMed]
- Dadvand, P.; de Nazelle, A.; Triguero-Mas, M.; Schembari, A.; Cirach, M.; Amoly, E.; Figueras, F.; Basagaña, X.; Ostro, B.; Nieuwenhuijsen, M. Surrounding greenness and exposure to air pollution during pregnancy: An analysis of personal monitoring data. Environ. Health Perspect. 2012, 120, 1286–1290. [Google Scholar] [CrossRef] [PubMed]
- Shen, Y.-S.; Lung, S.-C.C. Mediation pathways and effects of green structures on respiratory mortality via reducing air pollution. Sci. Rep. 2017, 7, 42854. [Google Scholar] [CrossRef] [PubMed]
- Yu, G.; Ke, X.; Xue, B.; Ni, J. The relationships between the surface arboreal pollen and the plants of the vegetation in China. Rev. Palaeobot. Palynol. 2004, 129, 187–198. [Google Scholar] [CrossRef]
- Lambert, A.K.; Katelaris, C.; Burton, P.; Cowie, C.; Lodge, C.; Garden, F.L.; Prendergast, A.L.; Toelle, B.G.; Erbas, B. Tree pollen exposure is associated with reduced lung function in children. Clin. Exp. Allergy 2020, 50, 1176–1183. [Google Scholar] [CrossRef]
- Bishan, C.; Bing, L.; Chixin, C.; Junxia, S.; Shulin, Z.; Cailang, L.; Siqiao, Y.; Chuanxiu, L. Relationship between airborne pollen assemblages and major meteorological parameters in Zhanjiang, South China. PLoS ONE 2020, 15, e0240160. [Google Scholar] [CrossRef]
- de Keijzer, C.; Agis, D.; Ambrós, A.; Arévalo, G.; Baldasano, J.M.; Bande, S.; Barrera-Gómez, J.; Benach, J.; Cirach, M.; Dadvand, P. The association of air pollution and greenness with mortality and life expectancy in Spain: A small-area study. Environ. Int. 2017, 99, 170–176. [Google Scholar] [CrossRef]
- Orioli, R.; Antonucci, C.; Scortichini, M.; Cerza, F.; Marando, F.; Ancona, C.; Manes, F.; Davoli, M.; Michelozzi, P.; Forastiere, F. Exposure to residential greenness as a predictor of cause-specific mortality and stroke incidence in the Rome longitudinal study. Environ. Health Perspect. 2019, 127, 027002. [Google Scholar] [CrossRef] [PubMed]
- Krekel, C.; Kolbe, J.; Wüstemann, H. The greener, the happier? The effect of urban land use on residential well-being. Ecol. Econ. 2016, 121, 117–127. [Google Scholar] [CrossRef]
- Mitchell, R.; Popham, F. Effect of exposure to natural environment on health inequalities: An observational population study. Lancet 2008, 372, 1655–1660. [Google Scholar] [CrossRef]
- Wilkinson, R.G.; Marmot, M. Social Determinants of Health: The Solid Facts; World Health Organization: Geneva, Switzerland, 2003. [Google Scholar]
- Crouse, D.L.; Pinault, L.; Balram, A.; Brauer, M.; Burnett, R.T.; Martin, R.V.; Van Donkelaar, A.; Villeneuve, P.J.; Weichenthal, S. Complex relationships between greenness, air pollution, and mortality in a population-based Canadian cohort. Environ. Int. 2019, 128, 292–300. [Google Scholar] [CrossRef]
- Nowak, D.J.; Crane, D.E.; Stevens, J.C. Air pollution removal by urban trees and shrubs in the United States. Urban For. Urban Green. 2006, 4, 115–123. [Google Scholar] [CrossRef]
- Yeager, R.; Riggs, D.W.; DeJarnett, N.; Tollerud, D.J.; Wilson, J.; Conklin, D.J.; O’Toole, T.E.; McCracken, J.; Lorkiewicz, P.; Xie, Z. Association between residential greenness and cardiovascular disease risk. J. Am. Heart Assoc. 2018, 7, e009117. [Google Scholar] [CrossRef] [PubMed]
- Kirkham, P.A.; Barnes, P.J. Oxidative stress in COPD. Chest 2013, 144, 266–273. [Google Scholar] [CrossRef]
- Roda, C.; Mahmoud, O.; Peralta, G.P.; Fuertes, E.; Granell, R.; Serra, I.; Henderson, J.; Jarvis, D.; Garcia-Aymerich, J. Physical-activity trajectories during childhood and lung function at 15 years: Findings from the ALSPAC cohort. Int. J. Epidemiol. 2020, 49, 131–141. [Google Scholar] [CrossRef]
- Mao, Y.; Xia, T.; Hu, F.; Chen, D.; He, Y.; Bi, X.; Zhang, Y.; Cao, L.; Yan, J.; Hu, J.; et al. The greener the living environment, the better the health? Examining the effects of multiple green exposure metrics on physical activity and health among young students. Environ. Res. 2024, 250, 118520. [Google Scholar] [CrossRef]
- Aerts, R.; Honnay, O.; Van Nieuwenhuyse, A. Biodiversity and human health: Mechanisms and evidence of the positive health effects of diversity in nature and green spaces. Br. Med. Bull. 2018, 127, 5–22. [Google Scholar] [CrossRef]
- Rook, G.A. Regulation of the immune system by biodiversity from the natural environment: An ecosystem service essential to health. Proc. Natl. Acad. Sci. USA 2013, 110, 18360–18367. [Google Scholar] [CrossRef]
- Vivaldo, G.; Masi, E.; Taiti, C.; Caldarelli, G.; Mancuso, S. The network of plants volatile organic compounds. Sci. Rep. 2017, 7, 11050. [Google Scholar] [CrossRef]
- Maesano, C.N.; Caillaud, D.; Youssouf, H.; Banerjee, S.; Prud’Homme, J.; Audi, C.; Horo, K.; Toloba, Y.; Ramousse, O.; Annesi-Maesano, I. Indoor exposure to particulate matter and volatile organic compounds in dwellings and workplaces and respiratory health in French farmers. Multidiscip. Respir. Med. 2019, 14, 33. [Google Scholar] [CrossRef]
- Yoon, H.-I.; Hong, Y.-C.; Cho, S.-H.; Kim, H.; Kim, Y.H.; Sohn, J.R.; Kwon, M.; Park, S.-H.; Cho, M.-H.; Cheong, H.-K. Exposure to volatile organic compounds and loss of pulmonary function in the elderly. Eur. Respir. J. 2010, 36, 1270–1276. [Google Scholar] [CrossRef]
- Hanigan, I.; Johnston, F.H. Respiratory hospital admissions were associated with ambient airborne pollen in Darwin, Australia, 2004–2005. Clin. Exp. Allergy 2007, 37, 1556–1565. [Google Scholar] [CrossRef]
- Brunekreef, B.; Hoek, G.; Fischer, P.; Spieksma, F.T.M. Relation between airborne pollen concentrations and daily cardiovascular and respiratory-disease mortality. Lancet 2000, 355, 1517–1518. [Google Scholar] [CrossRef] [PubMed]


Disclaimer/Publisher’s Note: The statements, opinions and data contained in all publications are solely those of the individual author(s) and contributor(s) and not of MDPI and/or the editor(s). MDPI and/or the editor(s) disclaim responsibility for any injury to people or property resulting from any ideas, methods, instructions or products referred to in the content. |
© 2024 by the authors. Licensee MDPI, Basel, Switzerland. This article is an open access article distributed under the terms and conditions of the Creative Commons Attribution (CC BY) license (https://creativecommons.org/licenses/by/4.0/).