Article

Development of Novel Genomewide Simple Sequence Repeat Markers for Acer truncatum Bunge and Assessment of Their Transferability to Other Closely Related Species

1
State Key Laboratory of Tree Genetics and Breeding, College of Biological Sciences and Technology, Beijing Forestry University, Beijing 100083, China
2
National Engineering Research Center of Tree Genetics and Ecological Restoration, Beijing Forestry University, Beijing 100083, China
3
Tongliao Forestry and Grassland Research Institute, Tongliao 028000, China
*
Author to whom correspondence should be addressed.
These authors equally contributed to this work.
Forests 2024, 15(4), 635; https://doi.org/10.3390/f15040635
Submission received: 23 February 2024 / Revised: 25 March 2024 / Accepted: 28 March 2024 / Published: 30 March 2024
(This article belongs to the Section Genetics and Molecular Biology)

Abstract

:
Acer truncatum Bunge is a versatile woody tree species with high economic and medicinal value in the production of bioactive substances and unsaturated fatty acids (especially nervonic acid). However, the exploitation and evaluation of A. truncatum germplasm resources are limited owing to a lack of sound molecular marker systems. In this study, a large set of genomewide simple sequence repeat (SSR) markers of A. truncatum was developed based on its whole-genome sequences. A total of 462,331 SSR loci were identified in the genome sequences, 99.3% (459,193) of which were located on 13 chromosomes. The chromosome length was significantly positively correlated with the number of SSR loci on the chromosome (r = 0.977, p < 0.001). The (A/T)n, (AT/TA)n, and (AAT/ATT/TAA/TTA/TAT/ATA)n were the most frequent motifs for mono-, di-, and trinucleotide repeat motifs, respectively, showing A/T-base bias. After BLASTN and electronic polymerase chain reaction (PCR) analyses, 199,990 loci with specific physical positions were screened. Most of the SSR loci were located in the intergenic regions and fewest in the coding sequences (CDSs). The frequency of loci with tri- and hexanucleotide repeat motifs was the highest in the CDSs, potentially serving to maintain the stability of gene function and structure. In randomly selected 105 SSR markers, 82 (78.1%) showed allelic polymorphism, with polymorphism information content (PIC) values of 0.032–0.926 (0.481 on average). The SSRs in the noncoding regions exhibited significantly higher PIC values than those in the CDSs. The transferability of the 105 markers was 48.6%–59.0% to seven other Acer species. The large set of valid SSR markers provides a powerful tool for studies on population genetics, conservation genetics, linkage mapping, comparative genomics, and marker-assisted breeding of the genus Acer.

1. Introduction

Acer truncatum Bunge, a deciduous tree species belonging to the family Aceraceae, is widely distributed in Northern China. Traditionally, A. truncatum is generally used in ornamental landscapes because of its features of a large crown, beautiful shape, and colored leaves in autumn [1]. Recently, its high economic and medicinal value in the production of bioactive substances and seed oil has attracted more attention [2,3]. Pharmacological studies found that A. truncatum leaf extracts, with compounds of flavonoids, alkaloids, phytosterols, and phenolic acids, have good antitumor, antioxidant, antibacterial, and fatty acid synthase inhibitory activities [2,4]. The seed oil of A. truncatum is rich in unsaturated fatty acids (85%–93%), which contain 5%–6% nervonic acid, a crucial component for delay brain aging and prevent cardiovascular and cerebrovascular diseases [3,4,5,6]. Qiao et al. found that the nervonic acid content in seed oil significantly varied among accessions (3.90%–7.85%) and among provenances (4.91%–6.54%) in A. truncatum [7]. Therefore, it is necessary to promote the investigation of germplasm resources and population genetics of A. truncatum.
Molecular markers are important tools for the investigation of population genetics, phylogenetics, and assisted breeding in higher plants [8]. With the development of molecular biology and modern biotechnology, a series of molecular markers, such as random amplified polymorphic DNA (RAPD), amplified fragment length polymorphism (AFLP), simple sequence repeats (SSRs), intersimple sequence repeats (ISSRs), sequence charactered amplified region (SCAR), and single-nucleotide polymorphism (SNP), have been exploited [9]. Of these, the SSRs are preferred for providing more genetic information owing to their advantages of widespread genomic distribution, co-dominance, multiallelic, high polymorphism, good repeatability, and great reproducibility [10]. In Malus transitoria (Batalin), C. K. Schneider developed expressed sequence tag (EST)-SSRs and used them to reveal its population structure and genetic diversity in the Qinghai-Tibetan Plateau of China [11].
Recently, the utilization of SSR markers is attracting attention for the analysis of genetic diversity, taxonomy, and phylogenetics of A. truncatum. Yan et al. screened 14 polymorphism SSR primer pairs from 59 transferable A. griseum (Franch.) Pax SSR primer pairs [12]. SSR fingerprints of 47 accessions of A. truncatum and A. mono Maxim. were constructed using seven markers, proving the validity of SSR markers in the classification between these two species [13]. However, the number of validated SSR markers is limited. To enlarge the amount of SSR marker sets of A. truncatum, Wang et al. successively developed 5774 EST-SSRs from transcriptome sequences and 392,961 putative genomic SSR markers from 145,640 scaffolds in an assembled genome [14,15]. However, the validity of these SSR markers is not verified, and their positions on chromosomes are not clarified.
In 2020, Ma et al. published a chromosome-scale assembled genome of A. truncatum [16]. However, the distribution pattern of SSR molecular markers in the genome of A. truncatum is not yet clear, and whether the SSRs developed from A. truncatum can be applied to other Acer species is uncertain. In the present study, in order to provide more effective SSR markers for the genetic and breeding study of A. truncatum and clarify their characteristics in the genome, a novel set of genomewide SSR markers of A. truncatum was developed based on the chromosome-scale genome sequence, and SSRs with unique flanking sequences and with specific physical positions were screened using BLASTN and electronic polymerase chain reaction (e-PCR) analyses, respectively. Characteristics of these SSRs and their distribution in genomic regions were parsed. Furthermore, polymorphism of these SSR markers and their cross-species transferability were verified based on a sampling analysis. This set of SSR markers provides a powerful tool for studies on population genetics, conservation genetics, linkage mapping, quantitative trait locus (QTL) mapping, comparative genomics, and marker-assisted breeding of the genus Acer.

2. Materials and Methods

2.1. Plant Materials and DNA Extraction

Leaves from 30 plus trees of A. truncatum were collected from Udantara Natural Reserve, Tongliao City, Inner Mongolia Autonomous Region, China, and stored at −80 °C for SSR experimental analysis. To test cross-species transferability, leaves of A. henryi Pax, A. tataricum subsp. ginnala (Maximowicz) Wesma, A. negundo L., A. palmatum Thunb., A. grosseri Pax, A. platanoides L., and A. rubrum L. were collected from Beijing Forestry University. Five fresh leaves were collected from each tree in the reserve and dried with silica gel for DNA extraction. The latitude and longitude information of 30 A. truncatum plus trees in the Udantara Natural Reserve is listed in Table S1.
Genomic DNA samples were extracted from the leaf samples using a DNAsecure Plant Kit DP320 (TIANGEN, Biotech Co., Ltd., Beijing, China) following the manufacturer’s instructions. The quality and concentration of the DNA were detected with a NanoDrop 2000 (Thermo Fisher Scientific, Wilmington, DE, USA) spectrophotometer. For polymerase chain reaction (PCR) analysis, all DNA samples were diluted to 20 ng μL−1 and stored at −20 °C.

2.2. SSR Motif Identification

SSR motifs were identified based on the chromosome-scale genome sequence data of A. truncatum from the public NCBI database (https://www.ncbi.nlm.nih.gov/bioproject/?term=PRJNA557096, accessed on 15 August 2022) using the MIcroSAtellite identification tool on the server with default parameters, i.e., the motifs were one to six nucleotides in size, and the minimum number of repetitions was 10, 6, 5, 5, 5, and 5 for mononucleotide repeats (MNRs), dinucleotide repeats (DNRs), trinucleotide repeats (TNRs), tetra-nucleotide repeats (TTRs), pentanucleotide repeats (PNRs), and hexanucleotide repeats (HNRs), respectively, with an interruption of no more than 100 bp.
To identify the distribution of the SSR loci in genomic regions, the 5′- and 3′-untranslated regions (UTRs), coding sequences (CDSs), introns, and intergenic regions were determined based on the annotations of the A. truncatum genome. The promoters were detected as the genomic DNA sequences of 2000 bp upstream of the transcription initiation site. The number of SSR loci in the different genomic regions was recorded.

2.3. Unique SSR Screening and Primer Design

According to Xu et al. [17], the sequences including SSR loci and two 200 bp flanking sequences on each side of the repeat were extracted and used for a BLASTN search against the A. truncatum genome sequences with the parameter -e 1 × 10⁻¹⁰. The BLASTN results were filtered with parameters of identity > 90% and minimum alignment length > 85% of the flanking sequences [17]. Those sequences with a unique hit were identified as candidate SSR loci.
Subsequently, the primer pairs of the candidate SSR loci were designed based on the unique flanking sequences using Primer 3 v2.3.7. Input parameters for the primer design were as follows: 18, 27, and 20 nt for minimum, maximum, and optimal primer sizes, respectively; 57, 63, and 60 °C for minimum, maximum, and optimal Tm, respectively; and 40%, 60%, and 50% for minimum, maximum, and optimal GC contents, respectively. The expected PCR product size of each SSR primer pair ranged from 100 to 280 bp.
Furthermore, a local e-PCR program (v2.3.12) was used to check the uniqueness and specificity of designed primer pairs in the A. truncatum genome on the server. The parameters of the e-PCR program were set as follows: -w 9, -f 1, -m 100, -n 1, and -g 1, respectively. The distribution of SSR loci on the chromosomes of A. truncatum was plotted using the CMplot R package (version 4.5.1).

2.4. Assessment of SSR Polymorphism

To evaluate the polymorphism of the identified unique SSR markers, 105 loci (15 for each kind of SSR type) were randomly chosen for experimental detection in the 30 A. truncatum plus trees. Primer pairs were synthesized by RuiBiotech Inc. (Beijing, China). The forward primer of each pair was tagged with the universal M13 sequence (5′-TGTAAAACGACGGCCAGT-3′) during synthesis, following the fluorescence-labeled TP-M13-SSR PCR method [18]. Each PCR was performed in a 20 μL total volume, containing 10 μL 2 × TSINGKE® Master Mix (with Taq-polymerase, Tsingke, Beijing, China), 0.4 pmol forward primer, 1.6 pmol reverse primer, 1.6 pmol fluorescent (FAM, HEX, TAMRA, ROX)-dye labeled M13 primer, and 20 ng genomic DNA. The PCR amplifications were conducted in a SimpliAmpTM thermal cycler (Thermo Fisher Scientific, Singapore) using the following program: 1 cycle at 94 °C for 3 min; 30 cycles of 30 s at 94 °C, 30 s at 55 °C, and 1 min at 72 °C; 10 cycles of 30 s at 94 °C, 30 s at 53 °C, and 45 s at 72 °C; and a final extension at 72 °C for 10 min. Then capillary electrophoresis fluorescence-based SSR analyses were performed on an ABI 3730xl DNA Analyzer by RuiBiotech Inc. (Beijing, China), and the data were analyzed using GeneMarker software v2.2.0 (SoftGenetics LLC, State College, PA, USA) with the default settings. The observed number of alleles (Na) was recorded, and the polymorphism information content (PIC) and expected heterozygosity (He) was computed using PowerMarker v3.25 software [19]. Finally, the effective number of alleles (Ne), observed heterozygosity (Ho), and Shannon’s information index (I) were analyzed through GenAlEx v6.503 software [20].

2.5. Cross-Species Transferability

The cross-species transferability of the SSR markers was evaluated in seven closely related species of the genus Acer, namely, A. henryi, A. tataricum subsp. ginnala, A. negundo, A. palmatum, A. grosseri, A. platanoides, and A. rubrum. For each species, the percentage of transferability was calculated according to the proportion of the presence of target loci in the total analyzed loci.
Furthermore, a genetic dissimilarity matrix of the samples was calculated based on data of polymorphic markers using DARwin v6.0.021 software (cirad, Paris, France) with 1000 bootstraps [21]. The matrix was further used to produce a phylogenetic dendrogram using the iTOL tool [22] based on the unweighted neighbor-joining method to exhibit the relationship among the species.

3. Results

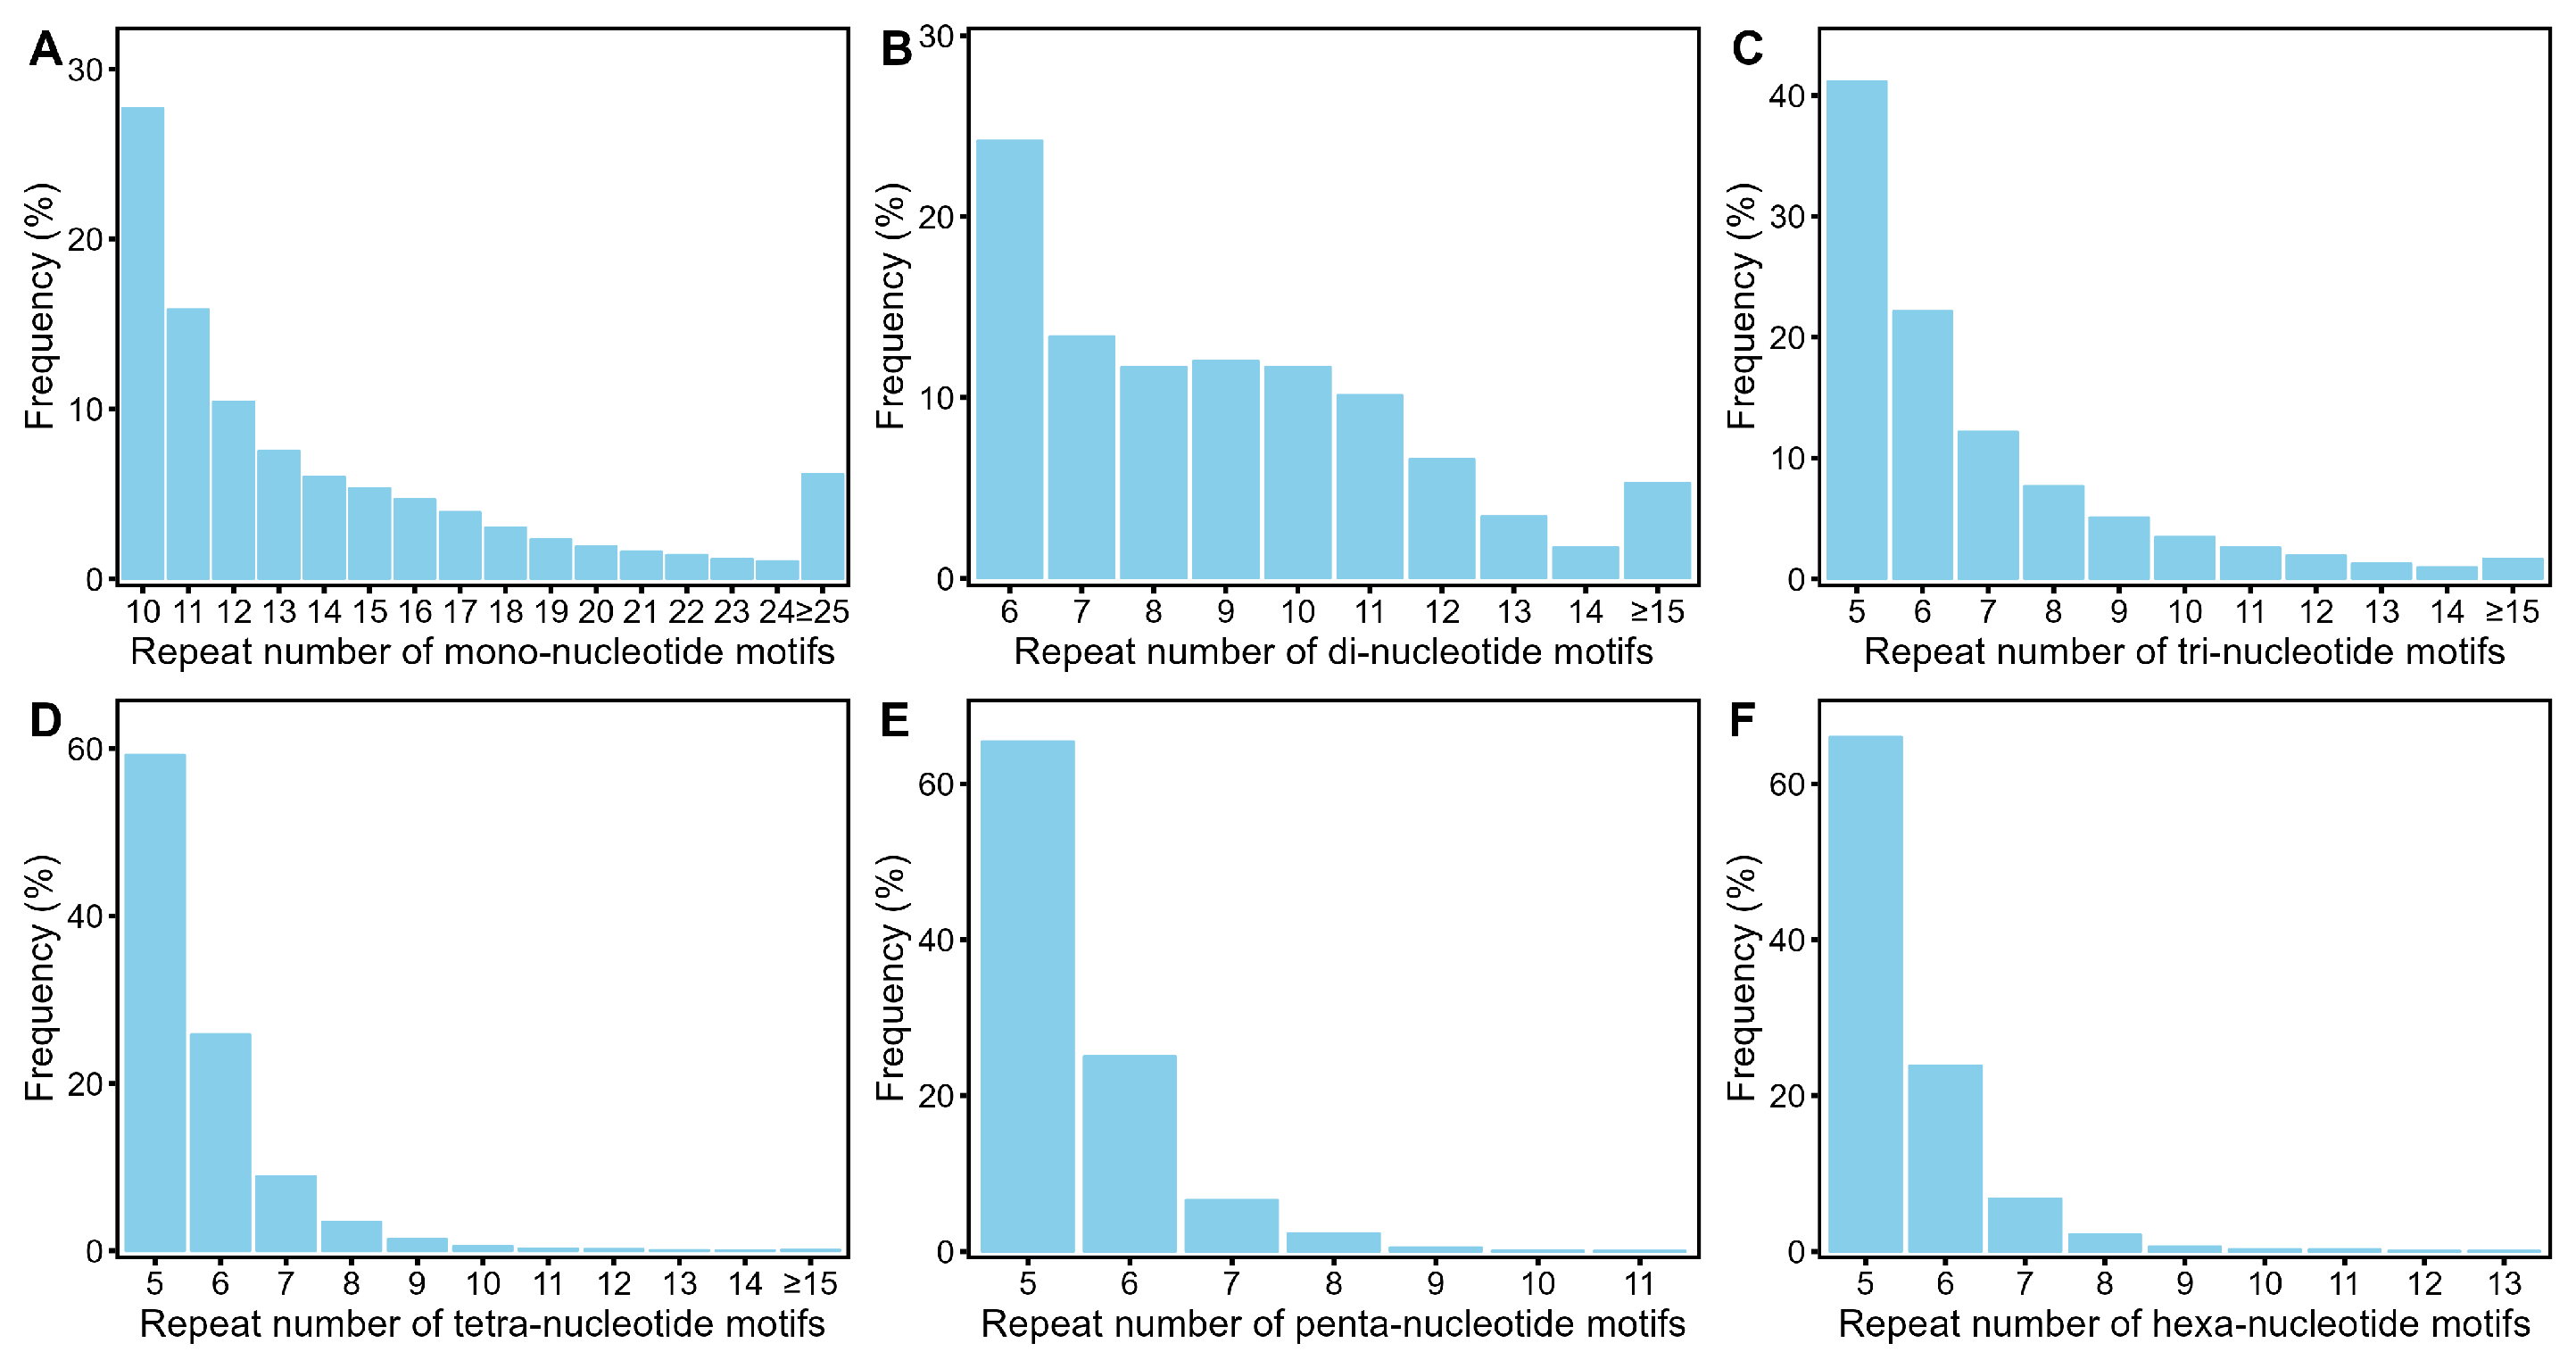
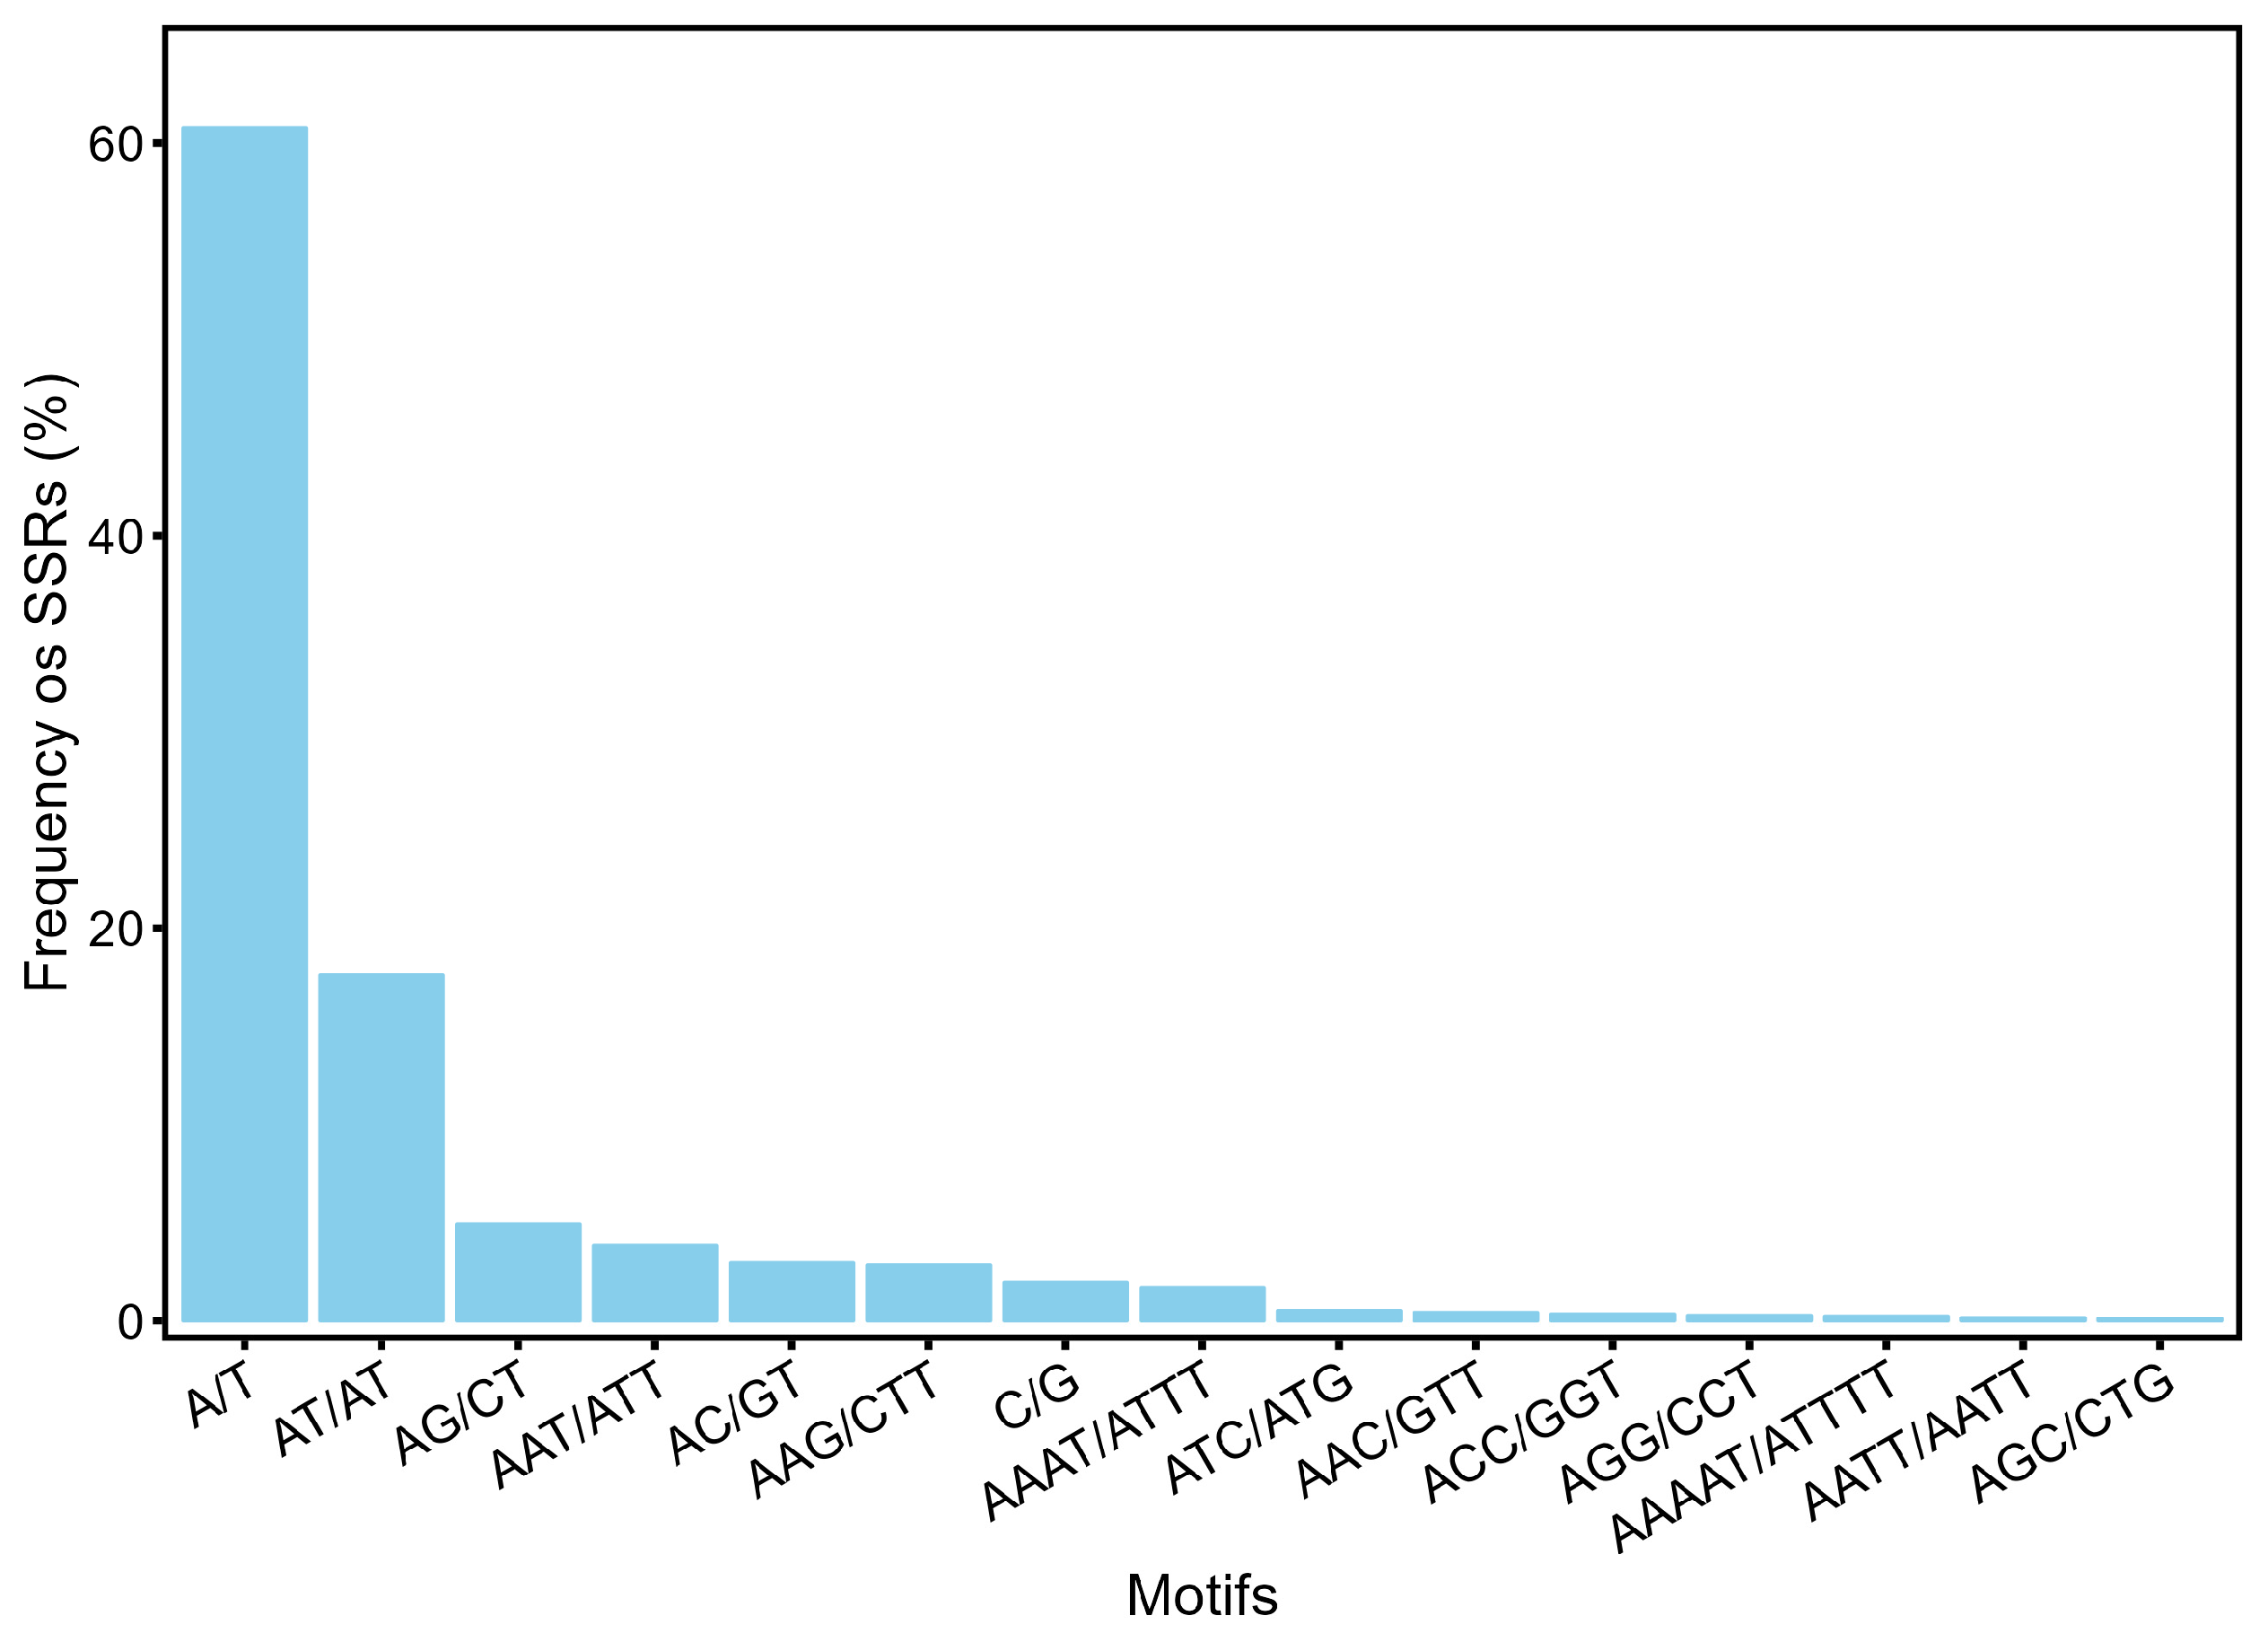
3.1. Identification of SSR Loci in Acer Truncatum Genome

In the A. truncatum genome sequences, a total of 462,331 SSR loci were determined by MISA, 99.3% (459,193) of which were located on 13 chromosomes. The average interval between two closed SSR loci was 1.27–1.54 Kbp, with an average of 1.37 Kbp (Table S1). Chromosome 1 had the largest number of SSR loci (55,213), while Chromosome 13 possessed the lowest number (26,125) (Figure 1). Pearson’s correlation analysis showed that the chromosome length was significantly positively correlated with the SSR number on the chromosome (r = 0.977, p < 0.001).
In the SSR motifs identified by MISA, the MNRs, DNRs, and TNRs accounted for 62.7%, 25.5%, and 8.4%, respectively, and the frequency of total TTRs, PNRs, and HNRs was only 3.4%. With the increase in repeat number, the abundance of SSR motifs decreased (Figure 2). According to La Rota et al. (2005), after the transformation of reverse complements and variant forms of the SSR motifs, the canonical motifs could be represented by 4 different duplets, 10 different triplets, 33 different quadruplets, and 102 different quintuplet motifs. The frequencies of the top 15 abundant SSR motifs in the A. truncatum genome are shown in Figure 3. In the MNRs, the (A/T)n motifs were dominant, with a frequency of 96.9%. The (AT/TA)n motifs accounted for 69.0% of the DNRs, followed by (AG/CT/TC/GA)n with 19.3% and (AC/GT/CA/TG)n with 11.6%. Only 36 (CG/GC)n motifs were identified. Of the TNRs, the most frequent motif was (AAT/ATT/TAA/TTA/TAT/ATA)n (45.4%), followed by (AAG/CTT/TTC/GAA/TCT/AGA)n with 33.4%. The numbers of other trinucleotide-type motifs ranged from 220 to 3100.
These SSR loci were grouped into two types depending on their complexity: one group was perfect-type SSR loci (continuous repetitions of motifs without any interruption by any base), with the number of 363,482 (78.6%), and the other was compound-type SSR loci (repeated sequences with interruptions by 0–100 bases), with the number of 98,849 (21.4%). The average lengths of the perfect and compound SSR loci were 16.3 bp and 93.7 bp, respectively. Among the perfect-type SSR loci, the MNRs (63.0%) were the most common type, followed by the DNRs (25.8%) and the TNRs (7.8%). The maximum length of the perfect SSRs was 106 bp for MNRs, 130 bp for DNRs, 96 bp for TNRs, 84 bp for TTRs, 55 bp for PNRs, and 72 bp for HNRs, respectively. The average lengths of the perfect MNRs, DNRs, TNRs, TTRs, PNRs, and HNRs were 14.5 bp, 18.4 bp, 19.7 bp, 22.6 bp, 27.4 bp, and 32.8 bp, respectively. The average length of the SSRs was positively correlated with the length of the motifs (r = 0.981, p < 0.001).

3.2. Development of SSR Markers with Specific Physical Positions

After BLASTN against the A. truncatum genome, 286,344 SSR loci with unique flanking sequences were screened, including 141,466 MNRs, 56,354 DNRs, 15,601 TNRs, 5250 TTRs, 1618 PNRs, 1088 HNRs, and 64,967 compound SSR loci (Table 1). Of these loci with unique flanking sequences, 285,732 were positioned on the 13 chromosomes, with 17,244 (Chromosome 13) to 33,595 (Chromosome 1) on each chromosome. The average interval between closed loci was 1.98 Kbp (Chromosome 5) to 2.41 Kbp (Chromosome 8) (Table S1).
Furthermore, primer pairs of 227,932 SSR loci with unique flanking sequences were designed by the Primer 3 program. Through conducting the e-PCR program in the A. truncatum genome, 199,990 loci (Table S2) had specific physical positions, including 103,001 MNRs, 42,226 DNRs, 12,230 TNRs, 3873 TTRs, 1147 PNRs, 696 HNRs, and 36,817 compounds (Table 1). Of these loci, 199,669 were located on the 13 chromosomes, with 12,018 (Chromosome 10) to 22,500 (Chromosome 1) on each chromosome (Table S1). These e-PCR-screened specific SSR loci were developed as genetic markers in this study. The distribution of all identified SSR loci, SSR loci with unique flanking sequences, and e-PCR-screened specific SSR loci on chromosomes is presented in Figure 4, showing an uneven distribution of these loci on chromosomes.

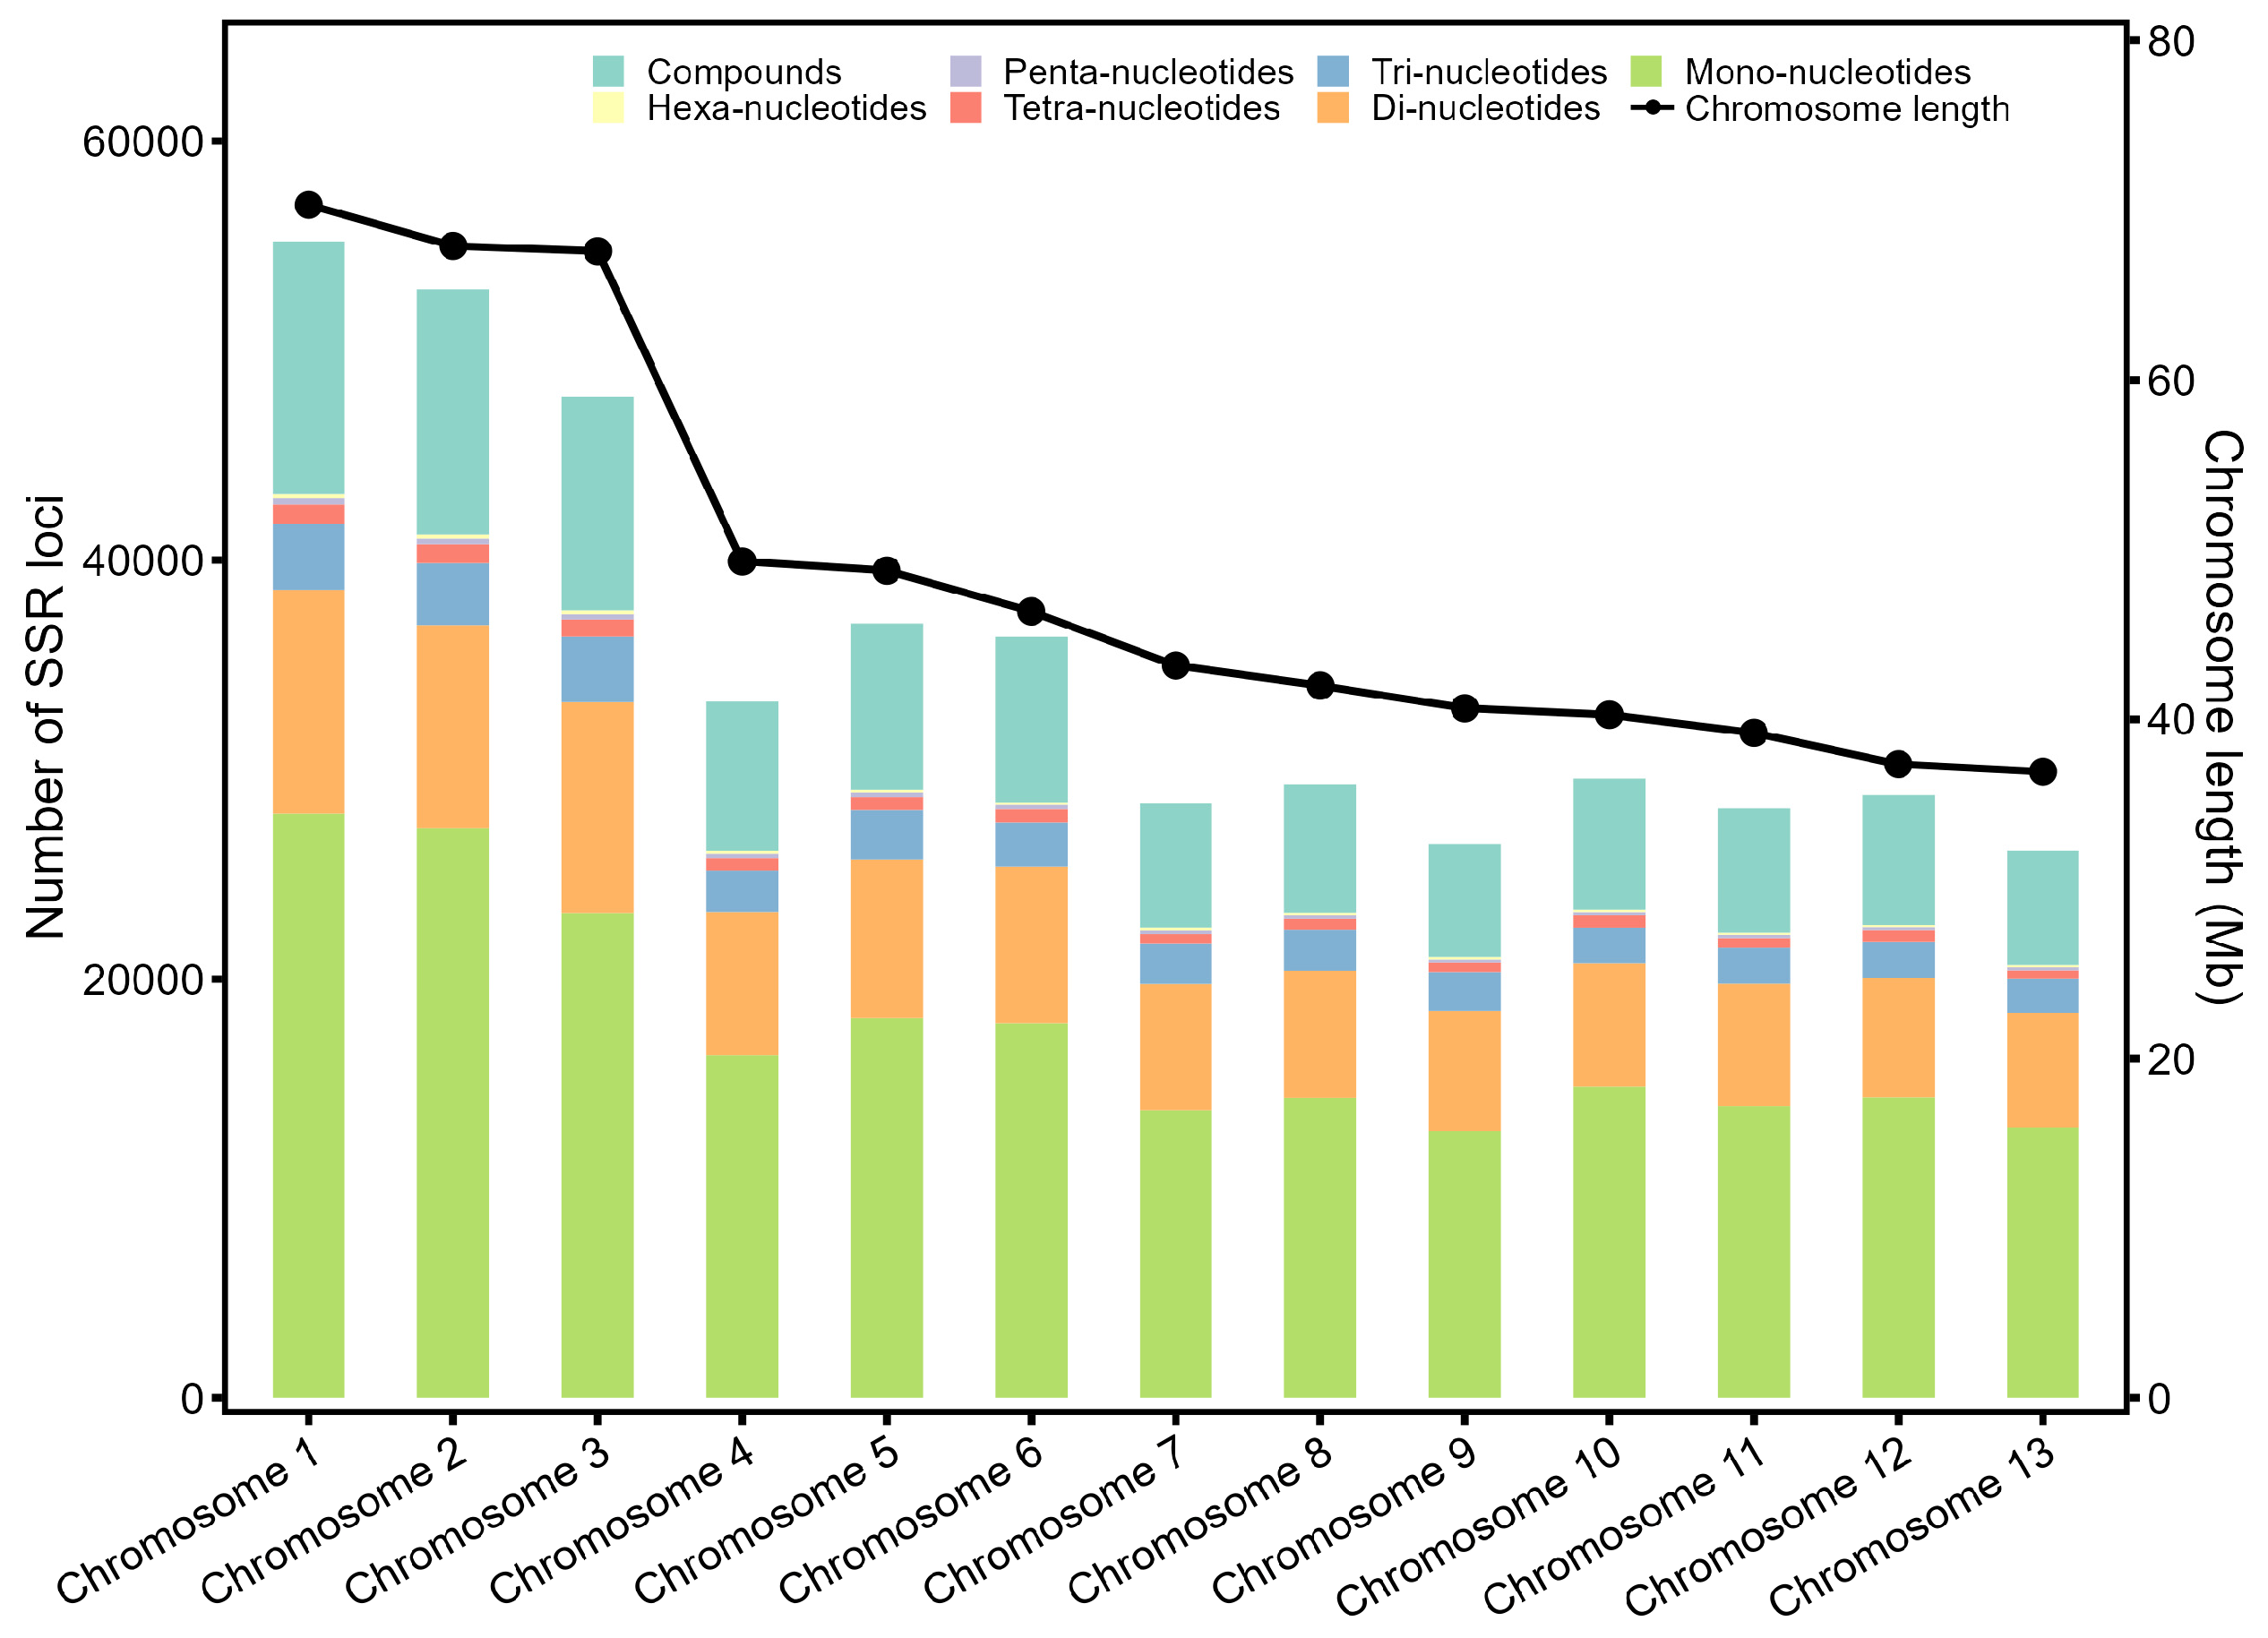
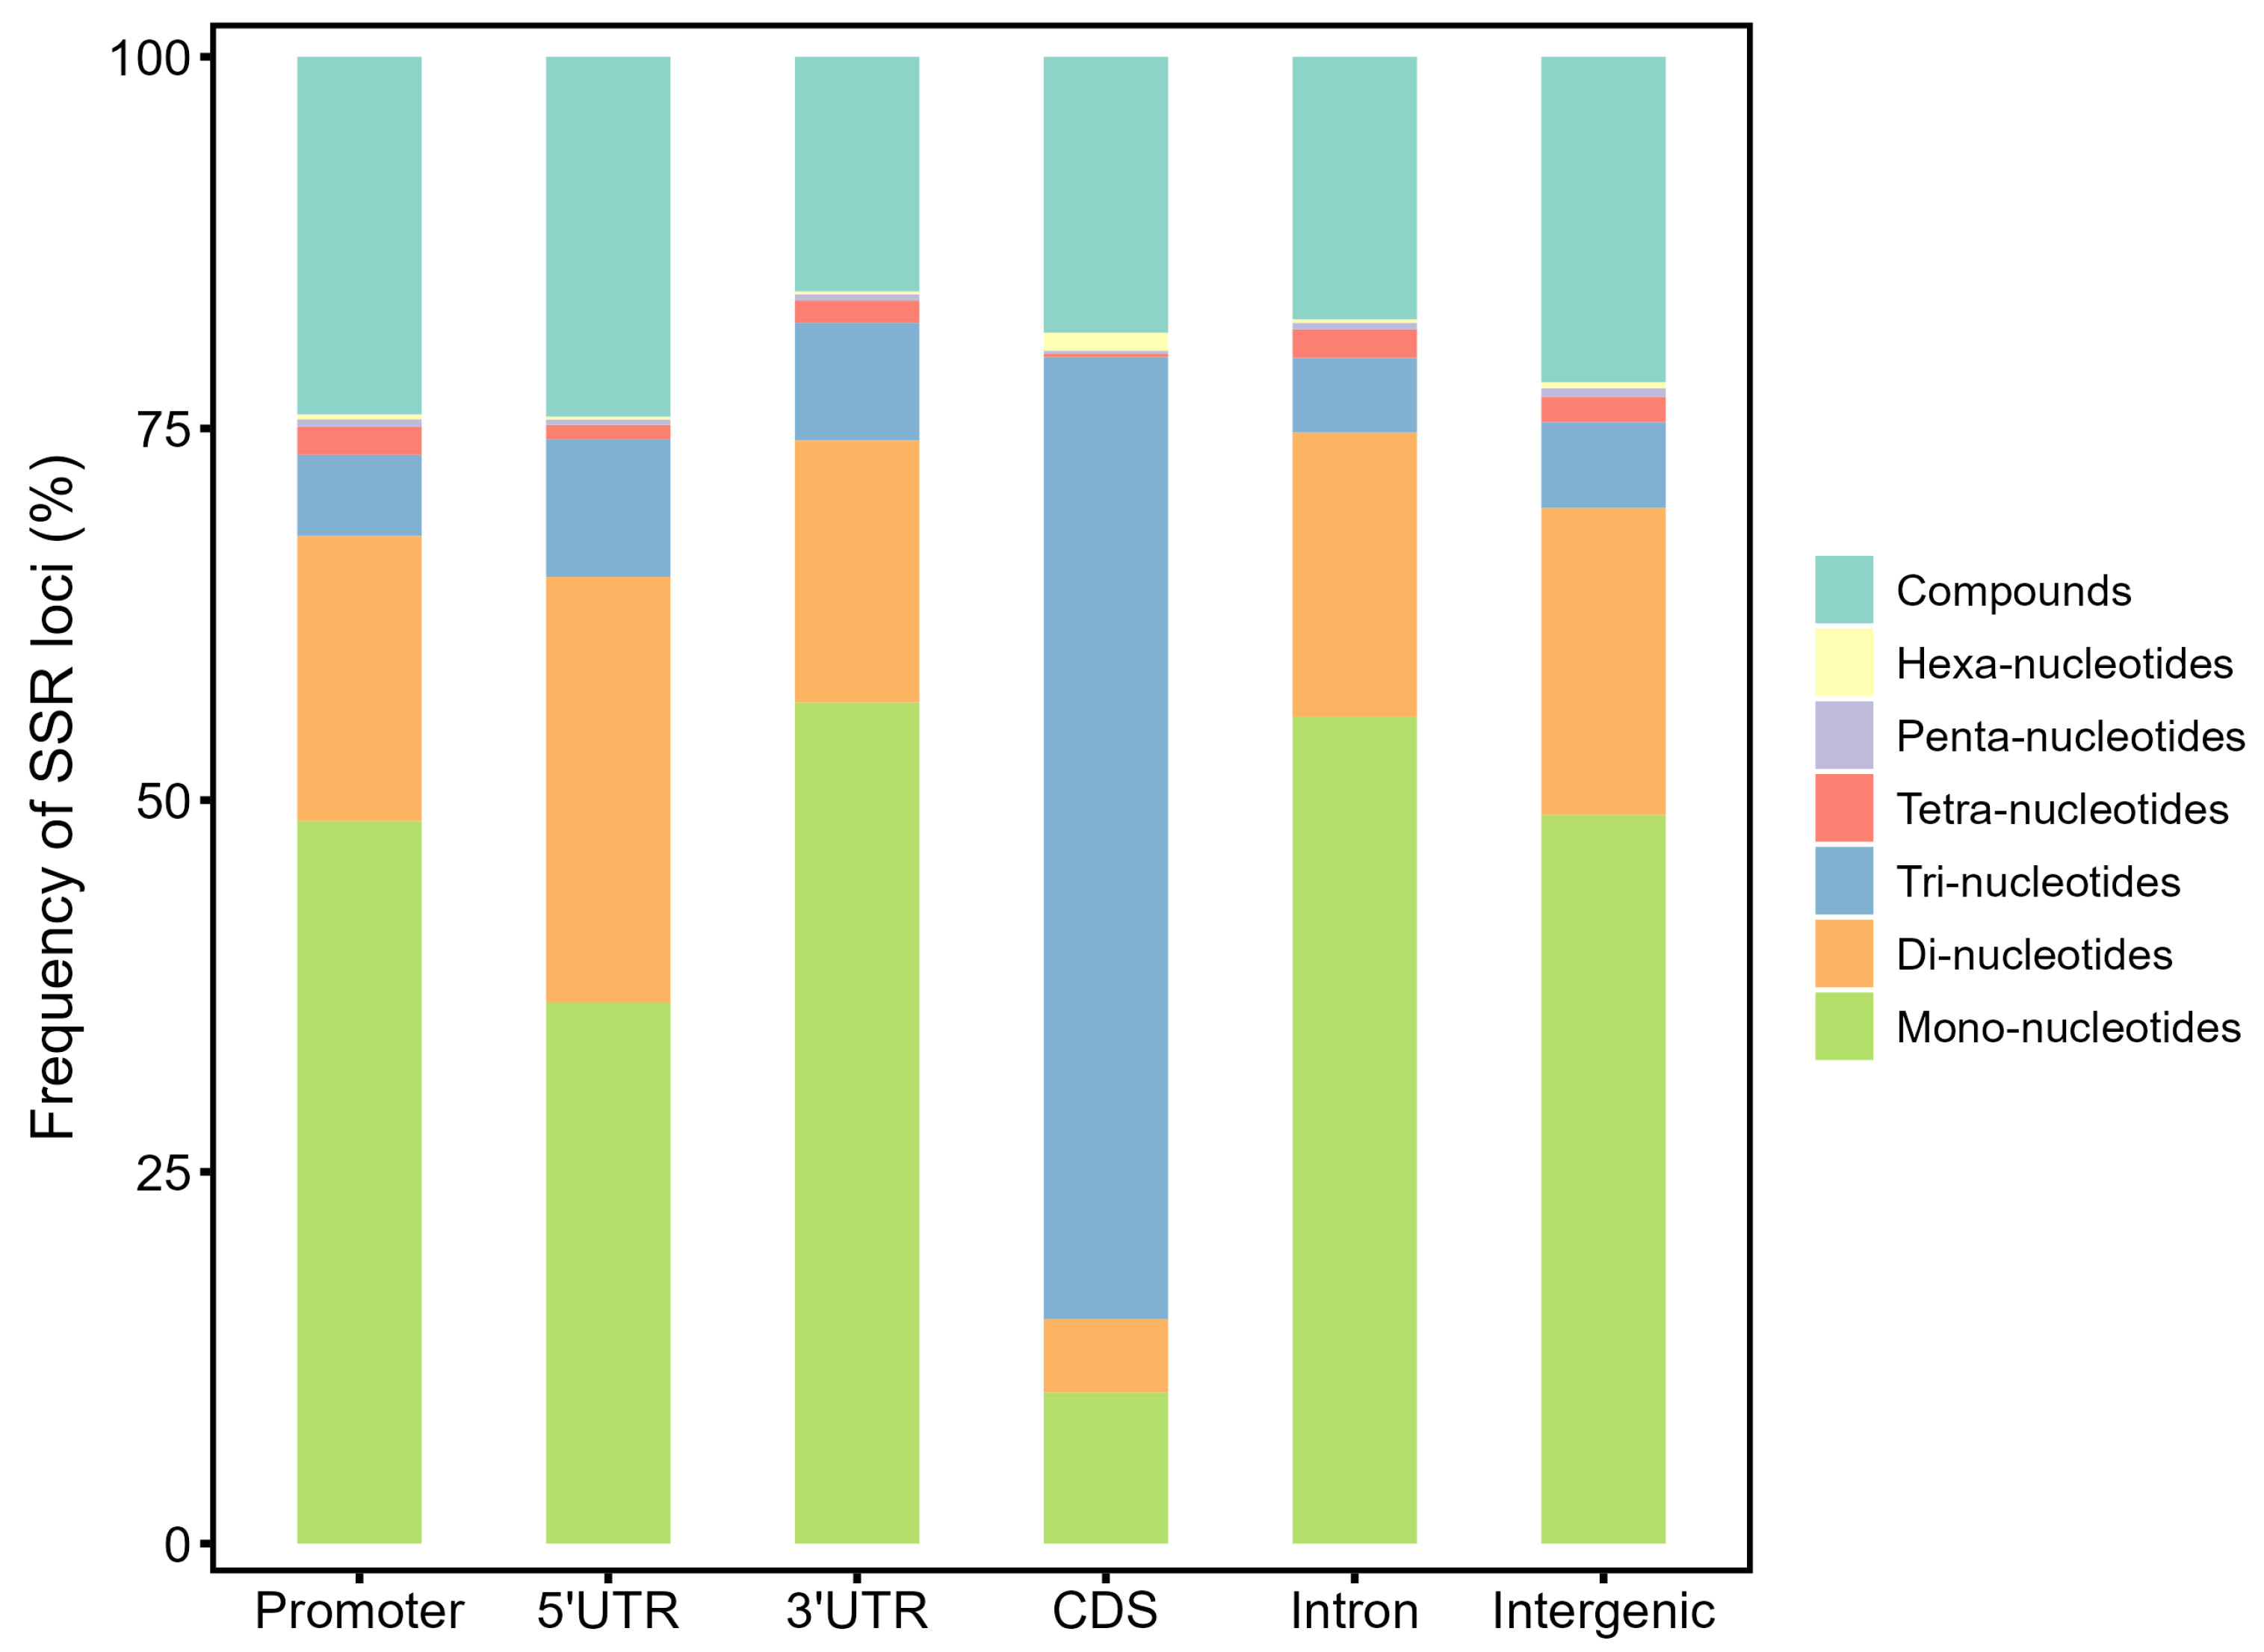
3.3. Genomic Distribution of the SSR Loci

The SSR loci were scattered in different genomic regions, including the promoters, 5′UTRs, 3′UTRs, CDSs, introns, and intergenic regions. For all identified loci, as shown in Table 2, 338,497 are located in the intergenic region, accounting for 72.51%, and only 3525 (0.76%) are located in the CDSs. The average SSR density was the largest in the 5′UTR regions (1555.8 per Mbp) and the smallest in the CDS regions (111.5 per Mbp).
Furthermore, the frequency of different SSR types in the six genomic regions was analyzed (Figure 5). In the noncoding regions, MNRs were dominant and the SSR number decreased with the increase in the repeat units. In the 5′UTR regions, the number of DNRs (1242) accounted for 28.66%, with a significantly higher proportion than that in the other genomic regions (Chi-square test p < 0.001; 19.17% in the promoters, 17.65% in the 3′UTRs, 4.94% in the CDSs, 19.14% in the introns, and 20.65% in the intergenic regions, respectively). Of the loci in the CDS regions, however, the number of TNR- and HNR-type perfect SSRs were 2281 and 43, accounting for 64.71% and 1.22%, respectively. Both of them were significantly larger than their frequencies in the other genomic regions (Chi-square test p < 0.001). In 654 compound-type loci located in the CDSs, 475 contained TNRs and/or HNRs, accounting for 72.63%, which was significantly higher than that in the other regions (Chi-square test p < 0.001; 17.10% in the promoters, 28.31% in the 5′UTRs, 21.37% in the 3′UTRs, 15.56% in the introns, and 15.84% in the intergenic regions, respectively).
For the SSR loci with unique flanking sequences and the e-PCR-screened specific loci, most of them were located in the intergenic regions and, with the fewest in the CDS regions (Table 2), with the same tendency with all identified loci. However, both the frequencies of SSR loci located in the intergenic regions for loci with unique flanking sequences (67.68%) and the e-PCR-screened specific loci (63.90%) were significantly lower than that for all identified loci (72.51%) (Chi-square test p < 0.001), implying that the SSR loci in the intergenic regions might have lower uniqueness and specificity. In addition, the average lengths of the e-PCR-screened specific SSR loci in the six genomic regions were shorter than those of all identified loci, suggesting that the short SSRs might have better specificity.

3.4. Validation of SSR Marker Polymorphism

Polymorphism of the SSR markers was experimentally detected based on 105 randomly selected markers in 30 A. truncatum plus trees. A total of 91 (86.7%) primer pairs amplified specific PCR products, and 14 (13.3%) did not generate clear bands in any plus tree (Table S3). A total of 82 of the 91 primer pairs showed allelic polymorphism in the 30 plus trees, with PIC values of 0.032–0.926 (0.481 on average). The 82 polymorphic SSRs contained 10 MNRs, 9 DNRs, 12 TNRs, 13 TTRs, 12 PNRs, 11 HNRs, and 15 compound SSRs (Table 3), producing in total 442 alleles. The Na for each polymorphic locus ranged from 2 to 20, with an average of 5.39 (Table S4), indicating that the majority of the SSR markers developed in this study were informative for the population genetic analysis of A. truncatum. For the 30 plus trees, the Ho of the 82 polymorphic markers ranged from 0.000 to 1.000 for each locus, with an average of 0.283. The He was 0.033–0.931, with an average of 0.518. The I was 0.085–2.804 (1.071 on average).
For different SSR types, the PIC value of the valid MNR-, DNR-, TNR-, TTR-, PNR-, HNR-, and compound-typed SSRs was 0.535 (0–0.926), 0.340 (0–0.690), 0.265 (0–0.813), 0.323 (0–0.646), 0.468 (0.125–0.813), 0.407 (0–0.679), and 0.679 (0.069–0.923) on average, respectively. Analysis of variance showed that the SSR type significantly affected the PIC value (p < 0.001). The PIC values of the compound and MNR SSRs were significantly higher than those of the other types of SSRs. The MNRs, DNRs, TNRs, TTRs, PNRs, HNRs, and compounds generated 90, 37, 48, 51, 54, 51, and 120 alleles in the 30 plus trees, respectively.
For SSR loci in different genomic regions, the PIC value of the valid SSRs in the promoters, 5′UTRs, 3′UTRs, CDSs, introns, and intergenic regions was 0.445 (0.032–0.923), 0.505, 0, 0.179 (0.062–0.374), 0.391 (0–0.840), and 0.465 (0–0.926) on average, respectively. The SSRs in the noncoding regions exhibited significantly higher PIC values than those in the CDSs (Student’s t-test p = 0.029). They generated 3.647, 8, 1, 3.250, 4.875, and 4.379 alleles per locus in the 30 plus trees, respectively.

3.5. Cross-Species Transferability Analysis of the SSR Markers

To evaluate the cross-species transferability of SSR markers developed from A. truncatum, the 105 primer pairs were also used to conduct PCR amplifications from DNA samples of seven other Acer species, such as A. henryi, A. tataricum subsp. ginnala, A. negundo, A. palmatum, A. grosseri, A. platanoides, and A. rubrum. The 105 SSR markers exhibited moderate levels of transferability in the related species, 59.0% for A. platanoides, 56.2% for A. palmatum and A. rubrum, 53.3% for A. henryi, 50.5% for A. tataricum subsp. ginnala, 49.5% for A. negundo, and 48.6% for A. grosser (Table 3). There were 36 primer pairs with abilities for amplifying PCR products in the eight species and a high level of polymorphism, which would be useful for comparative genomic analysis among species of the genus Acer. The transferabilities of the MNR-, DNR-, TNR-, TTR-, PNR-, HNR-, and compound-type SSRs were 53.3%–66.7%, 26.7%–46.7%, 53.3%–80%, 66.7%–73.3%, 33.3%–46.7%, 13.3%–33.3%, and 73.3%–86.7% in the seven species, respectively. The transferabilities of SSRs in the promoters, CDSs, introns, and intergenic regions were 35.3%–52.9%, 75.0%–100%, 62.5%–75.0%, and 43.9%–54.5% in the seven species, respectively. Because only one SSR was sampled for the locations of the 5′UTRs and 3′UTRs, their transferability was not calculated.
Genetic dissimilarity for the eight Acer species was analyzed based on the 36 polymorphic SSR markers and further used to draw a neighbor-joining phylogenetic dendrogram (Figure 6). Two major clusters were generated in the dendrogram. One cluster contains the 30 A. truncatum plus trees. The other cluster contains the seven closely related species, showing their divergency with A. truncatum.

4. Discussion

A large set of high-quality SSR markers is necessary for research on population genetics and molecular genetics in higher plants. The assembling of chromosome-scale genome by Ma et al. [16] provided an opportunity for the development of high-quality genomewide SSR markers of A. truncatum. In this study, 462,331 SSR loci were identified based on the chromosome-scale A. truncatum genome. These loci were located on 13 chromosomes and 20 unassembled scaffolds. This was the first report to locate the genomewide SSRs of A. truncatum on chromosomes. However, the prerequisite for developing polymorphic primers is that the species has high-quality genomic data, which limits the development process of SSR primers for some species lacking genomic information [23]. Developing polymorphic SSR markers for these species through the comparative analysis of genome sequences from multiple materials and genotyping would be a feasible approach [24]. Furthermore, 286,344 SSR loci with unique flanking sequences and 199,990 loci with specific physical positions were screened by the BLASTN and e-PCR programs, respectively. The development of these SSR markers provides a powerful tool for studies on population genetics, QTL mapping, linkage mapping, and marker-assisted breeding of A. truncatum. In addition, in our study, the number of SSR loci showed a strong positive correlation with chromosome length, indicating that longer chromosomes have richer variable DNA sequences, which may generate more genetic variations. The individuals or species with more genetic variations have higher levels of genetic diversity, which could reflect the adaptability and evolutionary history [25,26,27]. The lengths of individual or species chromosomes can serve as a basis for evolution and genetic diversity analysis.
In the SSR sequences of Wang’s study on A. truncatum [14], motifs of (AT/AT)n and (AAT/ATT)n were the most abundant for DNR and TNR SSRs, respectively (no MNR SSR was analyzed). In the present study, the (A/T)n, (AT/TA)n, and (AAT/ATT/TAA/TTA/TAT/ATA)n were also the most frequent motifs for MNR, DNR, and TNR SSRs. It suggested that the SSR sequences in the A. truncatum genome might have A/T-base bias. The bias of A/T bases was also found in SSR sequences of Ailanthus altissima (Mill.) Swingle [28], Bunium persicum (Boiss.) Fedtsch [29], Punica granatum L. [30,31], Oryza sativa [32], and Populus trichocarpa (Torr. & Gray) [33], which might be explained by easier strand separation for poly(A) and poly(T) structures than poly(C) and poly(G) [34].
SSR markers are widely distributed in the genomes of higher plants. In the previous studies, the average interval between two closed SSR loci was 1.14 Kbp in Arabidopsis thaliana [35], 1.24 Kbp in rice (Oryza sativa L.) [36], 1.87 Kbp in Punica granatum [30], and 15.48 Kbp in maize (Zea mays L.) [17], respectively. In the present study, the interval was 1.37 Kbp in A. truncatum, indicating the genetic differences among plant genomes. SSRs are often unevenly distributed in different genomic regions, and this distribution pattern is related to biological functions. Variations in SSRs located on CDSs lead to increased frameshift mutation rates or gene dysfunction and variations in expression products [35,37]. Although those located in the intergenic region do not alter gene expression products, an abnormal secondary structure of DNA by forming loops or hairpins may occur, resulting in alterations in the expression levels of nearby genes [38]. Overall, SSRs contribute to genomic structure and functional stability. However, due to the lack of high-quality genomic sequence data, the distribution of SSRs in the genome of A. truncatum has not been systematically studied. Our research results based on the chromosome-scale genome data of A. truncatum show that the SSR density in the CDS regions (111.7 per Mbp) was much lower than that in the other regions (1289.6 per Mbp in the promoters, 1557.6 in the 5′UTRs, 736.7 in the 3′UTRs, 796.0 in the introns, and 706.6 in the intergenic regions, respectively; Table 2), which was consistent with the results of previous studies in rice and maize [17,39]. The DNRs showed a tendency of locating in the 5′UTRs, which might be related to the role of 5′UTR in gene expression regulation [40]. In addition, the majority of SSRs in the CDS regions of the A. truncatum genome were also of the TNR type, which was similar to other reports in maize and cashew (Anacardium occidentale L.) [10,17]. Interestingly, HNR-type SSRs also showed a relatively high proportion in the CDS regions compared with their frequency in the noncoding regions, which could be attributed to the potential role of both the TNRs and HNRs in the maintenance of gene function and structure in genomes [41,42].
Polymorphic markers are informative and useful in studies on conservation genetics, population genetics, and marker-assisted breeding. In the present study, experimental detection of 105 pairs of primers showed 86.7% validity and 78.1% polymorphism, suggesting that the majority of the developed SSR dataset had validity and polymorphism. In maize, a similar SSR developing strategy also generated a large SSR set with high validity (80.1%) and polymorphism (74.2%) [17]. According to the viewpoint of Botsein et al. [43], markers with PIC values of 0.25–0.5 and >0.5 could be defined as reasonably informative and highly informative markers, respectively. In the present study, 37 detected markers met this requirement, which could be used in studies on population genetics, conservation genetics, and marker-assisted breeding of A. truncatum.
The polymorphism of valid SSRs varied with the length of motifs. In previous studies, MNR and compound SSRs were not given enough attention for marker development [14]. In the present study, however, the PIC values of the compound and MNR SSRs were significantly higher than those of the other types of SSRs, which also might be used in population genetic studies. It was also found that the SSRs in the noncoding regions exhibited significantly higher PIC values than those in the CDSs, similar to the finding of previous studies [17,44], which could be explained by the low selective pressure in the noncoding regions.
In general, the SSR markers developed from a species can be used for its closely related species due to the presence of homologous sequences. In the present study, the 105 randomly selected primer pairs exhibited moderate levels of transferability in seven related species of A. truncatum, 59.0% for A. platanoides, 56.2% for A. palmatum and A. rubrum, 53.3% for A. henryi, 50.5% for A. tataricum subsp. ginnala, 49.5% for A. negundo, and 48.6% for A. grosser. The cross-species transferability rates in these species reflected the flanking sequence conservation of SSR loci. The phylogenetic dendrogram showed that the seven closely related species were grouped in a segregated cluster compared with the A. truncatum plus trees, suggesting that the developed SSR markers could serve the genetic relationship analysis of the genus Acer. In the present study, however, only one genotype for each related species was used for the cross-species transferability detection of SSRs. More genotypes can be added to increase the representativeness of the transferability rate in the future.

5. Conclusions

This study generated a novel SSR set of A. truncatum based on its whole-genome sequences. Most of the SSR loci were located in the intergenic regions and fewest in the CDSs, where the frequency of TNR and HNR SSRs was the highest, potentially serving to maintain the stability of gene structure and function. Most of the randomly selected 105 SSR markers in 30 A. truncatum plus trees showed high allelic polymorphism and moderate levels of transferability to seven other Acer species. The large set of valid SSR markers developed in this study provides a powerful tool for studies on population genetics, conservation genetics, linkage mapping, QTL mapping, comparative genomics, and marker-assisted breeding of the genus Acer.

Supplementary Materials

The following supporting information can be downloaded at: https://www.mdpi.com/article/10.3390/f15040635/s1; Table S1: The latitude and longitude information of 30 Acer truncatum plus trees in the Udantara Natural Reserve; Table S2: The distribution of SSRs on chromosomes of Acer truncatum; Table S3: Information of 199,990 SSR loci with specific physical positions; Table S4: Information and PCR products of 105 selected SSR primer pairs in Acer truncatum and its relative species; Table S5: Genetic diversity indexes of the 82 polymorphic SSR markers in the 30 Acer truncatum plus trees.

Author Contributions

Conceptualization, H.B., Z.W. and J.W.; methodology, Y.L., H.B. and Z.W.; software, Y.L., Q.J. and J.W.; validation, H.B.; investigation, Y.L., H.B., Z.W., M.H. and C.Z.; resources, M.H. and C.Z.; data curation, Y.L.; writing—original draft preparation, H.B. and J.W.; writing—review and editing, H.B. and J.W.; visualization, Y.L. and J.W.; supervision, H.B. and J.W.; project administration, H.B., Z.W. and J.W.; funding acquisition, H.B., Z.W. and J.W. All authors have read and agreed to the published version of the manuscript.

Funding

This work was supported by the Project of Science and Technology Plan of Inner Mongolia Autonomous Region, China (Grant No. 2022YFDZ0054), Natural Science Foundation of Inner Mongolia Autonomous Region, China (Grant No. 2022MS03022), the National Key Research and Development Program of China (Grant No. 2021YFD2200104), and Project of First-class Discipline Construction of Beijing Forestry University (Grant No. 2019XKJS0308).

Data Availability Statement

All data generated or analyzed during this study are included in this article. The data are available from the corresponding author on reasonable request.

Conflicts of Interest

The authors declare no conflicts of interest.

References

  1. Yi, Y. Application of colored-leaf plants in landscape construction. J. Landsc. Res. 2015, 7, 89–90. [Google Scholar]
  2. Fan, Y.; Lin, F.; Zhang, R.; Wang, M.; Gu, R.; Long, C. Acer truncatum Bunge: A comprehensive review on ethnobotany, phytochemistry and pharmacology. J. Ethnopharmacol. 2022, 282, 114572. [Google Scholar] [CrossRef] [PubMed]
  3. Liang, Q.; Wang, W.W.; Yuan, F.L.; Liu, X.; Li, D.L.; Yang, K.Q. Characterization of yuanbaofeng (Acer truncatum Bunge) samaras: Oil, fatty acid, and phytosterol content. Ind. Crop. Prod. 2019, 135, 344–351. [Google Scholar] [CrossRef]
  4. Tong, Y.; Xv, J.; Chen, F.; Yin, Z.; Liu, N.; Kong, W. Advance in chemical components and products application status of Acer truncatum Bunge. China Oils Fats 2022, 47, 118–123. [Google Scholar] [CrossRef]
  5. Fan, H.; Sun, L.; Yang, L.; Zhou, J.; Yin, P.; Li, K.; Xue, Q.; Li, X.; Liu, Y. Assessment of the bioactive phenolic composition of Acer truncatum seed coat as a byproduct of seed oil. Ind. Crop. Prod. 2018, 118, 11–19. [Google Scholar] [CrossRef]
  6. Wang, X.Y.; Fan, J.S.; Wang, S.Y.; Sun, R. A new resource of nervonic acid from purpleblow maple (Acer truncotum) seed oil. For. Prod. J. 2006, 56, 147–150. [Google Scholar]
  7. Qiao, Q.; Wang, X.; Ren, H.J.; An, K.; Feng, Z.; Cheng, T.T.; Sun, Z.K. Oil content and nervonic acid content of Acer truncatum seeds from 14 regions in China. Hortic. Plant J. 2019, 5, 24–30. [Google Scholar] [CrossRef]
  8. Ramesh, P.; Mallikarjuna, G.; Sameena, S.; Kumar, A.; Gurulakshmi, K.; Reddy, B.V.; Reddy, P.C.O.; Sekhar, A.C. Advancements in molecular marker technologies and their applications in diversity studies. J. Biosci. 2020, 45, 123. [Google Scholar] [CrossRef]
  9. Grover, A.; Sharma, P.C. Development and use of molecular markers: Past and present. Crit. Rev. Biotechnol. 2016, 36, 290–302. [Google Scholar] [CrossRef]
  10. Savadi, S.; Muralidhara, B.M.; Venkataravanappa, V.; Adiga, J.D.; Manjunatha, K.; Patil, B. De novo transcriptome assembly and its utility in development and characterization of the first set of genic SSR markers in cashew. Ind. Crop. Prod. 2022, 189, 115734. [Google Scholar] [CrossRef]
  11. Guo, X.; Zhang, D.; Bai, L. Development of EST-SSR markers and population genetic structure and genetic diversity of the Malus transitoria (Batalin) C. K. Schneider in Qinghai-Tibetan Plateau. Genet. Resour. Crop. Evol. 2023, 70, 919–933. [Google Scholar] [CrossRef]
  12. Yan, L.P.; Wang, Y.H.; Wu, D.J.; Ren, F.; Li, Q.H.; Yao, J.X. Optimization and primers screening of SSR-PCR reaction system for Acer truncatum. Mol. Plant Breed. 2021, 19, 2279–2285. [Google Scholar] [CrossRef]
  13. E, S.T. Taxonomic Study of Acer mono and Acer truncatum in Liaoning Region Based on Phenotype and Molecular Markers; Shenyang Agricultural University: Shenyang, China, 2020. [Google Scholar]
  14. Wang, R.; Liu, P.; Fan, J.; Li, L. Comparative transcriptome analysis two genotypes of Acer truncatum Bunge seeds reveals candidate genes that influences seed VLCFAs accumulation. Sci. Rep. 2018, 8, 15504. [Google Scholar] [CrossRef] [PubMed]
  15. Wang, R.; Fan, J.; Chang, P.; Zhu, L.; Zhao, M.; Li, L. Genome survey sequencing of Acer truncatum Bunge to identify genomic information, simple sequence repeat (SSR) markers and complete chloroplast genome. Forests 2019, 10, 87. [Google Scholar] [CrossRef]
  16. Ma, Q.; Sun, T.; Li, S.; Wen, J.; Zhu, L.; Yin, T.; Yan, K.; Xu, X.; Li, S.; Mao, J.; et al. The Acer truncatum genome provides insights into nervonic acid biosynthesis. Plant J. 2020, 104, 662–678. [Google Scholar] [CrossRef] [PubMed]
  17. Xu, J.; Liu, L.; Xu, Y.; Chen, C.; Rong, T.; Ali, F.; Zhou, S.; Wu, F.; Liu, Y.; Wang, J.; et al. Development and characterization of simple sequence repeat markers providing genome-wide coverage and high resolution in maize. DNA Res. 2013, 20, 497–509. [Google Scholar] [CrossRef] [PubMed]
  18. Schuelke, M. An economic method for the fluorescent labeling of PCR fragments. Nat. Biotechnol. 2000, 18, 233–234. [Google Scholar] [CrossRef] [PubMed]
  19. Liu, K.; Muse, S.V. PowerMarker: An integrated analysis environment for genetic marker analysis. Bioinformatics 2005, 21, 2128–2129. [Google Scholar] [CrossRef] [PubMed]
  20. Peakall, R.; Smouse, P.E. GenAlEx 6.5: Genetic analysis in Excel. Population genetic software for teaching and research—An update. Bioinformatic 2012, 28, 2537–2539. [Google Scholar] [CrossRef]
  21. Perrier, X.; Jacquemoud-Collet, J.P. DARwin Software. Available online: https://darwin.cirad.fr/ (accessed on 18 January 2024).
  22. Letunic, I.; Bork, P. Interactive Tree Of Life (iTOL) v5: An online tool for phylogenetic tree display and annotation. Nucleic Acids Res. 2021, 49, W293–W296. [Google Scholar] [CrossRef]
  23. Wang, H.; Gao, S.; Liu, Y.; Wang, P.; Zhang, Z.; Chen, D. A pipeline for effectively developing highly polymorphic simple sequence repeats markers based on multi-sample genomic data. Ecol. Evol. 2022, 12, e8705. [Google Scholar] [CrossRef] [PubMed]
  24. Bhattarai, G.; Shi, A.; Kandel, D.R.; Solís-Gracia, N.; da Silva, J.A.; Avila, C.A. Genome-wide simple sequence repeats (SSR) markers discovered from whole-genome sequence comparisons of multiple spinach accessions. Sci. Rep. 2021, 11, 9999. [Google Scholar] [CrossRef]
  25. Nonić, M.; Šijačić-Nikolić, M. Genetic diversity: Sources, threats, and conservation. In Life on Land; Leal Filho, W., Azul, A.M., Brandli, L., Lange Salvia, A., Wall, T., Eds.; Springer International Publishing: Cham, Switzerland, 2021; pp. 421–435. [Google Scholar]
  26. Soltis, P.S.; Soltis, D.E. Plant genomes: Markers of evolutionary history and drivers of evolutionary change. Plants People Planet 2021, 3, 74–82. [Google Scholar] [CrossRef]
  27. Carvalho, Y.G.S.; Vitorino, L.C.; Souza, U.J.B.d.; Bessa, L.A. Recent trends in research on the genetic diversity of plants: Implications for conservation. Diversity 2019, 11, 62. [Google Scholar] [CrossRef]
  28. Ma, Y.; Devi, M.J.; Song, L.; Gao, H.; Cao, B. Genome survey sequencing of Ailanthus altissima and identification of simple sequence repeat (SSR) markers. Silvae Genet. 2022, 71, 47–53. [Google Scholar] [CrossRef]
  29. Bansal, S.; Kumar, A.; Lone, A.A.; Khan, M.H.; Malhotra, E.V.; Singh, R. Development of novel genome-wide simple sequence repeats (SSR) markers in Bunium persicum. Ind. Crop. Prod. 2022, 178, 114625. [Google Scholar] [CrossRef]
  30. Hong, W.; Hao, Z.; Liu, K.; Luo, H.; Bi, R.; Yuan, Z.; Zong, S.; Wang, J. Development and identification of SSR molecular markers based on whole genomic sequences of Punica granatum. J. Beijing For. Univ. 2019, 41, 38–47. [Google Scholar] [CrossRef]
  31. Liu, C.; Li, J.; Qin, G. Genome-wide distribution of simple sequence repeats in pomegranate and their application to the analysis of genetic diversity. Tree Genet. 2020, 16, 36. [Google Scholar] [CrossRef]
  32. Zheng, Y.; Zhang, G.; Wu, W.R. Characterization and comparison of microsatellites in Gramineae. Genom. Appl. Biol. 2011, 30, 513–520. [Google Scholar] [CrossRef]
  33. Tuskan, G.A.; Gunter, L.E.; Yang, Z.-K.; Yin, T.; Sewell, M.M.; DiFazio, S.P. Characterization of microsatellites revealed by genomic sequencing of Populus trichocarpa. Can. J. For. Res. 2004, 34, 85–93. [Google Scholar] [CrossRef]
  34. Gur-Arie, R.; Cohen, C.J.; Eitan, Y.; Shelef, L.; Hallerman, E.M.; Kashi, Y. Simple sequence repeats in Escherichia coli: Abundance, distribution, composition, and polymorphism. Genome Res. 2000, 10, 62–71. [Google Scholar] [CrossRef] [PubMed]
  35. Lawson, M.J.; Zhang, L. Distinct patterns of SSR distribution in the Arabidopsis thaliana and rice genomes. Genome Biol. 2006, 7, R14. [Google Scholar] [CrossRef] [PubMed]
  36. La Rota, M.; Kantety, R.V.; Yu, J.K.; Sorrells, M.E. Nonrandom distribution and frequencies of genomic and EST-derived microsatellite markers in rice, wheat, and barley. BMC Genom. 2005, 6, 23. [Google Scholar] [CrossRef] [PubMed]
  37. Vieira, M.L.; Santini, L.; Diniz, A.L.; Munhoz Cde, F. Microsatellite markers: What they mean and why they are so useful. Genet. Mol. Biol. 2016, 39, 312–328. [Google Scholar] [CrossRef] [PubMed]
  38. Gao, C.; Ren, X.; Mason, A.S.; Li, J.; Wang, W.; Xiao, M.; Fu, D. Revisiting an important component of plant genomes: Microsatellites. Funct. Plant Biol. 2013, 40, 645–661. [Google Scholar] [CrossRef] [PubMed]
  39. Zhang, Z.; Deng, Y.; Tan, J.; Hu, S.; Yu, J.; Xue, Q. A genome-wide microsatellite polymorphism database for the indica and japonica rice. DNA Res. 2007, 14, 37–45. [Google Scholar] [CrossRef] [PubMed]
  40. Du, F.K.; Xu, F.; Qu, H.; Feng, S.; Tang, J.; Wu, R. Exploiting the transcriptome of Euphrates Poplar, Populus euphratica (Salicaceae) to develop and characterize new EST-SSR markers and construct an EST-SSR database. PLoS ONE 2013, 8, e61337. [Google Scholar] [CrossRef] [PubMed]
  41. Metzgar, D.; Bytof, J.; Wills, C. Selection against frameshift mutations limits microsatellite expansion in coding DNA. Genome Res. 2000, 10, 72–80. [Google Scholar] [CrossRef] [PubMed]
  42. Majeed, A.; Singh, A.; Choudhary, S.; Bhardwaj, P. Transcriptome characterization and development of functional polymorphic SSR marker resource for Himalayan endangered species, Taxus contorta (Griff). Ind. Crop. Prod. 2019, 140, 111600. [Google Scholar] [CrossRef]
  43. Botstein, D.; White, R.L.; Skolnick, M.; Davis, R.W. Construction of a genetic linkage map in man using restriction fragment length polymorphisms. Am. J. Hum. Genet. 1980, 32, 314–331. [Google Scholar]
  44. Tian, X.; Strassmann, J.E.; Queller, D.C. Genome nucleotide composition shapes variation in simple sequence repeats. Mol. Biol. Evol. 2010, 28, 899–909. [Google Scholar] [CrossRef] [PubMed]
Figure 1. Variation in the number of different SSR types on 13 chromosomes of Acer truncatum.
Forests 15 00635 g001
Figure 2. Frequency changes of SSR motifs with their repeat number. (AF) The frequency changes of mono-nucleotide, di-nucleotide, tri-nucleotide, tetra-nucleotide, penta-nucleotide, and hexa-nucleotide types of SSR motifs with their repeat number, respectively.
Forests 15 00635 g002
Figure 3. Frequency of the top 15 abundant motifs among the SSRs of Acer truncatum.
Forests 15 00635 g003
Figure 4. The distributions for overall SSR loci, SSR loci with unique flanking sequences, and SSR loci with specific physical positions on Acer truncatum chromosomes. (a) The distribution of overall SSR loci on chromosomes. (b) The distribution of SSR loci with unique flanking sequences. (c) The distribution of SSR loci with specific physical positions on chromosomes. The SSR density is summarized as numbers in 200 Kb bins along each of the 13 chromosomes. Different colors represent levels of SSR density.
Forests 15 00635 g004
Figure 5. Frequency of different types of the identified SSR loci in six genomic regions.
Forests 15 00635 g005
Figure 6. Phylogenetic dendrogram of genetic dissimilarity among the 30 Acer truncatum plus trees and 7 closely related species based on 36 polymorphic SSR markers.
Forests 15 00635 g006
Table 1. The proportion of different SSR types in Acer truncatum genome.
TypesRepeat UnitsAll SSR LociSSR Loci with Unique Flanking Sequencese-PCR-Screened Specific SSR Loci
NumberLength (bp)Rate (%)NumberLength (bp)Rate (%)NumberLength (bp)Rate (%)
Perfect SSRsMNRs229,10614.5449.55141,46614.8949.40103,00114.9051.50
DNRs93,70018.4120.2756,35419.2919.6842,22619.2121.11
TNRs28,35519.676.1315,60120.325.4512,23020.046.12
TTRs804922.621.74525022.731.83387322.711.94
PNRs253027.380.55161827.370.57114727.170.57
HNRs174232.830.38108832.850.3869632.640.35
Total363,48216.2978.62221,37716.7677.31163,17316.7581.59
Compound SSRs-98,84993.7021.3864,96793.9122.6936,81777.3318.41
Total-462,33132.85100.00286,34434.26100.00199,99027.90100.00
Note: MNRs, DNRs, TNRs, TTRs, PNRs, and HNRs indicate mono-, di-, tri-, tetra-, penta-, and hexanucleotide SSRs, respectively.
Table 2. The distribution of SSRs in different genomic regions.
Genomic RegionsAll SSR LociSSR Loci with Unique Flanking Sequencese-PCR-Screened Specific SSR Loci
NumberDensity (SSRs/Mbp)Length (bp)Rate (%)NumberDensity (SSRs/Mbp)Length (bp)Rate (%)NumberDensity (SSRs/Mbp)Length (bp)Rate (%)
Promotor61,4311247.635.2613.1645,802930.235.3415.8032,848667.129.3616.19
5′UTR43341555.835.920.9336611314.236.411.2634771248.232.471.71
3′UTR3706733.826.330.793103614.426.261.072837561.724.741.40
CDS3525111.534.900.76270885.735.410.93253480.231.061.25
Intron55,307793.528.6711.8538,419551.228.8713.2531,541452.524.5615.55
Intergenic338,497706.633.5372.51196,229409.635.6867.68129,658270.728.7363.90
Total */average466,800732.333.16100.00289,922454.834.63100.00202,895318.328.22100.00
Notes: 5′UTR, 5′-untranslated region; 3′UTR, 3′-untranslated region; CDS, coding sequence. * The total number of SSRs is more than the identified number of SSR loci due to the alternative splicing, and the same SSRs might be divided into different regions to be double-counted.
Table 3. Polymorphism and transferability of 105 selected SSR loci.
SSR TypeNumberMonomorphic in Acer truncatum Plus TreesPolymorphic in Acer truncatum Plus TreesTransferabilityPolymorphic in All Species a
Acer henryiAcer tataricum subsp. ginnalaAcer negundoAcer palmatumAcer grosseriAcer platanoidesAcer rubrum
MNR152 (13.3 b)10 (66.7)9 (60.0)8 (53.3)9 (60.0)9 (60.0)9 (60.0)10 (66.7)10 (66.7)7 (46.7)
DNR152 (13.3)9 (60.0)6 (40.0)6 (40.0)5 (33.3)7 (46.7)4 (26.7)7 (46.7)5 (33.3)3 (20.0)
TNR152 (13.3)12 (80.0)10 (66.7)10 (66.7)8 (53.3)10 (66.7)8 (53.3)12 (80.0)10 (66.7)7 (46.7)
TTR152 (13.3)13 (86.7)10 (66.7)10 (66.7)10 (66.7)10 (66.7)10 (66.7)11 (73.3)10 (66.7)6 (40.0)
PNR15012 (80.0)5 (33.3)6 (40.0)6 (40.0)6 (40.0)6 (40.0)7 (46.7)6 (40.0)4 (26.7)
HNR151 (6.7)11 (73.3)3 (20.0)2 (13.3)3 (20.0)5 (33.3)2 (13.3)3 (20.0)5 (33.3)1 (6.7)
Compound15015 (100.0)13 (86.7)11 (73.3)11 (73.3)12 (80.0)12 (80.0)12 (80.0)13 (86.7)8 (53.3)
Total1059 (8.6)82 (78.1)56 (53.3)53 (50.5)52 (49.5)59 (56.2)51 (48.6)62 (59.0)59 (56.2)36 (34.3)
Notes: MNRs, DNRs, TNRs, TTRs, PNRs, and HNRs indicate mono-, di-, tri-, tetra-, penta-, and hexanucleotide SSRs, respectively. a Number of SSRs which could amplify products in all species and show polymorphic alleles. b Percentage of SSRs.
Disclaimer/Publisher’s Note: The statements, opinions and data contained in all publications are solely those of the individual author(s) and contributor(s) and not of MDPI and/or the editor(s). MDPI and/or the editor(s) disclaim responsibility for any injury to people or property resulting from any ideas, methods, instructions or products referred to in the content.

