Article

Effects of Thinning on Carbon Storage in a Mixed Broadleaved Plantation in a Subtropical Area of China

College of Forestry and Landscape Architecture, South China Agricultural University, Guangzhou 510642, China
*
Author to whom correspondence should be addressed.
Forests 2024, 15(4), 638; https://doi.org/10.3390/f15040638
Submission received: 6 March 2024 / Revised: 26 March 2024 / Accepted: 29 March 2024 / Published: 31 March 2024
(This article belongs to the Section Forest Ecology and Management)

Abstract

:
Forest thinning is a widely used silvicultural method in forest management and has complex effects on carbon sequestration in different types of forest ecosystems. The present study examined the short-term effects of different thinning intensities on carbon storage in an 11-year-old mixed broadleaved plantation. The results partially supported that different thinning intensities have varying impacts on carbon storage in different parts of forest ecosystems. The main results were as follows: (1) The effect of thinning on promoting the growth of fast-growing tree species (Michelia macclurei Dandy and Schima superba Gardn. et Champ.) was earlier than that of slow-growing tree species (Castanopsis hystrix Miq.). (2) A greater thinning intensity conferred greater effects on promoting the tree biomass carbon growth, litter carbon storage, and understory plant diversity, in the order of 41%~50% > 31%~40% > 20%~30%, but these values were lower than those for the unthinned plots. (3) The soil carbon storage declined most in the 41%~50% thinned plots, due to the reduced carbon storage in the humus layer. (4) The 20%~30% thinning intensity promoted carbon sequestration in the short term in the mixed broadleaved plantation. The results suggested that a lower thinning intensity promoted carbon sequestration in the short term, a greater thinning intensity reduced carbon storage at first, but the negative effect on carbon storage exhibited trade-offs later by the growth of tree and understory plant biomass carbon and the accumulation of litter layer carbon.

1. Introduction

Forest ecosystems provide multiple services, especially their ability to capture and store carbon (C). Current studies indicate that a forest ecosystem constitutes a net C sink that offsets ~25% of yearly anthropogenic C emissions, thus mitigating climate change actively [1,2]. In China, the area of plantations has expanded to 8.0 × 10⁷ ha in 2021, which translates into an increased terrestrial carbon sink in biomass and soils [3]. Due to poor ecological stability and a decrease in carbon sequestration capacity of monocultures [4] and the higher biodiversity, resistance, and resilience to disturbances of mixed forests [5,6,7], mixed plantations have been proposed and implemented since the last decade. Even though forestation sequesters carbon, the scalability of this land use for meeting warming limitation targets has been questioned due to the sheer amount of land area required [8]. Furthermore, forestation of arable land results into trade-offs with local food production [9,10]. Therefore, since the Paris climate summit in 2015, forest management has been promoted as an efficient option to increase the accumulation of C by forest ecosystems [11]. Thinning is an essential silvicultural practice widely used in forest management [12], and it has been proved to promote the soil carbon storge of forest ecosystems by altering substrate charateristics [13,14,15,16,17] and the carbon metabolism process rate [18]. For instance, thinning induces more litterfall input, which initially alters substrate availability for microbial, soil enzymatic activity, and carbon mineralization [18]. Thinning through removing trees to open the canopy, which causes more solar radiation to reach the forest floor, further stimulates understory vegetation diversity [19], the litter decomposition rate, and soil microbial activities [20], which further change the carbon metabolism process [21,22,23]. Studies have shown different effects of thinning on the carbon storage of tree layers. Thinning reduces the carbon storage of a tree layer by removing trees, even though the promoted growth of the preserved trees cannot compensate for the removed biomass carbon in a short time [24,25]. Studies have also shown that thinning enhances the tree layer’s carbon storage in plantations but reduces the carbon storage of the litter layer and soil [26].
So far, studies of the effects of thinning on tree growth, understory diverstiy, soil carbon storage, and forest biomass carbon have mainly involved pure forests. In addition, thinning effects on forest carbon storage may be reinforced, counteracted, or offset by the thinning-induced soil respiration rate, removed tree biomass carbon, or a disturbed soil enviroment. Thus, it is uncertaion how different thinning intensities affect the carbon structure post-thinning, and much less is known on the effect of thinning, especially the different intensities of thinning on carbon storage dynamics in mixed broadleaved plantations. We assessed the carbon dynamics in an 11-year-old mixed broadleaved plantation of Schima superba Gardn. et Champ. × Castanopsis hystrix Miq. × Michelia macclurei Dandy after different intensities of thinning. The main objective of this study was to find a proper thinning intensity to enhance the carbon storage of the mixed plantation. Our specific aims were (1) to evaluate the effects of different intensities of thinning on the carbon structures in the mixed plantation; (2) to estimate the influnces of thinning on species-specific carbon growth; and (3) to describe the effects of varing intensities of thinning on the overall carbon storage in the mixed plantation.

2. Materials and Methods

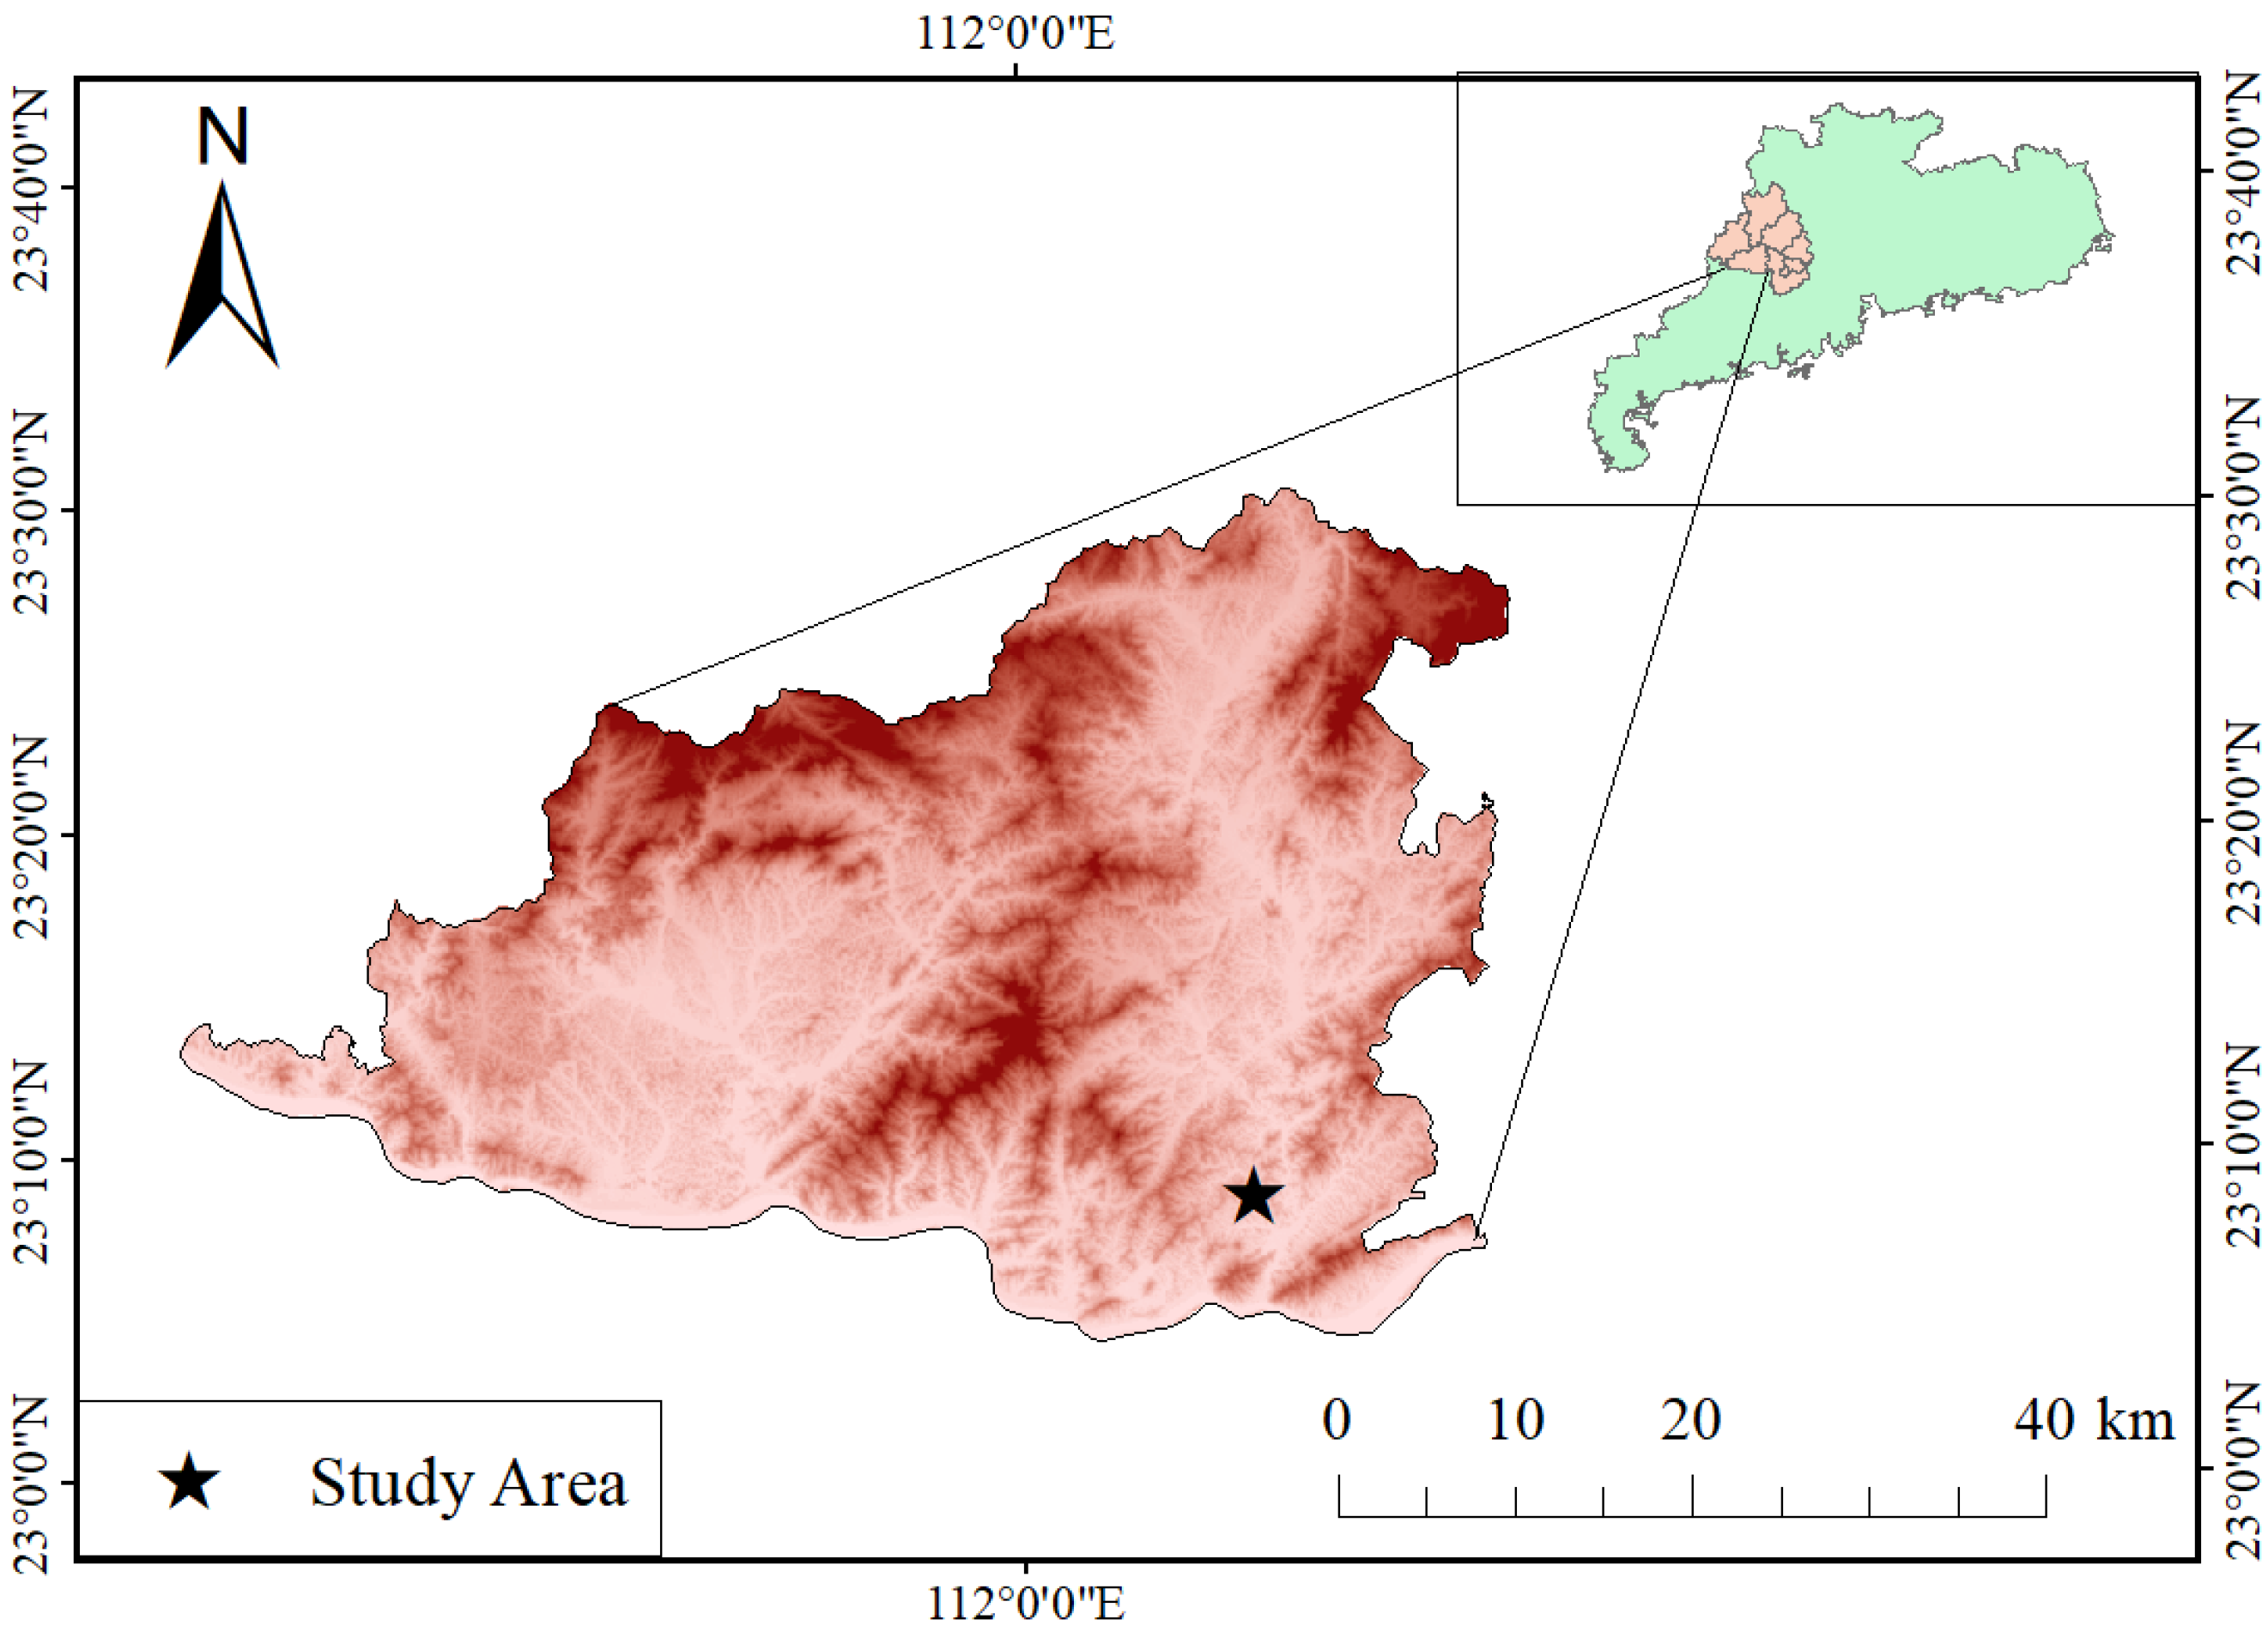
2.1. Study Site and Experimental Design

The study site is located in Zhaoqing city in Guangdong, China (E 111°22′~E 112°06′, N 23°07′~N 23°25′). It belongs to a subtropical monsoon climate, with a mean annual precipitation of 1428.5 mm~1638.3 mm and a mean annual temperature of 21.5 °C (Figure 1).
The planted density in 2010 was 856 trees·ha−1, with 237 trees·ha−1 Castanopsis hystrix Miq., 548 trees·ha−1 Schima superba Gardn. et Champ., and 71 trees·ha−1 Michelia macclurei Dandy. They were randomly mixed and planted regularly in the field. In the first three years after planting, understory plants were removed manually to improve the survival rate of seedlings. In 2013, silvicultural management had ceased, and the three tree species started to sprout several seedlings. In 2021, the density was 1585 trees·ha−1, with 368 trees·ha−1 Castanopsis hystrix Miq., 1101 trees·ha−1 Schima superba Gardn. et Champ., and 116 trees·ha−1 Michelia macclurei Dandy. The soil type is Latosol, and the forest floor is a typical moder.
Twelve square plots, 625 m2 each, were established in July 2021. We thinned the nine plots with 3 intensities, namely, 20%~30%, 31%~40%, and 41%~50%, in August 2021, and three other plots were untreated (control). There were three replicates for each thinning intensity. We adopted the method of thinning from below. The thinning intensity was the percentage of the basal area of the harvested trees in the total basal area of the original stands. Characteristics for each plot are presented in Table 1. A standard protocol for tree data collection (diameter, heights of trees, and crown length) was applied.

2.2. Understory Vegetation Survey and Index Calculations

In order to investigate the diversity of the understrory plants, in July 2021 and August 2022, 5 subplots (2 m × 2 m per subplot) were set up, with the center and four corners of each plot located. We recorded the shrub and herbaceous species as well as the quantity of each species. The coverage (in % of the plot area) of all understory plant species was recorded. For the shrub species, numbers, ground diameter (2 cm above the soil surface) and height (vertical height) were measured in the field. For herbaceous plants, the height was only measured for species with cover values > 2%. Species diversity was estimated by the Simpson index (Equation (1)), species richness was calculated by the Margalef index (Equation (2)), the species diveristy change index was estimated by the Shannon–Wiener index (H′) (Equation (3)), and the species evenness index was calculated by the Pielou index (Equation (4)).
D s = 1 i = 1 S P i 2
D M = S 1 lnN
H = i = 1 S t o t a l p i · ln p i
E = H ln S
where Ds is the Simpson diversity, pi is the proportion of species i in the plot, and S is the total species of shrub or herbaceous plants; DM is the Margalef richness index; N′ represents the number of individuals within the sample plot; H′ is the Shannon–Wiener index; and E is Pielou’s evenness index.

2.3. Litter, Soil Sampling, and Measuring Methods

Fresh litter was collected in July 2021 and August 2022 in a quadratic, square frame of 0.0625 m2. We divided the plot into four equal squares and sampled the litterfall at the centers of the squares. Once dried at 40 °C until constant, the different fractions (leaves, beech nuts, seed capsules, twigs, bud scales, etc.) were separated manually. Here, only the leaf fraction results are reported.
Soil samples were collected using a soil corer with a diameter of 8 cm in July 2021 and August 2022. Three replicates were taken for each treatment and soil depth (humus layer, 0~20 cm) in the plot. These samples were collected along four transects. The distance between sampling locations was 5 m in the plots.
After removing root particles, litterfall, the humus layer, and mineral soil were dried at 40 °C. Mineral soil was sieved (<2 mm) thereafter. All samples were milled and sieved (<2 mm) before determining the total C and N contents using an automated C/N analyzer (Carlo Erba, NA 1500, Milan, Italy). A 5 mg sample was weighed to determine the soil C/N content for each soil sample. Fresh mineral soil samples were analyzed for pH in water using a 1:2.5 soil/water suspension. Soil pH was determined in a dilution of soil (the volume of soil:water is 1:2.5) with a glass electrode (pH meter, single rod assembly) [27].

2.4. Leaf Area INDEX Measurement

To measure the the leaf area index (LAI), four hemispherical canopy photographs were taken skyward from the forest floor with a fisheye lens at 4 locations, where the litterfall was collected in each plot. We applied Gap Light Analyzer Version 2.0 (GLA) software [28] to analyze the hemispherical canopy photographs to get the LAI.

2.5. Biomass Carbon, Litter Carbon, and Soil Carbon Calculations

The tree biomass was estimated for each plot using the species-specific allometric equations presented in Table 2. The aboveground biomass of Castanopsis hystrix was the sum of the biomass of the trunk, bark, branches, and leaves. The aboveground biomass of Michelia macclurei was the sum of the biomass of the trunk with bark, branches, and leaves. The carbon storage of trees was calculated from the biomass and carbon concentration.
Soil organic carbon storage was calculated as follows:
C i = s o c i × B D i × i × 10 1
where Ci, SOCi, and BDi represent SOC stocks (t·ha−1), SOC concentration (g·kg−1), and soil bulk density (g·cm−3) in the i soil layer (cm), respectively. The BD values were calculated as [29]:
B D = 0.4123 + 1.032 e 0.0413 S O C
Carbon storage of litter was calculated from the dry weight and SOC conent.
Table 2. Species-specific biomass allometric equations and C concentrations.
Species Biomass (kg)C Content PercentageReferences
Schima superbaAbovegroundW = 0.5373 × D1.903 (R2 = 0.91)C = 0.5077[30]
RootsW = 0.5759 × D1.4093 (R2 = 0.79)C = 0.5487
Castanopsis hystrixTrunkW = 0.0641 × (D2H)0.8699 (R2 = 0.99)C = 0.4902[31,32]
BarkW = 0.0105 × (D2H)0.8246 (R2 = 0.92)C = 0.4491
BranchesW = 0.0001 × (D2H)1.3949 (R2 = 0.81)C = 0.4912
LeavesW = 0.0000028 × (D2H)1.6052 (R2 = 0.91)C = 0.5018
RootsW = 0.1210 × (D2H)0.6495 (R2 = 0.81)C = 0.4775
Michelia macclureiTrunk with barkW = 0.033232 × (D2H)0.97166 (R2 = 0.98)C = 0.5059[33,34]
BranchesW = 0.022721 × (D2H)0.84435 (R2 = 0.96)C = 0.5050
LeavesW = 0.079679 × (D2H)0.59671 (R2 = 0.96)C = 0.5077
RootsW = 0.039307 × (D2H)0.86499 (R2 = 0.96)C = 0.4232
Note: W, biomass; C, carbon; D, diameter at breast height; H, tree height.

2.6. Data Analysis

Homoscedasticity was tested using the Fligner–Killeen test, and normal distribution was tested using the Shapiro–Wilk test. After logarithmic transformation, the data for the carbon storage of trees presented a normal distribution and homoscedasticity. To test for differences in the understory aboveground biomass between treatments, an ANOVA was used. To ascertain differences within the tree, soil, litter layer, and total carbon storage, respectively, Tukey–Kramer’s HSD test was applied. All statistical tests were performed with R, version 4.2.2 (QUOTE: R Development Core Team 2022).

3. Results

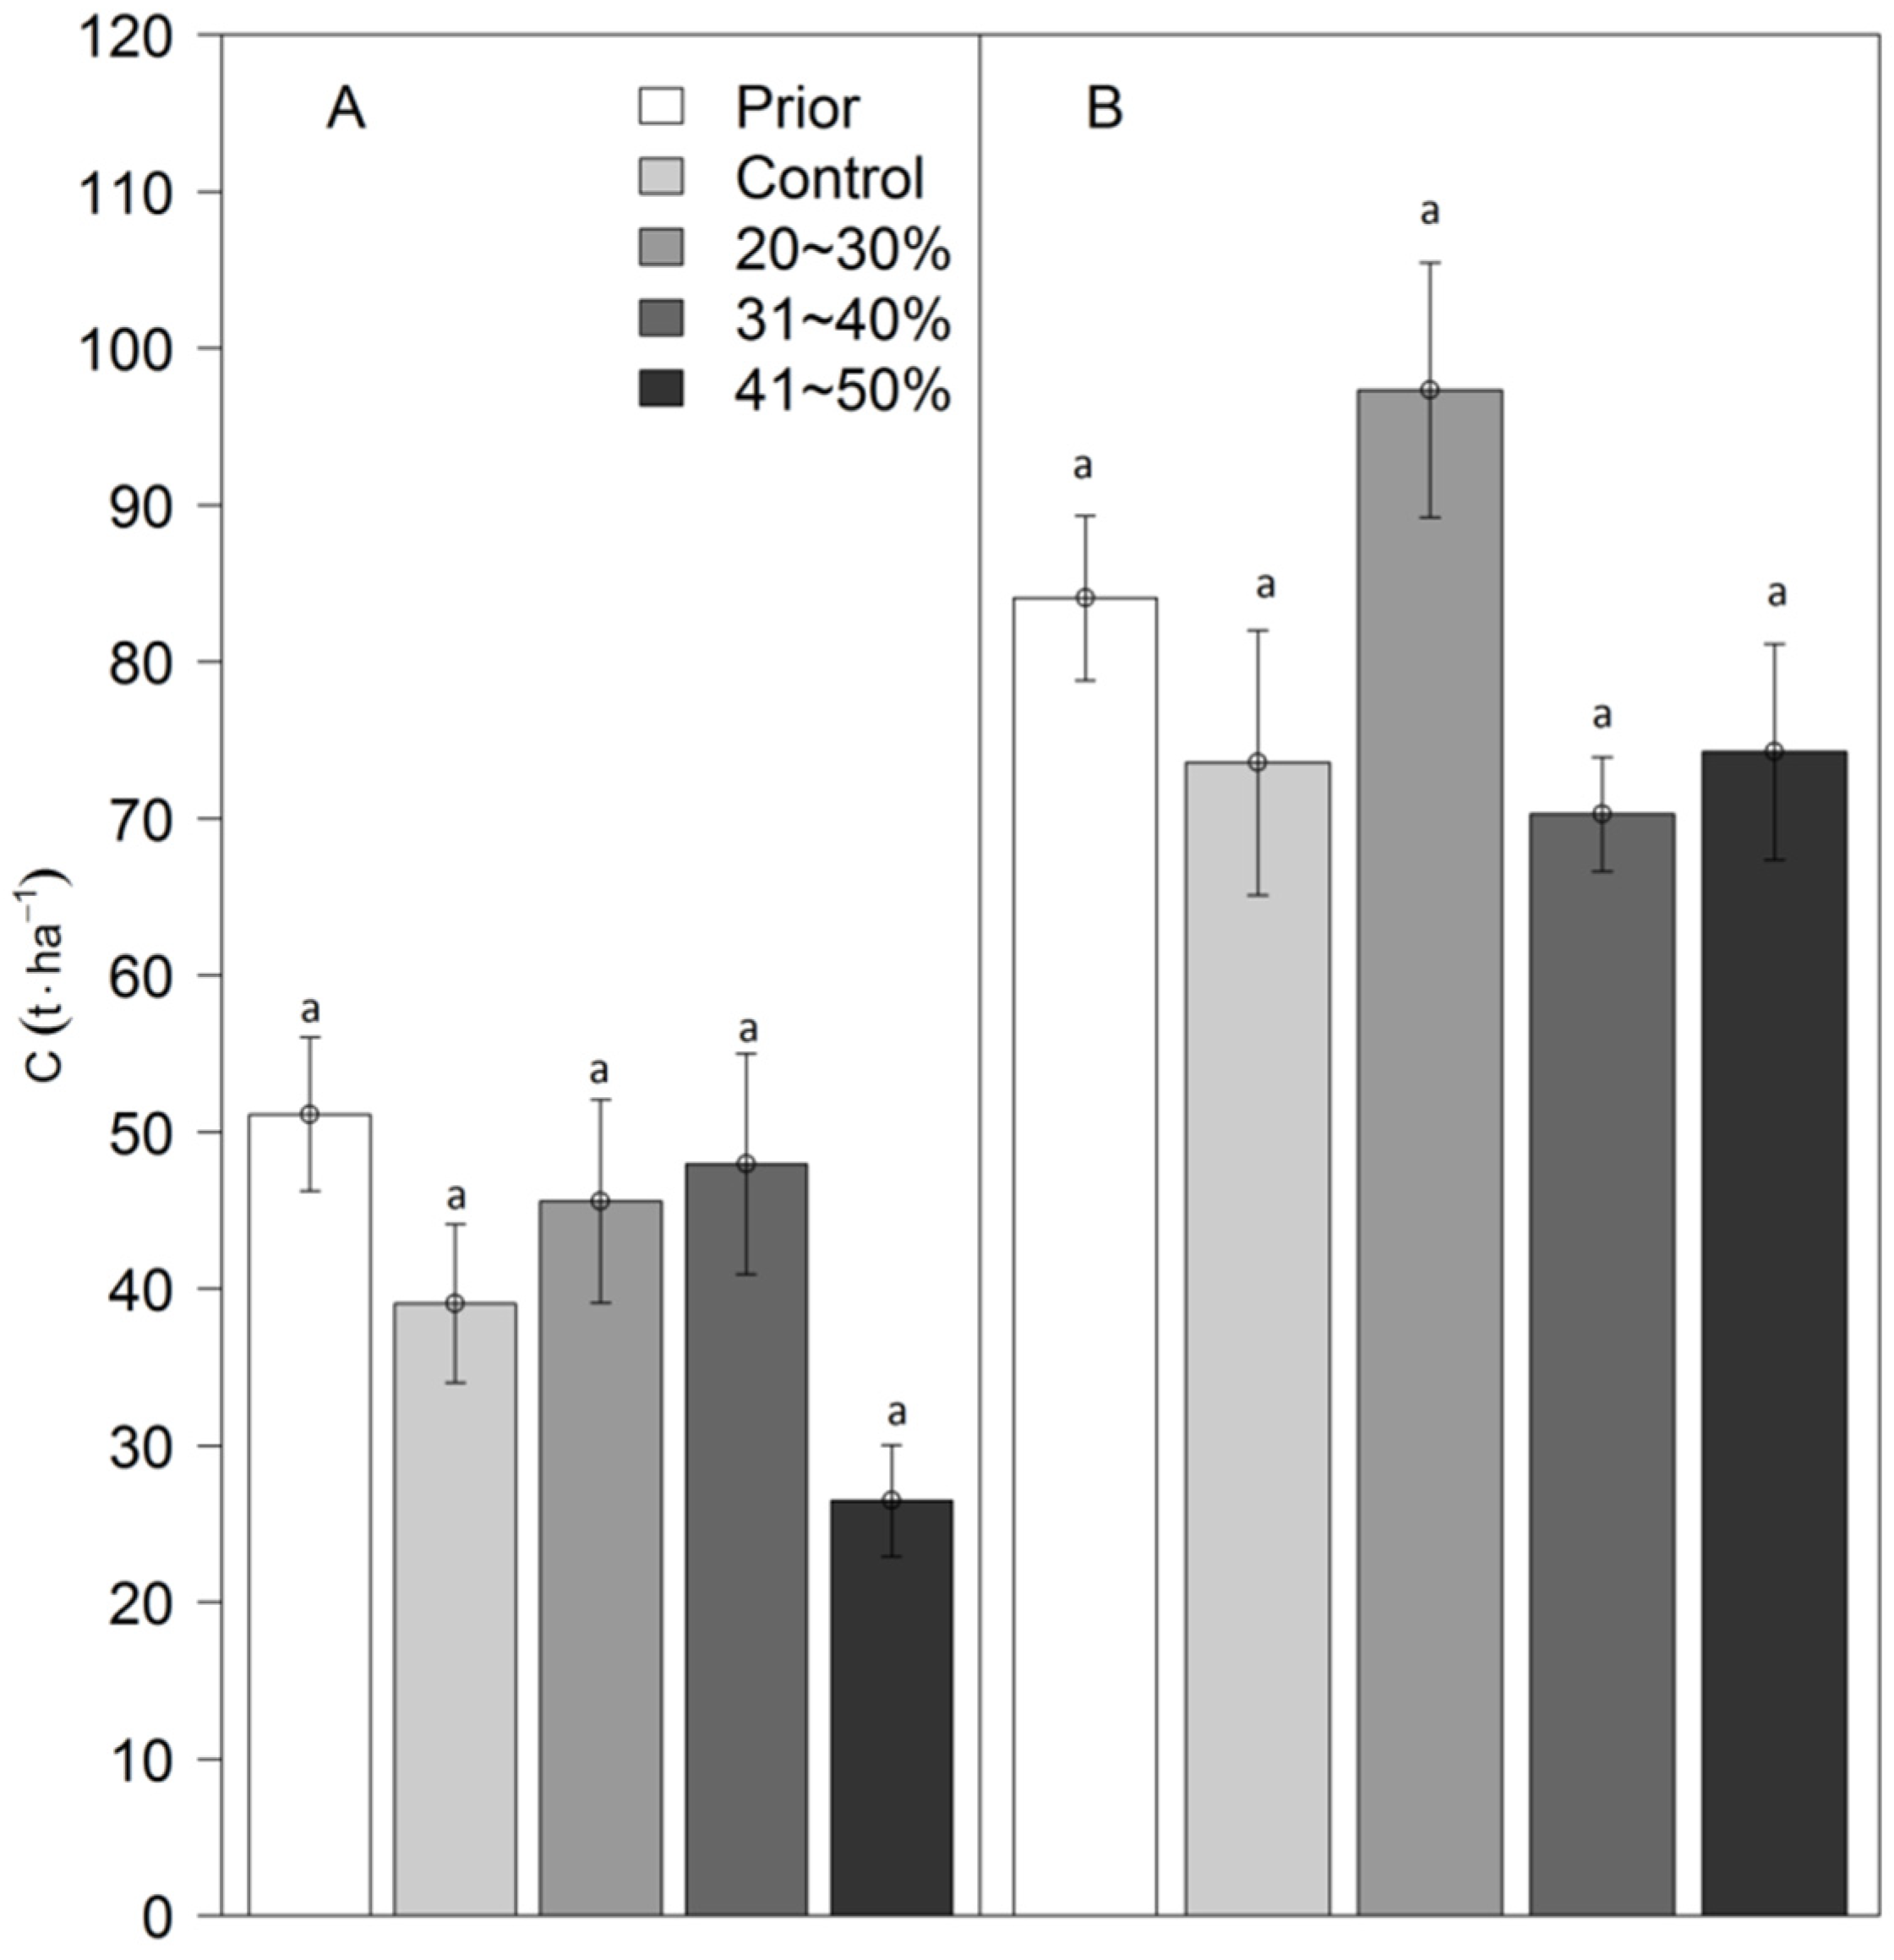
3.1. Carbon Storage in the Tree Layer

The preserved total tree biomass carbon was inconsistent with the thinning intensity (Figure 2A); the highest and lowest biomass carbon was in the control plots (21.55 ± 1.6 t·ha−1) and in the 20%~30% thinned plots (38.86 ± 4.8 t·ha−1) one year after thinning. The higher thinning intensity showed the higher total carbon growth (20%~30%, 31%~40%, and 41%~50% were 2.23 ± 0.1 t·ha−1, 2.90 ± 0.7 t·ha−1, and 5.20 ± 2.0 t·ha−1, respectively) (Figure 2B), and the higher average growth of biomass carbon (20%~30%, 31%~40%, and 41%~50% were 3.26 ± 0.7 t·ha−1, 4.52 ± 1.2 t·ha−1, and 11.84 ± 3.5 t·ha−1, respectively) (Figure 2C). A thinning intensity greater than 30% promoted the carbon biomass growth for each tree species compared with the biomass carbon in the control plots of each tree species, especially in the 31%~40% thinned plots (the increments for C. hystrix, M. macclurei, and S. superb were 1.84 t·tree−1, 0.68 t·tree−1, and 0.47 t·tree−1, respectively) (Figure 2D).

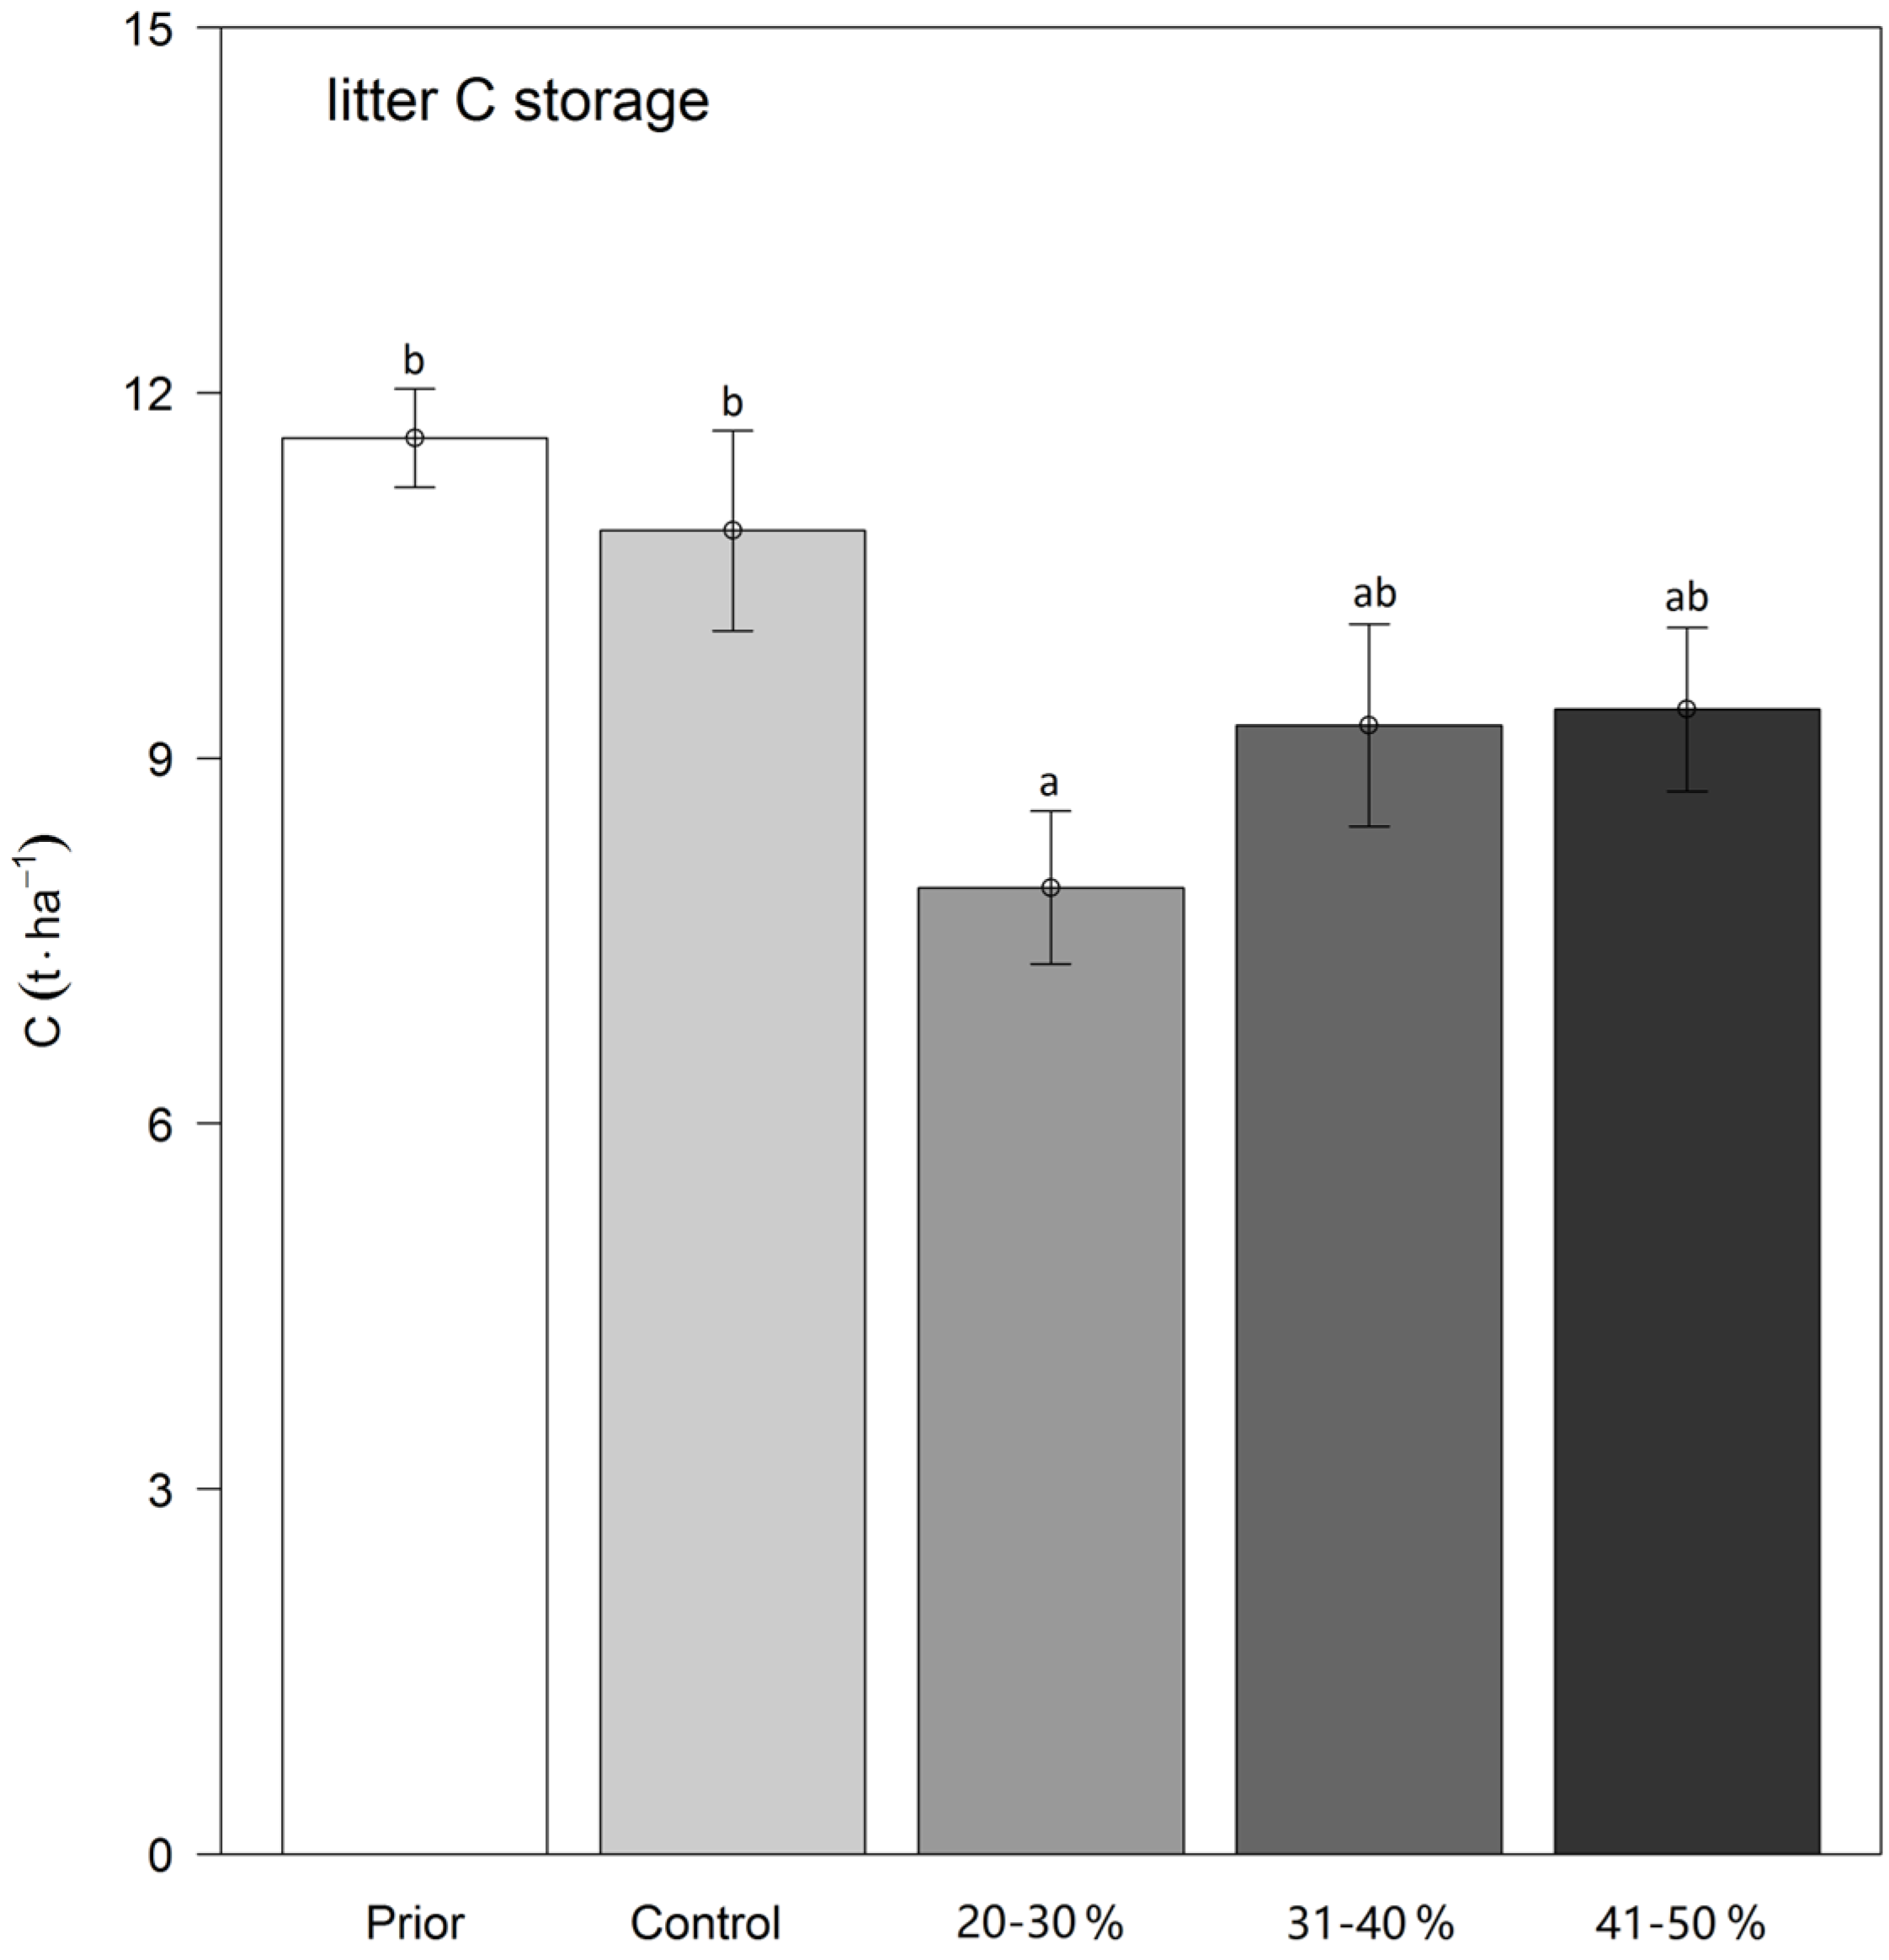
3.2. Carbon Storage in the Litter Layer

Compared with prior (before thinning), the carbon storage of the litter layer decreased in each thinned plot (Figure 3). As the intensity of thinning increased, the carbon storage decreased less, as the litter C values in 20%~30%, 31%~40%, and 41%~50% were 7.18 ± 0.53 t·ha−1, 8.52 ± 0.75 t·ha−1, and 7.92 ± 0.52 t·ha−1, respectively. The lowest carbon storage (7.18 ± 0.5 t·ha−1) of litter was in the 20%~30% thinned plots, which was consistent with the litter dry mass (17.17± 1.4 t·ha−1) (Table 3). Thinning reduced the litter mass in each plot.
As the intensity of thinning increased, the weight of the litter gradually increased as well, the litter mass in the 20%~30% thinned plots was significantly lower than in the control plots and was lower than in the 31%~40% and 41%~50% plots but nonsignificantly.

3.3. Carbon Storage in Soil

Thinning reduced the carbon storage of the humus layer to varying degrees (Figure 4A). One year after thinning, the humus layer carbon storage was increased in the 20%~30% (45.58 ± 6.47 t·ha−1) and 31%~40% (47.96 ± 7.0 t·ha−1) thinned plots but was decreased in the 41%~50% (26.47 ± 3.6 t·ha−1) thinned plots, compared to the control plots (39.06 ± 5.1 t·ha−1). And the humus layer carbon at the 31%~40% intensity was higher than that for the other three treatments, with 41%~50% exhibiting the lowest value.
The carbon storage of the 0~20 cm soil layer was increased at the 20%~30% intensity (97.34 ± 8.1 t·ha−1), compared to the prior (84.06 ± 5.3 t·ha−1) and control plots (73.56 ± 8.4 t·ha−1) (Figure 4B). However, the lowest soil carbon storage was at the 31%~40% intensity (70.27 ± 3.7 t·ha−1), which had the highest humus carbon storage (Figure 4A).

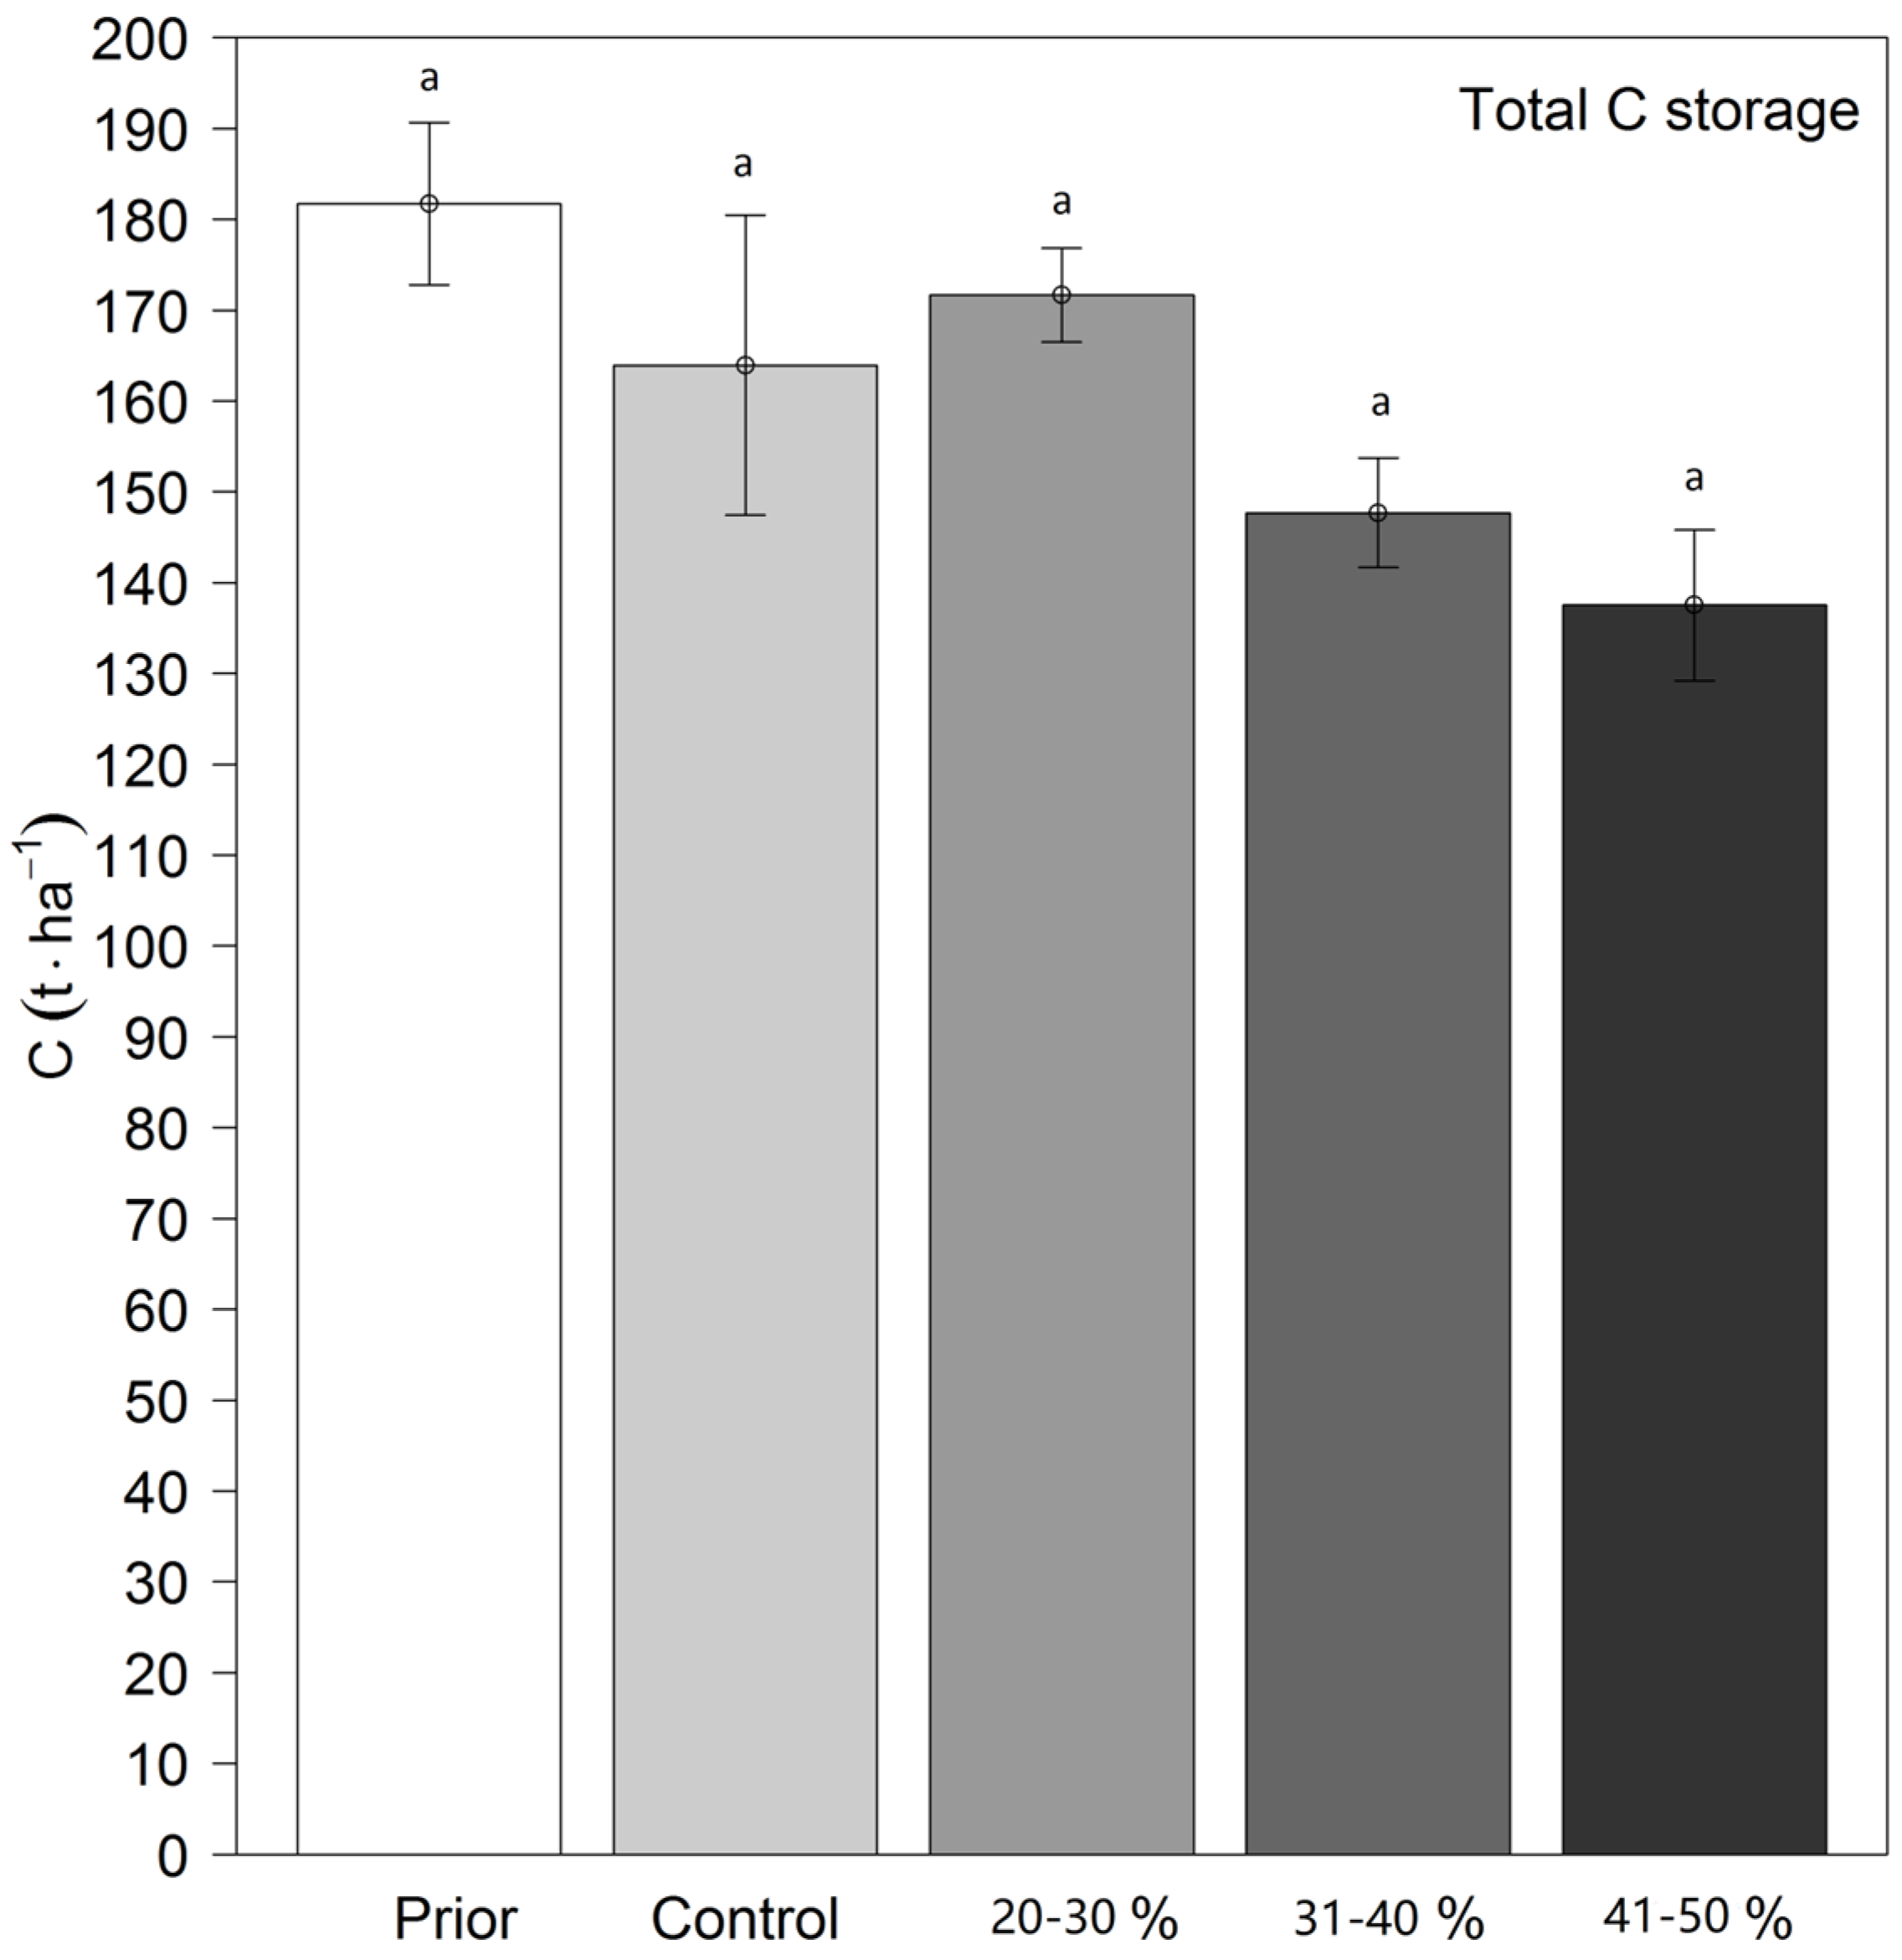
3.4. The Total Carbon Storage in the Mixed Broadleaved Plantation

The responses of total C storage to thinning intensities were different (Figure 5) but were consistent with the carbon changes in soil (Figure 4B). The total carbon was highest (171.66 ± 5.1 t·ha−1) in the 20%~30% thinned plots and lowest (137.54 ± 8.2 t·ha−1) in the 41%~50% thinned plots.
Compared to the prior values, the total C, soil C, tree biomass C, and litter C in the control plots increased one year later; the total C storage decreased in the 31%~40% and 41%~50% thinned intensity plots. In the 20%~30% thinned intensity plots, the highest C storage (171.66 ± 5.1 t·ha−1) among the 4 different treatments was observed (Figure 4; Table 4). The highest total carbon storage was found in the 20%~30% thinned plots due to the highest soil carbon storage (142.92 ± 6.7 t·ha−1), even though these plots had the lowest tree biomass C (21.55 ± 1.6 t·ha−1) and litter C (7.18 ± 0.7 t·ha−1).

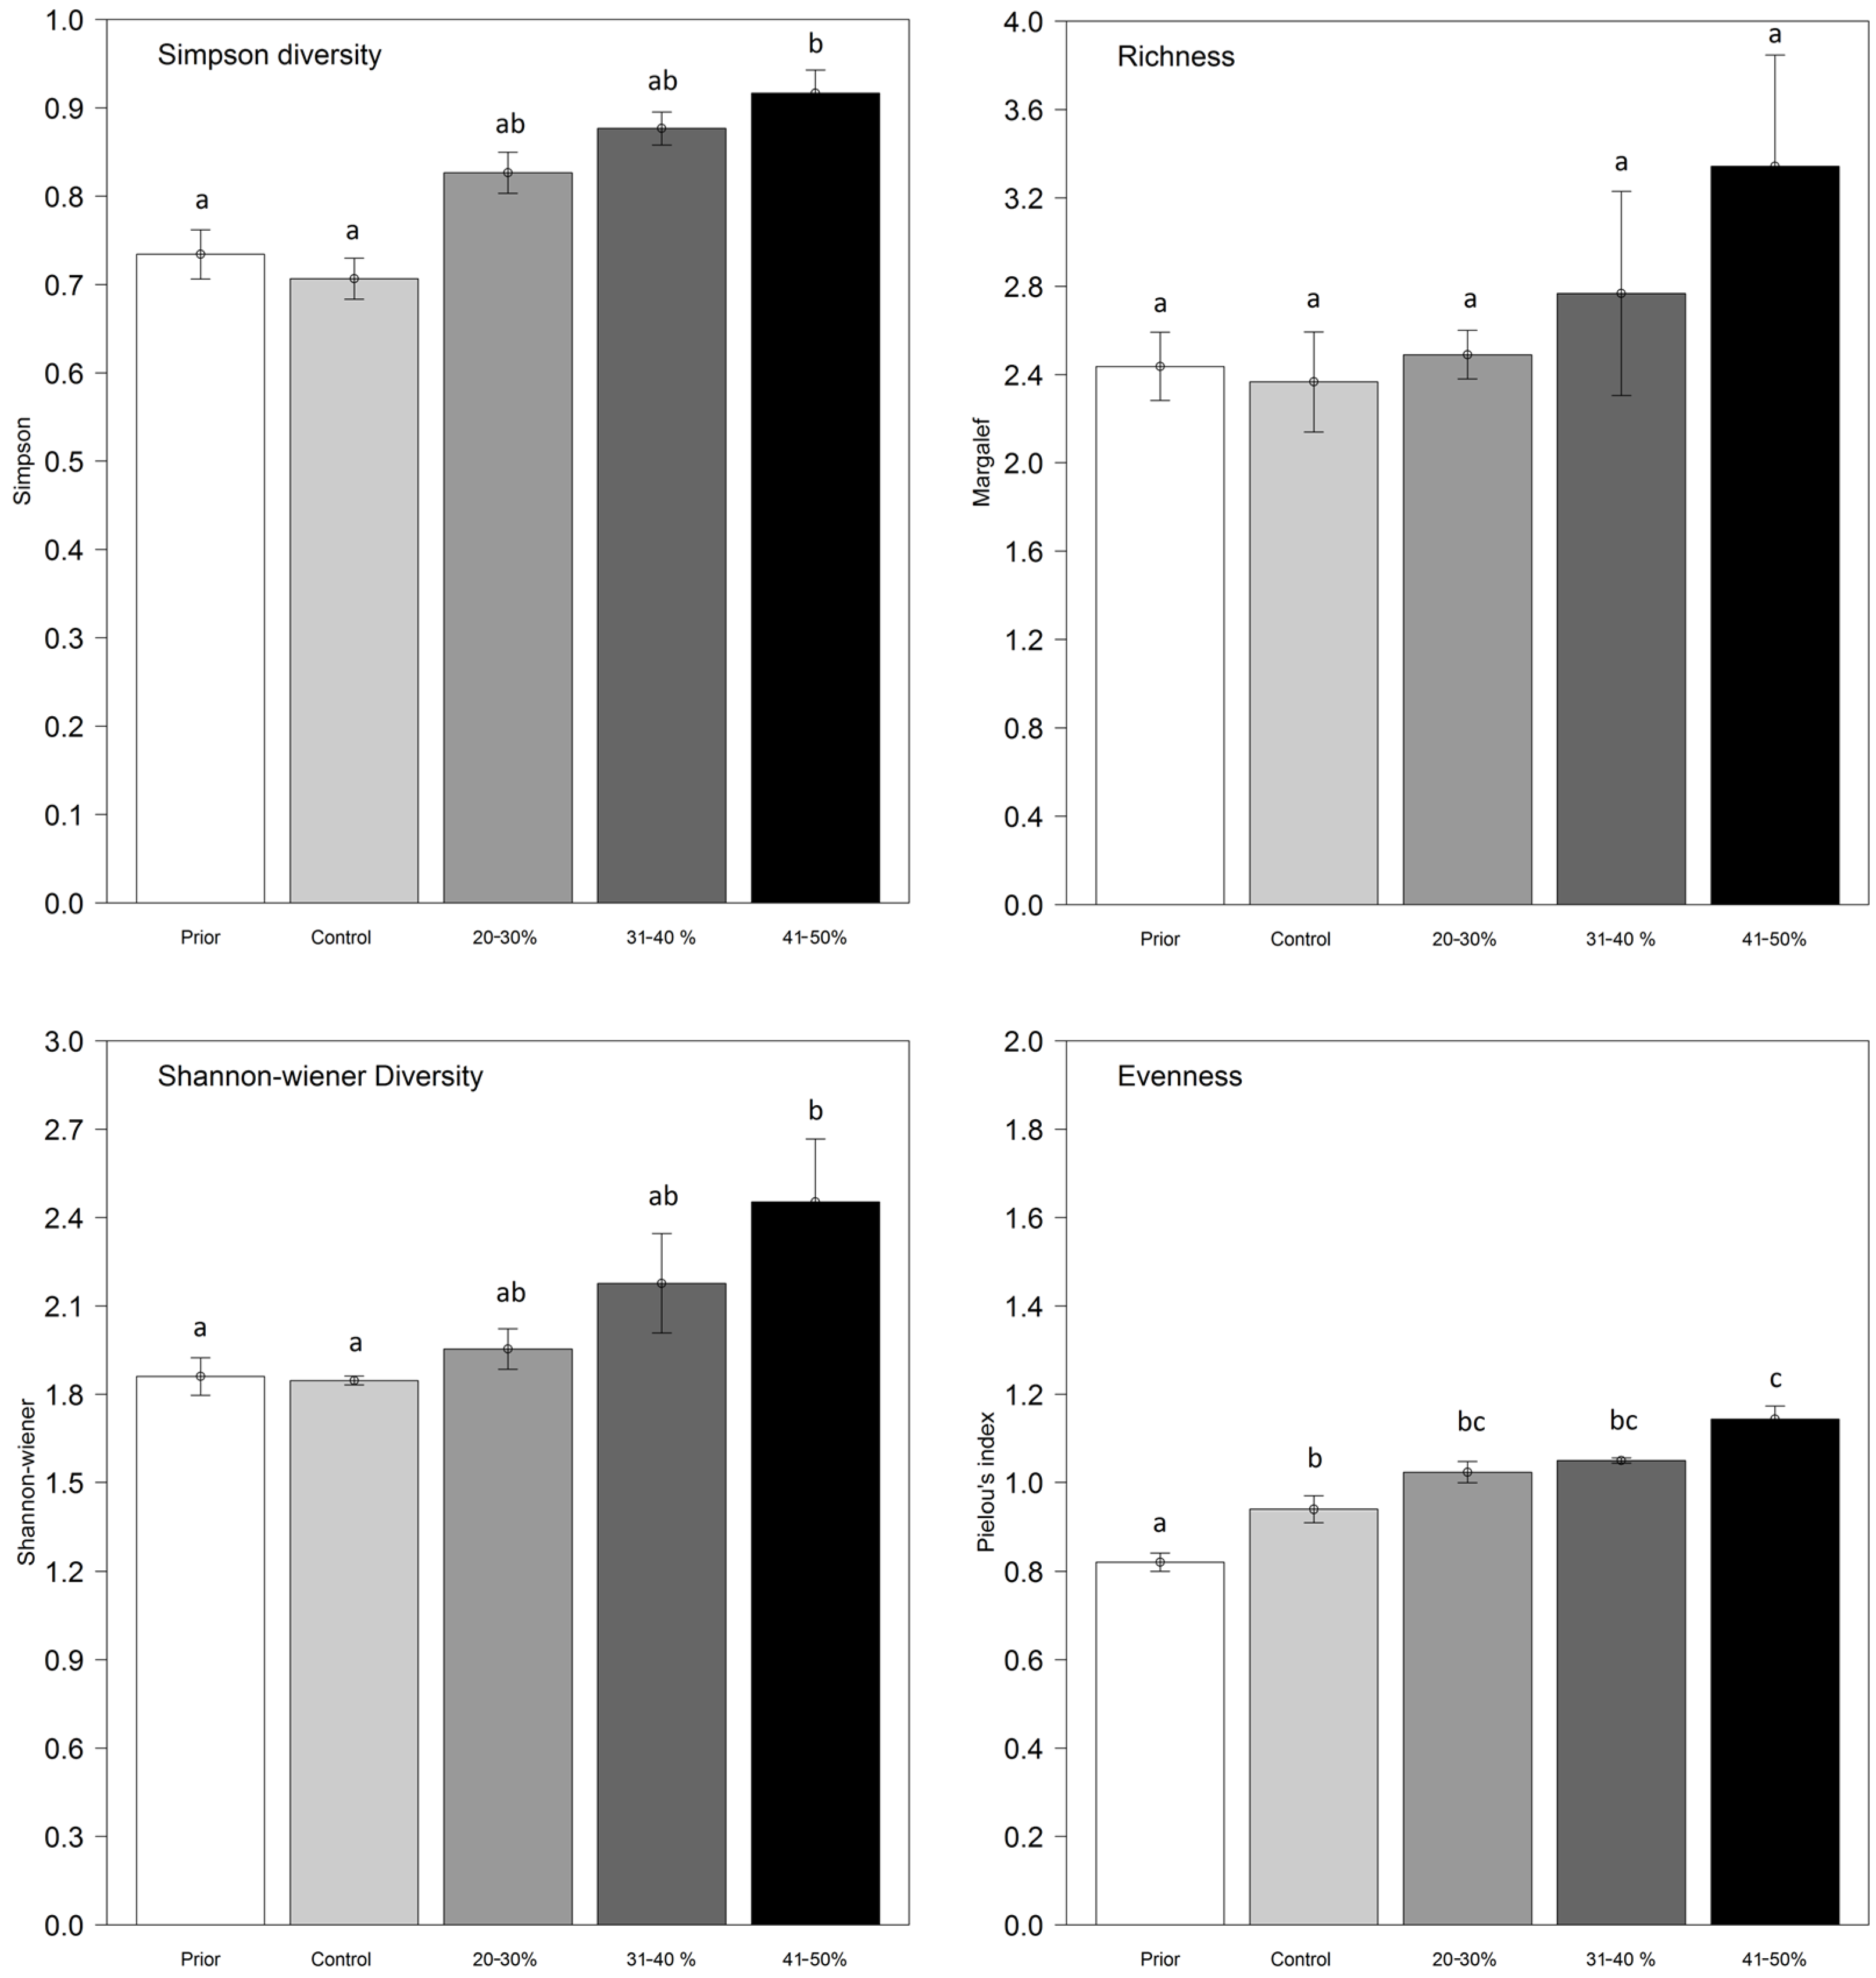
3.5. The Development of Understory Plants

Thinning promoted the development of understory plants (Figure 6). As the intensity of thinning increased, the growth of the understory vegetation improved. A higher intensity of thinning was associated with a greater diversity of understory plants. In the 41%~50% thinned plots, the Simpson diverstiy, Margalef richness, Shannon–Wiener diversity index, and Pieou’s index were the highest at 0.92 ± 0.02, 3.34 ± 0.50, 2.45 ± 0.21, and 1.14 ± 0.03, respectively. The understory plant development in the control plots was contrary with the 41%~50% plots, with the lowest Simpson diverstiy index, Margalef richness, Shannon–Wiener diversity index, and Pieou’s index (0.73 ± 0.03, 2.44 ± 0.15, 1.86 ± 0.06, and 0.82 ± 0.02).

4. Discussion

Forests sequester CO2 in the form of biomass and soil carbon. Forest C pools contain about 73% of the global vegetation carbon storage, with 44.5% of forest C stock in soil in the top meter [35]. In this study, the carbon structure was around 70% in soil, 20% in tree biomass (above- and belowground biomass), and 10% in the litter (Table 5). These values indicate that carbon was mainly stored in the tree layer and soil layer [36], accounting for over 90% of the total carbon storage in the plantation. There is a fundamental difference in their carbon structures due to different compositions of tree species. This is because forest communities–assemblages of tree species in a stand vary in their capacity to capture and store carbon [36]. The C storage in plantations of fast-growing tree species is significantly higher than that in plantations of slow-growing tree species. For example, under similar habitat conditions and management measures, the C storage in 27-year plantations of M. macclurei (359.43 t/hm2) and Mytilaria laosensis Lecomte (319.80 t/hm2) were significantly higher than in C. hystrix, Pinus massoniana Lamb., and Mesua ferrea L. plantations (225.87 t/hm2, 222.43 t/hm2, and 207.81 t/hm2) in subtropical China [37]. The 11-year-old plantation was composed of 60% S. superba, 30% C. hystrix, and 10% M. macclurei, with a higher tree biomass carbon growth for M. macclurei and S. superba and a lower carbon growth of C. hystrix (Figure 2D). One year after, the total carbon storage values, including tree layer biomass carbon, the litter layer carbon, and the soil layer carbon, were reduced in our study; however, the total carbon in the 20%~30% intensity thinned plots was less reduced in the control plots. Thinning by removing trees relieves the competition of trees, and then trees grow faster in conditions of low competition, especially fast-growing species [38]. The other possible explanations for the lower response of C. hystrix and S. superba to thinning may reside in the fact that there were more C. hystix and S. superba trees in the plots and that thinning led to a decrease in intraspecific competition for the three tree species, whereas interspecific competition was not reduced enough for the C. hystrix and S. superba trees [12]. Our study indicates that it is necessary to combine fast- and slow-growing species when planting mixed forests and to apply a moderate intensity of thinning to prevent the loss of carbon storage.
Forest management, such as tree pruning, thinning, the use of lime, fertilizer application, irrigation, and site preparation intensity, has received increasing attention due to its predictable effects on ecosystems, especially on the content of soil C. Changes in forest management practices have reportedly resulted in a significant loss of SOC over the past two centuries [39]. In our study, the total C storage in the mixed broadleaved plantation decreased, due to the losses of soil C (18.83 t·ha−1·yr−1) and litter C (2.53 t·ha−1·yr−1), even though the tree biomass C had a 3.60 t·ha−1·yr−1 increment. Due to the SOC containing more than three times the amount of organic carbon as in the overlaying vegetation [40], a slight change may affect the carbon sequestration of forest ecosystems. In 41%~50% thinned plots, the proportion of soil C (Table 5, 74.25%) decreased, even though the tree biomass C and litter C increased. That means that a higher intensity of thinning causes greater disturbance to forest soil. Forest soil is the medium in which forest plants evolve, grow, and derive their nutrients and water supply [12,41]. As a result, edaphic factors play a larger role in plant diversity [42]. In our study, the understory diversity and richness increased with the increase in thinning intensity (Figure 6), which were negatively related to the litter C (Figure 7). An increase in the species richness of plants leads to an increase in the number of available micro-niches and an increase in microbial diversity [43], further promoting the decomposition of C in the litter layer, humus layer, and soil layer. The competition for nutrients between plants and microorganisms facilitates microbial decomposition of litter in forest ecosystems [44] and more microbial residues. In the topsoil, the plant residues and microbial residues regulate the SOC storage [45].
There is an advantageous growth at low density, as commonly observed in selective or future crop tree thinning systems for individual tree size growth acceleration [46]. Competition reduction enables an increase in stand density, mass production, and climate change mitigation through higher carbon storage [47,48,49]. Thinning reduced the tree layer C (Figure 1A) by removing the trees but promoting the tree biomass C growth by relieving the competition among trees for resources (Table 6). The tree layer biomass carbon was significantly positively related to the leaf area index (LAI) and the tree layer coverage (Figure 7). In the 41%~50% thinned plots, the tree layer biomass C was higher than in the other thinned plots, due to the highest LAI (1.68 ± 0.3) and coverage (69.19 ± 4.5). The litter C was positively related to the coverage and tree layer biomass C, with the highest litter C in the 41%~50% thinned plots as well. That may be caused by the highest diversity and richness of understory plants [50], which is induced by the opening of the forest canopy and then causes more solar radiation to reach the forest floor, further stimulating understory vegetation diversity [18].

5. Conclusions

The results of this study indicated that to promote carbon sequestration, a mixed plantation should be composed of fast-growing and slow-growing tree species. The different intensities of thinning in a mixed broadleaved plantation improved the growth of reserved tree biomass carbon, promoted the diversity of understory vegetation, reduced the litter layer carbon, and reduced the total carbon in the short term. The 20%~30% thinning intensity promoted carbon sequestration, while the greater thinning intensity than 30% reduced the total carbon of the forest ecosystem. In our study, the promoting effect of thinning on growth was mainly caused by the change in the aboveground environment and soil nutrient availability, and the effect of thinning varied with the intensity of thinning. According to the research, during the reforestation process, the fast-growing and slow-growing tree species should be planted with a proper ratio to enhance carbon sequestration. In the long term, in order to promote forest ecosystem carbon storage, a higher intensity of thinning should be applied.

Author Contributions

Conceptualization S.C., methodology, S.C. and N.L.; validation, N.L. and T.M.; investigation, N.L., M.F., H.H., Z.Q., and T.M.; writing—review and editing, N.L.; supervision, S.C. and T.M. All authors have read and agreed to the published version of the manuscript.

Funding

This research was funded by Guangdong Forestry Science and Technology Innovation Project 2023KJCX001 and Natural Science Foundation of Guangdong Basic and Applied Basic Research Foundation through the research project 2021A1515011092.

Data Availability Statement

The data underlying this article will be shared upon reasonable request to the corresponding author.

Acknowledgments

The authors would like to thank all staff of the Deqing Forest Farm. We also thank the editor and reviewers for their constructive comments on the manuscript.

Conflicts of Interest

The authors declare that they have no known competing financial interests or personal relationships that could have appeared to influence the work reported in this paper.

References

  1. Huang, Y.; Chen, Y.; Castro-Izaguirre, N.; Baruffol, M.; Brezzi, M.; Lang, A.N.; Li, Y.; Haerdtle, W.; Oheimb, G.; Yang, X.; et al. Impacts of species richness on productivity in a large-scale subtropical forest experiment. Science 2018, 362, 80–83. [Google Scholar] [CrossRef] [PubMed]
  2. Zhu, Z.C.; Piao, S.L.; Myneni, R.B.; Huang, M.T.; Zeng, Z.Z.; Canadell, J.G.; Ciais, P.; Sitch, S.; Friedlingstei, P.; Arneth, A.; et al. Greening of the Earth and its drivers. Nat. Clim. Chang. 2016, 6, 791–795. [Google Scholar] [CrossRef]
  3. Tong, X.W.; Brandt, M.; Yue, Y.M.; Ciais, P.; Jepsen, M.R.; Penuelas, J.; Wigneron, J.-P.; Xiao, X.M.; Song, X.-P.; Horion, S.; et al. Forest management in southern China generates short term extensive carbon sequestration. Nat. Commun. 2020, 11, 129. [Google Scholar] [CrossRef] [PubMed]
  4. Li, X.; Wang, H.; Luan, J.W.; Chang, S.X.; Gao, B.; Wang, Y.; Liu, S.R. Functional diversity dominates positive species mixture effects on ecosystem multifunctionality in subtropical plantations. For. Ecosyst. 2022, 9, 100039. [Google Scholar] [CrossRef]
  5. Pretzsch, H.; Schutze, G. Effect of tree species mixing on the size structure, density, and yield of forest stands. Eur. J. For. Res. 2016, 135, 1–22. [Google Scholar] [CrossRef]
  6. Coll, L.; Ameztegui, A.; Collet, C.; Lof, M.; Mason, B.; Pach, M.; Verheyen, K.; Abrudan, L.; Barbati, A.; Barreiro, S.; et al. Knowledge gaps about mixed forests: What do European forest managers want to know and what answers can science provide? For. Ecol. Manag. 2018, 407, 106–115. [Google Scholar] [CrossRef]
  7. Liu, C.L.C.; Kuchma, O.; Krutovsky, K.V. Mixed-species versus monocultures in plantation forestry: Development, benefits, ecosystem services and perspectives for the future. Glob. Ecol. Conserv. 2018, 15, 13. [Google Scholar] [CrossRef]
  8. Baldocchi, D.; Penuelas, J. The physics and ecology of mining carbon dioxide from the atmosphere by ecosystems. Glob. Chang. Biol. 2019, 25, 1191–1197. [Google Scholar] [CrossRef] [PubMed]
  9. Luyssaert, S.; Marie, G.; Valade, A.; Chen, Y.Y.; Djomo, S.N.; Ryder, J.; Otto, J.; Naudts, K.; LansØ, A.S.; Ghattas, J.; et al. Trade-offs in using European forests to meet climate objectives. Nature 2018, 562, 259. [Google Scholar] [CrossRef] [PubMed]
  10. Mehrabi, Z.; Ellis, E.C.; Ramankutty, N. The challenge of feeding the world while conserving half the planet. Nat. Sustain. 2018, 1, 409. [Google Scholar] [CrossRef]
  11. Paris Agreement, FCCC/CP/2015/10/Add.1. United Nations Framework Convention on Climate Change, 2015. Available online: https://unfccc.int/process-and-meetings/the-paris-agreement (accessed on 4 November 2016).
  12. Aldea, J.; Bravo, F.; Bravo-Oviedo, A.; Ruiz-Peinada, R.; Rodríguez, F.; del Río, M. Thinning enhances the species-specific radial increment response to drought in Mediterranean pine-oak stands. Agric. For. Meteorol. 2017, 237–238, 371–383. [Google Scholar] [CrossRef]
  13. Bellassen, V.; Luyssaert, S. Carbon sequestration: Managing forests in uncertain times. Nature 2014, 506, 153–155. [Google Scholar] [CrossRef] [PubMed]
  14. Lavigne, M.B. Growth and net assimilation rates in thinned and unthinned stands of balsam fir. Can. J. For. Res. 1988, 18, 1205–1210. [Google Scholar] [CrossRef]
  15. Brix, H. Effects of thinning and nitrogen fertilization on growth of Douglasfir: Relative contribution of foliage quantity and efficiency. Can. J. For. Res. 1983, 13, 167–175. [Google Scholar] [CrossRef]
  16. Omari, K.; MacLean, D.A.; Lavigne, M.B.; Kershaw, J.A., Jr.; Adams, G.W. Effects of local stand structure on leaf area, growth, and growth efficiency following thinning of white spruce. For. Ecol. Manag. 2016, 368, 55–62. [Google Scholar] [CrossRef]
  17. Lin, N.; Deng, N.L.; Lu, D.H.; Xie, H.Y.; Feng, M.C.; Chen, S.Q. Short-term effects of thinning on tree growth and soil nutrients in the Middle-aged Chinese fir (Cunninghamia lanceolata (Lamb.) Hook.) plantations. Forests 2023, 14, 74. [Google Scholar] [CrossRef]
  18. Adamczyk, B.; Adamczyk, S.; Kukkola, M.; Tamminen, P.; Smolander, A. Logging residue harvest may decrease enzymatic activity of boreal forest soils. Soil Biol. Biochem. 2015, 82, 74–80. [Google Scholar] [CrossRef]
  19. Xu, X.; Wang, X.; Hu, Y.; Wang, P.; Saeed, S.; Sun, Y. Short-term effects of thinning on the development and communities of understory vegetation of Chinese fir plantations in Southeastern China. Peer J. 2020, 8, e8536. [Google Scholar] [CrossRef] [PubMed]
  20. Misson, L.; Tang, J.; Xu, M.; Mckay, M.; Goldstein, A. Influence of recovery from clear-cut, climate variability, and thinning on the carbon balance of a young ponderosa pine plantation. Agric. For. Meteorol. 2005, 130, 207–222. [Google Scholar] [CrossRef]
  21. Bai, S.H.; Dempsey, R.; Reverchon, F.; Blumfield, T.J.; Ryan, S.; Cernusak, L.A. Effects of forest thinning on soil-plant carbon and nitrogen dynamics. Plant Soil 2017, 411, 437–449. [Google Scholar] [CrossRef]
  22. Högberg, P. Environmental science: Nitrogen impacts on forest carbon. Nature 2007, 447, 781–782. [Google Scholar] [CrossRef] [PubMed]
  23. Xu, Z.; Chen, C.; He, J.; Liu, J. Trends and challenges in soil research 2009: Linking global climate change to local long-term forest productivity. J. Soils Sediments 2009, 9, 83–88. [Google Scholar] [CrossRef]
  24. Huang, X.M.; You, Y.M.; Lan, J.C.; Liu, S.R.; Jia, H.Y.; Zhu, H.G.; Wen, Y.G. The effects of carbon storage and its allocation in Cunninghamia lanceolata plantations with different thinning intensities. Acta Ecol. Sin. 2016, 36, 156–163. [Google Scholar]
  25. Yin, B.; Dong, P.F.; Dang, K.L. Effects of thinning on carbon density of Betula albo-sinensis ecosystem. J. Northwest Univ. 2019, 34, 105–112. [Google Scholar]
  26. Ming, A.G.; Zhang, Z.J.; Chen, H.H.; Zhang, X.Q.; Tao, L.; Su, Y. Effects of thinning on the biomass and carbon storage in Pinus massoniana plantation. Sci. Silvae Sin. 2013, 49, 1–6. [Google Scholar]
  27. Meiwes, K.J.; Khanna, P.K.; Ulrich, B. Parameters for describing soil acidification and their relevance to stability of forest ecosystems. For. Ecol. Manag. 1986, 15, 161–179. [Google Scholar] [CrossRef]
  28. Cheng, X.Q.; Han, H.R.; Kang, F.F.; Liu, K.; Song, Y.L. Short-term effects of thinning on soil respiration in a pine (Pinus tabulaeformis) plantation. Biol. Fertil. Soils 2015, 50, 357–367. [Google Scholar] [CrossRef]
  29. Frazer, G.W.; Canham, C.D.; Lertzman, K.P. Gap Light Analyzer (GLA): Imaging Software to Extract Canopy Structure and Gap Light Transmission Indices from True-Colour Fisheye Photographs, Users Manual and Program Documentation; Simon Fraser University: Burnaby, BC, Canada; Institute of Ecosystem Studies: Millbrook, NY, USA, 1999. [Google Scholar]
  30. He, X.; Lei, Y.C.; Xue, C.Q.; Xu, Q.H.; Li, H.K.; Cao, L. Carbon density uncertainty estimates for Schima superba in Guangdong Province. Sci. Silvae Sin. 2019, 55, 163–171. (In Chinese) [Google Scholar]
  31. Qin, L.; He, Y.J.; Li, Z.Y.; Shao, M.X.; Liang, X.Y.; Tan, L. Allocation pattern of biomass and productivity for three plantations of Catanopsisi hystrix, Pinus massoniana and their mixture in South subtropical area of Guangxi, China. Sci. Silvae Sin. 2011, 47, 17–21. (In Chinese) [Google Scholar]
  32. Zhao, Z. Biomass and Carbon Storage of Cunninghamia lanceolata and Castanopsis hystrix Plantations in South Subtropical China. Master’s Thesis, Guangxi University, Nanning, China, 2017. (In Chinese). [Google Scholar]
  33. Qi, Z.Y.; Ma, J.X.; Li, S.M. Studies on the biomass and productivity of artificial Michelia macclurei Var. sublancea forest. J. Ecol. 1985, 2, 17–19. (In Chinese) [Google Scholar]
  34. Liu, L.Y.; Zheng, X.Y.; Xue, L. Distribution pattern of nutrient accumulation in Michelia macclurei plantation. J. Northeast. For. Univ. 2019, 47, 25–29. (In Chinese) [Google Scholar]
  35. Pan, Y.D.; Birdsey, R.A.; Fang, J.Y.; Houghton, R.; Kauppi, P.; Kurz, W.A.; Phillips, O.L.; Shvidenko, A.; Lewis, S.L.; Canadell, J.G.; et al. A large and persistent carbon sink in the world’s forests. Science 2011, 333, 988–993. [Google Scholar] [CrossRef]
  36. Knott, J.; Domke, G.; Woodall, C.; Walters, B.; Jenkins, M.; Fei, S.L. Shifting forests and carbon: Linking community composition and aboveground carbon attributes. Ecosystems 2023, 26, 412–427. [Google Scholar] [CrossRef]
  37. Zheng, L.; Cai, D.X.; Lu, L.H.; Ming, A.G.; Li, Z.Y. Carbon pool of different species plantation ecosystems in lower subtropical area of China. J. Cent. South Univ. For. Technol. 2014, 34, 110–116. (In Chinese) [Google Scholar]
  38. Canadell, J.G.; Raupach, M.R. Managing forests for climate change mitigation. Science 2008, 320, 1456–1457. [Google Scholar] [CrossRef] [PubMed]
  39. Georgiou, K.; Jackson, R.B.; Vindušková, O.; Abramoff, R.Z.; Ahlström, A.; Feng, W.T.; Harden, J.W.; Pellegrini, A.F.A.; Polley, H.W.; Soong, J.L.; et al. Global stocks and capacity of mineral-associated soil organic carbon. Nat. Commun. 2022, 13, 1797. [Google Scholar] [CrossRef] [PubMed]
  40. Lal, R.; Monger, C.; Nave, L.; Smith, P. The role of soil in regulation of climate. Philos. Trans. R. Soc. B Biol. Sci. 2021, 376, 20210084. [Google Scholar] [CrossRef] [PubMed]
  41. Hulshof, C.M.; Spasojevic, M.J. The edaphic control of plant diversity. Glob. Ecol. Biogeogr. 2019, 29, 1634–1650. [Google Scholar] [CrossRef]
  42. Rajakaruna, N.; Whitton, J. Trends in the evolution of edaphicspecialists with an example of parallel evolution in the Lastheniacalifornica complex. In Plant Adaptation Molecular Genetics and Ecology; Cronk, Q.C.B., Whitton, J., Ree, R.H., Taylor, I.E.P., Eds.; NRC Research Press: Ottawa, ON, Canada, 2004; pp. 103–110. [Google Scholar]
  43. Zverev, A.; Kichko, A.; Shapkin, V.; Pinaev, A.; Provorov, N.; Andronov, E. Does plant diversity determine the diversity of the rhizosphere microbial community? bioRxiv 2021. [Google Scholar] [CrossRef]
  44. Mori, A.S.; Isbell, F.; Seidl, R. β-diversity, community assembly, and ecosystem functioning. Trends Ecol. Evol. 2018, 33, 549–564. [Google Scholar] [CrossRef] [PubMed]
  45. Jia, Y.F.; Zhai, G.Q.; Zhu, S.S.; Liu, X.J.; Schmid, B.; Wang, Z.H.; Ma, K.P.; Feng, X.J. Plant and microbial pathways driving plant diversity effects on soil carbon accumulation in subtropical forest. Soil Biol. Biochem. 2021, 161, 108375. [Google Scholar] [CrossRef]
  46. Schober, R. Von der Niederdurchforstung zu Auslesedurchforstungen imHerrschenden. AFJZ 1988, 159, 208–213. [Google Scholar]
  47. Zeller, L.; Caicoya, A.T.; Pretzsch, H. The effect of silvicultural management on the trade-off between stand structural heterogeneity and productivity over time. Eur. J. For. Res. 2021, 140, 615–634. [Google Scholar] [CrossRef]
  48. de Prado, D.R.; San Martín, R.; Bravo, F.; de Aza, C.H. Potential climatic influence on maximum stand carrying capacity for 15 Mediterranean coniferous and broadleaf species. For. Ecol. Manag. 2020, 460, 117824. [Google Scholar] [CrossRef]
  49. Pretzsch, H. Facilitation and competition reduction in tree species mixtures in Central Europe: Consequences for growth modeling and forest management. Ecol. Model. 2022, 464, 109812. [Google Scholar] [CrossRef]
  50. Huang, K.; Xia, J.Y.; Wang, Y.P.; Ahlström, A.; Chen, J.Q.; Cook, R.B.; Cui, E.Q.; Fang, Y.Y.; Fisher, J.B.; Huntzinger, D.N.; et al. Enhanced peak growth of global vegetation and its key mechanisms. Nat. Ecol. Evol. 2018, 2, 1897. [Google Scholar] [CrossRef] [PubMed]
Figure 1. The location of the study area in Guangdong Province in China.
Forests 15 00638 g001
Figure 2. (A): Total tree biomass carbon of different treatments included root biomass carbon and aboveground biomass carbon; “Prior” means tree biomass carbon before thinning; “After” means tree biomass carbon after removing the thinned trees; “Thinned” means tree biomass carbon one year after thinning; the different lowercase letters mean the differences in tree biomass carbon among Prior and different thinning intensities of After; the different uppercase letters mean the differences in tree biomass carbon among Prior and different thinning intensities of Thinned. (B): Total tree biomass carbon growth; different lowercase letters mean the differences in total carbon growth among the different treatments. (C): Average total biomass carbon growth of each tree; different lowercase letters mean the differences in tree carbon growth among different treatments. (D): Growth of biomass carbon of each tree species; different lowercase letters mean the different carbon growth of different tree species within the same treatment; different uppercase letters mean the different carbon growth of the same tree species among different treatments. Note: figures (C,D) share the same scale of the y-axis.
Forests 15 00638 g002
Figure 3. The litter C storage among different thinned intensities. Note: Different lowercase letters mean significant differences in the litter C among different treatments.
Forests 15 00638 g003
Figure 4. The carbon storage of the humus layer (A) and in 0~20 cm depth soil (B); dynamics among different thinning intensities. Note: Different lowercase letters mean significant differences in humus layer and soil carbon storage among different treatments.
Forests 15 00638 g004
Figure 5. The total carbon storage among different thinned intensities. Note: Different lowercase letters mean significant differences in litter C in the litterfall among different treatments.
Forests 15 00638 g005
Figure 6. The changes in the understory plant values for the Simpson diversity, Maralef richness, Shannon–Wiener diversity, and Pielou’s evenness after thinning. Different lowercase letters mean significant differences between prior and thinned intensities.
Forests 15 00638 g006
Figure 7. Correlations of all measured elements of different treatments. The blank squares are no significant coefficient. “Simp.”: Simpson index; “Marg.”: Margalef’s richness; “Shann.”: Shannon–Wiener diversity index; “Cover.”: Coverage of the tree layer; “LAI”: Leaf area index; “Li.C”: Litter layer carbon; “Ph”: pH of the soil; “Tr.C”: Tree layer carbon; ‘‘To.C”: Total carbon; “So.C”: Soil Carbon; “Piel”: Pielou’s evenness.
Forests 15 00638 g007
Table 1. Characteristics of study plots in 2021.
PlotGeneral InformationPriorAfter Thinning
Altitude
(m)
Slope
(°)
Soil Depth (cm)Density
(Tree/hm2)
Canopy Density (%)Diameter at Breast Height
(cm)
Height
(m)
Volume
(m3/hm2)
Density
(Tree/hm2)
Canopy Density (%)Diameter at Breast Height
(cm)
Height (m)Volume (m3/hm2)
16124801570789.79.556.771570789.79.555.77
24628701591819.78.761.771591819.78.762.77
36021701588838.57.256.371588838.57.256.37
44926601576839.27.758.851016569.3845.29
54425701584789.59.655.681196579.69.646.39
659168015938210.29.459.9113685710.39.343.79
772256015628510.28.163.1610444810.2840.22
84628801628768.68.556.231012588.68.638.14
97322801589818.68.254.4910045598.638.59
1055358015688510.39.353.538464410.39.233.68
116124801570788.77.460.868804398.334.22
124820601577778.37.860.18878448.58.729.98
Table 3. The litter dry mass (±standard error) in the mixed broadleaf plantation among different thinned intensities.
Prior (t·ha−1)Thinned (t·ha−1)
control24.87 ± 1.7 aA24.24 ± 1.7 bA
20%~30%23.53 ± 0.7 aA17.17 ± 1.4 aA
31%~40%25.96 ± 1.4 aA20.02 ± 1.7 abA
41%~50%27.87 ± 1.2 aB20.69 ± 1.9 abA
Note: Different lowercase letters mean significant differences among different Prior (before thinning) or Thinned (one year after thinning) treatments; different uppercase letters mean significant differences between Prior and Thinned in the same treatment plots.
Table 4. The average carbon storage (± standard error) in the different layers in the mixed broadleaf plantation among different thinned intensities.
TreatmentTotal C(t·ha−1)Soil C(t·ha−1)Tree C (t·ha−1)Litter C(t·ha−1)
PriorThinnedPriorThinnedPriorThinnedPriorThinned
Control159.24 ± 10.5 aA163.95 ± 16.5 aA113.72 ± 12.1 aA115.98 ± 13.6 aA34.38 ± 3.8 aA38.86 ± 4.8 aA11.15 ± 1.7 aA9.10 ± 1.3 aA
20%~30%163.65 ± 3.8 aA171.66 ± 5.1 aA124.00 ± 4.2 aA142.92 ± 6.7 aA28.77 ± 1.5 aA21.55 ± 1.6 aA10.88 ± 0.7 aA7.18 ± 0.7 aA
31%~40%189.89 ± 21.5 aA147.69 ± 6.0 aA142.30 ± 13.9 aA115.71 ± 9.8 aA35.58 ± 6.2 aA23.44 ± 2.8 aA12.01 ± 1.4 aA8.54 ± 1.3 aA
41%~50%214.02 ± 14.3 aB137.54 ± 8.2 aA159.24 ± 19.1 aA102.11 ± 6.3 aA42.30 ± 4.5 aA27.40 ± 3.7 aA12.47 ± 0.8 aA8.02 ± 0.7 aA
Note: Different lowercase letters mean significant differences between prior and thinned of the same treatment. Different uppercase letters mean significant differences among the 4 treatments of “Prior” or “Thinned”.
Table 5. The carbon composition (%) in the mixed broadleaf plantation.
Tree Biomass CLitter CSoil C
Prior19.416.4074.19
Control23.705.5570.75
20%~30%12.554.1883.27
21%~40%15.875.7878.35
41%~50%19.925.8374.25
Table 6. The soil pH, forest coverage (%), and LAI in the mixed broadleaf plantation among different thinning intensities.
TreatmentpHCoverage (%)LAI
Prior4.12 ± 0.1 b70.61 ± 2.8 ab1.68 ± 0.1 a
Control3.99 ± 0.1 ab79.19 ± 3.0 b2.22 ± 0.2 a
20%~30%3.84 ± 0.0 a61.39 ± 6.4 ab1.13 ± 0.2 a
21%~40%3.85 ± 0.1 a52.63 ± 10.8 a1.13 ± 0.4 a
41%~50%3.98 ± 0.10 ab69.19 ± 4.5 ab1.68 ± 0.3 a
Note: Different lowercase letters mean significant differences between prior and thinning intensities.
Disclaimer/Publisher’s Note: The statements, opinions and data contained in all publications are solely those of the individual author(s) and contributor(s) and not of MDPI and/or the editor(s). MDPI and/or the editor(s) disclaim responsibility for any injury to people or property resulting from any ideas, methods, instructions or products referred to in the content.

