Article

Soil Environments Regulate Dominant Soil Fungal Communities along an Elevational Gradient in Subtropical Forests

1
College of Forestry, Fujian Agriculture and Forestry University, Fuzhou 350002, China
2
College of Finance, Fujian Business University, Fuzhou 350012, China
3
Daiyun Mountain National Nature Reserve, Quanzhou 362500, China
*
Authors to whom correspondence should be addressed.
These authors contributed equally to this work.
Forests 2024, 15(4), 643; https://doi.org/10.3390/f15040643
Submission received: 26 January 2024 / Revised: 3 March 2024 / Accepted: 21 March 2024 / Published: 1 April 2024

Abstract

:
Soil fungal communities play a critical role in the promotion of nutrient cycling and the stabilization of ecosystem functions in subtropical forests. Yet, clarifying the relationships between soil fungal diversity and microclimate variability along an elevational gradient, as well as understanding the driving mechanisms of their variations in subtropical forests, remains insufficiently understood. In this study, we recorded the composition and soil fungal diversity along an elevational gradient in Daiyun Mountain of China, aiming to elucidate the primary factors influencing the structure of the dominant soil fungal along an elevational gradient in subtropical forests. The results showed that (1) the dominant phylum of soil fungi at different elevations were Basidiomycota, Ascomycota (relative abundance > 10%) and Zygomycota (relative abundance > 1%). The Simpson index of soil fungi showed a clear upward trend along the elevational gradient, while no significant difference was observed in the other indices, and both overall reached their maximum value at the elevation of 1200 m. (2) The mean annual soil temperature and moisture, soil pH and available phosphorus were the main factors driving the dominant soil fungal along the elevational gradient. (3) Co–occurrence network analyses revealed a distinct modular structure of dominant soil fungal communities at different elevations, with Ascomycetes identified as the key taxa in fungi network relationships. Our research holds ecological significance in understanding the pivotal role of soil environmental factors in shaping the complex composition and interactions within soil fungal communities.

1. Introduction

Soil microorganisms play a pivotal role in subtropical forest ecosystems and the regulation of biochemical cycles [1,2]. The soil fungal community, a crucial component of soil microorganisms, exhibits sensitivity to environmental changes [3], and their structures and functions react to changes in environmental conditions quickly [2,3,4]. Similarly, climate change, especially near-surface microclimate conditions, significantly influences, further affecting forest ecosystem functions [4]. Therefore, exploring the adaptation strategies of soil fungi to environmental changes can help to understand the processes of soil fungal diversity generation and maintenance in subtropical forest ecosystems [5].
Elevational gradients significantly influence the microclimate variations in montane forests, providing an optimal experimental platform for studying the structure and diversity of soil fungal communities [6]. These gradients induce pronounced changes in the microclimate over relatively short spatial distances, particularly influencing the temperature and soil moisture content [7,8,9]. Thus, this can indirectly affect soil physical and chemical properties, which in turn affects the structure of the soil fungal community [10,11]. However, there is considerable variation and uncertainty in the patterns observed within soil fungal communities [12,13,14]. Furthermore, the precise effects of actual climate change along elevational gradients on soil microbial communities remain unclear. This limits our understanding the ecological roles of fungal communities in forest ecosystem [15].
The subtropical forests of China are known for their high biodiversity and complex community structures. These factors, combined with the typical mountain climate, provide a unique opportunity to study the variation in forest soil microorganisms. Some studies indicated that elevational gradients cause environmental heterogeneity in subtropical forests, thus affect the composition of aboveground and underground communities [4,11,16,17]. Daiyun Mountain National Nature Reserve, characterized by its subtropical forest ecosystem, exhibits diverse vegetation types along the elevational gradient. This provides an optimal environment for investigating the soil microbial community along various elevations [16]. Jiang et al. found that environmental heterogeneity, particularly in terms of air temperature and slope, was the main factor driving the changes in the plant community in Daiyun Mountain [17]. He et al. demonstrated the changes in elevations and seasons affect soil properties, influencing the soil microbial nutrient cycle and, consequently, the functional diversity of soil microbial community [18]. Chen et al. illuminated the assembly mechanisms of the soil microbial community along an elevational gradient in subtropical forests [19]. On a local scale, homogeneous ecological processes predominantly influence microbial community assembly. Soil available phosphorus moderates the relative significance of homogeneous selection and homogeneous dispersal in soil bacterial and fungal community assembly [19]. Nevertheless, the comprehension of the dominant soil fungal community along an elevational gradient in Daiyun Mountain remains limited. Our objective is to elucidate the primary driving factors influencing the variations in soil fungal communities. Thus, we hypothesized: (i) based on previous studies indicating a moderately humped pattern of plant diversity along the elevational gradient of 1200–1300 m [18,19], we predict that soil fungal diversity would show a similar moderate expansion pattern across this elevation range. (ii) Soil temperature and available phosphorus have been shown to change with elevation. Therefore, we predict that differences in soil fungal communities along an elevational gradient are primarily driven by changes in soil temperature and available phosphorus.

2. Materials and Methods

2.1. Study Location

Daiyun Mountain National Nature Reserve (25°38′07″–25°43′40″ N, 118°05′22″–118°20′15″ E) is located in Quanzhou City, Fujian Province, China, and covers an area of 13,473 ha. The elevation ranges from 650 to 1856 m, with precipitation ranging from 1700 to 2000 mm, and relative humidity is consistently above 80%. The nature reserve stands out with a forest coverage rate of 93.4% [19]. It is home for many ancient plants, serves as a focal point for natural biodiversity, and ranks as one of the largest plant repositories in Fujian Province [20,21].

2.2. Sample Plot Setting

In July 2018, we carefully selected a region with relatively consistent conditions and minimal anthropogenic disturbances in the southern slope of Daiyun Mountain to establish sample plots. Following the Center for Tropical Forest Science standard [18,19], seven permanent sample plots were established along an elevation range of 900–1500 m (Table S3), with intervals of 100 m. Three standard plots of 10 m × 20 m were set up at each elevation gradient. Soil samples were collected from each standard plot using the five-point sampling method. Topographic factors, comprising the longitude, latitude, and elevation for each quadrat, were documented using a GPS positioning system (Table S1). We surveyed the specific vegetation information within the sample plots. Dominant tree species including Cyclobalanopsis glauca, Cunninghamia lanceolata, Machilus thunbergii, Eurya rubiginosa var. attenuata, Pinus taiwanensis and Rhododendron simsii in this forest (Tables S1 and S3).

2.3. Microenvironment Detection

We utilized Temperature-Moisture Sensor (TMS) devices to capture air temperatures and soil moisture at three depths (surface soil, 6 cm depth below the surface soil, 12 cm depth below the surface soil) in each plot [4,22]. A single TMS recorder was deployed at each elevation, continuously recording soil and air temperatures, as well as soil moisture, at 15 min intervals starting from midnight daily. Climatic data were collected over one year, and the average values were determined as the final data for air and soil temperature and soil moisture at each elevation. In this study, microclimate parameters such as the minimum soil temperature (soilTempMin), mean annual soil moisture (MAMsoil), mean annual soil temperature (MATsoil) and mean annual air temperature (MATair) were calculated for each elevation.

2.4. Soil Sample Collection

In July 2018, soil sampling was collected along the seven elevations. For soil samples, 5 cores (0–20 cm depth) were collected from each plot, mixed thoroughly to remove plants and roots, and homogenized to make one representative sample for each plot for a total of 21 soil samples. The amalgamated soil samples were then carefully packed into sterile sealed bags, placed in iceboxes, and promptly transported to the laboratory. Following the sieving of fresh soil samples through a 2 mm mesh sieve, the samples were subsequently partitioned into two subplots [19,23]. The one subplot experienced natural drying (10–18 °C) for the measurement of soil physical and chemical properties. The other subplot designated for soil DNA sequence analysis was stored at −20 °C.

2.5. Soil Samples Measurement

2.5.1. Determination of Soil Physical and Chemical Properties

The methods for determining the soil physical and chemical properties were as follows: the soil pH value was measured using a pH meter (water-soil ratio 2.5:1); the soil water content (%, SWC) was calculated based on the sample weight before and after drying; hydrolysable nitrogen (HN) content was assessed using the alkaline hydrolysis diffusion method; soil available phosphorus (AP) content was quantified using the molybdenum antimony colorimetric method; total phosphorus (TP) and total potassium (TK) contents were determined via the sulfuric acid-perchloric acid digestion method (PEOPTIMA 8000, PerkinElmer, Waltham, MA, USA); and soil total carbon (TC) and total nitrogen (TN) contents were analyzed using a carbon and nitrogen analyzer (Vario MAX cube CN, Elementar Analysis system GmbH, Langenselbold, Germany). For detailed determination methods, refer to the ‘forest soil analysis method’ [24].

2.5.2. DNA Extraction, Sequencing and Bioinformatics Analysis

The BioFast Soil Genomic DNA Extraction Kit from BioFlux (Hangzhou Bioer Technology Co., Ltd., Hangzhou, China) was employed for total DNA extraction, with each sample subjected to three extraction cycles. The resulting soil microorganism DNA underwent an assessment through 1% agarose gel electrophoresis, and the DNA concentration was quantified using a NanoDrop 2000C spectrophotometer (Thermo Scientific, Waltham, MA, USA). DNA was purified and recovered by the TIANGEN gel recovery kit (TianGen Biotech (Beijing) Co., Ltd., Beijing, China) and stored at −20 °C in a refrigerator. The soil fungi ITS1 F (primer sequence: 5′-CTTGGTCATTTAGAGGAAGTAA-3′) and ITS2 (primer sequence: 5′-GCTGCGTTCTTCATCGATGC-3′) ITS1 regions were amplified by PCR. The amplification procedures were as follows: pre-denaturation at 95 °C for 5 min, denaturation at 95 °C for 30 s, annealing at 57 °C for 30 s, extension at 72 °C for 40 s, a total of 35 cycles, and extension at 72 °C for 7 min. The PCR amplification reaction system was 50 μL:1 μL of Q5 High-Fidelity DNA Polymerase, 1 μL of dNTPs (10 mmol/L), 1.5 μL of the ITS1 F primer, 1.5 μL of the ITS1 primer, and 2 μL of the DNA template supplemented with ddH2O. According to the concentration of PCR products, the PCR products were detected by agarose gel electrophoresis with the concentration of 18 g/L, and the target bands were recovered by a DNA gel recovery kit (Sangon Biotech (Shanghai) Co., Ltd., Shanghai, China). At the same time, the library was constructed. Following the qualification of the library using the Illumina HiSeq PE250 sequencing platform, a small fragment library was constructed through single-end sequencing.

2.6. Data Analysis

Soil fungal sequence numbers showed variation across soil samples. The minimum sequence number was extracted from each sample at different elevations on the southern slope of Daiyun Mountain. The normality of the data was assessed using the Shapiro-Wilk test and normalization was conducted prior to the correlation analysis [25]. The rarefaction curve was used to check if the sequencing depth was sufficient. A certain number of OTU sequences were randomly drawn from the sample, and then the soil fungal taxa represented by these OTU sequences were counted to construct the curve. When the rarefaction curves of seven soil samples at different elevations tended to be flat, and the coverage of sequencing soil fungi was more significant than 0.99, it showed that sequencing data were reasonable and could reflect the soil fungal community composition of soil samples at different elevations. A total of 1,702,480 high-quality sequences were obtained through sequencing, averaging 80,070 sequences per sample, ranging from 80,019 to 99,386 sequences. A total of 28,830 operational taxonomic units (OTUs) were obtained at the 97% similarity level, with 1017–1711 OTUs per sample.
Based on the hypothesis that soil fungal diversity exhibited a moderate expansion trend within the range of 1200–1300 m. In the study of soil fungal communities in forest ecosystems, this work involved identifying the top 10 phylum with the highest abundance at each sample or clustering level, calculating relative abundance, and generating bar accumulation plots. These steps aligned with the expected similar patterns, indicating a moderate expansion of soil fungal diversity within the designated elevation range. Permanova (Permutational Multivariate Analysis of Variance) analysis based on the Bray-Curtis distance was conducted using the ‘adonis’ function from the ‘vegan’ package, which is a widely utilized tool for analyzing ecological and biodiversity data [26]. This method was used to investigate differences in soil fungal community structure along the elevational gradient. Furthermore, the application of non-metric multidimensional scaling (NMDS) helped assess the differences in dominant soil fungal community structures at different elevations through the Permanova method and helped precisely quantify the contribution of influencing factors to explain the diversity of soil fungal communities, thereby reinforcing the hypothesis of elevation-related diversity patterns [26,27].
Based on the hypothesis that environmental factors strongly correlated with elevational gradients as the primary drivers of variations in the soil fungal community structure, we used the vegan package within the R program. Employing distance-based redundant analysis (dbRDA) for explanatory variable selection through backward stepwise regression, we evaluated each model’s variation inflation factor (VIF) and simplified it by eliminating interactions with VIF < 3 to prevent overfitting. The Akaike information criterion (AIC) employed to measure the goodness of fit for models. This process resulted in the establishment of simplified and optimized models, ultimately forming the complete model. To evaluate the explanatory significance of environmental factors on the distribution of dominant fungal phylum communities in the soil, we conducted a Monte Carlo replacement test. Additionally, we used the Gamma model, a generalized linear model (GLM), and analyzed the key factors influencing the dominant phylum of soil fungi along the elevational gradient in the southern slope of Daiyun Mountain.
In order to explore the correlation among soil fungal groups (OTUs), we selected the top 100 soil fungal groups (OTUs) based on their relative abundance. The Spearman correlation coefficient was then calculated between these selected groups to generate r-value and p-value matrices. At the same time, the absolute value of the Spearman correlation coefficient was set to be greater than 0.6, and the p-value was set to be less than 0.05. The interaction analysis diagram of the dominant soil fungal community network was constructed using the ‘igraph’ and ‘psych’ packages. Meanwhile, the network topology, such as the connection number, average degree, and aggregation coefficient of the interaction network parameters, were calculated.
Statistical analyses were performed utilizing R version 4.2.3 for all computations [25].

3. Results

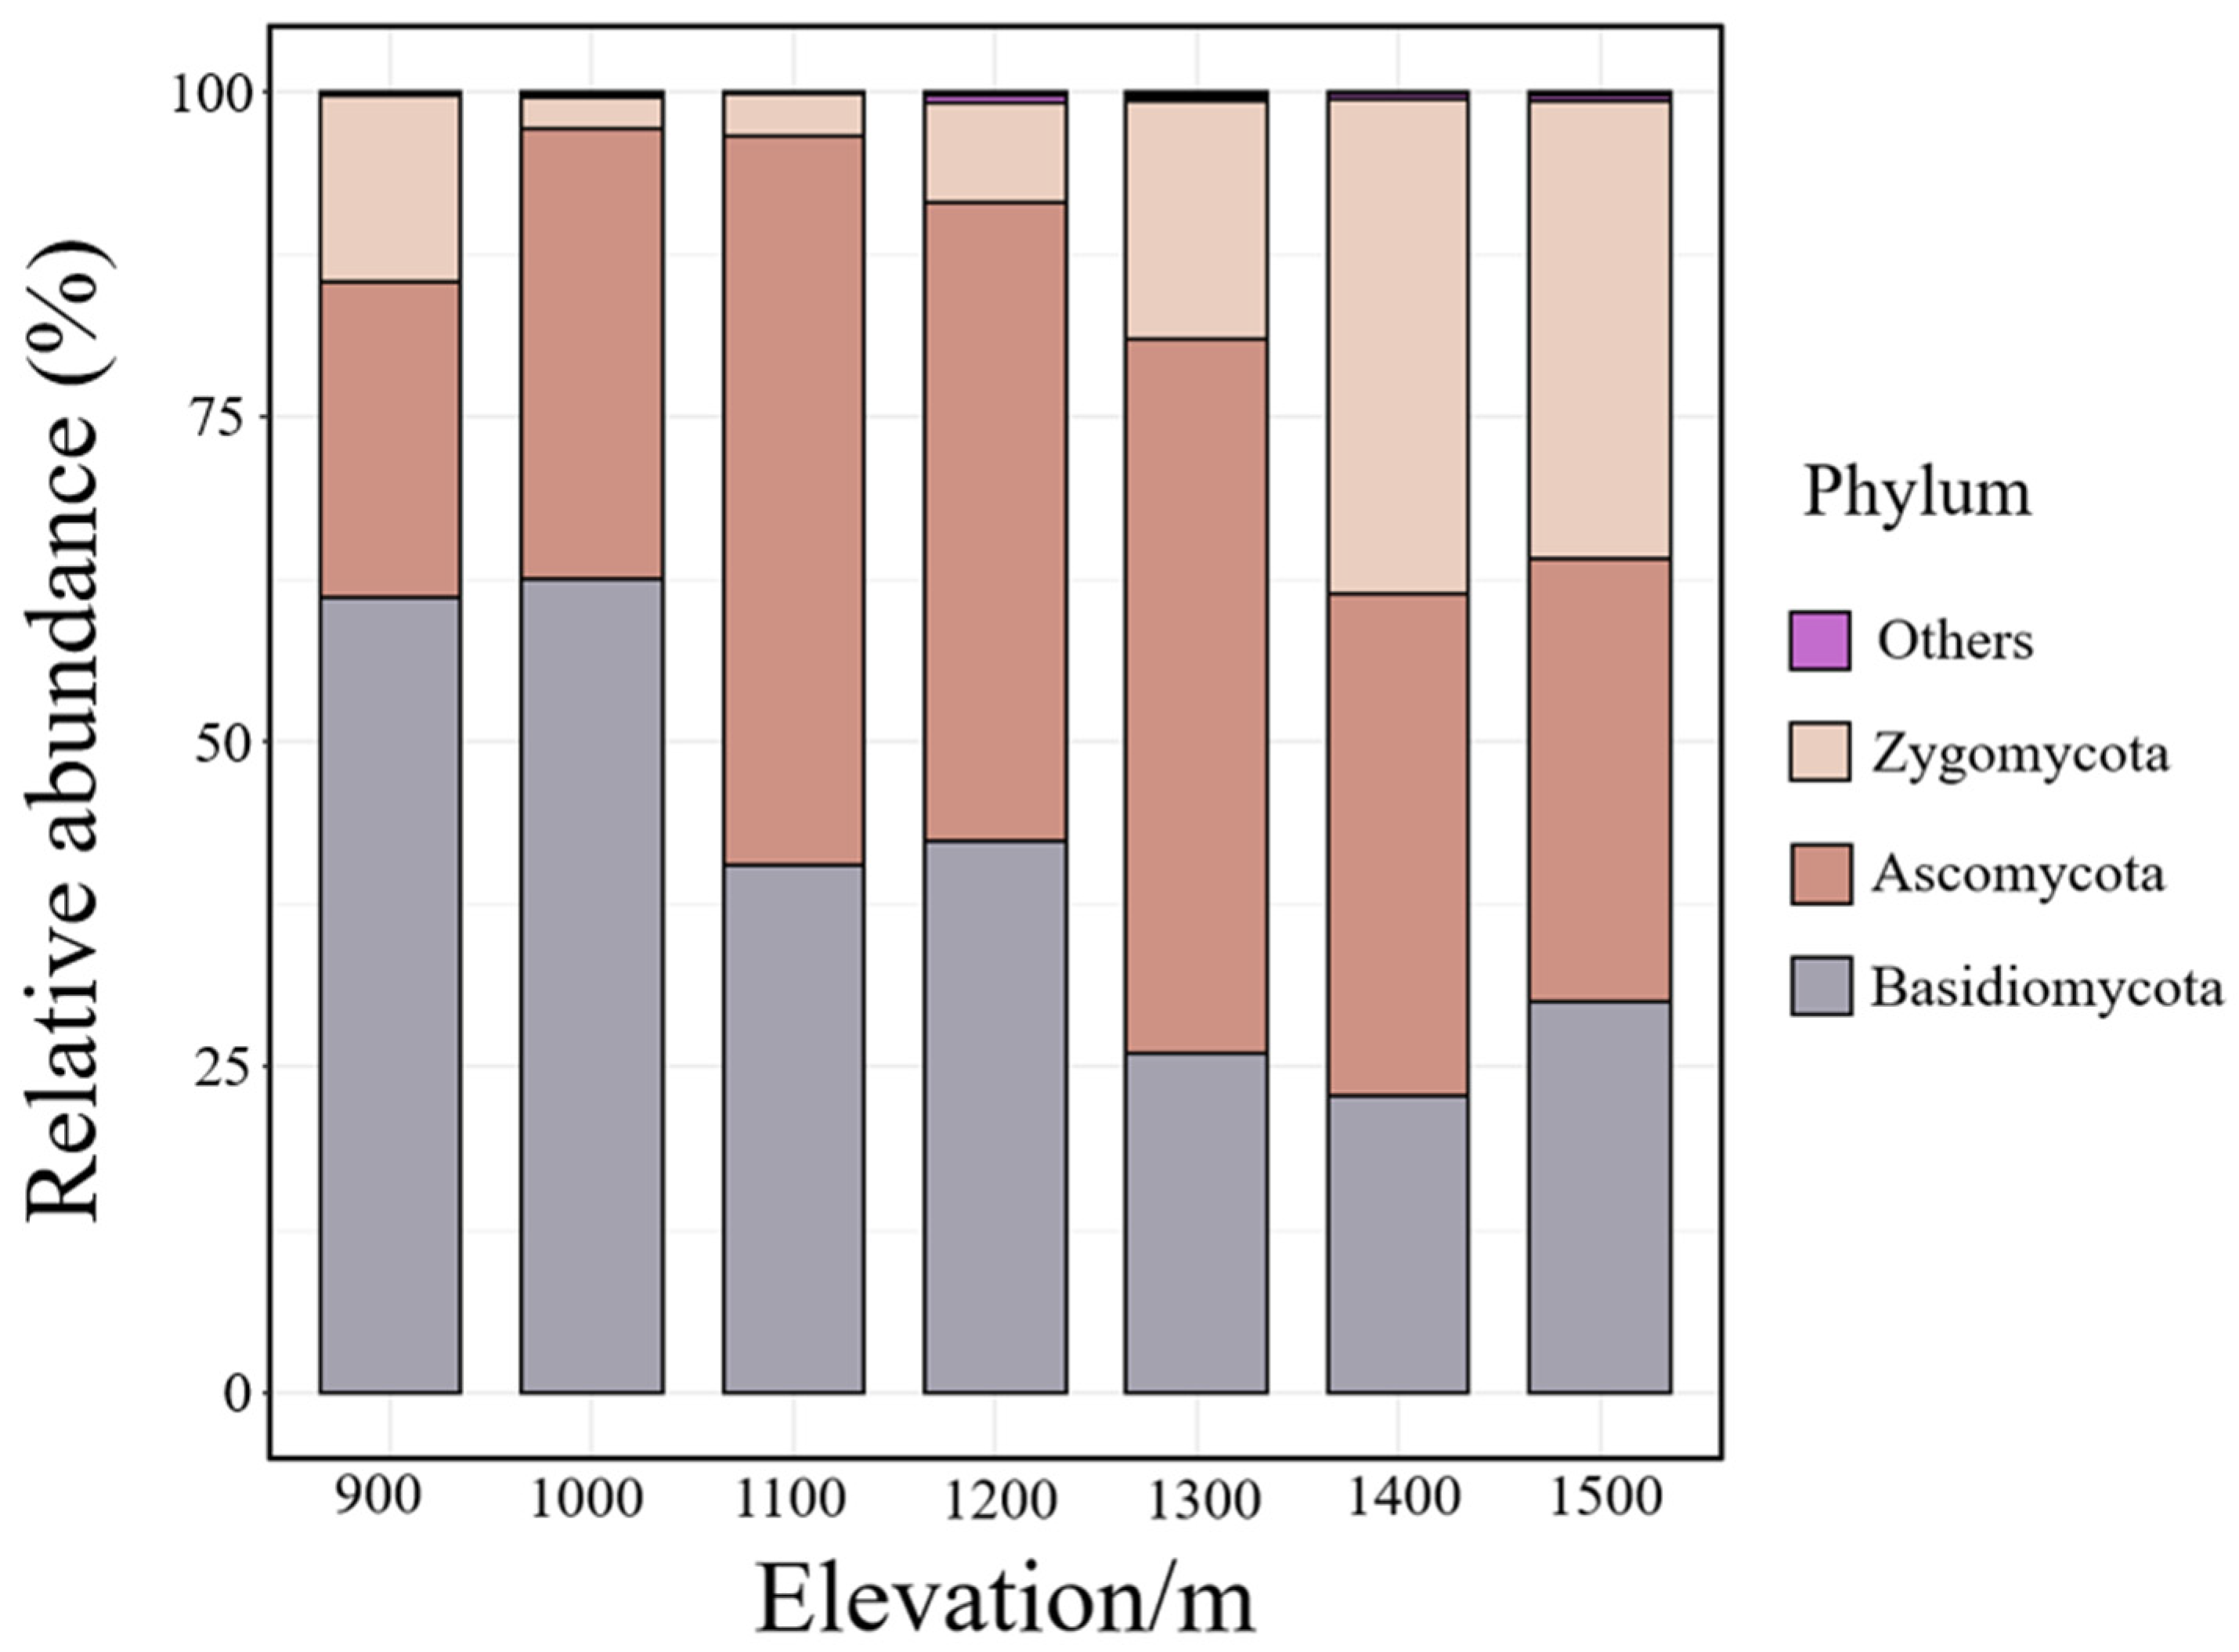
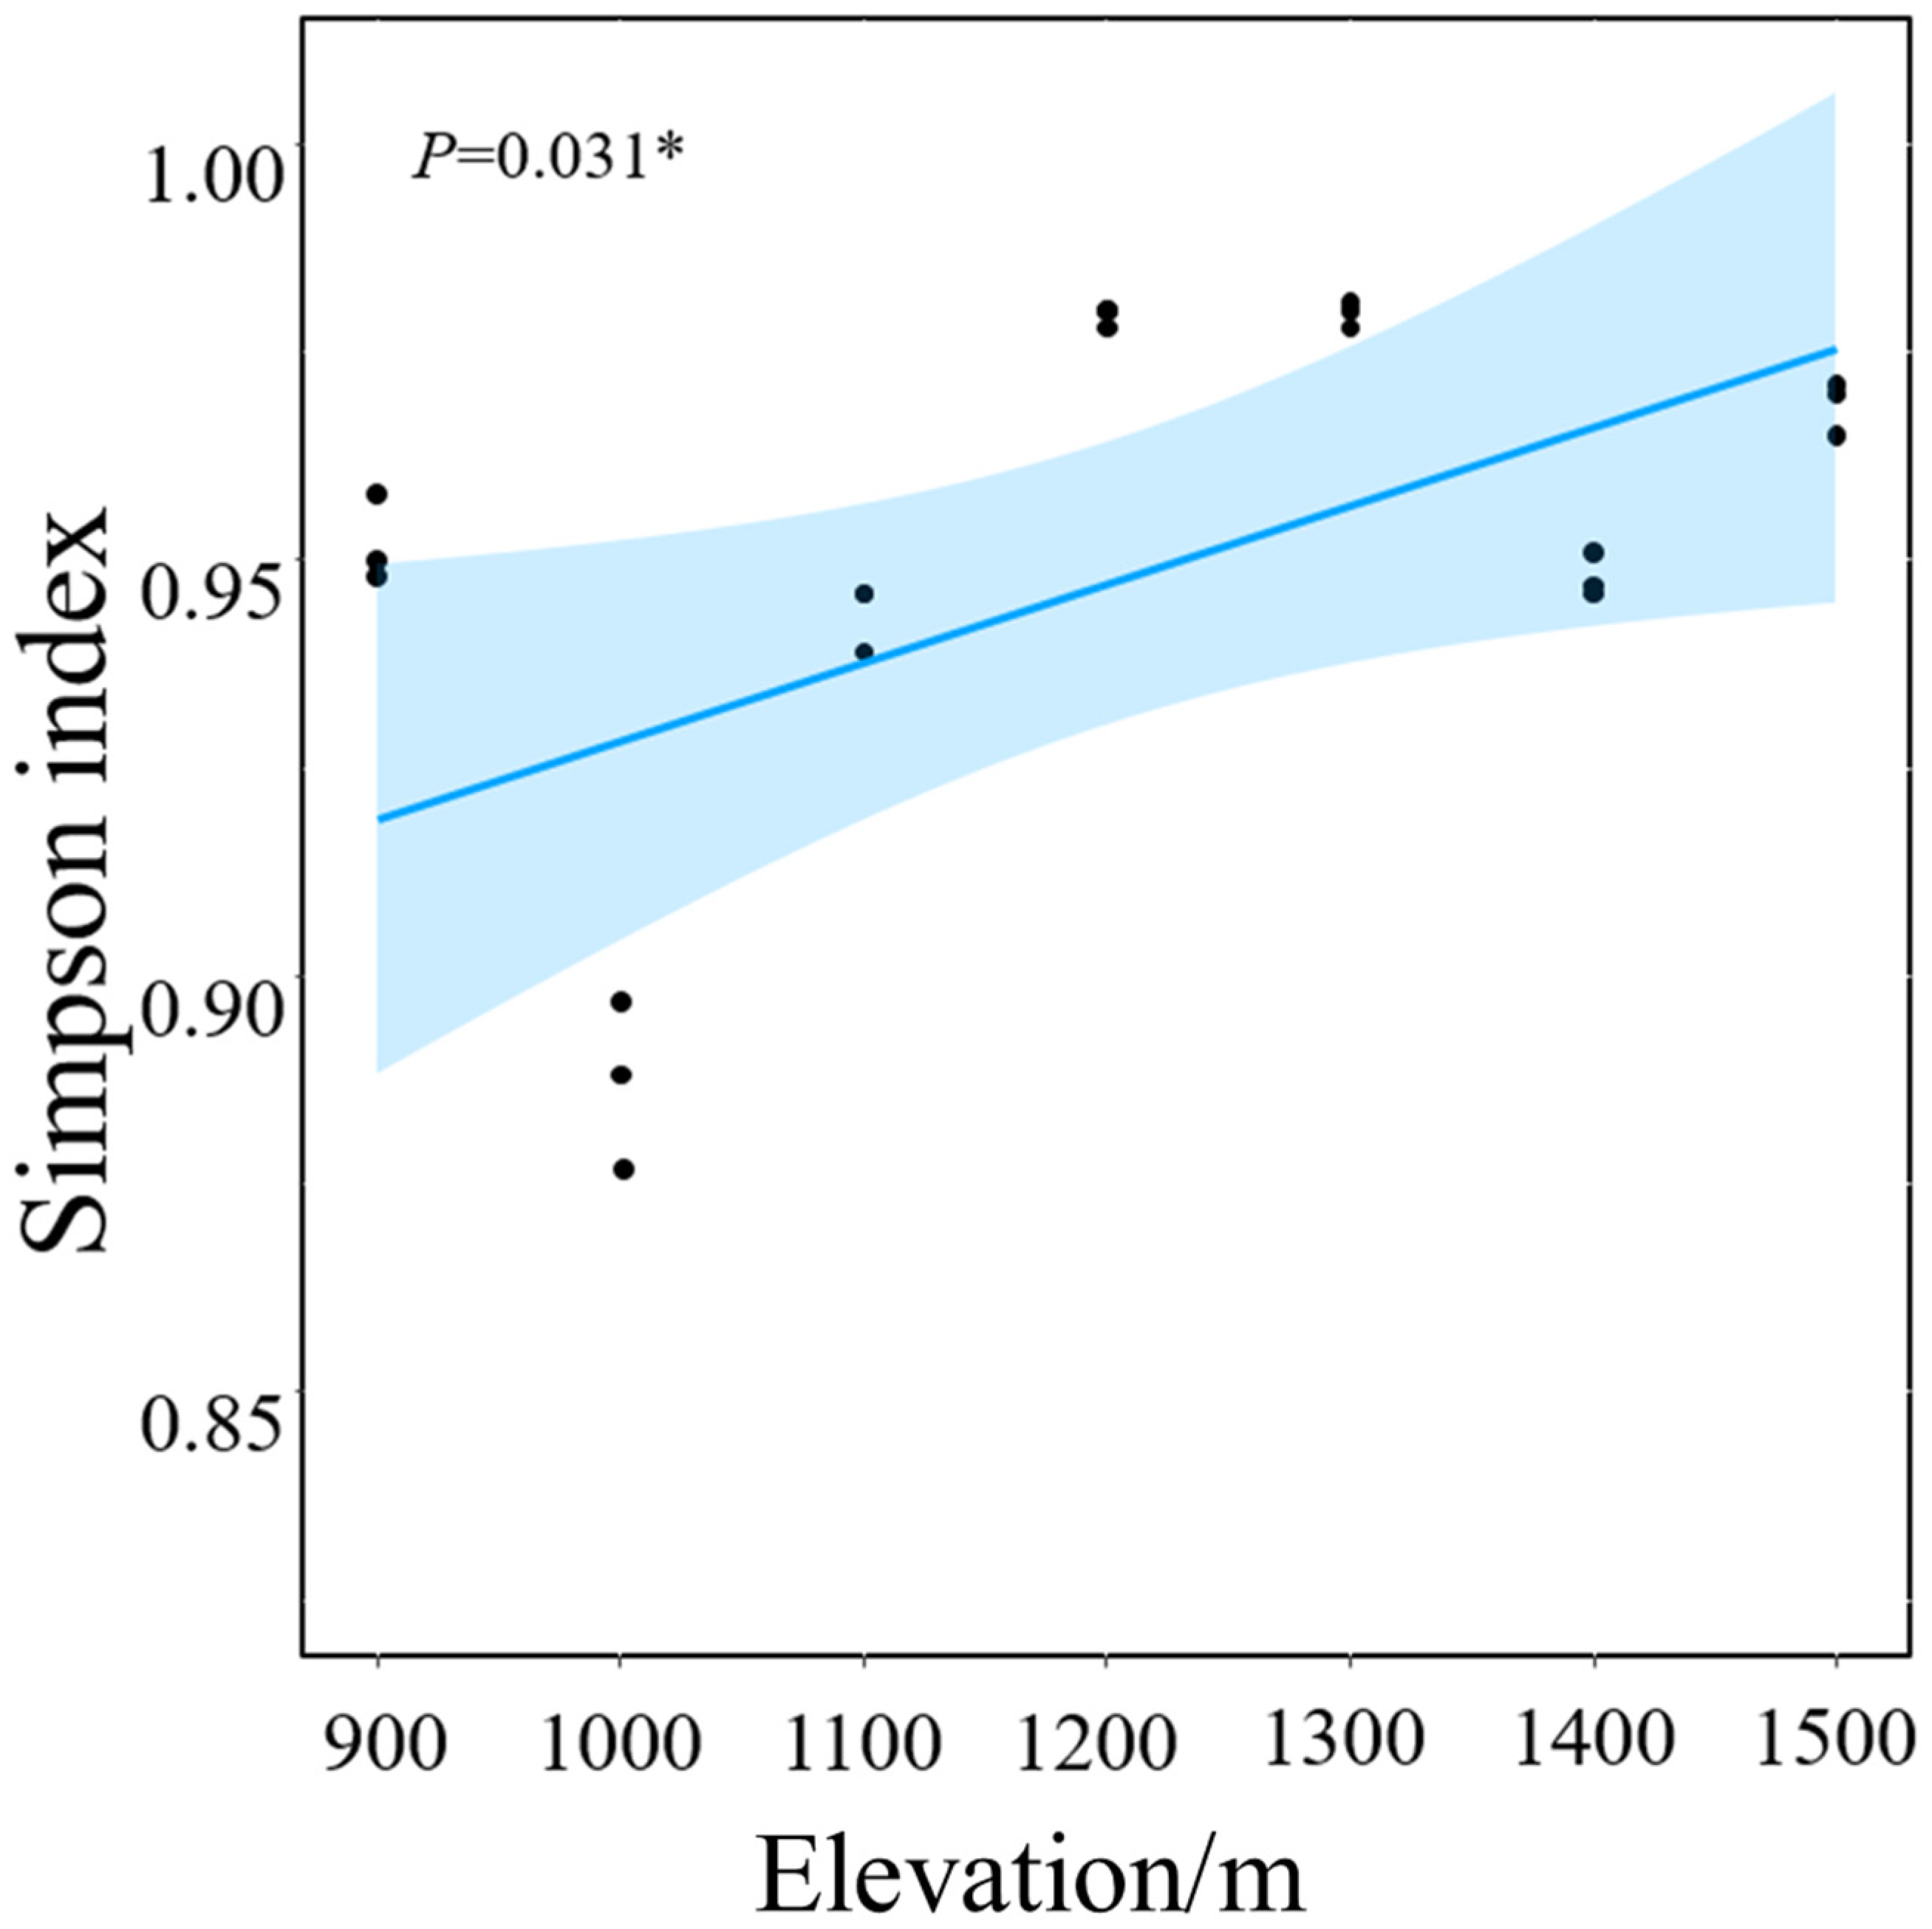
3.1. Soil Fungal Community Structure and α Diversity

The dominant soil fungal communities (relative abundance of ≥1%) in Daiyun Mountain belonged to the following three phyla: Basidiomycota (26.0%–61.1%), Ascomycota (24.3%–56.0%), and Zygomycota (2.3%–38.0%) (Figure 1). The relative abundance of Basidiomycota and Ascomycota exceeded 10%, and Zygomycota exceeded 1% at all elevations. Basidiomycota showed the highest relative abundance at 900 m, reaching 61.1%. Ascomycota’s relative abundance was highest at 1100 m, at 56.0%, and Zygomycota’s relative abundance was highest at 1400 m and 38.0%. Significant differences existed in the distribution patterns of dominant soil fungi along different elevations among the class, family, and genus levels in Figures S2–S4. The α diversity index of soil fungi followed a unimodal trend, with the Simpson index showing significant differences along the elevational gradient (Figure 2). The Shannon index was the highest at 1300 m and lowest at 1000 m. The observed phylum and PD index reached their highest at 1200 m and lowest at 1100 m.

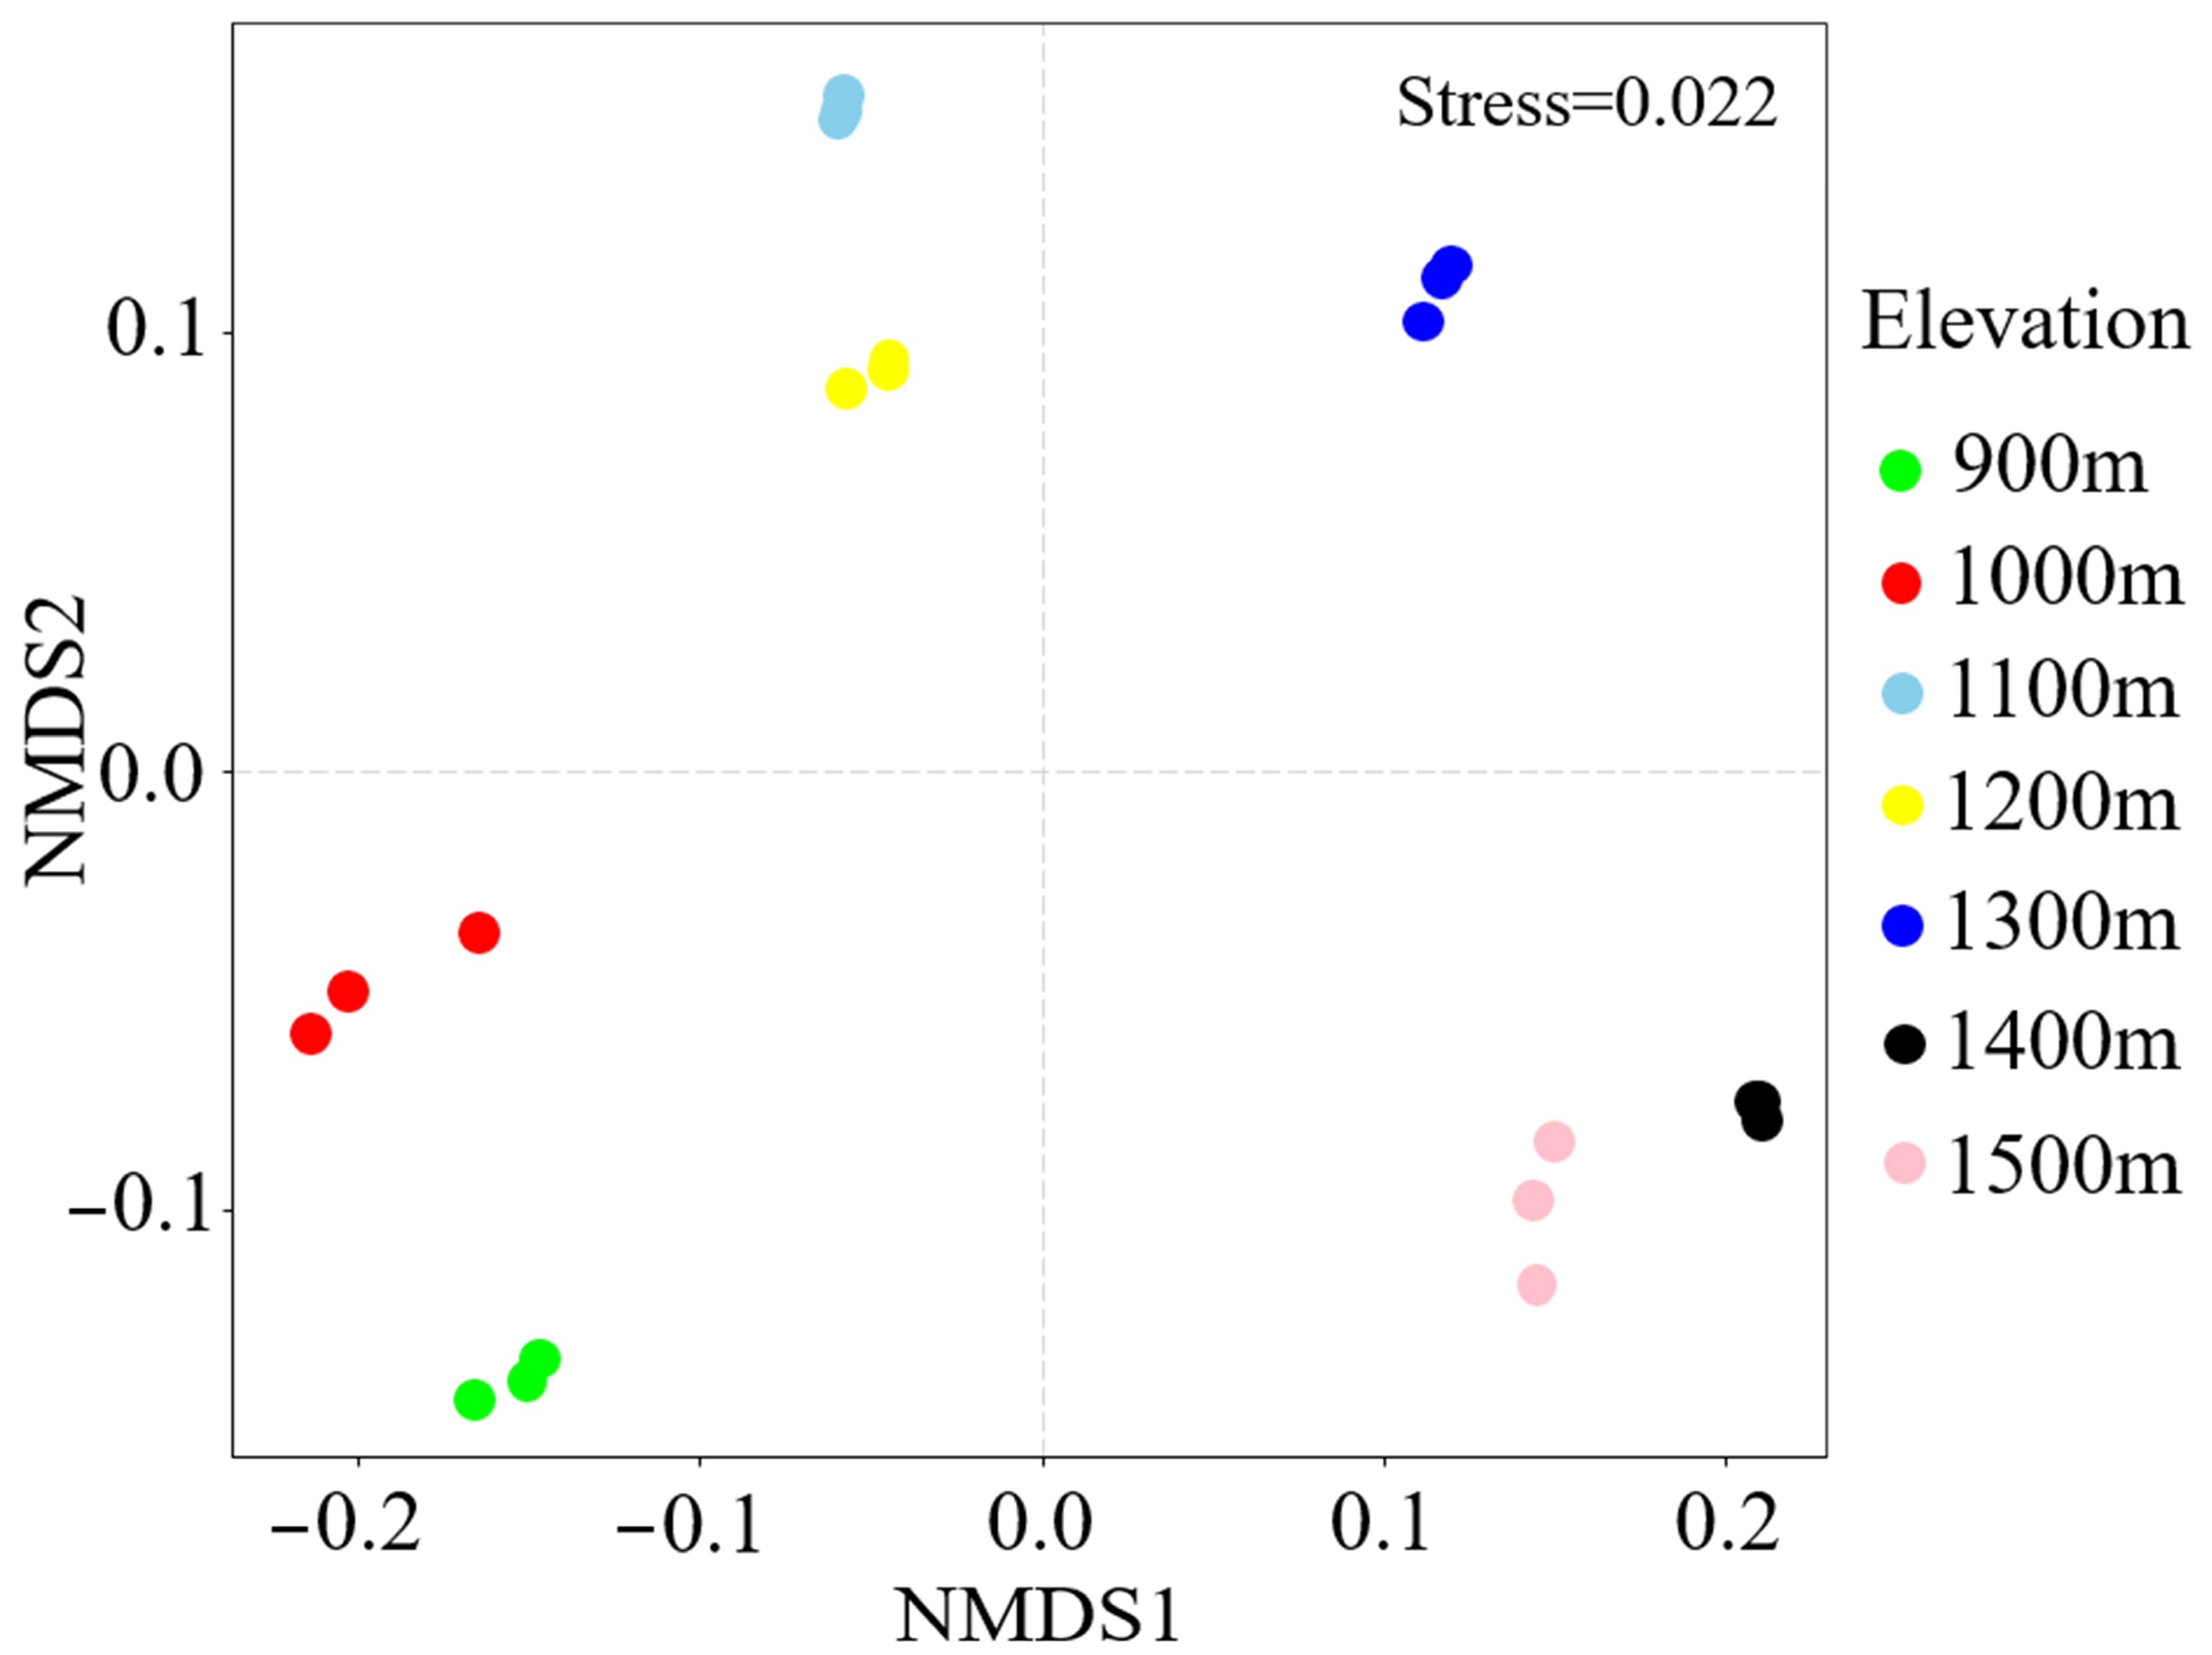
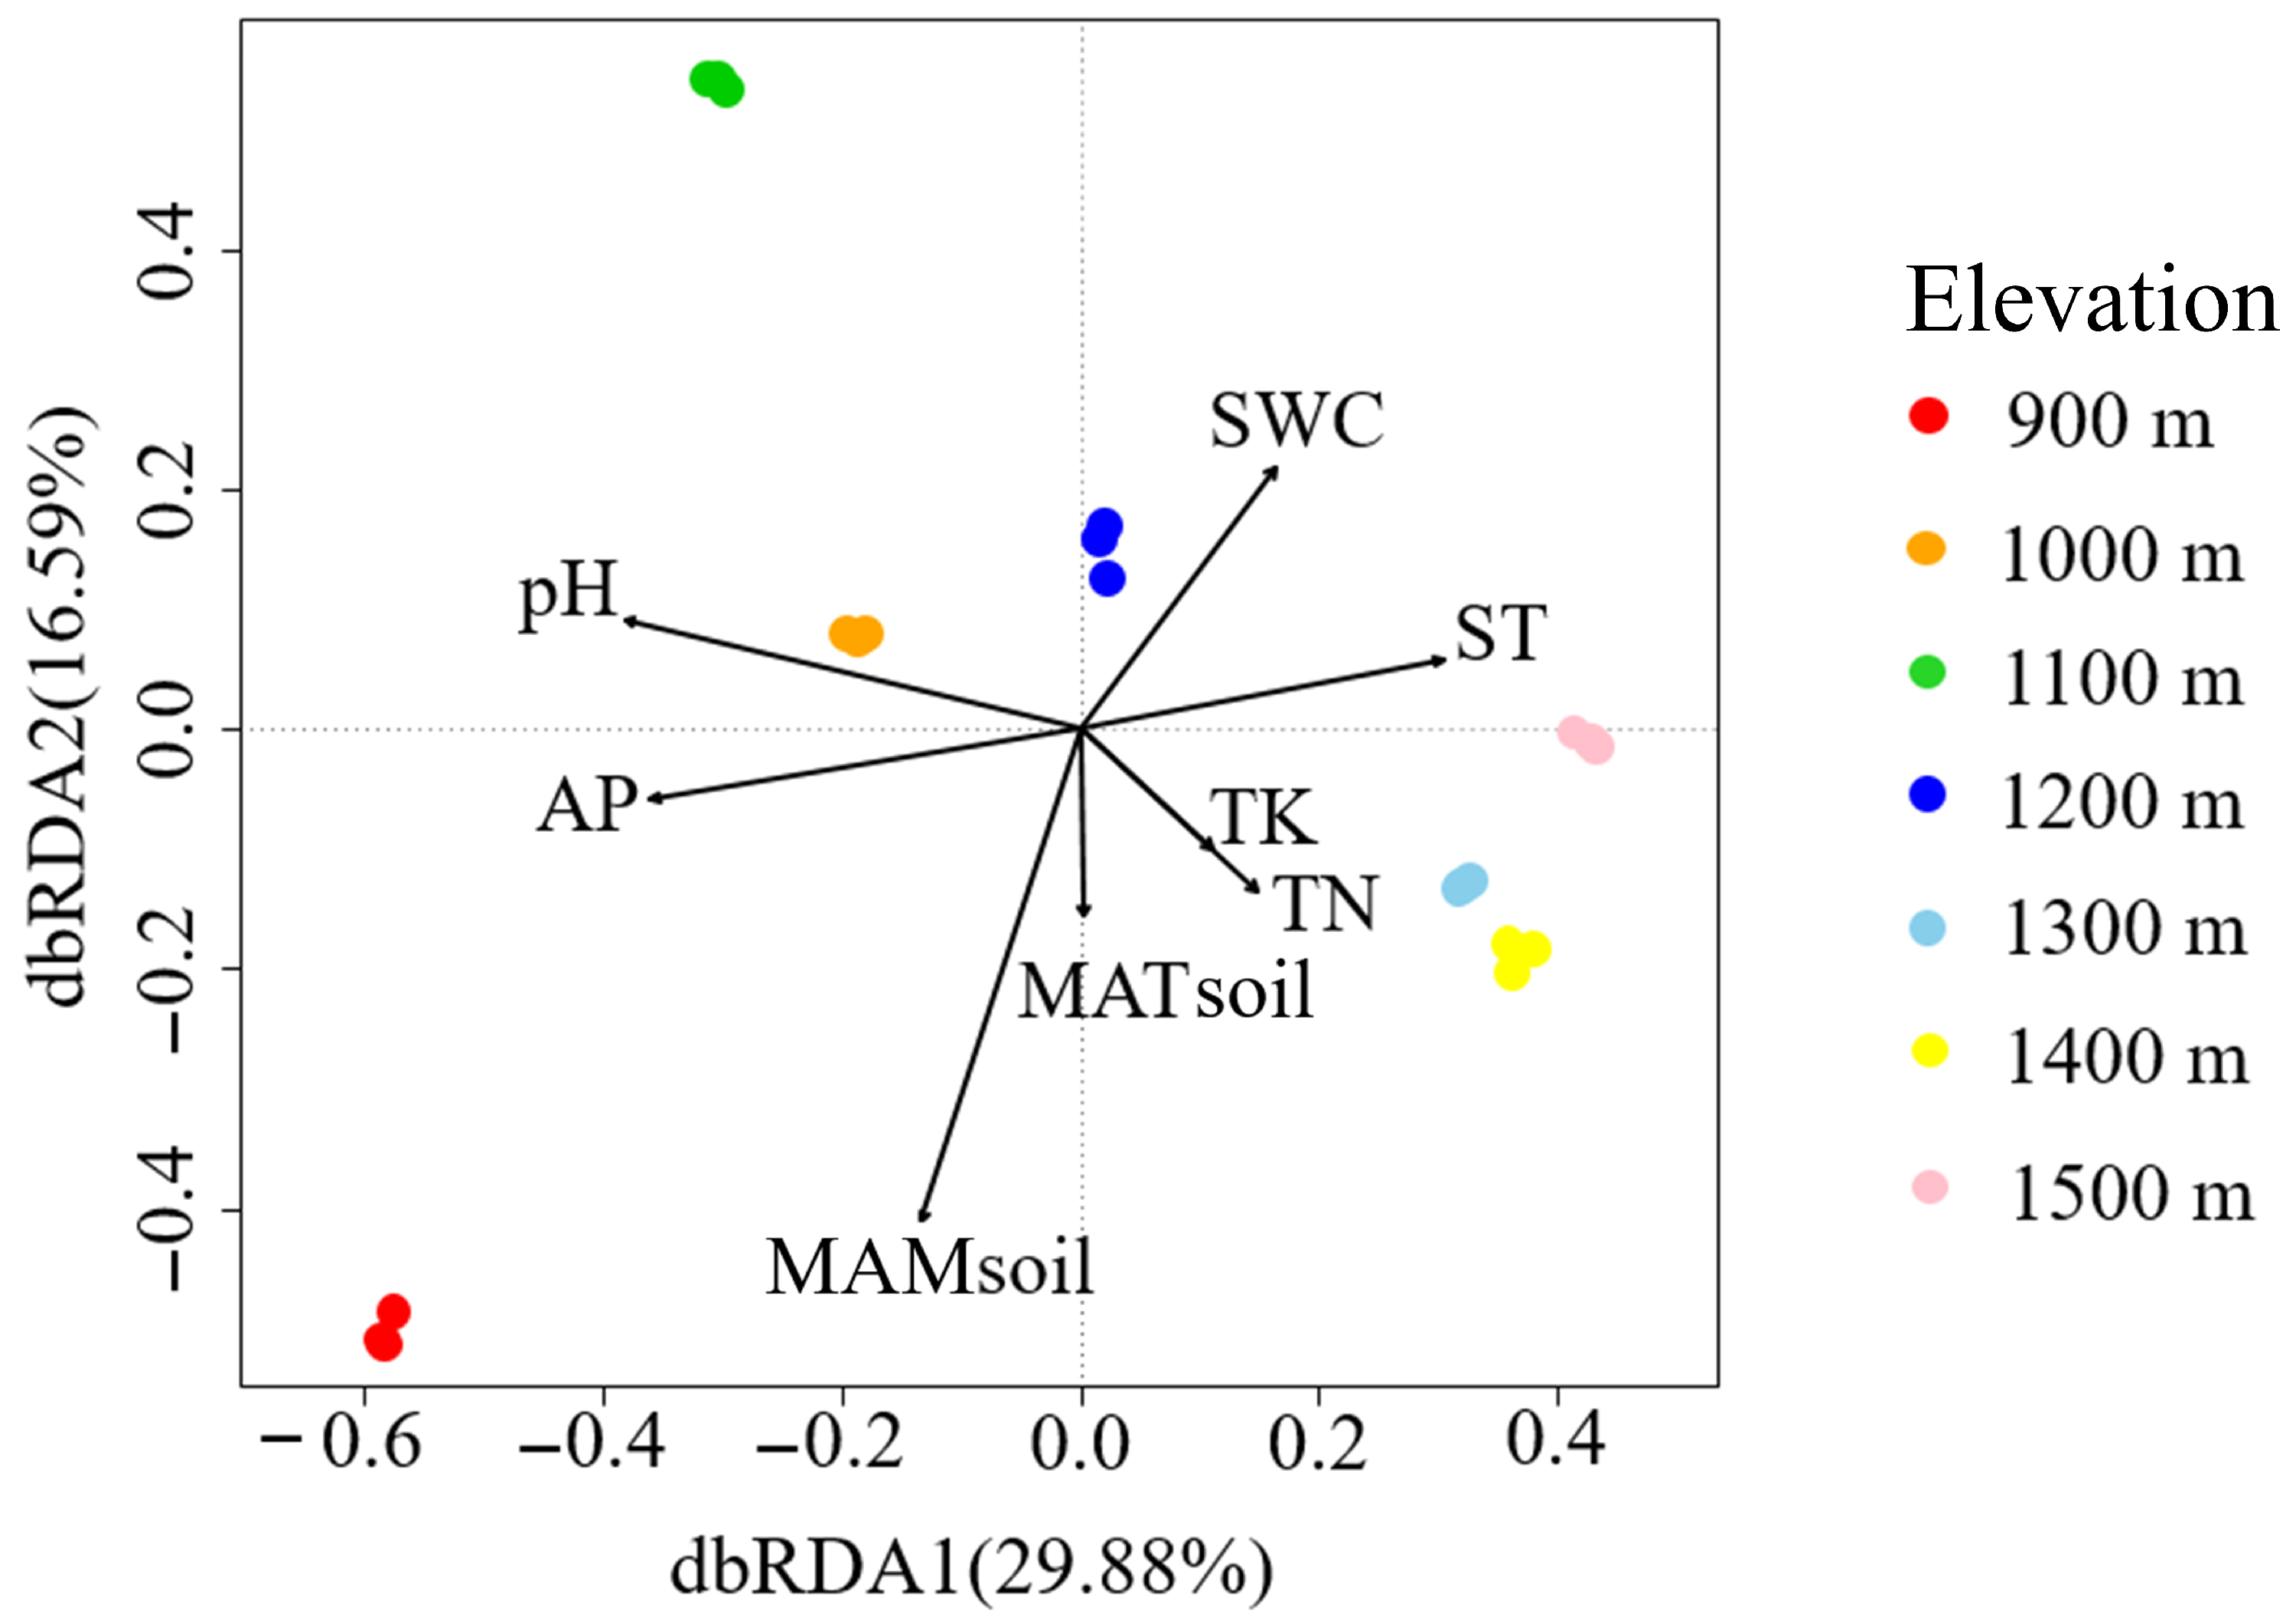
3.2. β-Diversity of Soil Fungal Community

The dominant soil fungal community structure along the elevations could be clearly distinguished along the first and second axis of NMDS (Figure 3). The stress value of NMDS was 0.022, indicating that the fitting degree was adequate, which could accurately reflect the difference of dominant soil fungal community structure. The NMDS diagram revealed a tripartite division in the dominant soil fungal community structure as follows: first at the elevations of 900 m and 1000 m; second at 1100 m, 1200 m, and 1300 m; and third at 1400 m and 1500 m. The considerable separation among these three segments provided a visual representation of the disparities in dominant soil fungal community structures. Notably, the distances between the samples from the 1100 m and 1400 m elevation groups were relatively concentrated, exhibiting some overlap and suggesting a high similarity in soil fungi between these elevations. Conversely, the distribution of soil fungal communities at the elevations of 1000 m and 1500 m displayed greater dispersion, indicating notable differences in soil fungal communities. Permanova analysis showed that the soil pH, TP and TC content explained a higher percentage of soil fungal communities at 29.48%, 28.79% and 20.79%, respectively (Figure 4).

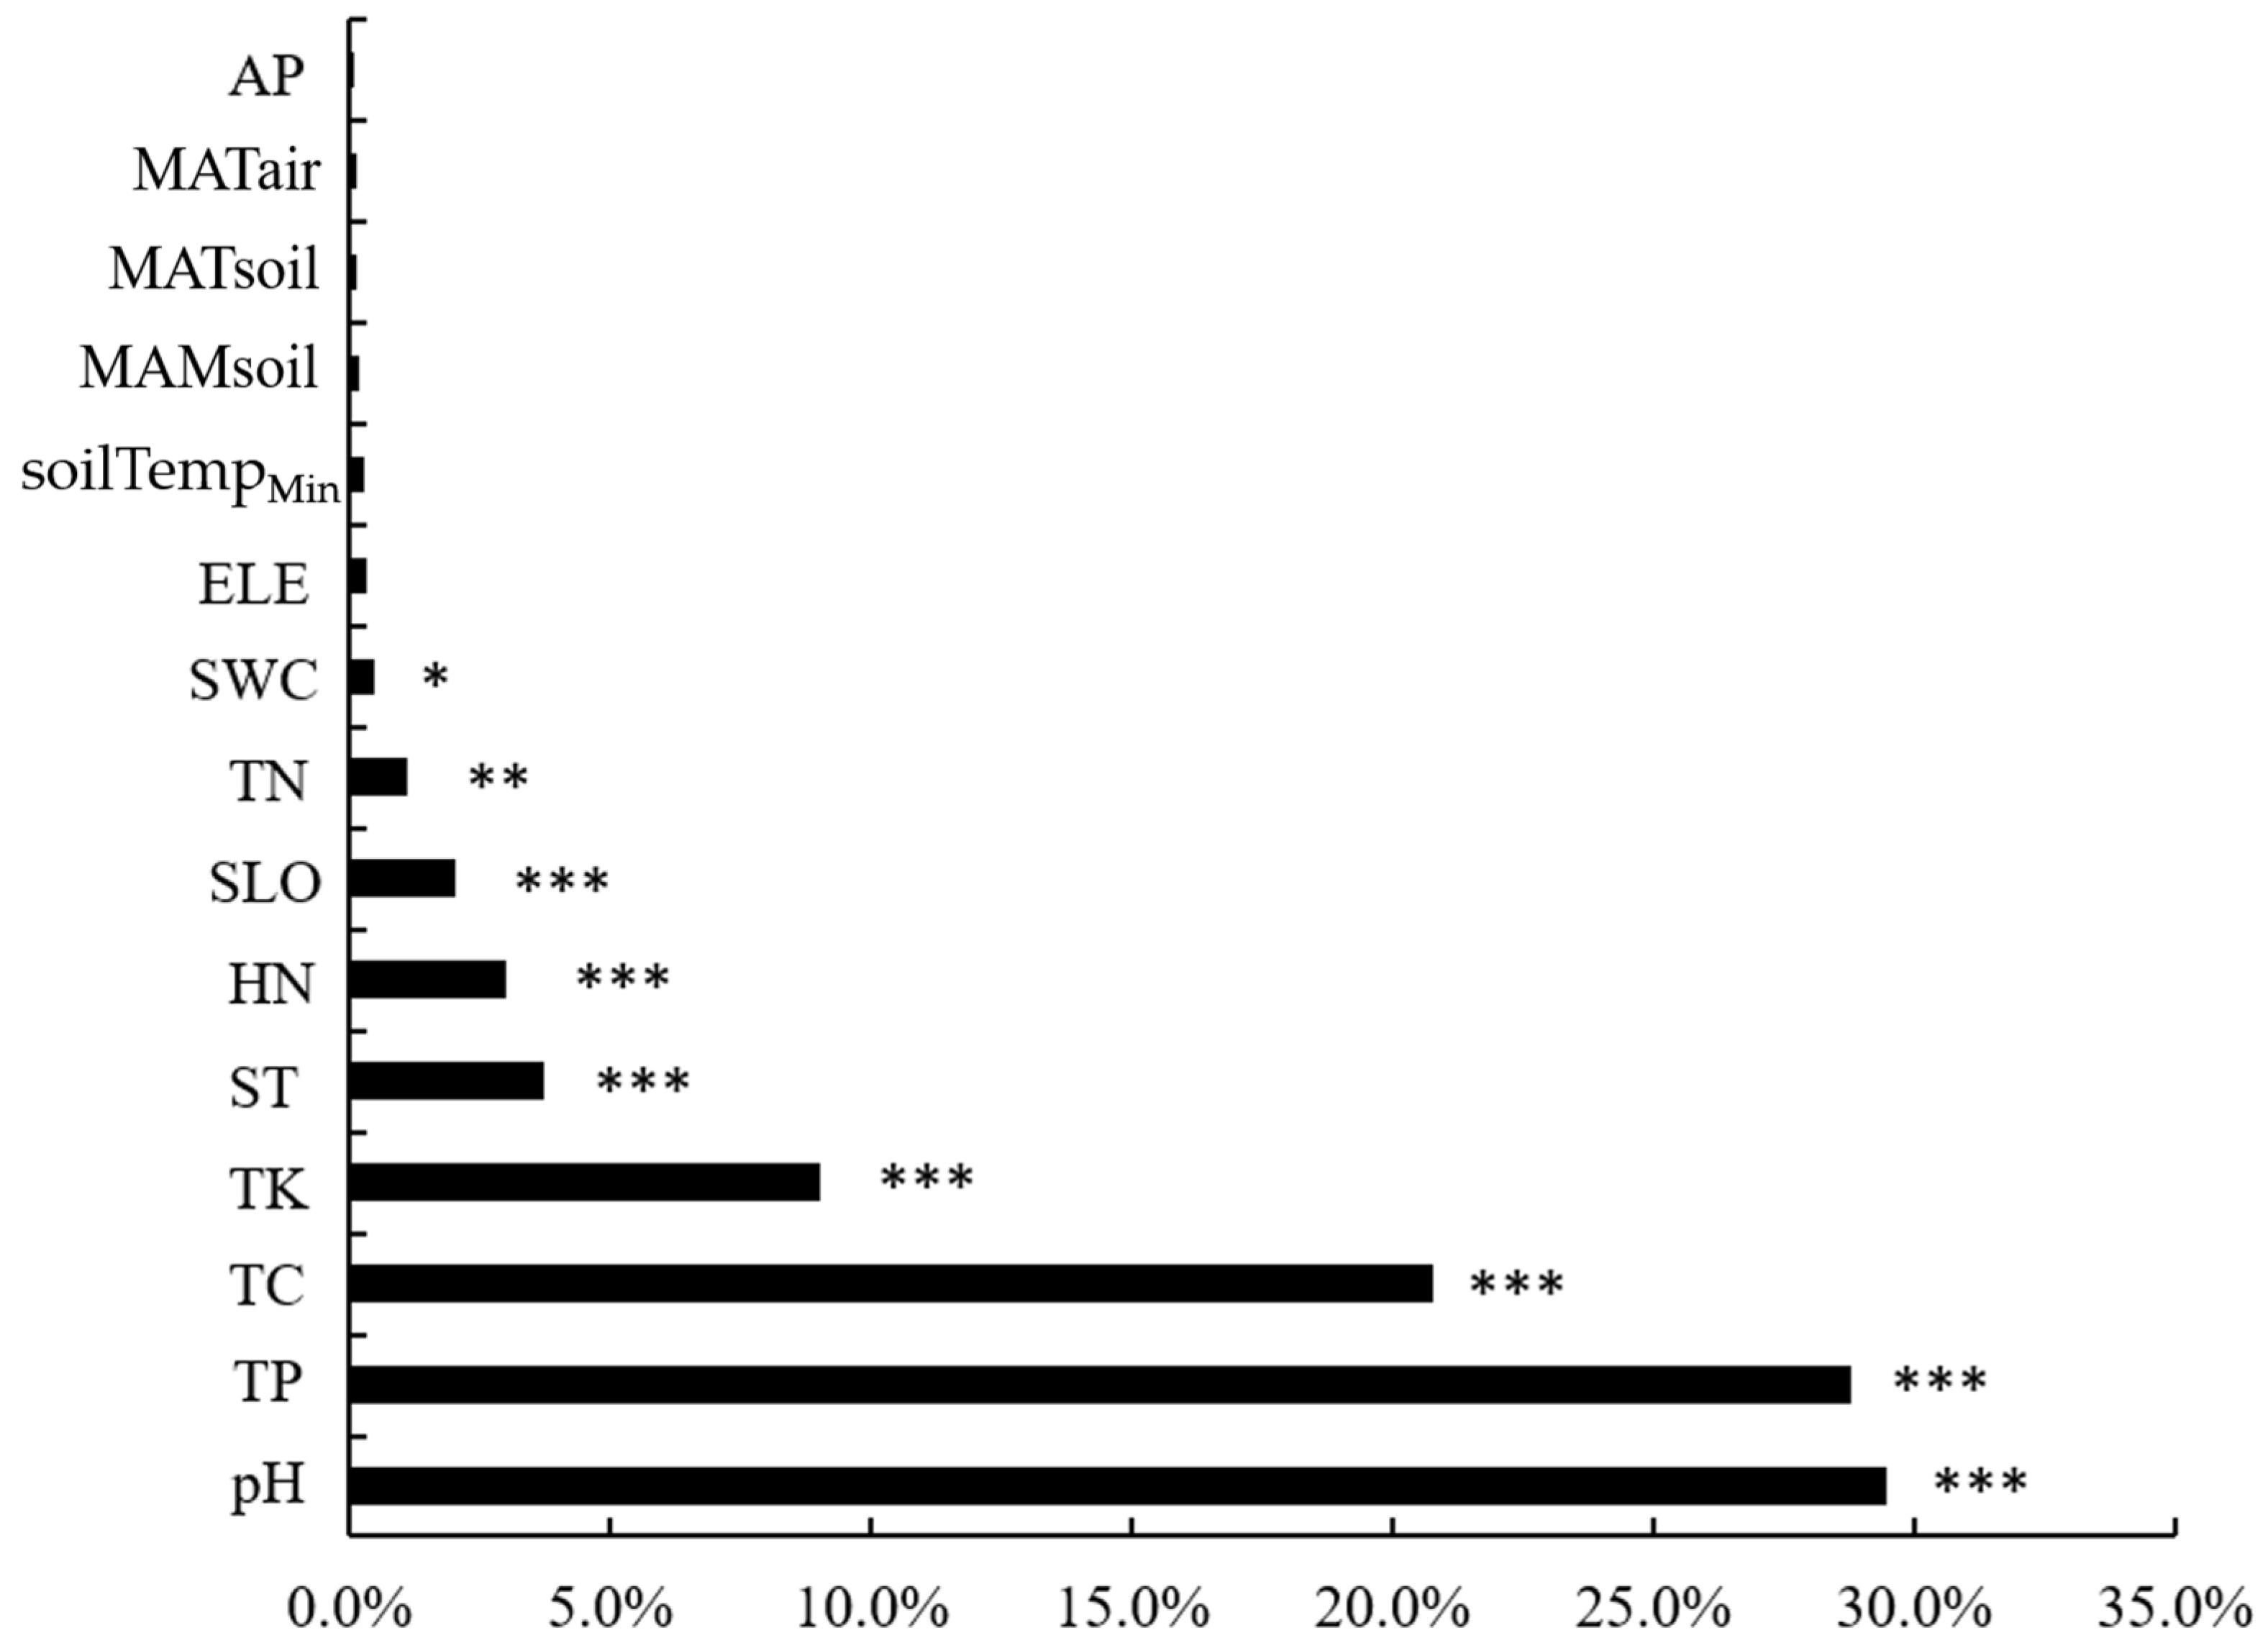
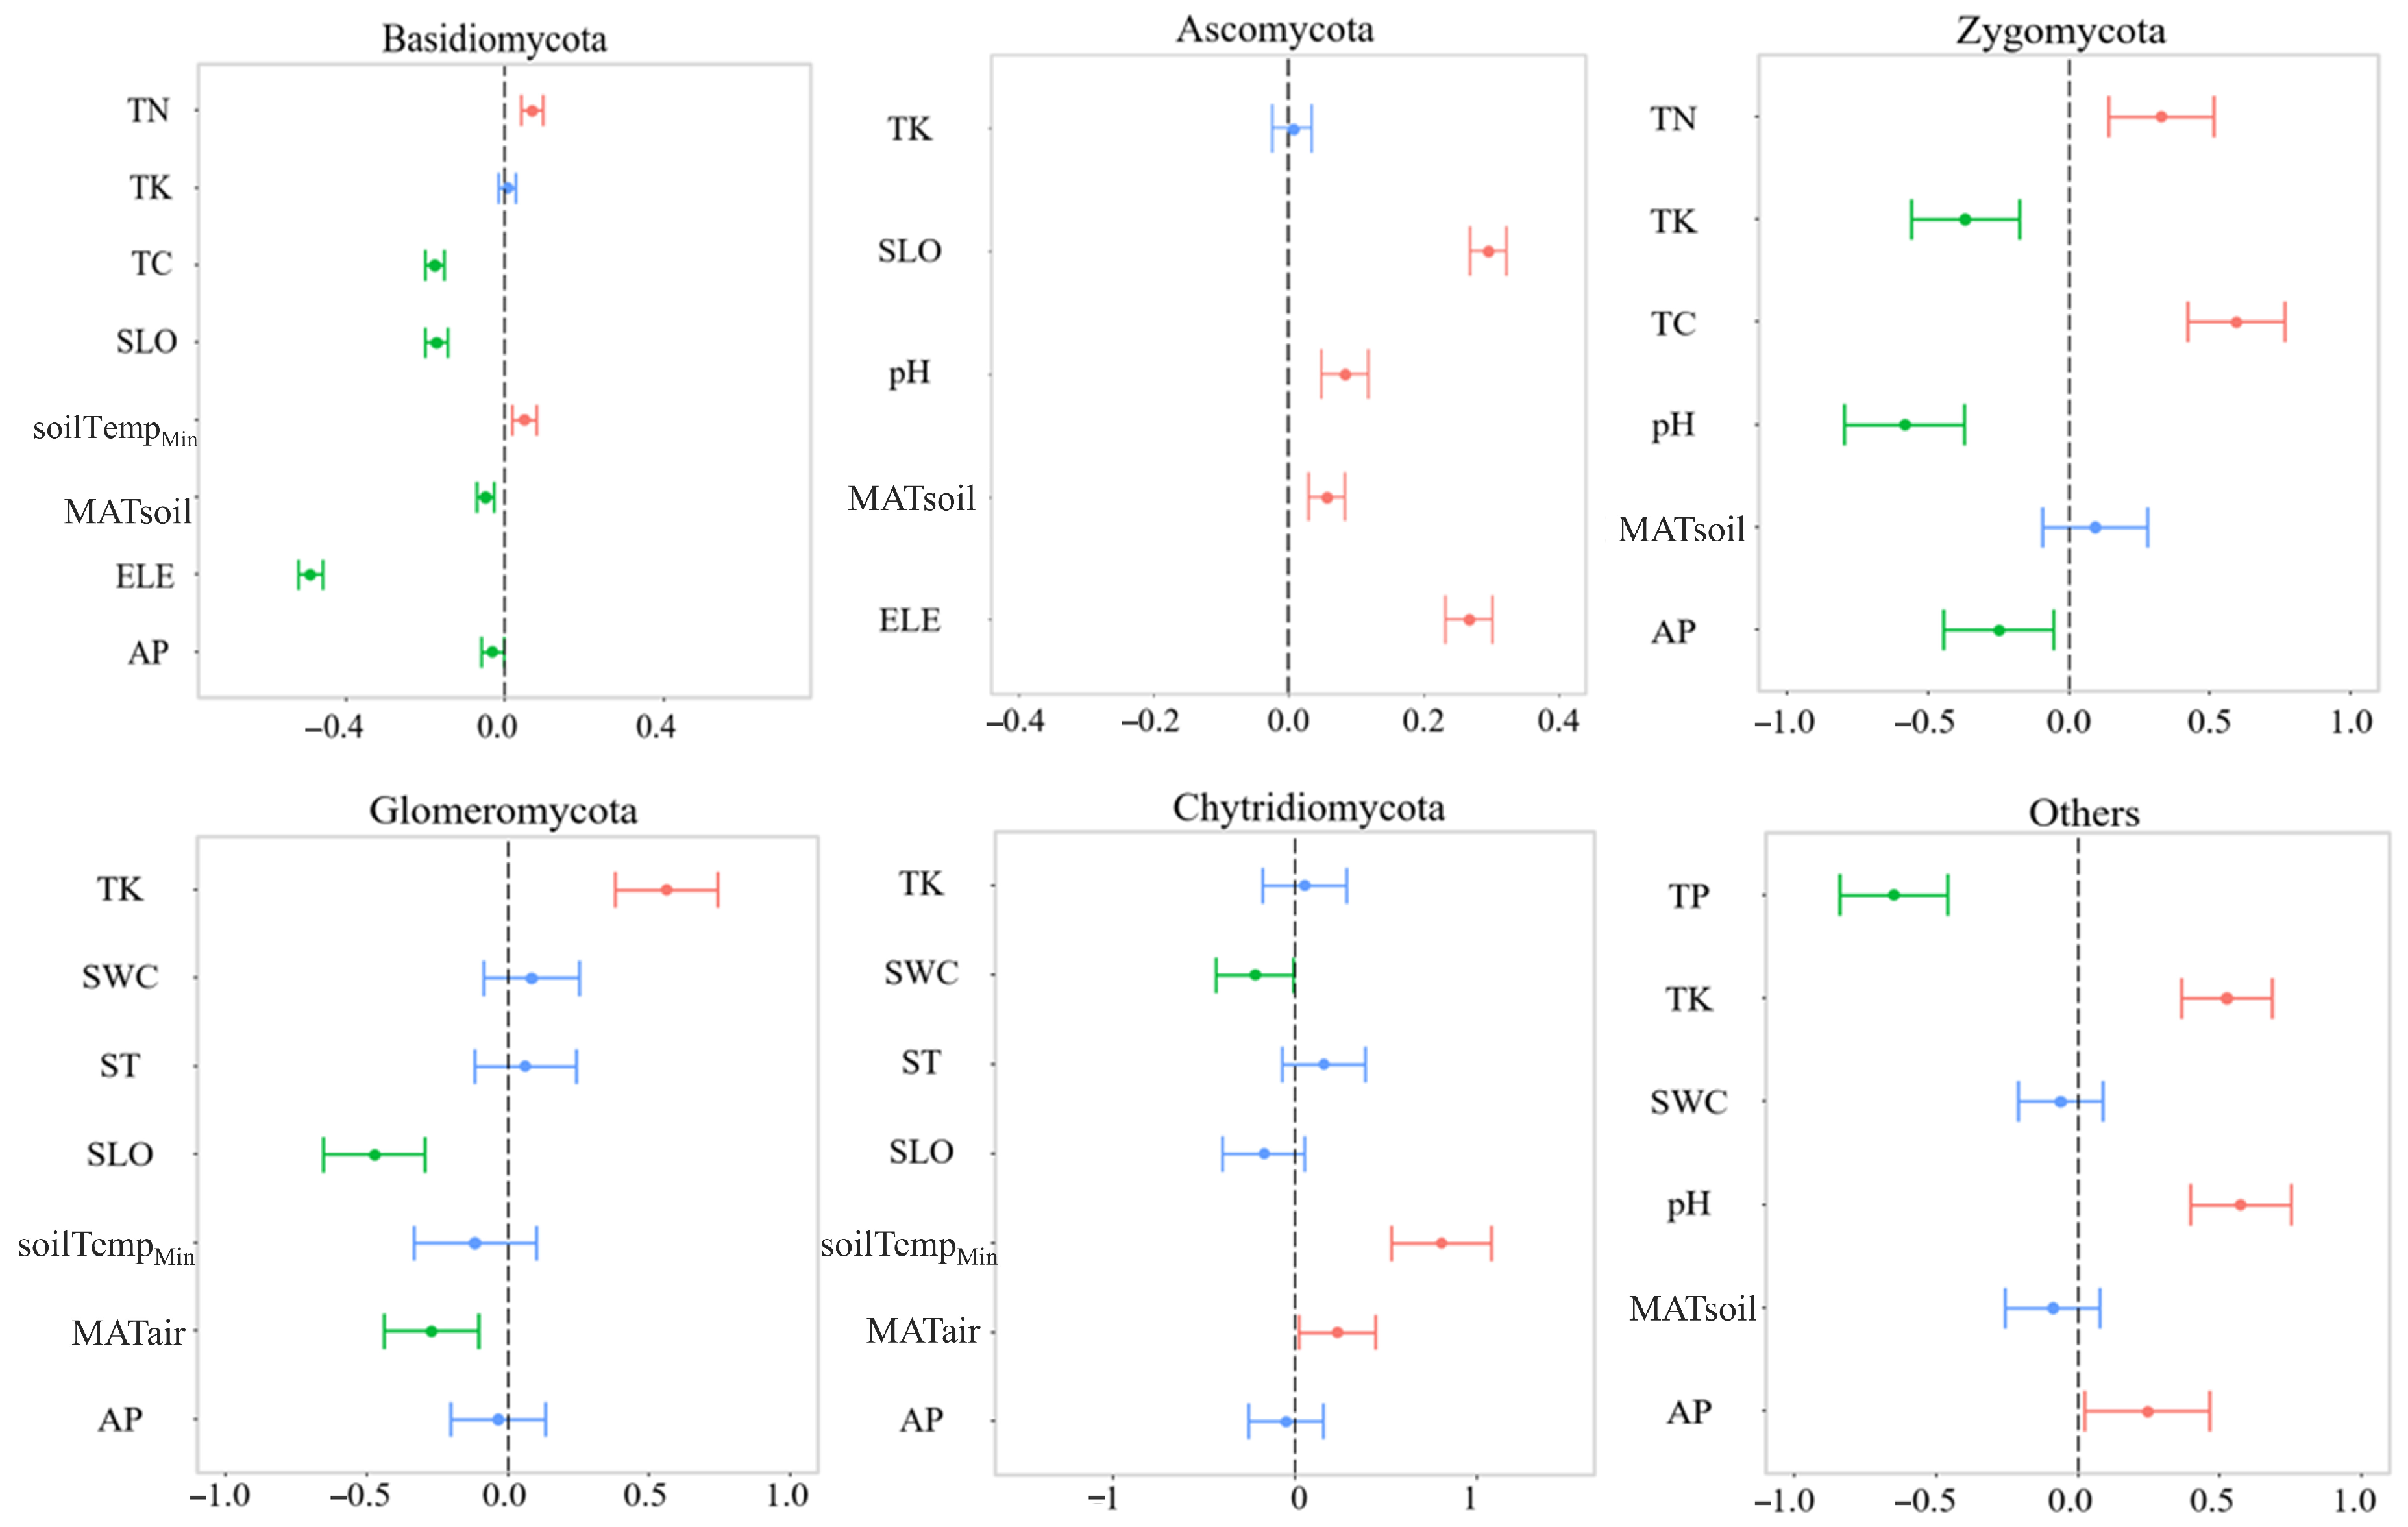
3.3. Dominant Soil Fungal Community and Soil Environmental Factors Relationship

The dbRDA analysis of the main environmental factors explained 46.47% of the dominant soil fungal community, of which the first axis (dbRDA1) interpretation rate was 29.88%, and the second axis (dbRDA2) interpretation rate was 16.59% (Figure 5). Soil pH, available phosphorus, total nitrogen, and soil temperature exhibited significant correlations with RDA1, while the soil water content, total potassium, mean annual soil moisture, and temperature showed significant correlations with dbRDA2. The results showed that the soil fungal community strongly correlated with the mean annual soil moisture, soil pH, total potassium, and available phosphorus (Table S2).
The generalized linear analysis revealed that within the dominant phylum, Basidiomycota exhibited a significantly positive correlation with the soil total nitrogen and the minimum summer soil temperature. Conversely, it showed a significantly negative correlation with the soil total carbon, slope, mean annual soil temperature, elevation, and available phosphorus (Figure 6). Ascomycota was positively correlated with soil pH, slope, mean annual soil temperature and elevation. Zygomycota exhibited a significant positive correlation with the soil total carbon and total nitrogen while displaying a significant negative correlation with the soil total potassium, pH, and available phosphorus. In summary, the soil environments influenced the soil fungal microbial community, representing a combination effect of multiple soil factors.

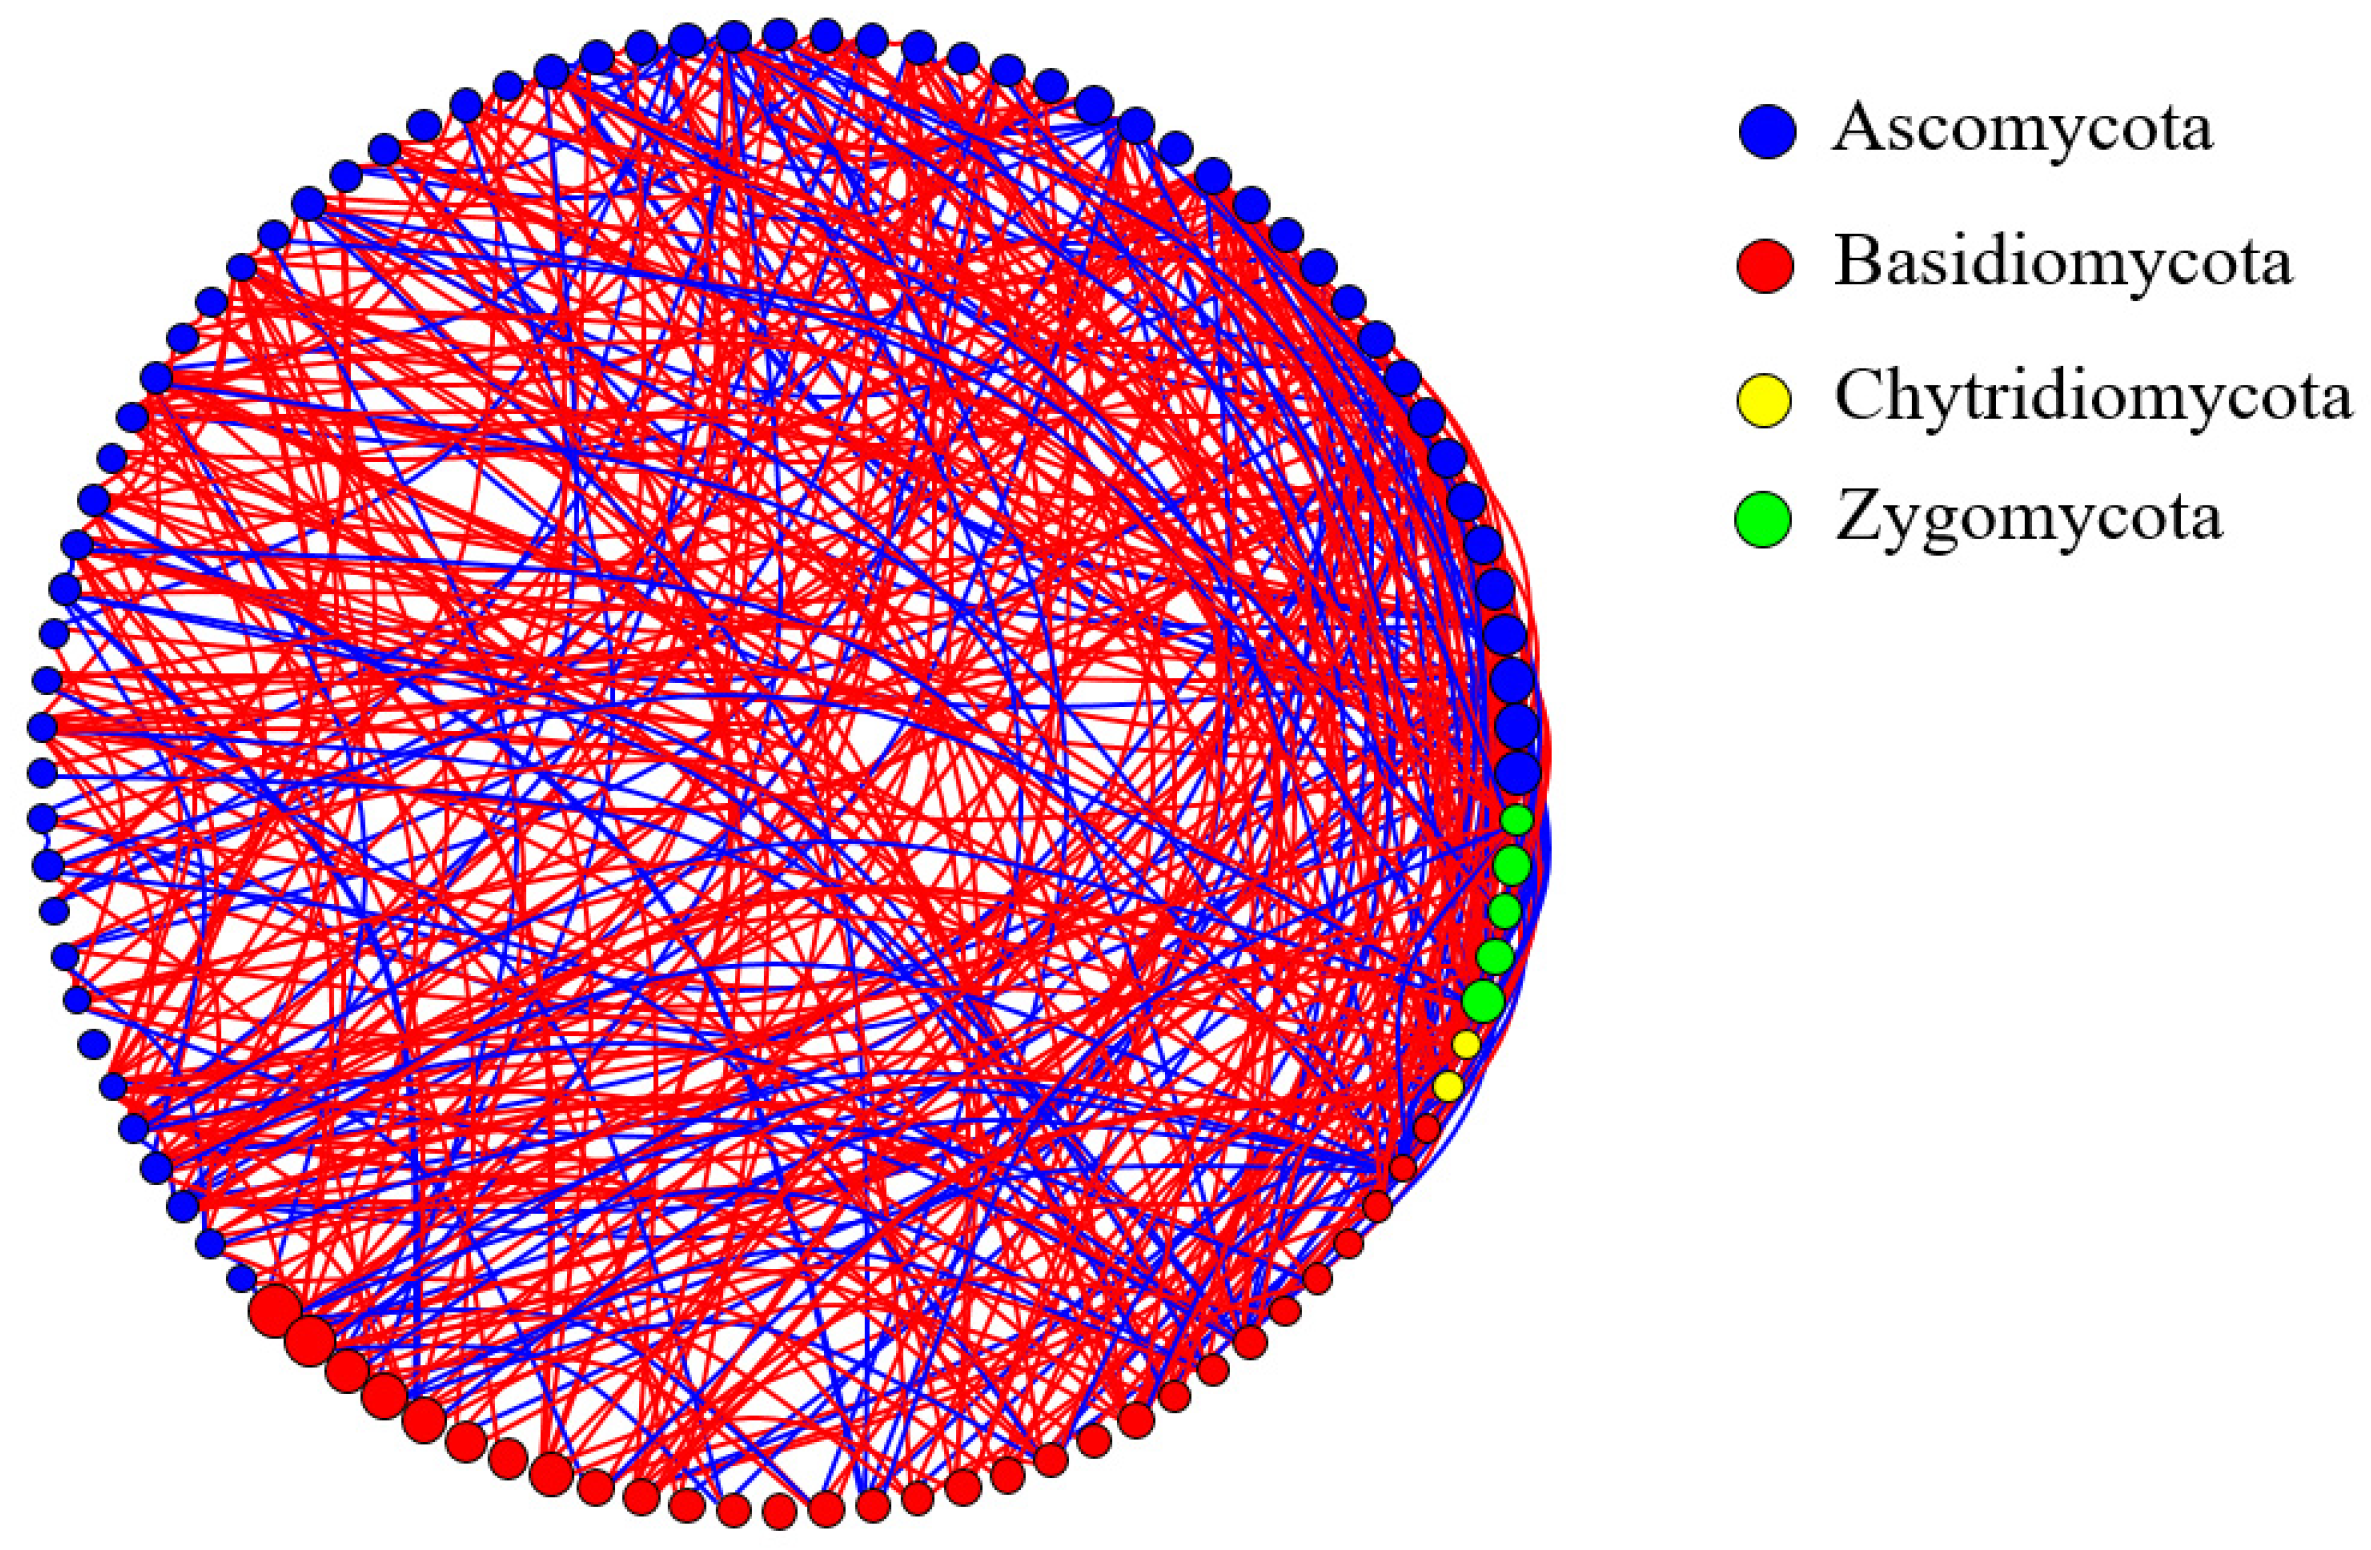
3.4. Co-Occurrence Network Analysis of Dominant Soil Fungal Communities

Overall, the biological network diagram showed the complex relationship composed of highly interconnected phylum (Figure 7). The OTU structure of the soil fungal microbial network resembled densely linked modules. The lines connecting nodes in the network graph represented how different elements were related, with red lines indicating a positive correlation and blue lines indicating a negative correlation. The number of edges of all nodes was 434, including 315 positive correlation edges and 119 negative correlation edges, accounting for 72.6% and 27.4%, respectively. This observation suggested that the dominant soil fungal communities at various elevations display a distinct modular structure. The average path length between all the nodes was 2.78, the longest distance was 6 edges, the network clustering coefficient was 0.42, and the modularity index was 0.4.

4. Discussion

4.1. Composition and Diversity of Soil Fungal Communities at Various Elevations

Exploring the diversity of soil fungal communities offers valuable insights into the changes in soil traits and the dynamics of plant communities. The α diversity index of soil fungi along the elevational gradient of Daiyun Mountain showed a single peak trend, but there was no significant difference. It was inconsistent with the pattern of the monotonous decline of the soil fungal α diversity found in Mount Kilimanjaro, East Africa [28]. This shared similarities with the patterns of soil fungal α diversity changes in Guanshan National Nature Reserve [29]. Such variations highlighted the influence of regional environmental conditions on the elevational distribution patterns of soil fungi.
The soil fungal community exhibited a pronounced scale effect with changes in elevations in Daiyun Mountain. When the soil microenvironment varied along different elevations, soil fungi tended to select the soil conditions most conducive to their survival [4]. Our study suggested that the dominant phylum within the soil fungal community in Daiyun Mountain was mainly Basidiomycetes, Ascomycetes and Zygomycetes, which was consistent with the previous study. Basidiomycota were representatives of saprophytic or symbiotic organisms, participating in the decomposition of soil organic matter and nutrient cycling [28,30]. However, disparities existed with other studies, especially regarding the selection of soil environments for fungi survival under varying elevation conditions. These differences could be attributed to the variations in geographical locations and plant diversity. A significant layer of leaf litter covered the forest soil surface, especially in mid-elevation forest ecosystems with high plant diversity [30,31]. This stimulated root metabolism and led to a richer diversity of organic compounds in the soil [32]. Consequently, it promoted the proliferation of Basidiomycota. Ascomycota played a pivotal role in decomposing refractory organic matter and cycling soil nutrients [33]. Our findings indicated that distinct vegetation significantly influence the composition and diversity of soil microbial communities [34]. Regions with abundant in vegetation types provide diverse and easily degradable residues. These served as the preferred source of soil organic matter for dominant Ascomycota [35]. The interaction between plant richness and soil adaptability influenced soil microbial diversity. This confirmed the findings of Eleonora et al. [36]. In summary, our study emphasized the impact of Ascomycota and Basidiomycota on the soil fungal community. As dominant groups, they actively engage in nutrient cycling and utilization within the Daiyun Mountain forest ecosystem.

4.2. Factors Influencing the Soil Fungal Community along an Elevational Gradient

Climate and environmental conditions were reported as the primary factors affecting microbial elevation patterns [37]. Previous studies emphasized the main role of soil properties (such as pH value and soil carbon content) [38] and ignored the role of the microclimate in shaping the elevation model of the soil fungal community. Temperature, as a crucial component of the microclimate, predominantly accounts for variations in soil fungal diversity and alterations in community structure [4]. Firstly, temperature could directly alter the metabolic rate and biochemical processes of microbial communities. Secondly, it influences microorganisms by modulating the availability of other essential nutrients [39,40]. Changes in microbial assemblages with different physiological characteristics led to changes in metabolic efficiency at the community level along an elevational gradient [41,42]. In the soil fungal community of Daiyun Mountain, the proportion of Ascomycota increased with the elevation in soil temperature, whereas other prevalent soil fungi (such as Basidiomycota and Zygomycota) were not clear. Similarly, a worldwide investigation into surface soil microorganisms also indicated that the precipitation, soil pH, and low temperature cause extreme pressure on the soil fungal diversity, thus reducing their activities and diversity [39]. The dbRDA analysis revealed that soil pH, the mean annual soil moisture, and the mean annual soil temperature exerted a significant influence on the soil fungal community. This finding further validated the association between the soil fungal niche differentiation and environmental factors. Previous studies primarily focused on the impact of soil physical and chemical properties on soil fungal communities [16,17,18,19,28]. In contrast, our study further elucidated the critical role of microclimate factors, specifically temperature, in governing soil fungal diversity and community structure [29,33,39].
Furthermore, our study highlighted the influence of the soil microclimate and environmental factors on the local-scale diversity of soil fungal communities along diverse elevations [31,38,39]. This matched the observations from other studies, highlighting the importance of soil microenvironments [29,30,31,39]. It revealed potential key factors that shaped the structure and composition of soil microbial communities in subtropical forests.

4.3. Dominant Soil Fungal Community and Network Interaction Analysis

The soil microbial community network topology with higher average degrees and clustering coefficients tended to have lower average path lengths, which indicates stronger interactions between soil fungal communities [42,43]. Understanding the interaction between soil microbial groups was crucial for unveiling the dynamic changes in the complex microbial community structure. Among the soil fungal communities on the southern slope of Daiyun Mountain, Ascomycota and Basidiomycota were the dominant phylum, followed by Chytridiomycota. Ascomycota and Basidiomycota were both dominant phylum, actively engage in soil fungal community dynamics. It includes nutrient cycling and organic matter decomposition and have a strong connection with other soil fungal taxa in the microbial network [44]. Some studies suggested that Ascomycota exhibits greater resilience to environmental pressures, enabling it to allocate more resources and, thereby, enhance its dominance in the soil [15,45,46]. Furthermore, dominant soil fungi showed a strong correlation with soil-available phosphorus. Specifically, Ascomycota was highly active under the conditions of a high phosphorus content. This activity may explain why Ascomycota is a key taxon. Chytridiomycota was the main decomposer of lignocellulose and refractory organic carbon. Mixed litter could influence the arrangement and interactions within soil fungal communities in a specific manner. This could be attributed to the increased levels of carbon and nutrients present in mixed litter, which increases in nutrient supply to soil fungal communities and accelerated decomposition through complementary effects [45,47]. Chytridiomycota tended to utilize refractory organic matter, leading to a diminished role within the microbial network. Furthermore, we observed that 72.58% of the total chain number in the soil fungal communities were positive chains. This highlights the crucial role of mutualism in shaping the structure of soil fungal communities. This phenomenon could be associated with the increased levels of soil organic matter. Environmental disturbance increases the instability of the microbial community structure. Soil nutrients are the main factor affecting the interaction between microorganisms, and rich resources reduce the negative interaction between microorganisms [48,49,50]. Therefore, there are many positive interactions among the phylum of the soil fungal community in Daiyun Mountain.

5. Conclusions

By studying the composition and structure of the soil fungal community along an elevational gradient in subtropical forests of China, we elucidated the changes in environmental factors with elevations and their impact on the soil fungal community. We found that the dominant soil fungi were Basidiomycota, Ascomycota and Zygomycota. The soil fungal community at different elevations showed a single peak trend along the elevational gradient. Microclimatic and environmental factors significantly influenced the variations in the forest soil fungal community. This influence was mainly driven by the mean annual soil temperature and moisture, soil pH and available phosphorus. Our study reveals the sensitivity of soil fungal communities in subtropical forests along an elevational gradient, highlighting the crucial role of the microclimate and environmental factors in this process. This contributes to a deeper understanding of how environmental factors shape soil biodiversity and ecosystem functioning. Future efforts could focus on the impact of elevational gradients on plant-soil fungal symbiotic relationships, specifically revealing the soil fungal coexistence mechanism and the influence of plant-soil feedback along elevational gradients.

Supplementary Materials

The following supporting information can be downloaded at: https://www.mdpi.com/article/10.3390/f15040643/s1, Figure S1. α-diversity index (Observed species index, Shannon-Wiener index, chao1 index, ACE and PD index) of soil fungal community along elevations; Figure S2. The heatmap illustrated the clustering of species relative abundance in dominant fungal communities at the class levels along the elevational gradient; Figure S3. The heatmap illustrated the clustering of species abundance in dominant fungal communities at the family levels along the elevational gradient; Figure S4. The heatmap illustrated the clustering of species abundance in dominant fungal communities at the genus levels along the elevational gradient; Table S1. Basic information of sample plots in Daiyun Mountain; Table S2. The results of the distance-based redundancy analysis (dbRDA) based on backward-model selection to indicate the influence of environment variables on soil fungal community dissimilarity structure; Table S3. Basic information of forest stand in Daiyun Mountain.

Author Contributions

Conceptualization, formal analysis, writing—original draft, and writing—review and editing, Z.L.; Conceptualization, methodology, formal analysis, conducted the writing, and original draft manuscript editing, Z.W.; Review and editing of the original draft manuscript, W.Z.; Investigation, writing—review and editing of the original draft manuscript, and formal analysis, J.Z.; Investigation, writing—review and editing of the original draft manuscript, B.C.; Investigation, writing—review and editing of the original draft manuscript, L.J.; Investigation, supervised, W.L.; Investigation, writing—review and editing the original draft manuscript, D.X.; Conceptualized, supervised, and contributed to writing—review and editing, and funding acquisition, J.L.; Conceptualized, investigation, methodology, supervised, and contributed to writing—review and editing, and funding acquisition, Z.H. All authors have read and agreed to the published version of the manuscript.

Funding

This work was supported by the National Natural Science Foundation of China [grant numbers 31700550]; the Fujian Province Forestry Science and Technology Project of China [grant number 2022FKJ11]; and the Special Fund Project for Science and Technology Innovation of Fujian Agriculture and Forestry University [grant number KFb22030XA].

Data Availability Statement

The data presented in this study are available on request from the corresponding author. The data are not publicly available due to privacy or ethical restrictions.

Acknowledgments

We wish to express gratitude for the invaluable support received from the Administration Bureau of the Daiyun Mountain National Nature Reserve in Quanzhou City, Fujian Province, which generously provided experimental materials and research sites. Special thanks are extended to Xinguang Gu, Cong Xing, and Xuelin Wang for their dedicated contributions to the experimental work. The author sincerely acknowledges the thoughtful and constructive feedback provided by the reviewers during the drafting of the manuscript.

Conflicts of Interest

The authors declare no conflict of interest.

References

  1. Chen, Y.L.; Deng, Y.; Ding, J.Z.; Hu, H.W.; Xu, T.L.; Li, F.; Yang, G.B.; Yang, Y.H. Distinct microbial communities in the active and permafrost layers on the Tibetan Plateau. Mol. Ecol. 2017, 26, 6608–6620. [Google Scholar] [CrossRef] [PubMed]
  2. Cui, Y.X.; Bing, H.J.; Fang, L.C.; Wu, Y.H.; Yu, J.L.; Shen, G.T.; Jiang, M.; Wang, X.; Zhang, X.C. Diversity patterns of the rhizosphere and bulk soil microbial communities along an elevational gradient in an alpine ecosystem of the eastern Tibetan Plateau. Geoderma 2019, 338, 118–127. [Google Scholar] [CrossRef]
  3. Liu, D.; Wang, H.L.; An, S.S.; Bhople, P.; Davlatbekov, F. Geographic distance and soil microbial biomass carbon drive biogeographical distribution of fungal communities in Chinese Loess Plateau soils. Sci. Total Environ. 2019, 660, 1058–1069. [Google Scholar] [CrossRef]
  4. Margesin, R.; Niklinska, M.A. Elevation gradients: Microbial indicators of climate change? Front. Microbiol. 2019, 10, 2405. [Google Scholar] [CrossRef]
  5. Bahram, M.; Hildebrand, F.; Forslund, S.K.; Anderson, J.L.; Soudzilovskaia, N.A.; Bodegom, P.M.; Bengtsson-Palme, J.; Anslan, S.; Coelho, L.P.; Harend, H.; et al. Structure and function of the global topsoil microbiome. Nature 2018, 560, 233–237. [Google Scholar] [CrossRef] [PubMed]
  6. Siles, J.A.; Cajthaml, T.; Filipová, A.; Minerbi, S.; Margesin, R. Altitudinal, seasonal and interannual shifts in microbial communities and chemical composition of soil organic matter in Alpine forest soils. Soil Biol. Biochem. 2017, 112, 1–13. [Google Scholar] [CrossRef]
  7. Zhong, Z.M.; Zhang, G.Y.; Fu, G. Effect of Experiment Warming on Soil Fungal Community of Medicago sativa, Elymus nutans and Hordeum vulgare in Tibet. J. Fungi 2023, 9, 885. [Google Scholar] [CrossRef]
  8. Li, G.X.; Xu, G.R.; Shen, C.C.; Tang, Y.; Zhang, Y.X.; Ma, K.M. Contrasting elevational diversity patterns for soil bacteria between two ecosystems divided by the treeline. Sci. China—Life Sci. 2016, 59, 1177–1186. [Google Scholar] [CrossRef]
  9. Ren, C.J.; Liu, W.C.; Zhao, F.Z.; Zhong, Z.K.; Deng, J.; Han, X.H.; Yang, G.H.; Feng, Y.Z.; Ren, G.X. Soil bacterial and fungal diversity and compositions respond differently to forest development. Catena 2019, 181, 104071. [Google Scholar] [CrossRef]
  10. Crowther, T.W.; Hoogen, J.v.D.; Wan, J.; Mayes, M.A.; Keiser, A.D.; Mo, L.; Averill, C.; Maynard, D.S. The global soil community and its influence on biogeochemistry. Science 2019, 365, eaav0550. [Google Scholar] [CrossRef]
  11. Looby, C.I.; Martin, P.H. Diversity and function of soil microbes on montane gradients: The state of knowledge in a changing world. FEMS Microbiol. Ecol. 2020, 96, fiaa122. [Google Scholar] [CrossRef] [PubMed]
  12. Schoenborn, A.A.; Yannarell, S.M.; MacVicar, C.T.; Barriga-Medina, N.N.; Bonham, K.S.; Leon-Reyes, A.; Riveros-Iregui, D.; Klepac-Ceraj, V.; Shank, E.A. Microclimate is a strong predictor of the native and invasive plant-associated soil microbiome on San Cristóbal Island, Galápagos archipelago. Environ. Microbiol. 2023, 25, 1377–1392. [Google Scholar] [CrossRef] [PubMed]
  13. Frąc, M.; Jędryczka, M.; Hannula, E.S. Editorial: Soil fungal biodiversity for plant and soil health, volume II. Front. Microbiol. 2023, 14, 1170312. [Google Scholar] [CrossRef] [PubMed]
  14. Tedersoo, L.; Bahram, M.; Põlme, S.; Kõljalg, U.; Yorou, N.S.; Wijesundera, R.; Ruiz, L.V.; Vasco–Palacios, A.M.; Thu, P.Q.; Suija, A.; et al. Global diversity and geography of soil fungal. Science 2014, 346, 1256688. [Google Scholar] [CrossRef] [PubMed]
  15. Sui, X.; Li, M.S.; Frey, B.; Dai, G.H.; Yang, L.B.; Li, H.M. Effect of elevation on composition and diversity of fungal in the rhizosphere of a population of Deyeuxia angustifolia on Changbai Mountain, northeastern China. Front. Microbiol. 2023, 14, 1087475. [Google Scholar] [CrossRef] [PubMed]
  16. Hernández-Cáceres, D.; Stokes, A.; Angeles–Alvarez, G.; Abadie, J.; Anthelme, F.; Bounous, M.; Freschet, G.T.; Roumet, C.; Weemstra, M.; Merino–Martín, L.; et al. Vegetation creates microenvironments that influence soil microbial activity and functional diversity along an elevation gradient. Soil Biol. Biochem. 2021, 165, 108485. [Google Scholar] [CrossRef]
  17. Jiang, L.; Zhang, X.; Zhu, J.; Wei, X.; Chen, B.; Liu, J.F.; Zheng, S.Q.; He, Z.S. Environmental heterogeneity determines beta diversity and species turnover for woody plants along an elevation gradient in subtropical forests of China. For. Res. 2023, 3, 26. [Google Scholar] [CrossRef]
  18. He, Z.S.; Wang, Z.W.; Zhu, J.; Chen, J.J.; Gu, X.G.; Jiang, L.; Chen, B.; Wu, Z.Y.; Liu, J.F.; Chen, W.W. Characteristics of microbial functional diversity and its influencing factors of forest soils at different elevations on the southern slope of Daiyun Mountain. Acta Ecol. Sin. 2022, 42, 3504–3515. (In Chinese) [Google Scholar]
  19. Chen, R.Z.; Zhu, J.; Jiang, L.; Liu, L.; Gao, C.; Chen, B.; Xu, D.W.; Liu, J.F.; He, Z.S. Soil phosphorus availability controls deterministic and stochastic processes of soil microbial community along an elevational gradient in subtropical forests. Forests 2023, 14, 1475. [Google Scholar] [CrossRef]
  20. Luo, X.Y.; Li, Q.; Huang, X.L. DNA barcode reference dataset for flower-visiting insects in Daiyun Mountain National Nature Reserve. Biodivers. Sci. 2023, 31, 23236. (In Chinese) [Google Scholar]
  21. Su, S.J.; Liu, J.F.; He, Z.S.; Zheng, S.Q.; Hong, W.; Xu, D.W. Ecological species groups and interspecific association of dominant tree species in Daiyun Mountain National Nature Reserve. J. Mt. Sci. 2015, 12, 637–646. [Google Scholar] [CrossRef]
  22. Wild, J.; Kopecký, M.; Macek, M.; Šanda, M.; Jankovec, J.; Haase, T. Climate at ecologically relevant scales: A new temperature and soil moisture logger for long-term microclimate measurement. Agric. For. Meteorol. 2019, 268, 40–47. [Google Scholar] [CrossRef]
  23. Wang, X.L.; Liu, J.F.; He, Z.S.; Xing, C.; Zhu, J.; Gu, X.G.; Lan, Y.Q.; Wu, Z.Y.; Liao, P.C.; Zhu, D.H. Forest gaps mediate the structure and function of the soil microbial community in a Castanopsis kawakamii forest. Ecol. Indic. 2021, 122, 107288. [Google Scholar] [CrossRef]
  24. State Forestry Administration. Forest Soil Analysis Method; China Standards Press: Beijing, China, 1999. [Google Scholar]
  25. R Core Team. R: A Language and Environment for Statistical Computing (Version 4.2.3); R Foundation for Statistical Computing: Vienna, Austria. Available online: https://www.R-project.org/ (accessed on 26 June 2023).
  26. Anderson, M.J. Permutational Multivariate Analysis of Variance (PERMANOVA); Balakrishnan, N., Colton, T., Everitt, B., Piegorsch, W., Ruggeri, F., Teugels, J.L., Eds.; John Wiley & Sons, Ltd.: Hoboken, NJ, USA, 2017; pp. 1–15. [Google Scholar]
  27. Albano, A.; García–Lapresta, J.L.; Plaia, A.; Sciandra, M. Clustering alternatives in preference-approvals via novel pseudometrics. Stat. Methods Appl. 2023, 1–27. [Google Scholar] [CrossRef]
  28. Shen, C.C.; Gunina, A.; Luo, Y.; Wang, J.J.; He, J.Z.; Kuzyakov, Y.; Hemp, A.; Classen, A.T.; Ge, Y. Contrasting patterns and drivers of soil bacterial and fungal diversity across a mountain gradient. Environ. Microbiol. 2020, 22, 3287–3301. [Google Scholar] [CrossRef] [PubMed]
  29. Ma, L.W.; Liu, L.; Lu, Y.S.; Chen, L.; Zhang, Z.C.; Zhang, H.W.; Wang, X.R.; Shu, L.; Yang, Q.P.; Song, Q.N.; et al. When microclimates meet soil microbes: Temperature controls soil microbial diversity along an elevational gradient in subtropical forests. Soil Biol. Biochem. 2022, 166, 108566. [Google Scholar] [CrossRef]
  30. Nie, S.A.; Lei, X.M.; Zhao, L.X.; Brookes, P.C.; Wang, F.; Chen, C.R.; Yang, W.H.; Xing, S.H. Fungal communities and functions response to long-term fertilization in paddy soils. Appl. Soil Ecol. 2018, 130, 251–258. [Google Scholar] [CrossRef]
  31. Zhang, Y.; Li, C.; Wang, M.L. Linkages of C: N: P stoichiometry between soil and leaf and their response to climatic factors along elevational gradients. J. Soils Sediments 2019, 19, 1820–1829. [Google Scholar] [CrossRef]
  32. Thakur, M.P.; Milcu, A.; Manning, P.; Niklaus, P.A.; Roscher, C.; Power, S.; Reich, P.B.; Scheu, S.; Tilman, D.; Ai, F.X.; et al. Plant diversity drives soil microbial biomass carbon in grasslands irrespective of global environmental change factors. Glob. Change Biol. 2015, 21, 4076–4085. [Google Scholar] [CrossRef]
  33. Sterkenburg, E.; Bahr, A.; Durling, M.B.; Clemmensen, K.E.; Lindahl, B.D. Changes in fungal communities along a boreal forest soil fertility gradient. New Phytol. 2015, 207, 1145–1158. [Google Scholar] [CrossRef]
  34. Tong, S.; Cao, G.C.; Zhang, Z.; Zhang, J.H.; Yan, X. Soil microbial community diversity and distribution characteristics under three vegetation types in the Qilian Mountains, China. J. Arid Land 2023, 15, 359–376. [Google Scholar] [CrossRef]
  35. Lundell, T.K.; Mäkelä, M.R.; Hildén, K. Lignin-modifying enzymes in filamentous basidiomycetes–ecological, functional and phylogenetic review. J. Basic Microbiol. 2010, 50, 5–20. [Google Scholar] [CrossRef] [PubMed]
  36. Egidi, E.; Delgado–Baquerizo, M.; Plett, J.M.; Wang, J.; Eldridge, D.J.; Bardgett, R.D.; Maestre, F.T.; Singh, B.K. A few Ascomycota taxa dominate soil fungal communities worldwide. Nat. Commun. 2019, 10, 2369. [Google Scholar] [CrossRef]
  37. Donhauser, J.; Frey, B. Alpine soil microbial ecology in a changing world. FEMS Microbiol. Ecol. 2018, 94, fiy099. [Google Scholar] [CrossRef]
  38. Siles, J.A.; Margesin, R. Abundance and diversity of bacterial, archaeal, and fungal communities along an elevationtudinal gradient in alpine forest soils: What are the driving factors? Microb. Ecol. 2016, 72, 207–220. [Google Scholar] [CrossRef]
  39. Peng, S.L.; Ge, Z.W.; Liu, G.C.; Mao, L.F. Environmental drivers of soil microbial activity and diversity along an elevational gradient. J. Mt. Sci. 2022, 19, 1336–1347. [Google Scholar] [CrossRef]
  40. Zhao, W.; Wang, D.D.; Huang, K.C.; Liu, S.; Reyila, M.; Sun, Y.F.; Li, J.N.; Cui, B.K. Seasonal variation in the soil fungal community structure of Larix gmelinii forests in Northeast China. Front. Microbiol. 2023, 14, 1106888. [Google Scholar] [CrossRef]
  41. Feng, J.; Zeng, X.M.; Zhang, Q.G.; Zhou, X.Q.; Liu, Y.R.; Huang, Q.Y. Soil microbial trait-based strategies drive metabolic efficiency along an elevation gradient. ISME Commun. 2021, 1, 71. [Google Scholar] [CrossRef] [PubMed]
  42. Banerjee, S.; Walder, F.; Büchi, L.; Meyer, M.; Held, A.Y.; Gattinger, A.; Keller, T.; Charles, R.; Van der Heijden, M.G.A. Agricultural intensification reduces microbial network complexity and the abundance of keystone taxa in roots. ISME J. 2019, 13, 1722–1736. [Google Scholar] [CrossRef]
  43. Yang, Y.Z.; Gao, Y.C.; Huang, X.N.; Ni, P.; Wu, Y.N.; Deng, Y.; Zhan, A.B. Adaptive shifts of bacterioplankton communities in response to nitrogen enrichment in a highly polluted river. Environ. Pollut. 2018, 245, 290–299. [Google Scholar] [CrossRef]
  44. Zhang, J.X.; Yang, Y.Y.; Zhao, L.; Li, Y.Z.; Xie, S.G.; Liu, Y. Distribution of sediment bacterial and archaeal communities in plateau freshwater lakes. Appl. Microbiol. Biotechnol. 2014, 99, 3291–3302. [Google Scholar] [CrossRef] [PubMed]
  45. Zheng, Q.; Hu, Y.T.; Zhang, S.S.; Noll, L.; Böckle, T.; Dietrich, M.; Herbold, C.W.; Eichorst, S.A.; Woebken, D.; Richter, A.; et al. Soil multifunctionality is affected by the soil environment and by microbial community composition and diversity. Soil Biol. Biochem. 2019, 136, 107521. [Google Scholar] [CrossRef] [PubMed]
  46. Ni, Y.Y.; Yang, T.; Zhang, K.P.; Shen, C.C.; Chu, H.Y. Fungal communities along a small-scale elevational gradient in an alpine tundra are determined by soil carbon nitrogen ratios. Front. Microbiol. 2018, 9, 1815. [Google Scholar] [CrossRef]
  47. Liu, J.Y.; Ding, C.J.; Zhang, W.X.; Wei, Y.W.; Zhou, Y.B.; Zhu, W.X. Litter mixing promoted decomposition rate through increasing diversities of phyllosphere microbial communities. Front. Microbiol. 2022, 13, 1009091. [Google Scholar] [CrossRef] [PubMed]
  48. Wang, W.T.; Sun, Z.H.; Mishra, S.; Xia, S.W.; Lin, L.X.; Yang, X.D. Body size determines multitrophic soil microbiota community assembly associated with soil and plant attributes in a tropical seasonal rainforest. Mol. Ecol. 2022, 32, 6294–6303. [Google Scholar] [CrossRef] [PubMed]
  49. de Menezes, A.B.; Richardson, A.E.; Thrall, P.H. Linking fungal–bacterial co-occurrences to soil ecosystem function. Curr. Opin. Microbiol. 2017, 37, 135–141. [Google Scholar] [CrossRef]
  50. Bayranvand, M.; Akbarinia, M.; Salehi Jouzani, G.; Gharechahi, J.; Kooch, Y.; Baldrian, P. Composition of soil bacterial and fungal communities in relation to vegetation composition and soil characteristics along an elevational gradient. FEMS Microbiol. Ecol. 2021, 97, fiaa201. [Google Scholar] [CrossRef]
Figure 1. The dominant soil fungal composition at the phylum level along the elevational gradient.
Forests 15 00643 g001
Figure 2. Soil fungal α-diversity (Simpson’s index) along the elevational gradient. The solid blue line represents the fitted curve of soil fungal α-diversity and seven elevations, the blue area represents the confidence interval of 95%, and the black dots represent observed data points. * indicates p < 0.05.
Forests 15 00643 g002
Figure 3. Redundancy discrimination analysis (dbRDA) of soil fungal communities along the elevational gradient.
Forests 15 00643 g003
Figure 4. Interpretation rate of different factors to the β-diversity of dominant soil fungal communities. The significance level was * p < 0.05; ** p < 0.01; *** p < 0.001. Notes: AP: soil available phosphorus; MATair: mean annual air temperature; MATsoil: mean annual soil temperature; MAMsoil: mean annual soil moisture; soilTempMin: minimum soil temperature; ELE: elevation; SWC: soil water content; TN: soil total nitrogen; SLO: slope; HN: hydrolysable nitrogen; ST: soil temperature; TK: soil total potassium; TC: soil total carbon; TP: soil total phosphorus; and pH: soil pH.
Forests 15 00643 g004
Figure 5. Redundancy discrimination analysis (dbRDA) of soil fungal communities along the elevational gradient. Note: ST: soil temperature; SWC: soil water content; TK: soil total potassium; TN: soil total nitrogen; AP: soil available phosphorus; MATsoil: mean annual soil temperature; MAMsoil: mean annual soil moisture; and pH: soil pH.
Forests 15 00643 g005
Figure 6. Tests of significance between the environmental factors and dominant soil fungal communities at the phylum level. Note: The green line, red line, and blue line represent the negative impact, positive impact, and no significant impact, respectively, and the abscissa represents a 95% confidence interval. MATair: mean annual air temperature; MATsoil: mean annual soil temperature; soilTempMin: minimum soil temperature; ELE: elevation; SWC: soil water content; SLO: slope; ST: soil temperature; TN: soil total nitrogen; TK: soil total potassium; TC: soil total carbon; TP: soil total phosphorus; pH: soil pH; and AP: soil available phosphorus.
Forests 15 00643 g006
Figure 7. The co-occurrence network analysis of dominant soil fungal along the elevational gradient. Larger circles indicate higher relative abundance. Note: Red lines represent positive correlation, while blue lines represent negative correlation.
Forests 15 00643 g007
Disclaimer/Publisher’s Note: The statements, opinions and data contained in all publications are solely those of the individual author(s) and contributor(s) and not of MDPI and/or the editor(s). MDPI and/or the editor(s) disclaim responsibility for any injury to people or property resulting from any ideas, methods, instructions or products referred to in the content.

