Article

The Short-Term Effects of Heavy Thinning on Selected Soil Carbon Pools and Microbial Activity in a Young Aleppo Pine Forest

1
Research Group in Forest Science and Technology (Re-ForeST), Research Institute of Water and Environmental Engineering (IIAMA), Universitat Politècnica de València, Camí de Vera s/n, 46022 Valencia, Spain
2
Independent Researcher, 46022 Valencia, Spain
3
Research Group in Forest Science and Technology (Re-ForeST), Hydraulic Engineering and Environment Department, Universitat Politècnica de València, Camí de Vera s/n, 46022 Valencia, Spain
*
Author to whom correspondence should be addressed.
Forests 2024, 15(4), 658; https://doi.org/10.3390/f15040658
Submission received: 29 February 2024 / Revised: 28 March 2024 / Accepted: 2 April 2024 / Published: 4 April 2024
(This article belongs to the Special Issue Forest Vegetation and Soils: Interaction, Management and Alterations)

Abstract

:
Pinus halepensis Miller is a widespread tree species in the western Mediterranean basin, where very dense monospecific stands can be found, especially in natural regeneration after forest fires. Silvicultural thinning can reduce the competition of trees for natural resources and favour their development, although its effect depends on the habitat. The present study aims to know the effects on the soil at the physicochemical and microbiological levels after a heavy thinning in a young pine forest stand with a high stocking density. The stand is on a slope where the soil depth tends to decrease with altitude, and shows changes in its physicochemical properties between the upper and lower zones. Several soil carbon fractions (i.e., soil organic carbon (SOC), water-soluble organic carbon (WSOC), and microbial biomass carbon (MBC)), microbial activity (basal soil respiration (BSR)) and enzyme activities (acid phosphatase (AP) and urease (UA)) were analysed at specific dates over a period of about five years after a heavy thinning. The changes in organic matter content were abrupt in the slope, conditioning the observed differences. It is highlighted that the SOC and WSOC contents in the mineral soil were 2.5- and 3.5-fold significantly higher, respectively, in the upper shallow zone compared to the lower deeper zone. This was also reflected in significantly higher levels of gravimetric water content (GWC) and MBC (both about 1.4-fold higher), with higher levels of BSR and UA, and 2.5-fold significantly higher levels of AP. As a result, most of the properties studied showed no significant differences between the thinning treatment and the untreated control. Results varying between dates, with a strong dependence on climate (soil temperature and humidity) of WSOC and UA. It can be concluded that the heavy thinning applied in this short-term case study favoured the growth conditions of the pine without negatively affecting the soil properties studied.

1. Introduction

Aleppo pine (Pinus halepensis Mill.) is the most common pine species in the western Mediterranean basin [1], and is well adapted to climatic constraints, particularly water scarcity and high seasonal temperature variation [2]. In fact, during the 20th century, it was the most widely used species in the reforestation of semi-arid areas, with a total area of approximately 2 million hectares in Spain (i.e., 11.37% of the forest area) [3]. Despite the good climatic adaptation of this species, the reforestation of Aleppo pine has been controversial [4]. The high temperatures and low humidity typical of the semi-arid climate, together with the presence of sometimes dense fuel stands, make this species highly vulnerable to fire [5]. A further handicap is that post-fire regeneration of this species is often hyper-dense at a young age, which usually leads to competition between trees for light and soil resources [3,6,7].
Thinning is a widely used forest management technique that reduces stand density and thus competition for natural resources [8]. Recently, the effects of thinning on tree and shrub growth, biodiversity, carbon stocks, hydrological processes, soil physicochemical properties, soil microbial biomass and community structure, soil enzyme activities, and soil microclimate have been the subject of several comprehensive reviews and meta-analyses [9,10,11,12,13,14,15]. Among the results of these studies are that thinning can promote individual tree growth and alleviate drought stress by increasing the soil water availability to the remaining trees and by developing more extensive individual root systems over time, particularly in high-density stands that tend to have less developed root systems [16,17,18,19,20,21]. In fact, good thinning management can increase shrub and herb diversity [10,15,22]. These positive effects could be explained, at least in part, by the increase in soil temperature and soil moisture following moderate or heavy thinning [9,15,23]. However, some studies have also reported negative aspects of thinning. For example, the thinning effect of drought mitigation tends to decrease over time [24]. Yang et al. [25] found, in a meta-analysis, that forest thinning increased soil CO2 and N2O emissions and decreased CH4 uptake under certain climate conditions. In addition, the effects of thinning may vary depending on its intensity and the time elapsed since the treatment. Comparing the effects of high-density thinning with other thinning treatments or unthinned stands allows researchers and forest managers to assess the impacts of different thinning intensities on various aspects of forest ecology. Zhang et al. [14] suggested a moderate thinning treatment (amount of tree removal: 30%–60% intensity) for soil nutrient conservation benefits. However, for the specific case of P. halepensis in water-limited habitats, Calev et al. [17] indicate that high-intensity thinning treatments (≥50% basal area removal) are effective for treating excessively dense mature (>40 years) stands of P. halepensis under drought stress.
Forests play a key role in the carbon cycle, and represent the largest terrestrial carbon reservoir on Earth, with about 30%–70% of organic C stored below ground, making soil the largest terrestrial pool [26,27]. Soil organic carbon (SOC) is complex in terms of its composition and physical structure and, together with its fractions, is the subject of active research [9,28,29,30,31]. Forest thinning has a major impact on SOC pools, given the changes that occur in the soil microenvironment, organic matter inputs and microbial metabolism [13]. However, the heterogeneity of the thinning intensity, recovery stage and microclimatic conditions increases the uncertainty about the effects of thinning on the SOC and other carbon pools. On the positive side, changes in the SOC after thinning may be related to increased space and light for understorey growth, increased activity of soil microorganisms or residual tree roots, or decomposition of debris left on the forest floor or incorporated into the soil [9,11,15,32]. In fact, increases in SOC following thinning have been reported in several case studies. For example, Ma et al. [29] found that SOC increased in the short term after moderate thinning of Larix principis-rupprechtii plantations, suggesting that this could be due to changes in the labile carbon pool, as well as improved environmental conditions for microorganisms to decompose organic residues. Gong et al. [33] observed that moderate thinning increased SOC stocks more than other thinning intensities with significant differences after five years of recovery. However, some authors reported that soil organic carbon did not change after thinning [11,14,34]. Controversially, Yang et al. [35] stated that heavy thinning reduced SOC nine years after treatment, whereas low and moderate thinning did not change it.
SOC is usually divided into two main fractions: active C and stable C. Among the active SOC fractions are microbial biomass carbon (MBC) and water-soluble organic carbon (WSOC), which are readily mineralized and may reflect management practices, making them an indicator for assessing the quality of SOC pools [36]. WSOC is considered to be the most mobile and reactive organic carbon fraction and the most important carbon source for soil microorganisms [37]. Ma et al. [29] found that WSOC was mainly derived from partially decomposed plant litter, reflecting short-term nutrient storage and acting as a substrate for soil microbial activity. Thus, WSOC content may also vary with stand thinning. However, Chen et al. [38] did not observe differences in WSOC among different thinning treatments (low intensity thinning, high intensity thinning and control) seven years after thinning. It has been reported that the effect of thinning on MBC may also be influenced by thinning intensity, with some studies reporting that high-intensity thinning was the only variable that increased MBC [38,39]. Zhou et al. [11] found that thinning changed the microbial community structure, but not the total microbial biomass, suggesting that microorganisms adapt to thinning by changing the microbial community structure rather than by changing the microbial biomass. Recently, Zhang et al. [15] reported that thinning had positive effects on SOC, dissolved organic carbon and MBC, especially in the late stage (>6 years). In general, soil microbial respiration (BSR) can provide an estimate of soil microbial activity. It has been reported that, after thinning, soil respiration increases [14,40], decreases [41], or no change is observed [34]. Yang et al. [42] reported that these inconsistent results may be related to the fact that heterotrophic respiration and autotrophic respiration respond independently to thinning. Zhang et al. [9] reported that light and moderate thinning increased soil heterotrophic respiration in the early recovery phase (≤2 years after thinning) while heavy thinning had no significant effect. Microorganisms secrete soil enzymes (e.g., β-glucosidase, AP or UA) that promote C and N assimilation by plants. Variable results have also been reported for enzyme activity after thinning. For example, Zhou et al. [43] found that thinning inhibited or had no effect on C-degrading enzymes, but stimulated N- and P-degrading enzymes. In related research, Lull et al. [44] explain the relationship between enzyme activity, climate, and soil properties, and note that results may vary with thinning intensity and soil texture. In line with this, Zeng et al. [45] found that the effects of thinning on the activity of extracellular soil enzymes vary with time during the recovery of the forest after treatment. Therefore, the effect of thinning on carbon pools and microbiological activity can vary depending on different aspects such as climate, forest ecosystem (i.e., dominant species, stand age, etc.), thinning intensity, time elapsed since treatment, and soil properties, among others [9,15].
In Mediterranean forests, where soil fertility is low and climatic conditions can be harsh, the effects of thinning on carbon pools and microbial activity can vary greatly, depending on the habitat studied and the intensity of thinning applied. In this case study, we evaluated the short-term effects (1 to 5 years) of a high intensity thinning treatment (94% reduction in pine density) compared to a control treatment without thinning. The properties studied were gravimetric water content (GWC) and WSOC in the forest floor and mineral soil, and SOC, MBC, BSR, and AP and UA activities in mineral soil in two zones (zI and zII) with different soil properties in a semi-arid dense Aleppo pine forest. We hypothesised that, in the short term, soil properties, especially the labile pools of soil organic carbon, could change if heavy thinning was carried out. Thinning causes an opening of the stand, which can lead to an increase in soil temperature and soil water, and thus an increase in microbial activity that would accelerate the degradation of organic residues. In this experiment, the residues from the thinning were left on the forest floor. In addition, it should be noted that the dead roots of pine trees can act as a source of organic carbon.

2. Materials and Methods

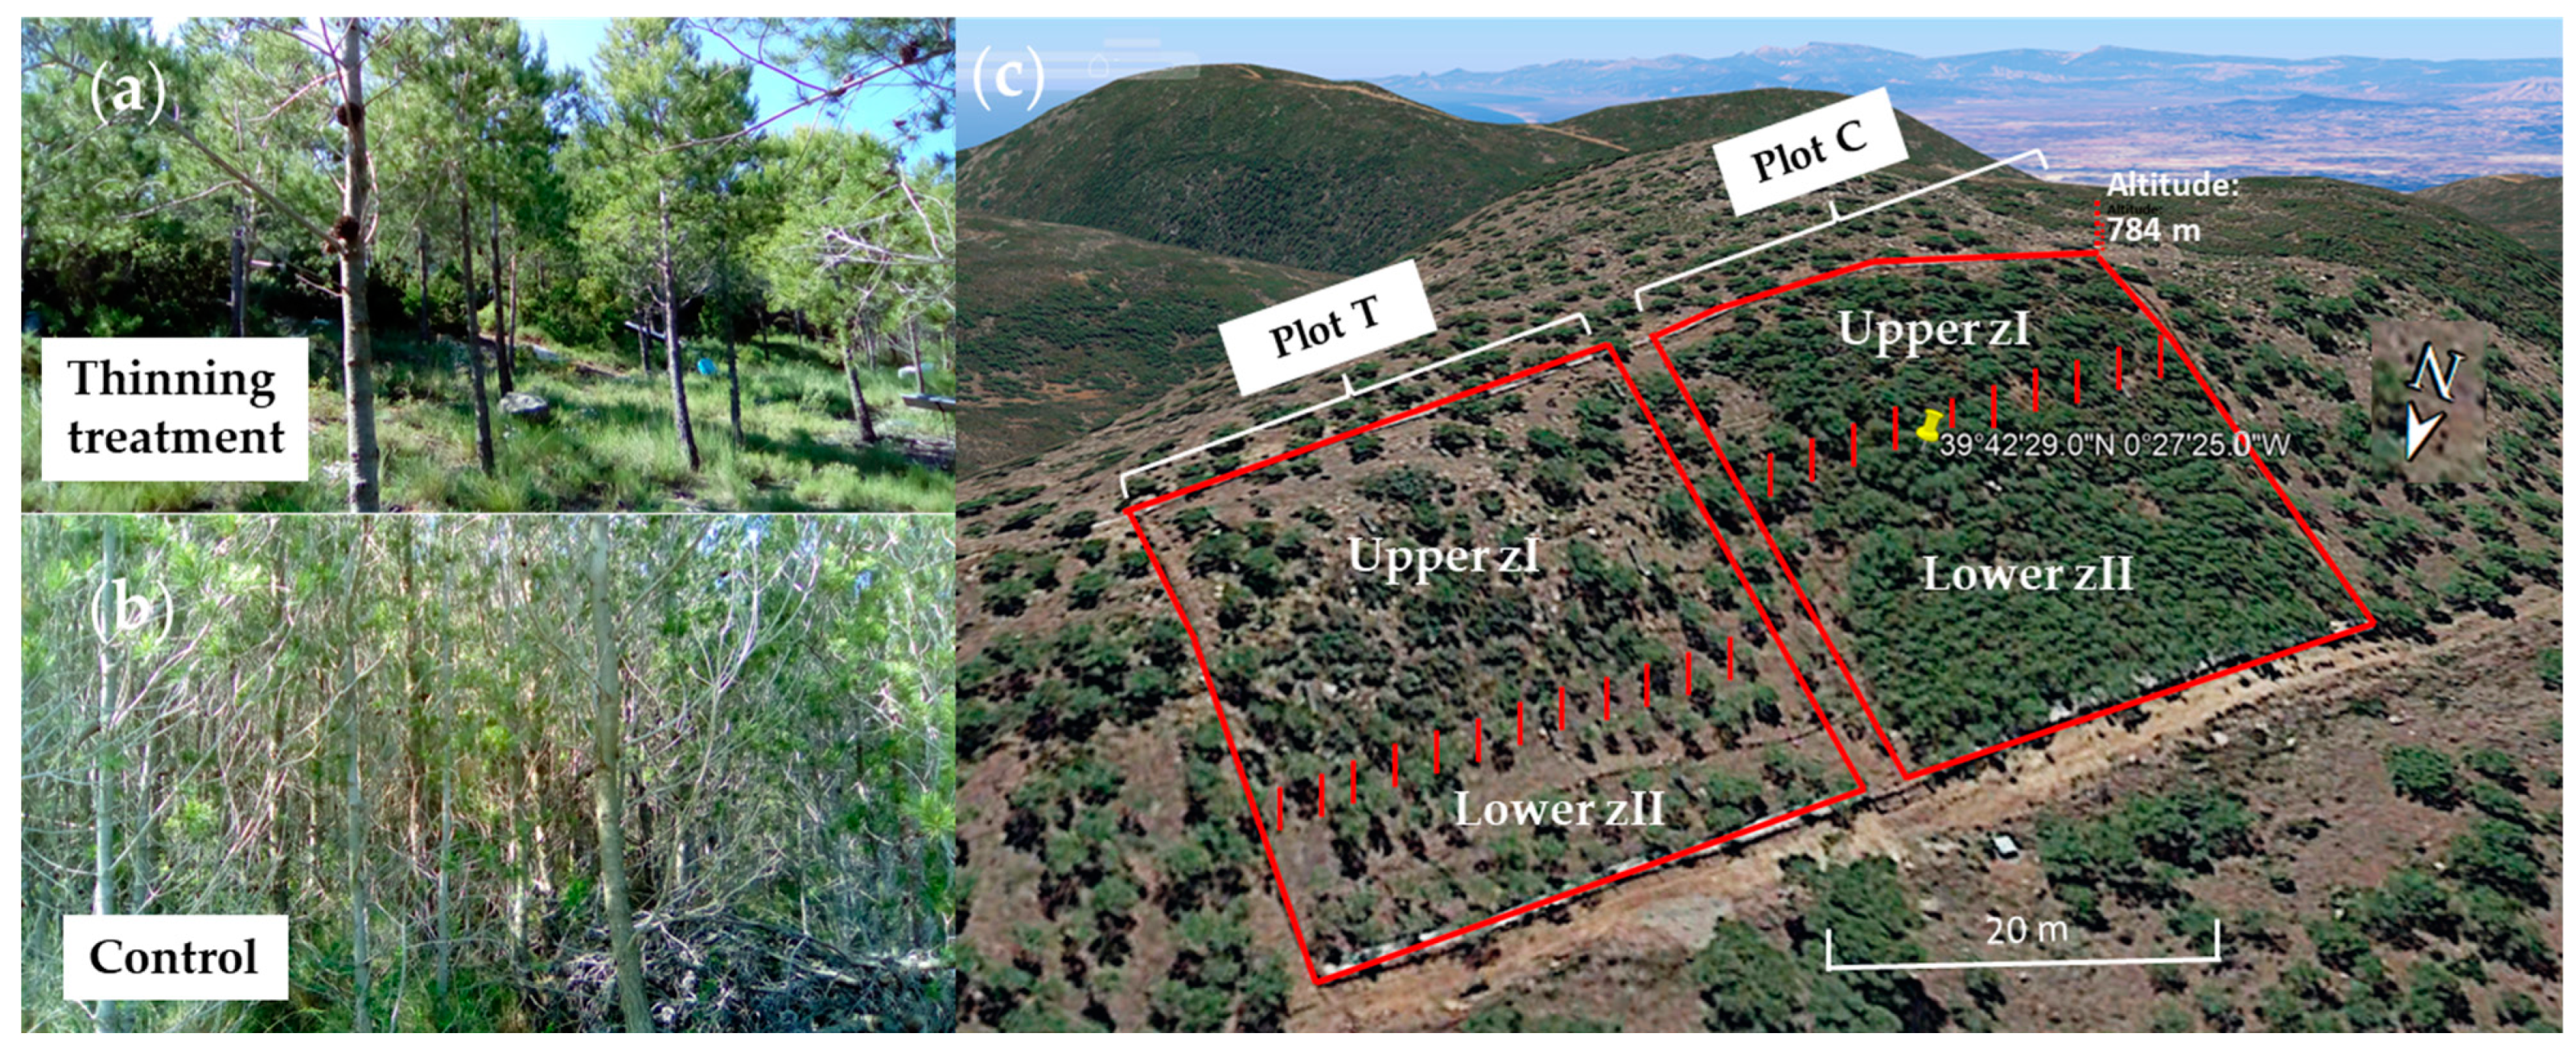
2.1. Study Site and Experimental Design

The study was carried out in the Sierra Calderona Natural Park, a protected area of 18,019 ha located between the provinces of Castellón and Valencia, near the Mediterranean coast of Spain. The experimental site (39°42′29″ N, 0°27′25″ W, 790 m a.s.l.) has already been described in some related studies [23,46]. In short, the Sierra Calderona has a general NW–SE orientation, with a sclerophyllous vegetation dominated by Aleppo pine (Pinus halepensis Mill.) and also sparse stands of cork oak (Quercus suber L.). This site is a natural reserve that has been regenerated after the 1992 forest fire that affected 9,498 ha. The average annual temperature is 14 °C, rainfall is irregular with annual values of 342 mm, and the average annual potential evapotranspiration is 837 mm [46]. The area is classified as semi-arid according to the aridity index climate classification [47,48]. Tree density and competition are high (overstocked), with aboveground biomass estimated from allometric equations at 47.3 Mg ha−1 (22.2 Mg C ha−1) [46]. Thinning was carried out between January and October 2012 in an area of approximately 50 ha with a very high density of 20-year pines (over 15,000 stems ha−1). In October 2012, a thinning treatment (T) with a basal area removal of 74% (corresponding to a pine density reduction of 94%) was applied on the left half of a representative area of about 40 × 40 m2, NW oriented, and including a control (C) with no thinning in the right half (Figure 1).
The characterisation of the forest structure in the T and C plots is described in detail in [46,49]. Tree density was 11,300 trees ha−1 in the C plot and 703 trees ha−1 in the T plot. As part of the silvicultural treatments carried out, coarse woody debris was removed, and fine woody debris was ground and left on the forest floor of the T plot.

2.2. Soil Characterisation

At the beginning of the study, in March 2013, four points in the treated plot and four points in the control plot were randomly selected. At each point, after retiring the forest floor, a metal frame (25 × 25 cm) was used to take samples from 0 to 5 cm and a probe of 5 cm diameter was used to take samples from 5 to 20 cm, respectively. In each of these layers, the content of stones, roots, total C and N, macro- and micronutrients and heavy metals contents were determined. Stones and roots were hand-separated, dried and weighed (Table S1). Soil samples were air-dried and sieved through a 2 mm mesh. Total C and N were determined by a total analyser (Flash EA 1112 Series-LECO TruSpec, LECO Analytical Instruments, Madrid, Spain) and macro- and micronutrients and heavy metals contents were measured by Inductively Coupled Plasma Optical Emission Spectroscopy ICP-OES (ICAP 6500 DUO/IRIS Intrepid II XDL, Thermo Fisher Scientific Inc., Waltham, MA, USA) after digestion with HNO3-H2O2 4:1 (v/v) in an UltraCLAVE microwave (Milestone S.R.L., Milan, Italy).
To complete soil characterization, 9 samples in plot T and 8 samples in plot C were taken on May 2014 from 0 to 15 cm (mineral soil). General soil physicochemical properties such as pH, electrical conductivity (EC), carbonates, soil organic carbon, water holding capacity, and texture were determined in the air-dried soil fine fraction (less than 2 mm) (Table S2). Soil pH was measured in a 1:2.5 (w/v) aqueous solution using a pH meter model micro pH 2001 (Crison Instruments, Barcelona, Spain). Electrical conductivity was determined in a 1:5 (w/v) aqueous solution using a conductivity meter model CM 35+ (Crison Instruments, Barcelona, Spain). The carbonate content was determined using a Bernard calcimeter. Soil organic carbon (SOC) was determined in 500 μm sieved soil by wet oxidation using Walkley–Black titration method [50]. Water holding capacity (WHC) was determined using the method described by Forster [51]. Soil texture was determined by the Bouyoucos method [52]. Forest floor and mineral soil moisture content (GWC) were determined gravimetrically by drying at 105 °C for 48 h to a constant weight [53].
Additionally, a tomographic representation of the terrain as described in del Campo et al. [49] shows the disposition of the rock mass with respect to the slope of the terrain and the different soil depths along the slope. Both plots (T and C) were initially designed considering the studies on the hydrological cycle (rainfall, soil moisture, humidity, drainage, runoff, etc.) carried out in this representative area with three blocks of similar size from upslope to downslope in both plots, and three samples per each block-treatment combination [46]. However, when analysing all the data, we found that soil conditions were not the same along the slope. In fact, in the upper and middle blocks of the T plot and in the upper block of the C plot, the soil was very shallow, with high stoniness and organic matter content (named in this study as zI) (Tables S1 and S2), and in the lower block of the T plot and in the middle and lower plots of the C plot, the soil was deeper and with less stoniness and organic matter content (zII). For this reason, all the results are analysed separately for each zone.

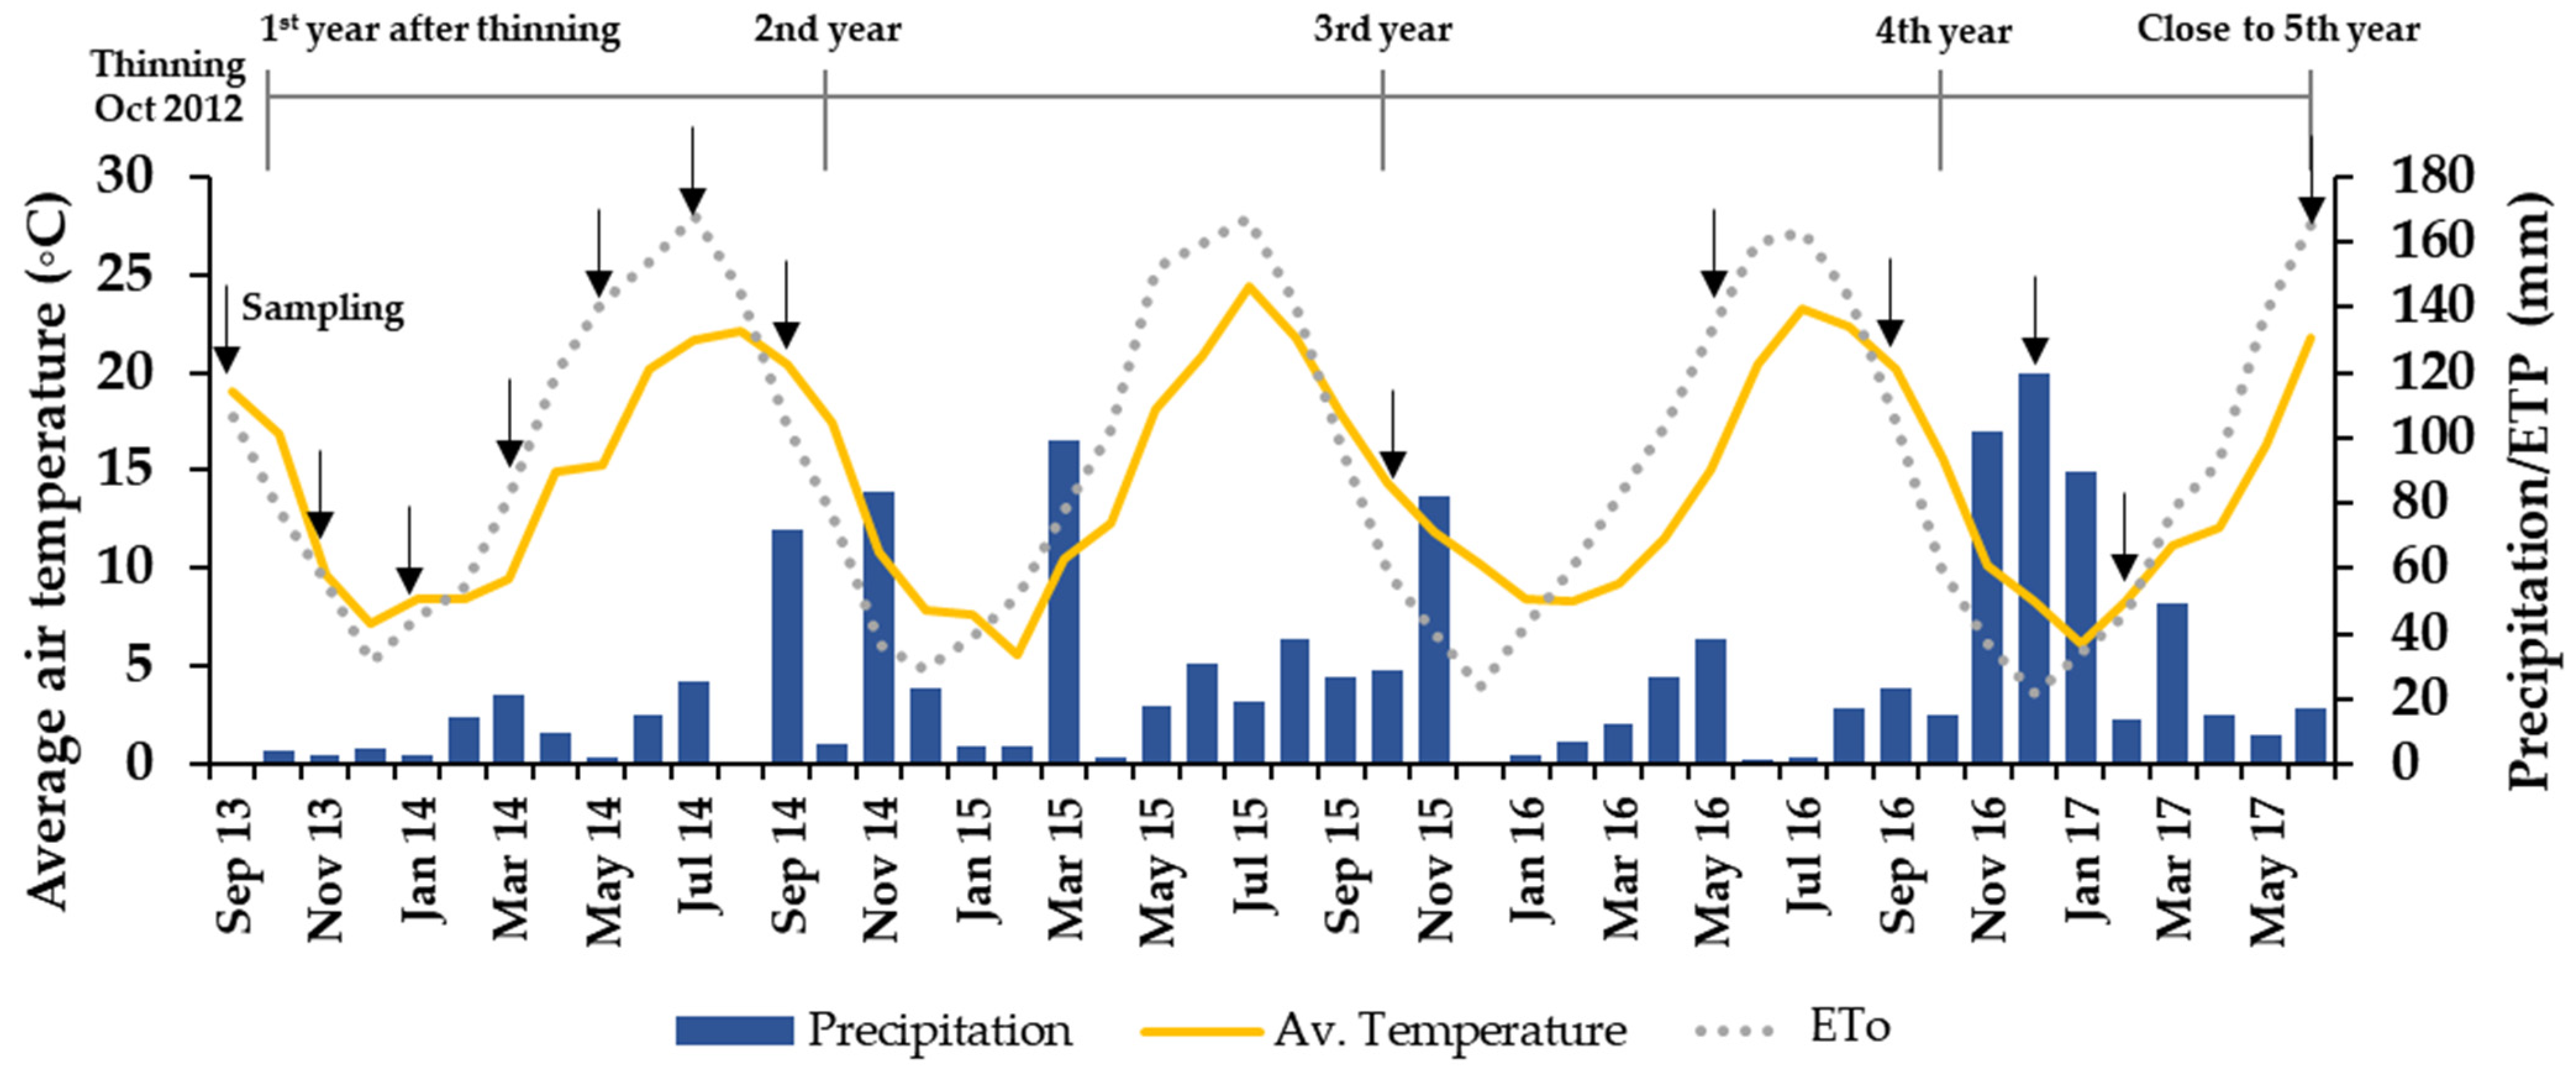
2.3. Environmental Conditions

The environmental variables and field instrumentation have been described elsewhere [49]. Data on average monthly air temperature and precipitation during the study period are shown in Figure 2. Air temperature (Tempamb) was measured daily with a fix sensor (Decagon Devices Inc., Pullman, WA, USA) installed in the buffer zone between the two plots, and precipitation was also measured daily with a rainfall gauge (Decagon Devices, Pullman, WA, USA) in an open area away from the experimental plots. The reference evapotranspiration (ETo) was obtained from the agrometeorological information provided by the meteorological stations integrated in the Agroclimatic Information System for Irrigation (SIAR) network (Ministry of Agriculture and Fisheries, Food and the Environment—MAPAMA, Spain), corresponding to a nearby weather station (Bétera, Valencia, Spain) [54].
Soil water content (m3 m−3) was measured continuously at 15 cm (Hum15cm), with 9 sensors per plot (5TE y EC-5, Decagon Devices Inc., Pullman, WA, USA). On each sampling date (see Section 2.4) surface (0–6 cm) soil temperature (TempWET) and surface soil humidity (HumWET) were recorded at midday with a WET-2 sensor (Delta-T Devices Ltd., Burwell, Cambridge, UK) in 9 points per plot [23].

2.4. Sampling for Selected Soil Carbon Pools and Microbiological Activity

The sampling schedule took place every two months between September 2013 and September 2014, and lately with the following sampling dates: October 2015, May 2016, September 2016, December 2016, February 2017, and June 2017. The forest floor and mineral soil samples were collected in zone I–zI at 6 points in the T plot and 3 points in the C plot; and in zone II–zII, at 3 points in the T plot and 5 points in the C plot (Figure 1). Forest floor samples were passed through a 4 mm sieve, while mineral soils taken from soil surface to 15 cm depth (0–15 cm) were passed through a 2 mm sieve. Forest floor was defined as the organic material above the mineral soil [34]. A sub-sample of each sieved soil sample was air-dried, and the remainder was stored at 4 °C prior to analysis for MBC, BSR and enzyme activity. For all analytical tests, the average of two replicates per sample was used and data were expressed on soil dry weight basis.

2.5. Microbial Biomass, Soil Respiration, and Soil Enzyme Activities

Microbial biomass carbon (MBC) was extracted from fresh soil using the chloroform fumigation method [55] and oxidation by K2Cr2O7 in concentrated H2SO4 at 140 °C for 20 min [56]. The difference between C extracted from the fumigated and non-fumigated extracts was expressed as microbial biomass C by multiplying by a factor (Kc) of 0.38 [55].
Basal soil respiration (BSR) was determined at the same moisture content as the soil samples. BSR was determined on fresh soil equivalent to 5 g dry soil incubated in 36 cm3 hermetically sealed flasks for 4 days at 25 °C in the dark. The respiration rate was calculated from the % CO2 production in the headspace volume of the flask measured with a CO2 sensor (Checkpoint, PBI Dansensor, Ringsted, Denmark).
Acid phosphatase activity (AP) was evaluated by spectrophotometry at 400 nm as the amount of p-nitrophenol (p-NP) released from fresh soil equivalent to 1 g of dry soil after incubation at 37 °C for 1 h in a shaking water bath (120 oscillations per min) with 1 cm3 of the substrate p-nitrophenyl phosphate (0.025 M) and MUB buffer (pH 6.5). Then, 1 cm3 of 0.5 M CaCl2 was added and the released p-NP was extracted with 4 cm3 of 0.5 M NaOH and filtered (Filter-Lab 1246, Filtros ANOIA, Barcelona, Spain) [57]. Urease activity (UA) was determined as the amount of NH4+-N released from 2 g fresh soil after incubation with 2 cm3 urea (6.4%) and 8 cm3 0.1 M phosphate buffer (pH 7) for 1.5 h at 37 °C [58]; the released NH4+-N was determined in a flow injection analyser (FIAStar 5000, Foss Tecator, Höganäs, Sweden).

2.6. Statistical Analysis

In the Section 3 and Section 4, the means for each zI and zII are presented together with the standard deviation (±). The ANOVA assumptions of normality and homogeneity of variances (Levene’s test) were checked. Tukey’s HSD test was used for mean separation (p ≤ 0.05). Non-normal data were LOG-transformed to stabilise the variance before calculation. For multiple comparisons of means, where assumptions were met, the t-test (p ≤ 0.05) was used to compare the two group means. Interactions between treatment and season were tested. When a significant interaction between explanatory variables was found, a separate ANOVA analysis was performed using Tukey’s HSD tests. Relationships between variables were assessed using Spearman’s correlation coefficients at p ≤ 0.05. Statistical analysis was performed using the Statgraphics software package for Windows (version XVIII, Statpoint Technologies, Inc., Warrenton, VA, USA).

3. Results

3.1. Experimental Plots Soil Characterisation

As mentioned above, two samplings were made for soil characterisation of the T and C plots: a first sampling, where samples were taken from 0 to 5 cm and from 5 to 20 cm; and a second sampling, where mineral soil samples were taken from 0 to 15 cm. Stoniness, root weight, and elemental composition of macro- and micronutrients at 0–5 cm and 5–20 cm are shown in Table S1, and soil chemical and physical properties in each zone at 0–15 cm are shown in Table S2. The zI showed higher stoniness (i.e., approximately >40%) compared to zII (<25%), with approximately 5-fold significantly higher levels at 5–20 cm depth. Root weight present in the samples was approximately 1.9-fold significantly higher in zI at depth 0–5 cm. Organic carbon was higher at depth 0–5 cm compared to samples taken at 5–20 cm, with significant differences between zI and zII of about 2.3-fold at depth 0–5 cm. This was consistent with SOC content, which was also significantly higher in zI than in zII (Table S2). The same tendency was observed for N content, with soil from zI characterised by an approximately 2.4-fold significantly higher N content than soil from zII. In both cases, a higher N content was found in the 0-5 cm layer than in the 5–20 cm layer. However, C/N was higher in zII (5–20 cm) (67.6), with significant differences of about 3.4-fold compared to zI (19.9). With respect to other macronutrients analysed (i.e., Ca, Mg and S), significant differences between the two zones were mainly observed at depth 0.5 cm, with higher values in zII. This was in agreement with CaCO3 content, which was higher in zII (36.6%) compared to zI (20.5%), and pH, which was higher in zII (8.18) compared to zI (7.96) (Table S2). For micronutrients, higher significant values were observed in zI compared to zII in both depths studied. EC in both zones indicated a non-saline soil (i.e., EC < 2 dS m−1). WHC was higher in zI (83.52%) compared to zII (65.46%), the differences being significant at p ≤ 0.05. The soil texture in both zones of each plot was classified as clay loam, with no differences in clay content but significant differences in sand (zI, 30%; zII, 37.6%) and silt (zI, 38.3%; zII, 32.4%) (Table S2).
The above results support the separation of each plot (T and C) into two zones that present differences in various of the soil properties.

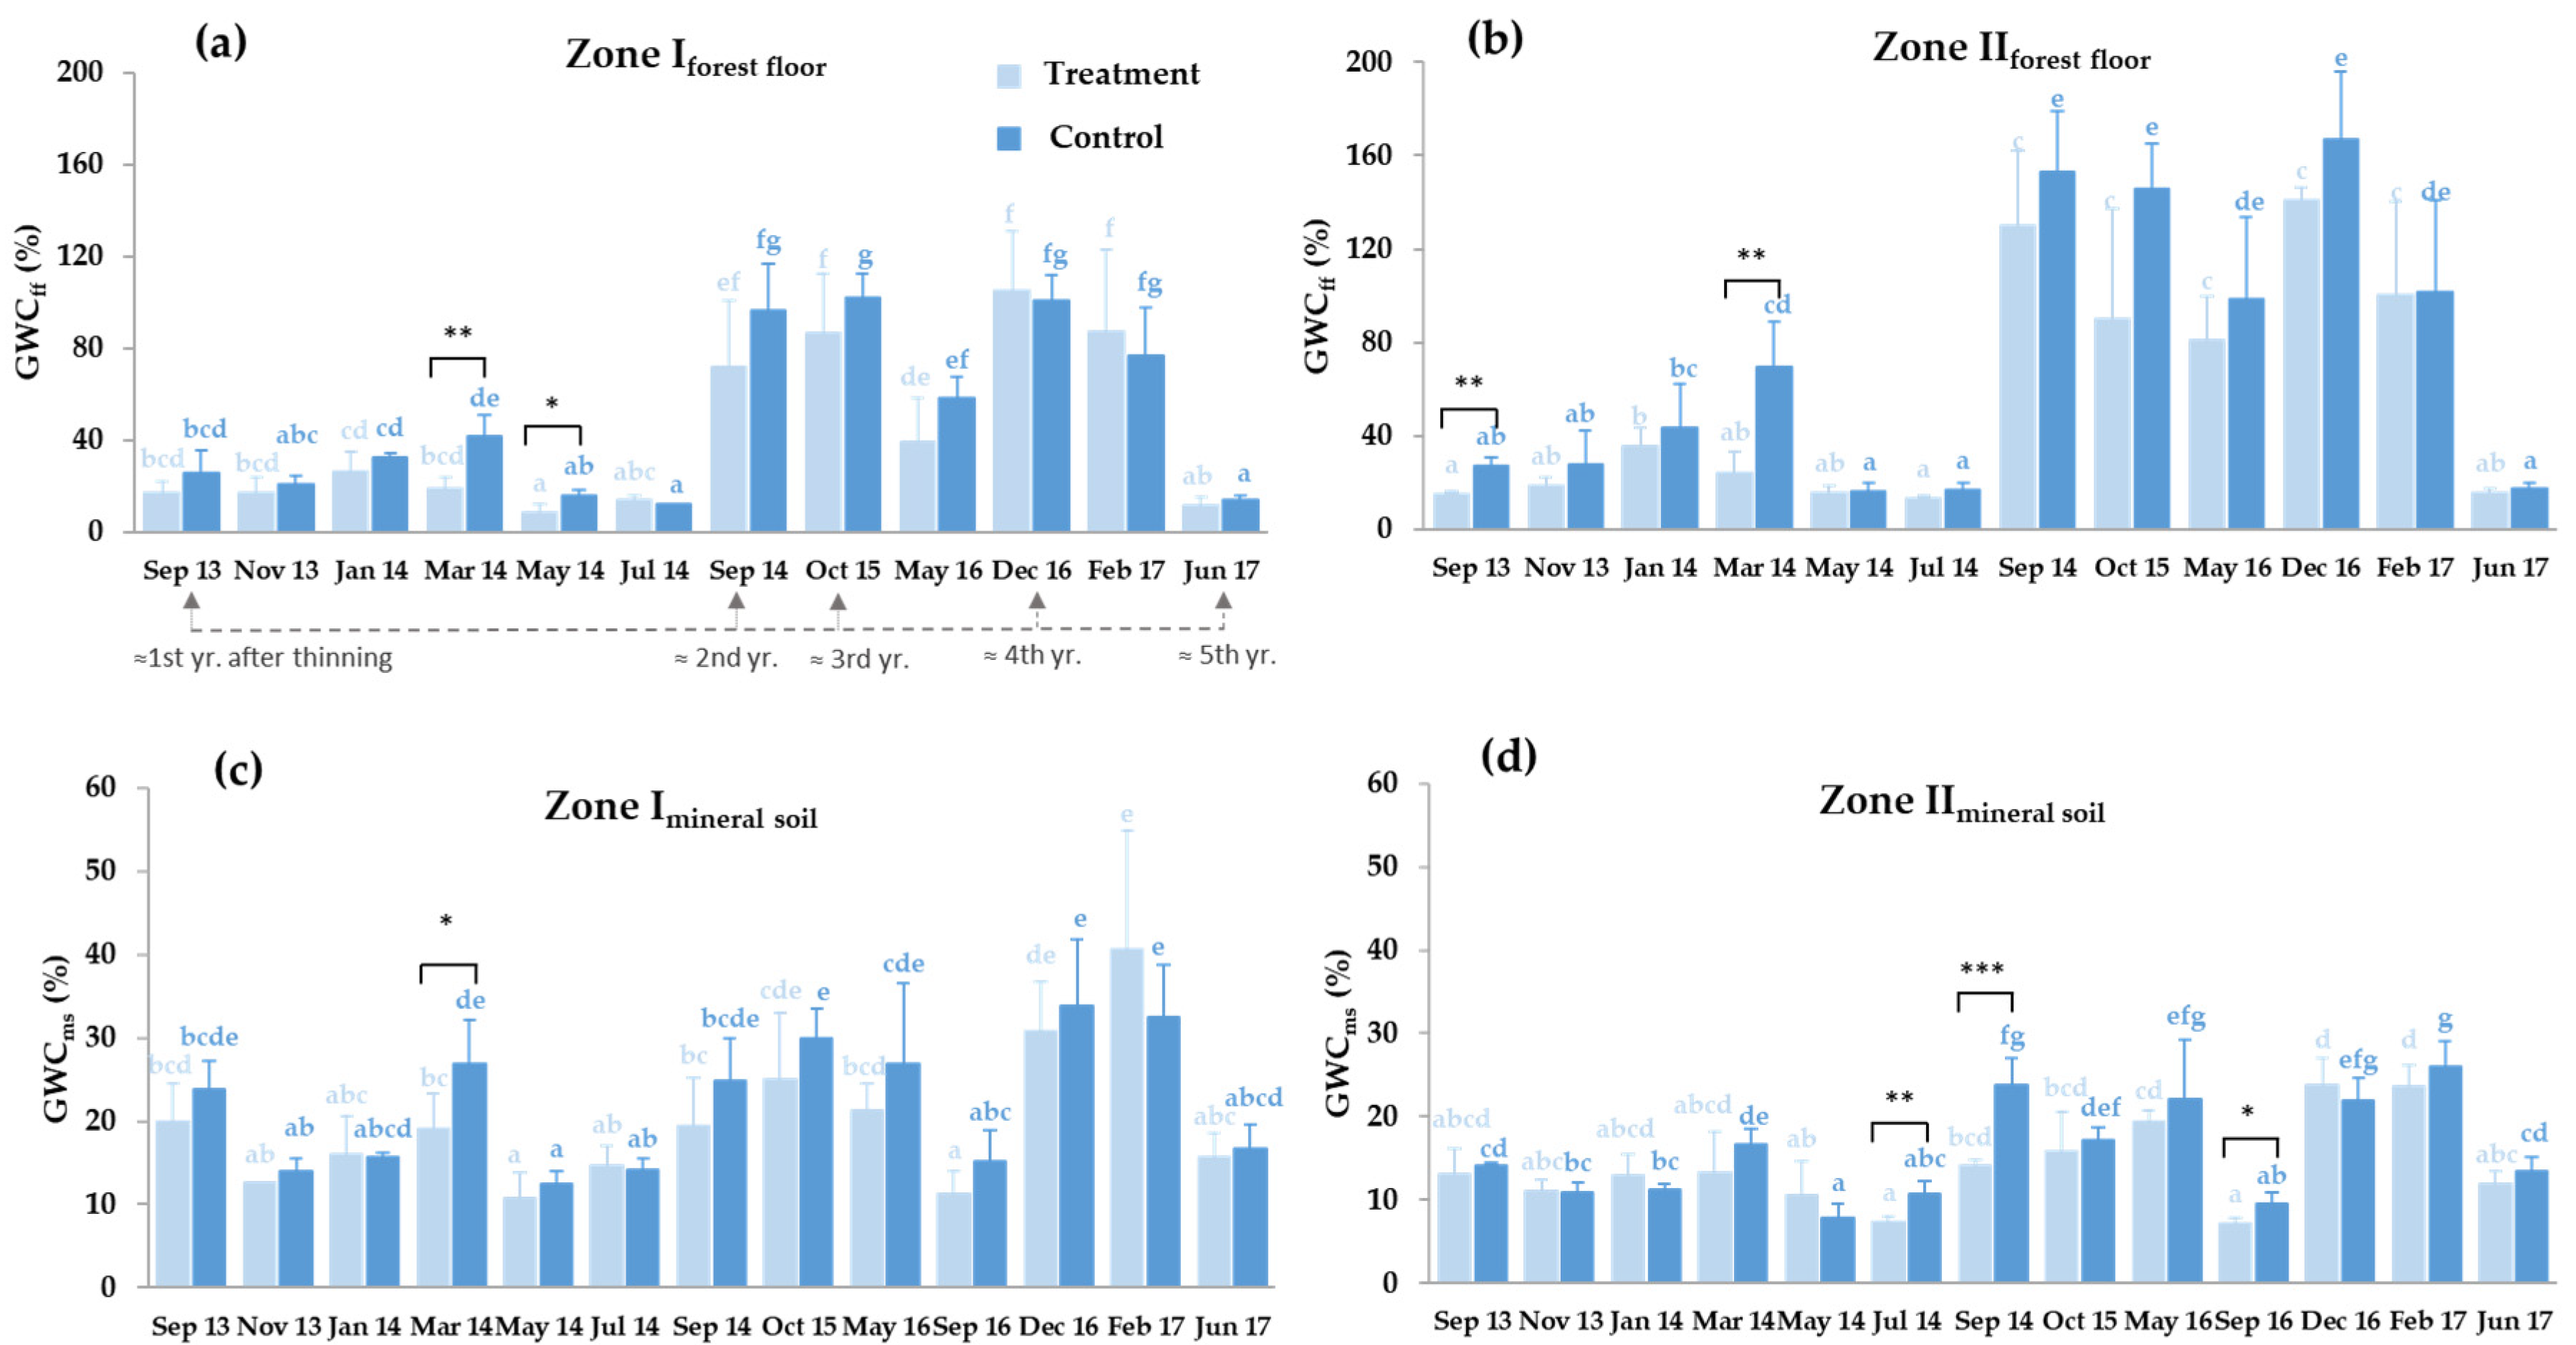
3.2. Forest Floor and Mineral Soil Moisture

The seasonality of soil moisture in the forest floor and mineral soil based on the sampled dates is shown in Figure 3. In both zones (zI and zII), it is observed that the control plot has a higher moisture range than the treated plot on most of the sampled dates, both in the forest floor and in the mineral soil. However, these observed differences were only significant on certain sampling dates. Specifically, gravimetric water content in forest floor (GWCff) in zI (Figure 3a) was significantly higher in the control than in the thinned plot in March (i.e., corresponding to an average increase of 53.97%) and May (46.95%) of 2014, while in zII (Figure 3b), it was also significant in September 2013 (44.8%) and March 2014 (65.21%). Similarly, gravimetric water content in mineral soil (GWCms) in zI (Figure 3c) was significantly higher in the control than in the treatment in March 2014 (28.68%), while in zII (Figure 3d), it was significant in July (31.28%) and September 2014 (40.92%) and September 2016 (24.76%). GWCff and GWCms were also significantly correlated (r = 0.648, p ≤ 0.0001, n = 104 for zone I and r = 0.727, p ≤ 0.0001, n = 95 for zone II). However, for zI, the levels were higher in the forest floor, with an average of 45.68 ± 37.51% compared to the mineral soil of 21.72 ± 9.30%, with these differences being significant by t-test at p ≤ 0.05. This was also the case for zII with values in the forest floor of 67.91 ± 56.31% and in the mineral soil of 15.75 ± 6.04%. These data also show significantly higher GWC values in zII compared to zI in the forest floor, but conversely higher significant GWC values in zI compared to zII in the mineral soil (Table A1).

3.3. Soil Carbon Pools and Microbiological Activity

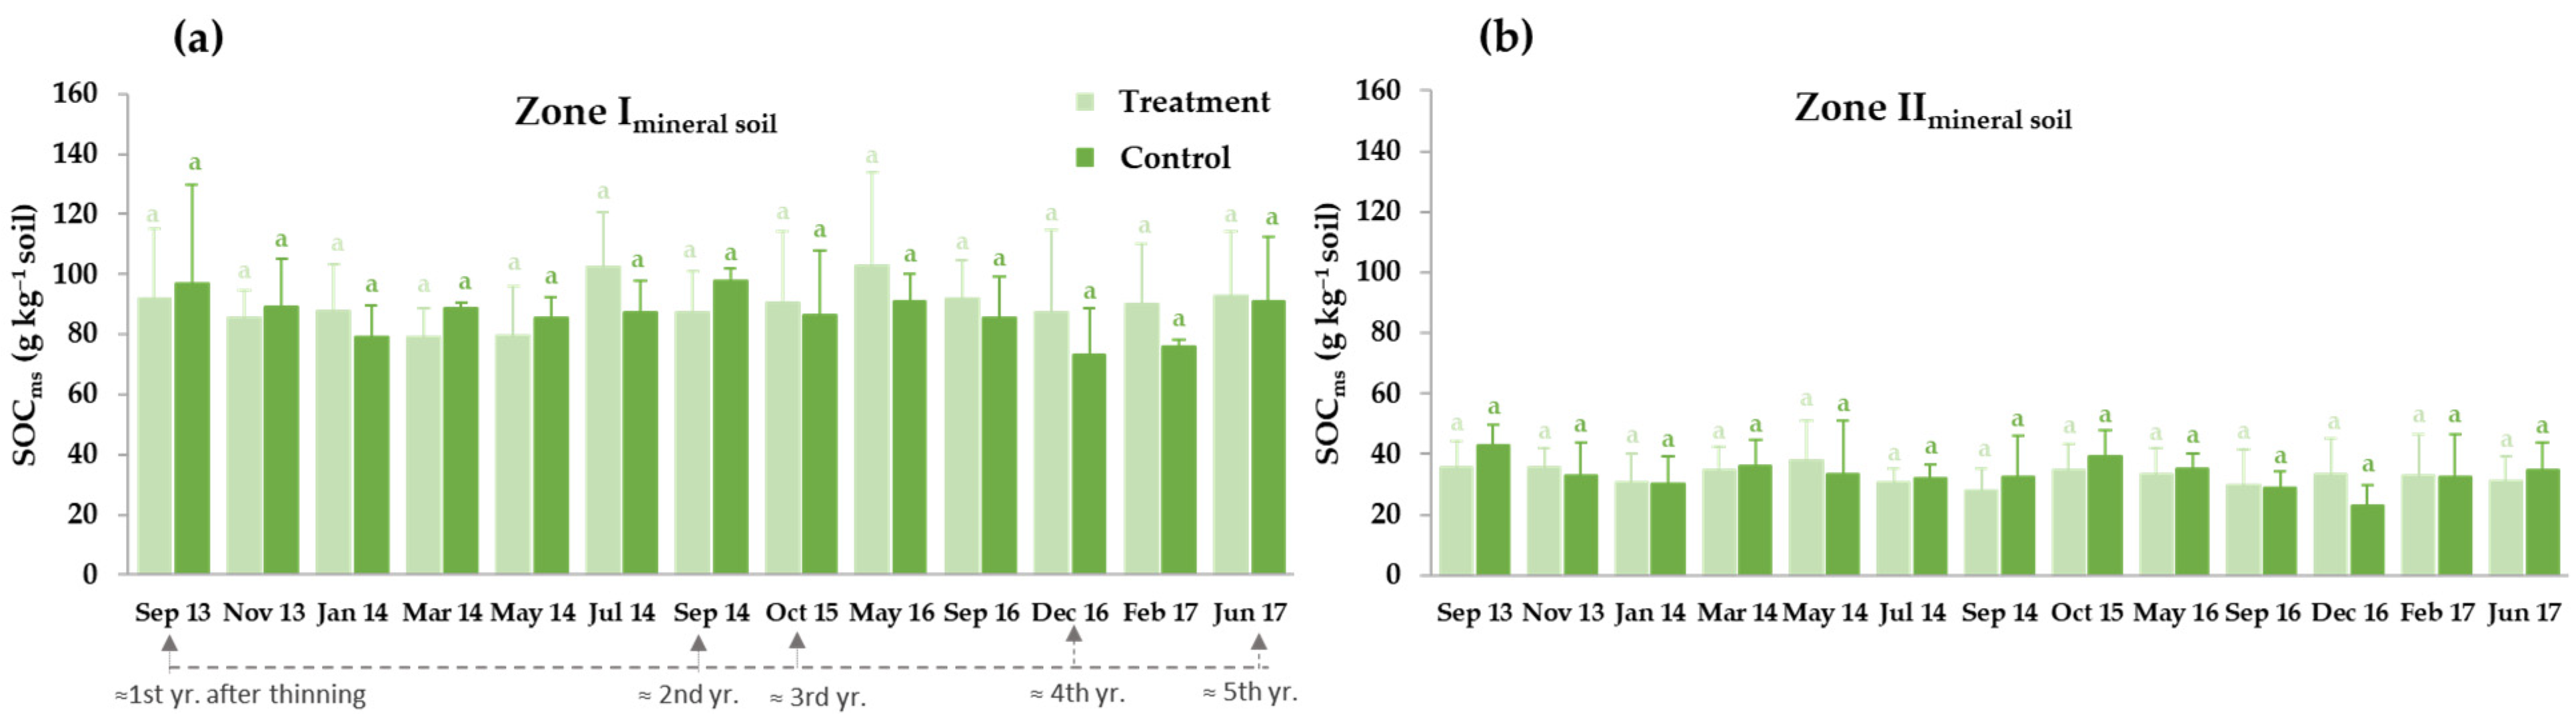
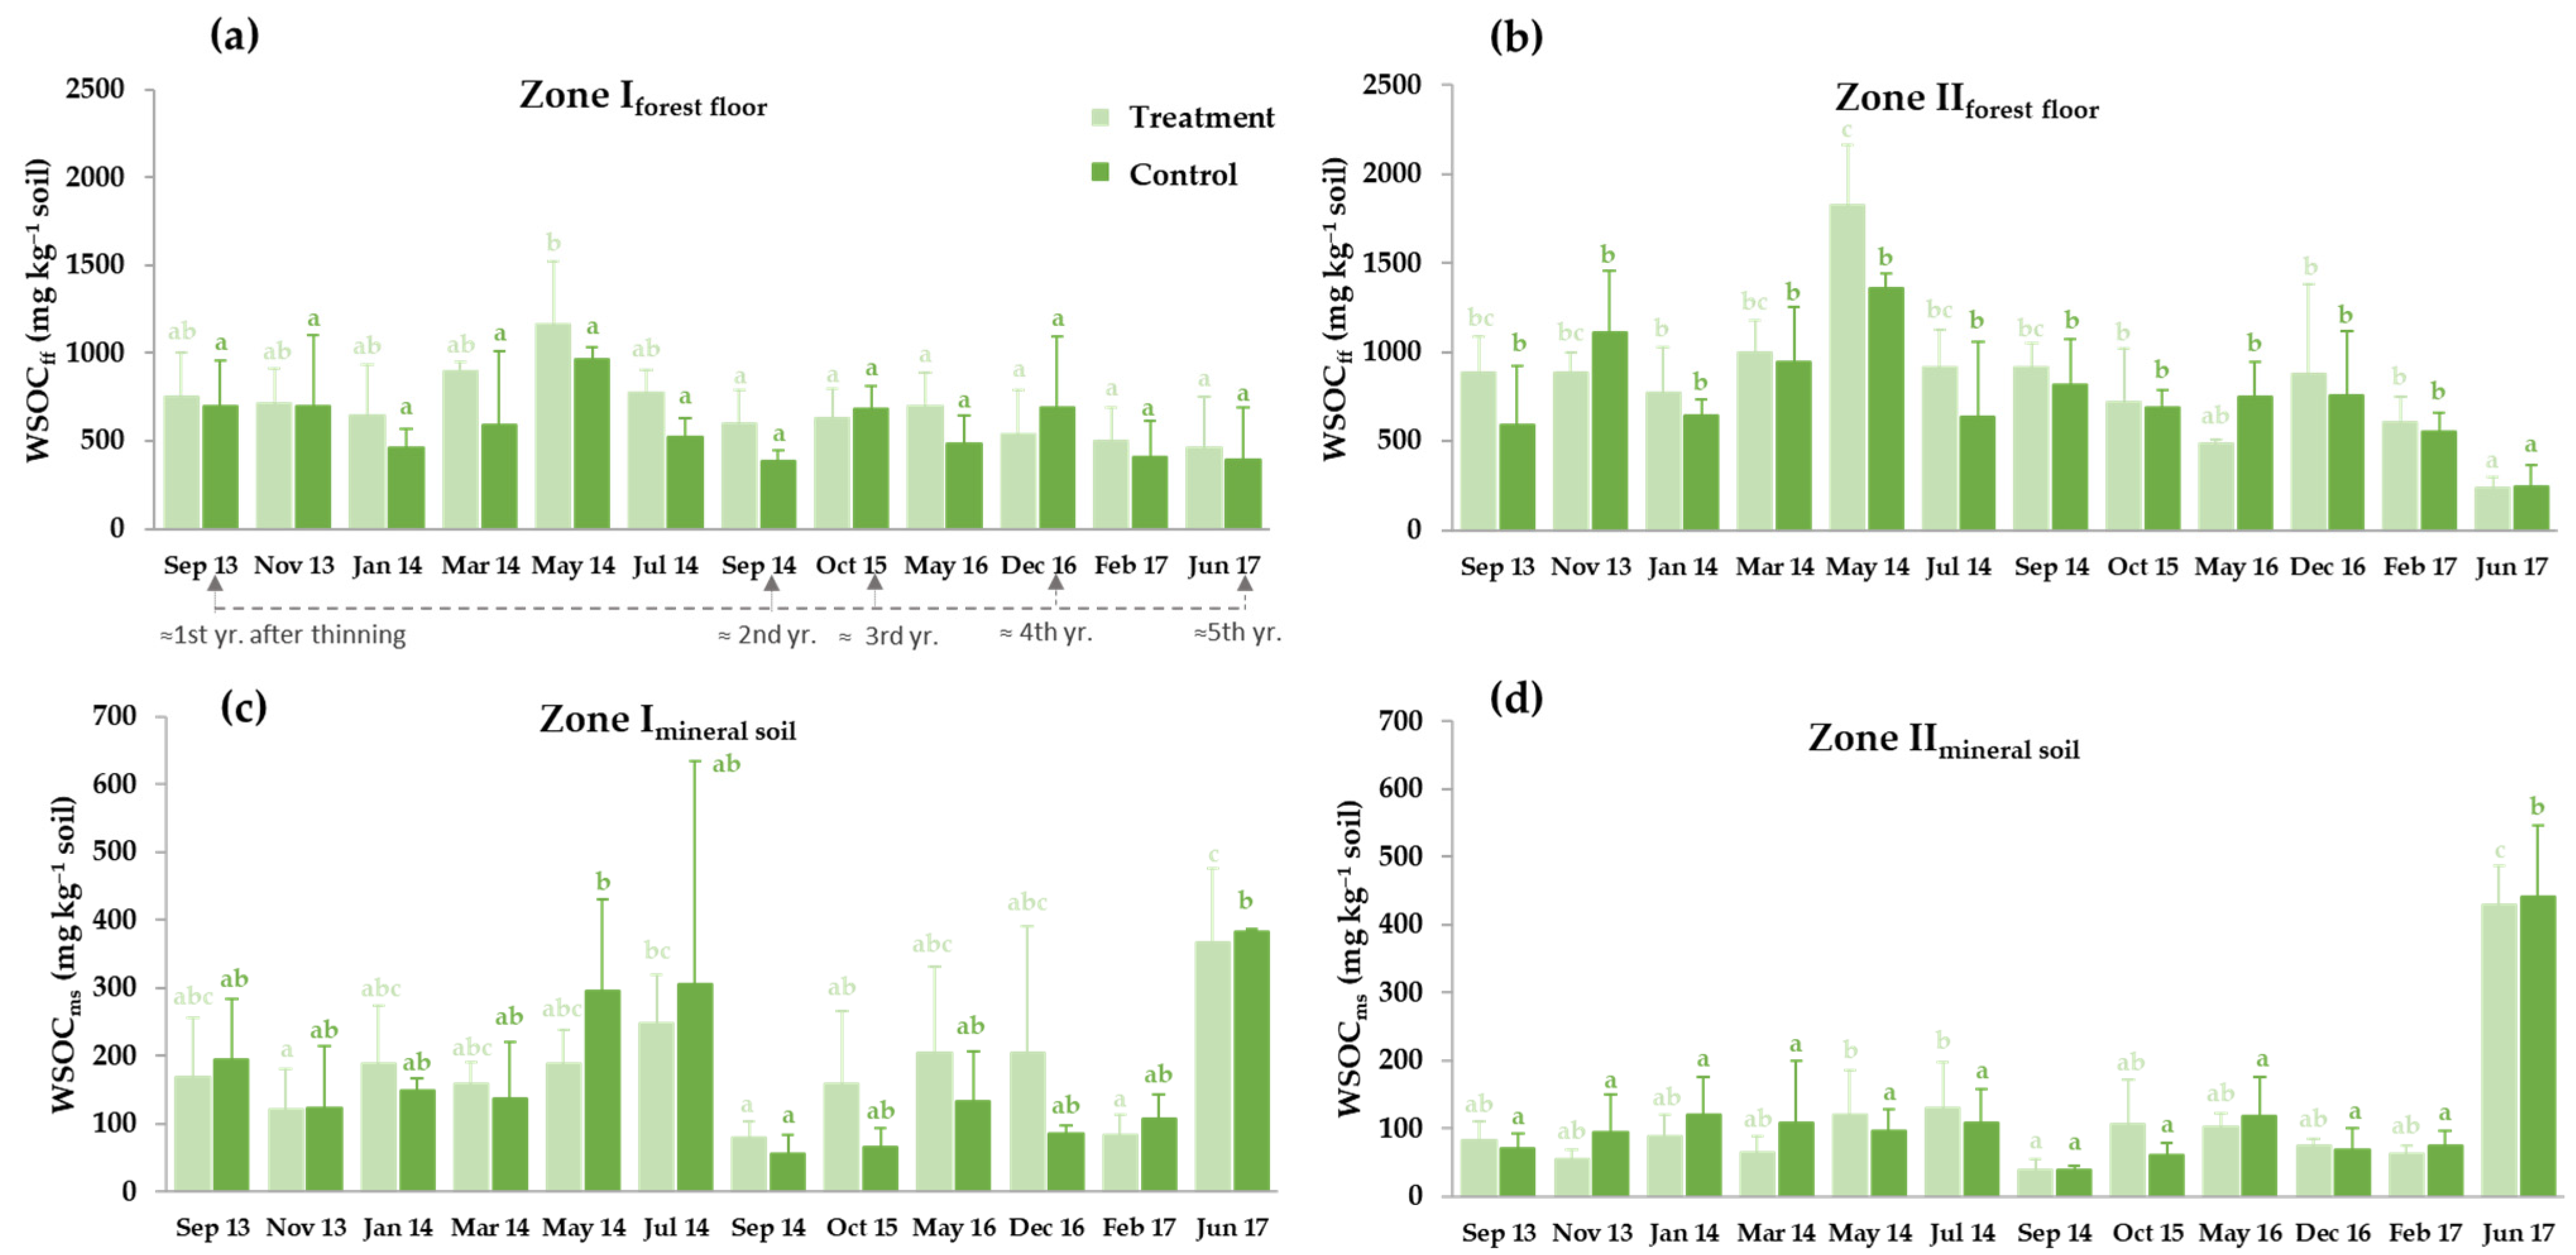
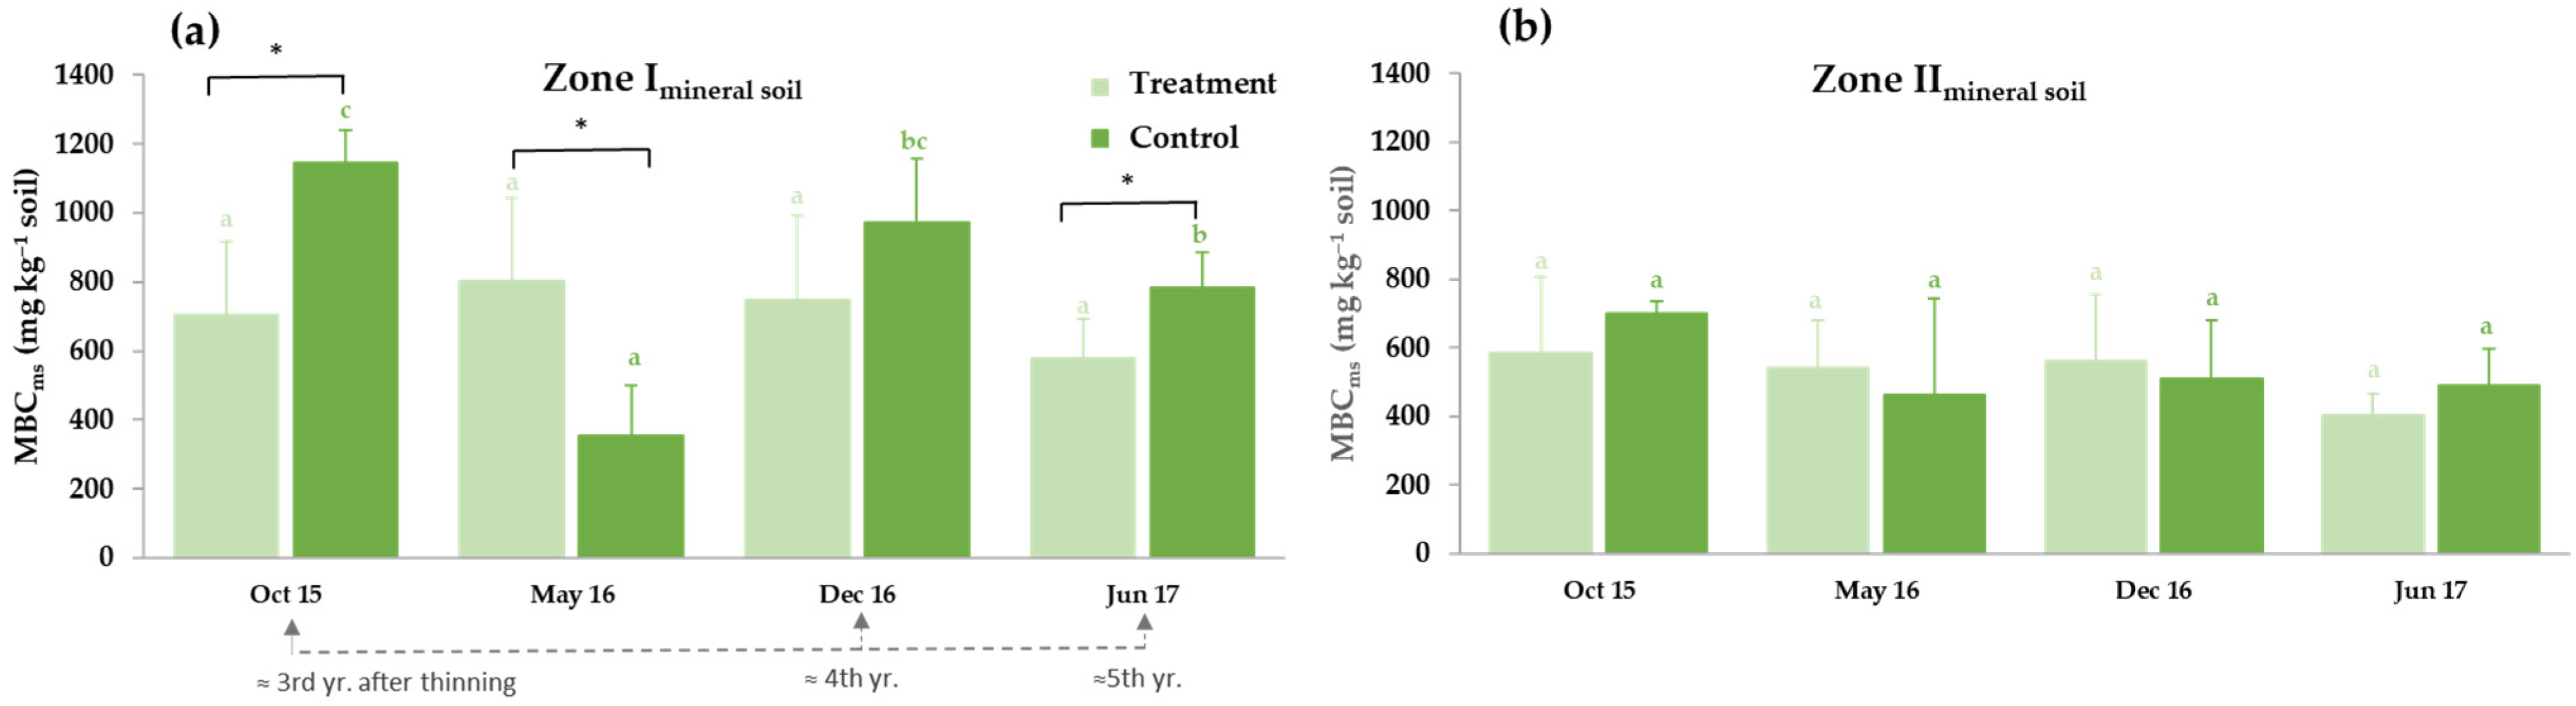
3.3.1. Thinning Effects on Selected Soil Carbon Fractions: Soil Organic Carbon (SOC), Water-Soluble Organic Carbon (WSOC) and Microbial Biomass Carbon (MBC)

The results corresponding to the mineral soil organic carbon (SOCms) comparing the effect of thinning with the control in both zones are shown in Figure 4. There were no significant differences in SOCms for each treatment between the sampling dates for zI (F = 0.57, df = 1, p = 0.4531) (Figure 4a, Table A1) and for zII (F = 0.01, df = 1, p = 0.9241) (Figure 4b, Table A1). However, it is noteworthy that the SOCms was 2–3 times higher in zI (average 88.88 ± 17.94 g kg−1 soil) than in zII (32.58 ± 9.21 g kg−1 soil), although these differences were not due to differences in plant development or silvicultural management. Furthermore, no significant differences in SOCms were observed between the different sampling dates in both zI (F = 0.79, df = 12, p = 0.6572) and zII (F = 0.73, df = 12, p = 0.7169) (Table A1).
No differences were found between treatment and control in the levels of WSOCff and WSOCms (Figure 5). However, the levels of WSOCff were higher in zII (774.72 ± 376.99 mg kg−1 soil) than in zI (661.2 ± 280.81 mg kg−1 soil) with significant differences at p ≤ 0.05 (F = 5.69, df = 1, p = 0.0181) (Figure 5a,b). In contrast, WSOCms was significantly higher in zI (173.58 ± 119.06) than in zII (115.64 ± 109.39) (F = 27.36, df = 1, p ≤ 0.0001) (Figure 5c,d). When comparing both WSOCff and WSOCms (i.e., including T and C), the differences were 3.8-fold higher in zI and 6.7-fold higher in zII, respectively, significant by t-test (p ≤ 0.05). When comparing between sampling dates, significant differences were found in both T and C for each zone at p ≤ 0.05 (Table A1).
MBC was measured for the first time in the mineral soil three years after the thinning treatment. In the T plot of both soils, MBC remained practically constant (mean value for mineral zI of 709 ± 76 mg kg−1 and for zII of 523 ± 81 mg kg−1) (Figure 6a,b). However, there was more variation in MBC in the C treatment for zIms, with significant differences at p ≤ 0.05, with a higher value in October 2015, a lower content in May 2016, and also in June 2017. When comparing both zones globally, significant differences of about 1.4-fold (F = 15.08, df = 1, p = 0.0002) were found between zI (743.69 ± 256.83 mg kg−1) compared to zII (543.60 ± 173.93 mg kg−1).

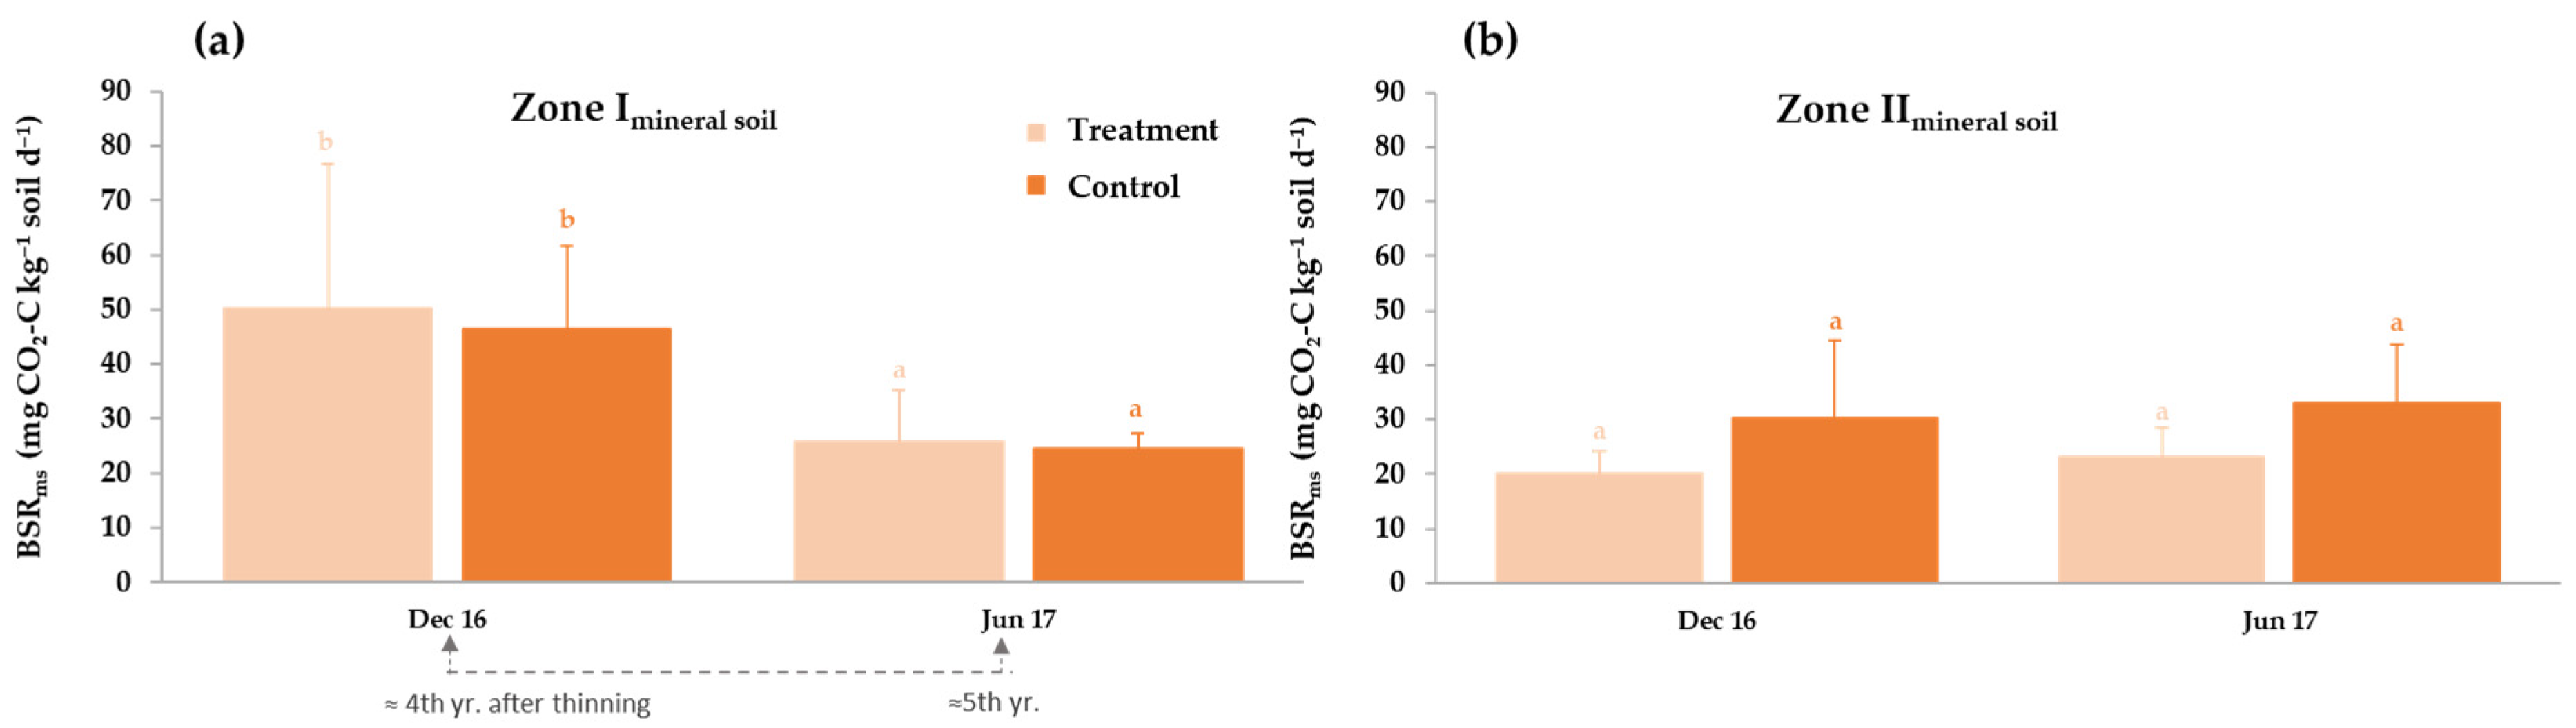
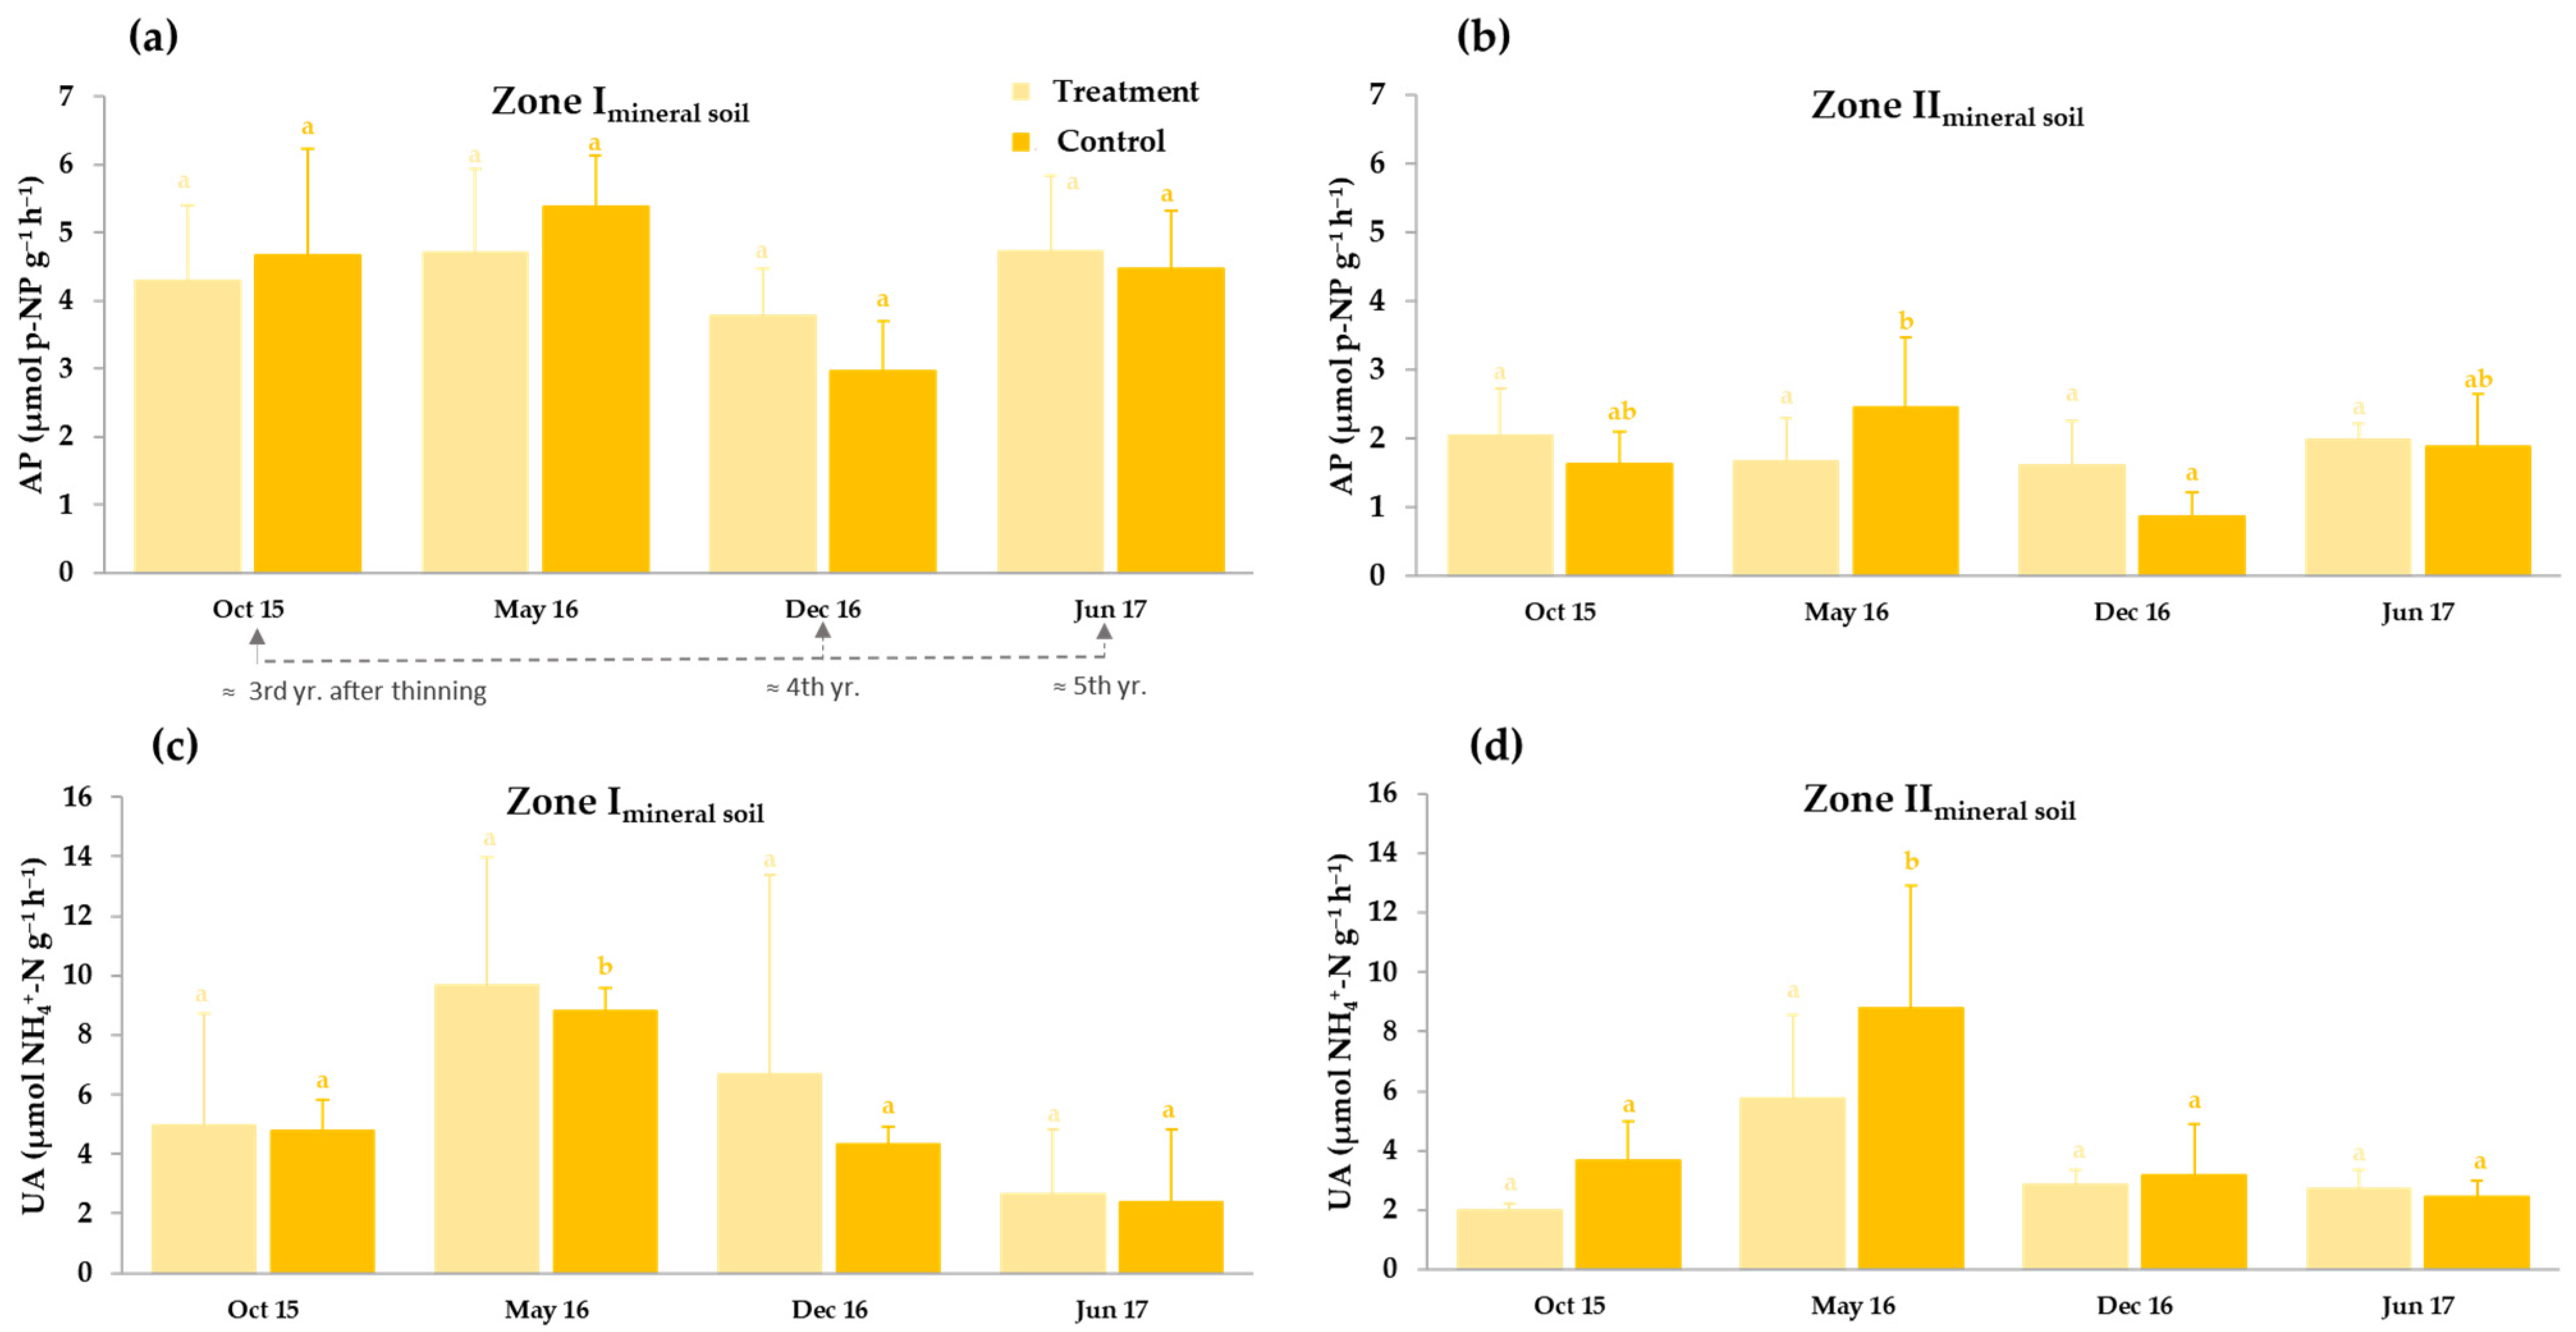
3.3.2. Thinning Effects on Basal Soil Respiration and Enzyme Activities

BSR was measured four years after thinning. No significant differences between treatments were found for either of the two zones on the two dates studied (Figure 7). BSRms in zI was significantly higher in December 2016 (48.86 ± 22.38 mg CO2-C kg−1 d−1) than in June 2017 (25.34 ± 7.54 mg CO2-C kg−1 d−1) (Figure 7a, Table A1) due to the low moisture content of the soil samples in June. However, there were no differences between the two sampling dates for BSRms in zII (Figure 7b, Table A1). The mean BSRms_zII of the two sampling dates was 27.93 ± 10.82 mg CO2-C kg−1 d−1.
The potential activity of AP and UA in the mineral soil was measured four years after the treatment and at four sampling dates (Figure 8). We found that, for both zones, the thinning treatment had no significant effect on the activity of either enzyme (Table A1). When comparing between sampling dates, for AP only, significant changes were found in zII for the control (F = 4.41, df = 3, p = 0.0192), with slightly higher values in May 2016 (2.45 ± 1.02) and lower values in December 2016 (0.86 ± 0.37). Globally, AP was about 2.5 times significantly higher in zI than in zII (F = 124.91, df = 1, p ≤ 0.0001). For UA, significant differences were found between sampling dates in both zones (Table A1). On average, UA levels were higher in zI (5.67 ± 4.24) compared to zII (4.07 ± 2.92), but no significant differences were observed (F = 3.15, df = 1, p = 0.0808).

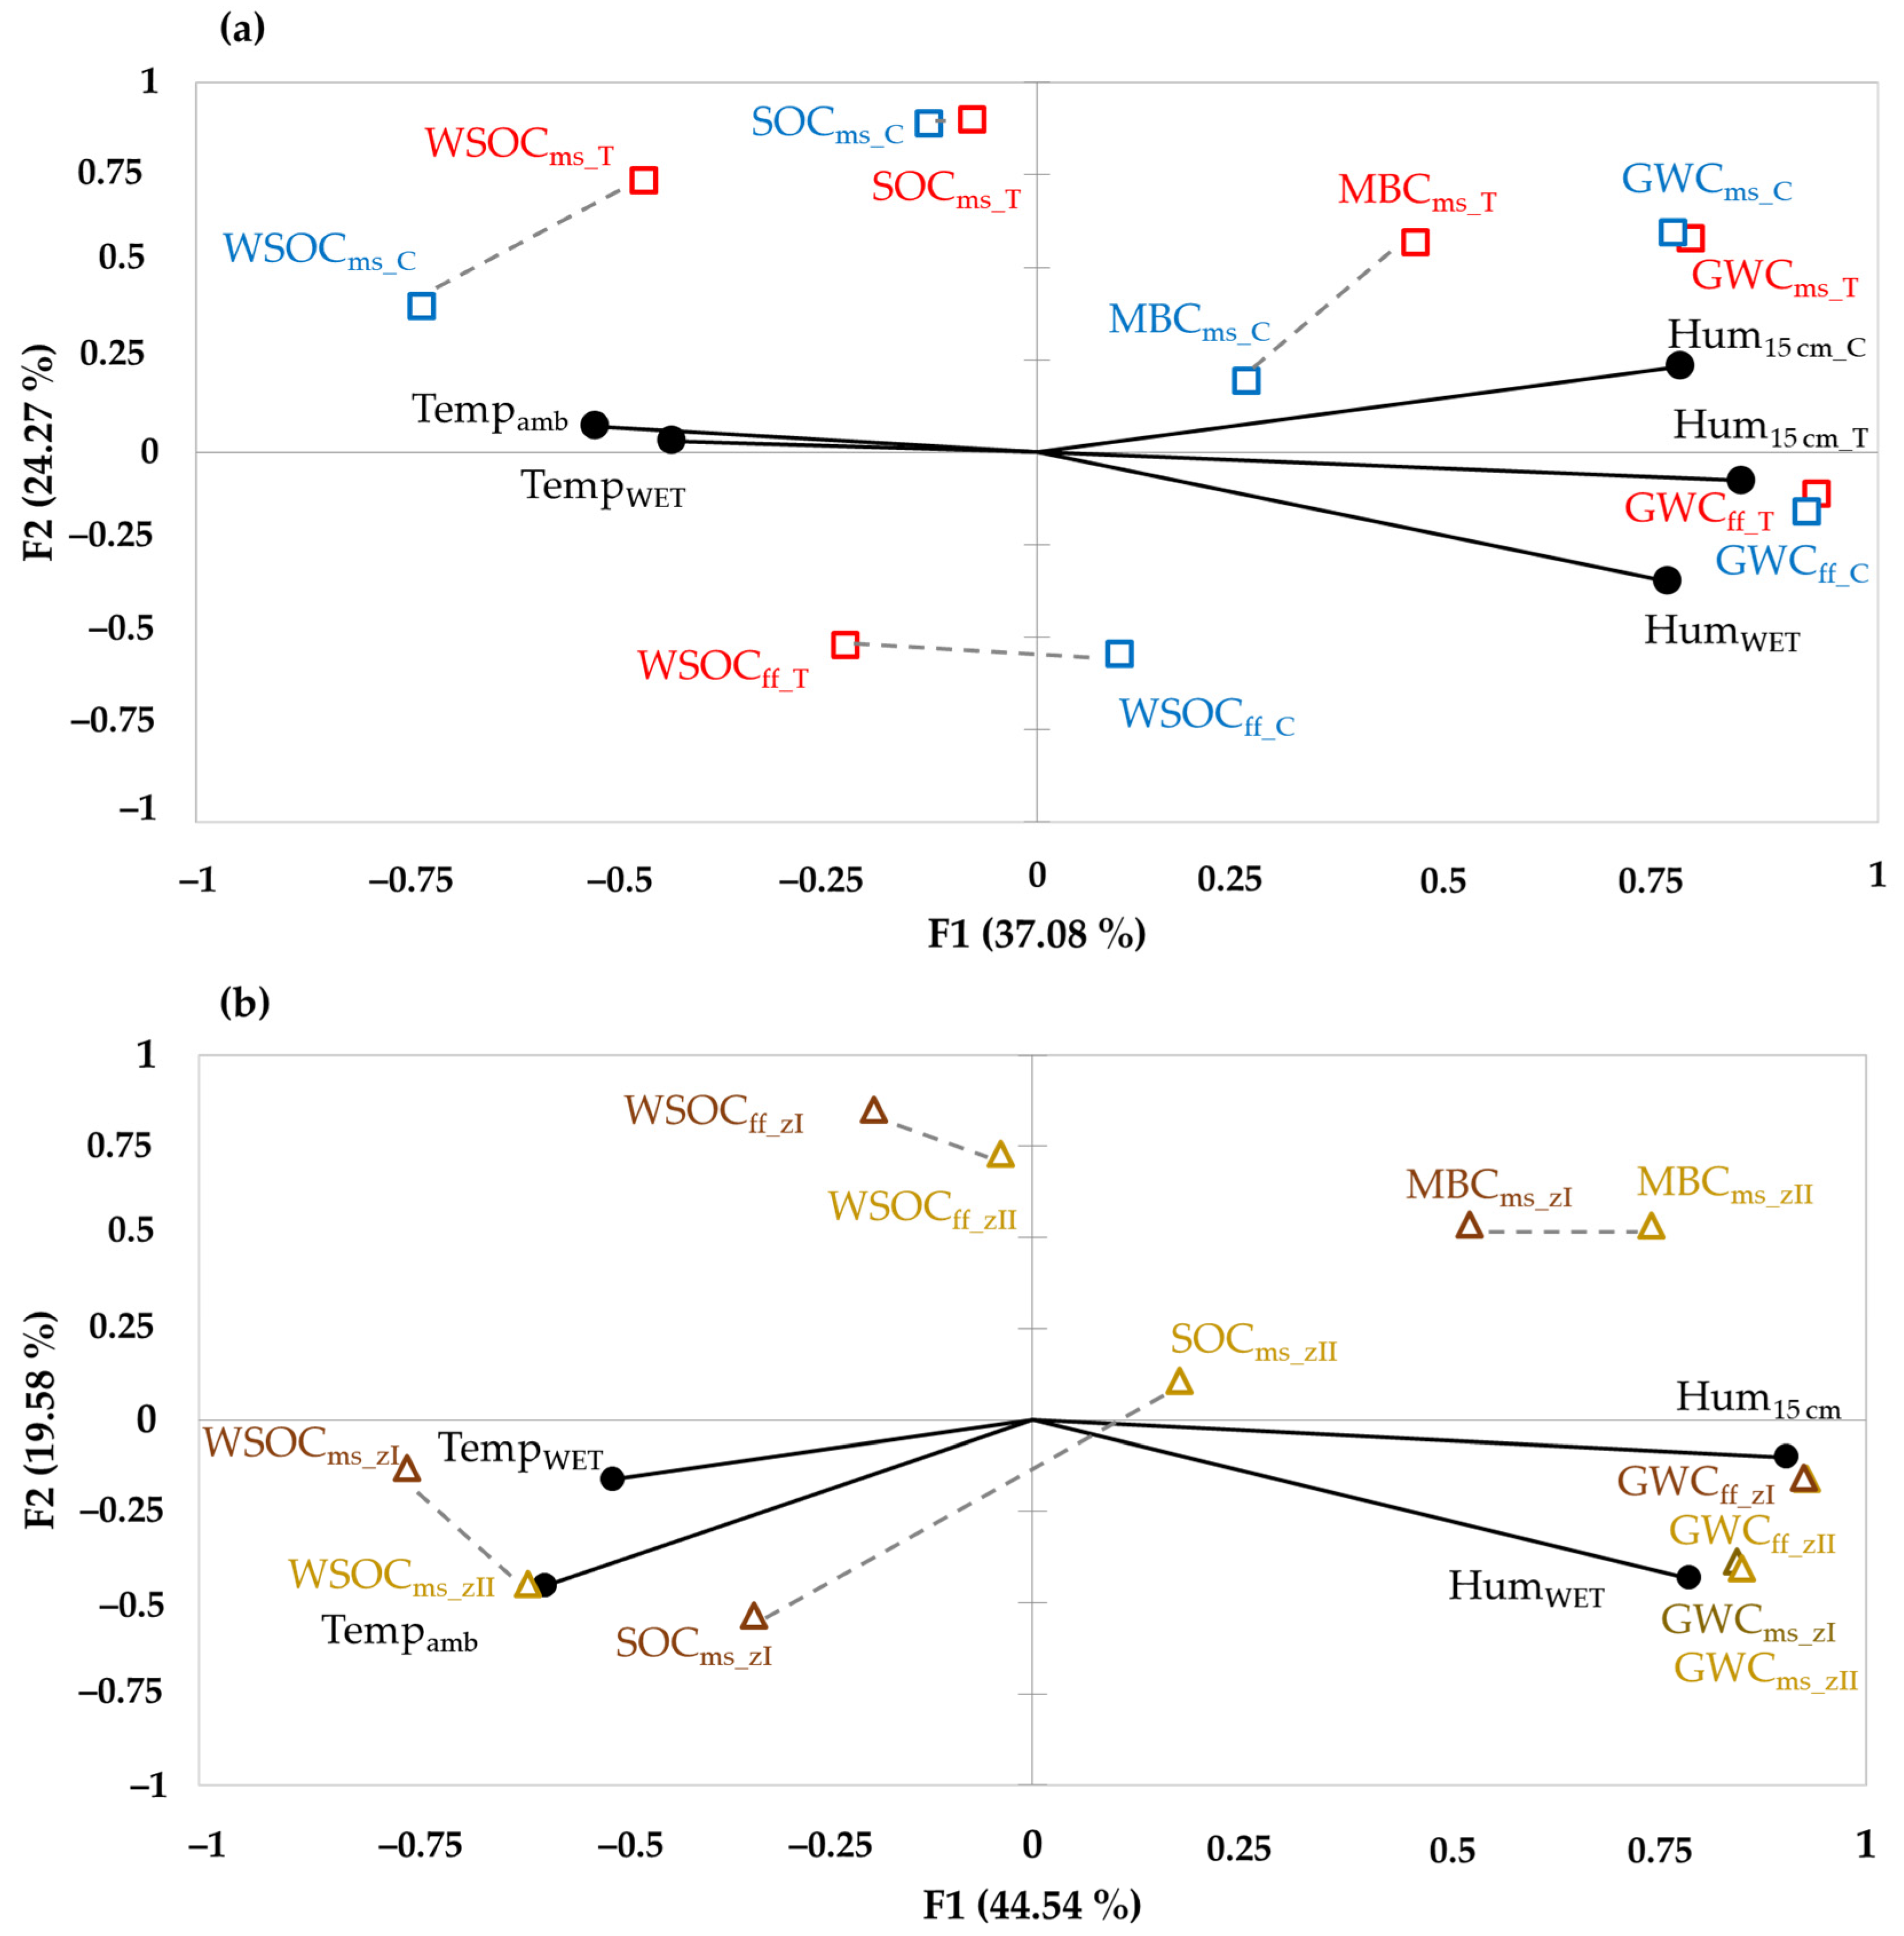
3.4. Correlations between Soil Carbon Fractions and Climate Using Principal Component Analysis (PCA)

Soil carbon fractions, including SOC and soil labile carbon fractions (WSOC and MBC) were correlated with GWC and climatic parameters in two PCAs (Figure 9). For each sampling date, data on ambient air temperature (Tempamb), mean humidity at 15 cm depth (Hum15 cm), and surface soil humidity and temperature measured with WET near the sampling points (HumWET, TWET) were used in the analysis. The first PCA compares the above parameters separating the data by thinning treatment and control plots (Figure 9a). In this way, it is possible to know the correlation between the different parameters studied between the treated plot and the control, and to determine possible correlations with the climatic parameters. As can be seen from the dashed grey lines, the inertia of the treatment (T) and control (C) variables are close, indicating that the effect of thinning has not led to major changes in the soil. Components F1 and F2 explain 61.35% of the variability. The highest factor loadings on component F1 (37.08%), corresponding to the positive x-axis, fall on GWC (with values between 0.758 in mineral soil_C and 0.928 in forest floor_T), MBCms_T (0.452), HumWET (0.751), Hum15cm (T, 0.765; and C, 0.839) and Hum15cm_T (0.703). On the negative x-axis, the temperatures Tempamb (−0.526), TempWET (−0.434), WSOCms_T (−0.467) and WSOCms_C (−0.731) stand out. This means that the F1 component has a strong climatic inertia, with humidity mainly corresponding to the positive axis and temperatures to the negative one. In the F2 component (24.27%), the highest factor loadings correspond to SOCms (T, 0.898; and, C, 0.885), WSOCms_T (0.734) and MBCms_T (0.565), while in the negative component, WSOCff stands out (T, −0.734; and, C, −0.549). According to Spearman’s correlation coefficient (p ≤ 0.05) (Table S3), temperatures do not show significant differences in terms of parameters comparing T and C, while GWC (significantly correlated r > 0.5 with Hum15cm and HumWET) was positively correlated with SOC in the mineral soil of the thinned plot (r = 0.424).
For the second PCA (64.12%), the result of the output correlations is shown in Figure 9b, organising the data by zones (zI and zII). It is observed that the inertia of temperatures and humidity follow a pattern very similar to that of the first PCA. Component F1 (44.54%) shows a higher factor loading for GWC (with maximum values corresponding to the forest floor, both in zI and zII; 0.929 and 0.926, respectively), MBCms_zII (0.742) and HumWET (0.788). In the negative x-component, WSOC stands out (zI, −0.750; and zII, −0.606). Regarding Spearman’s correlations (Table S4), the soil carbon parameters that were significant and positively correlated with Tempamb were SOCms_zI (r = 0.561) and WSOCms_zI (r = 0.439). While GWC was negatively correlated with forest floor WSOC in zI (r = −0.493). However, the most significant thing about this second PCA is that SOCms_zI and SOCms_zII are very distant and, therefore, not correlated by Spearman (r = −0.041), unlike what happened in the first PCA comparing T and C, which showed a significant and positive Spearman correlation (r = 0.850), meaning that the differences in SOC content of the two soil zones could be due to their physicochemical properties and not to an effect of the thinning carried out.

4. Discussion

A very dense pine forest, regenerated after a fire in 1992, was heavily thinned in October 2012. The research of this study is part of a global project to evaluate the effects of adaptive forest management on growth dynamics, water fluxes and soil variables in an Aleppo pine regeneration forest [12,23,34,46,49]. A variety of soil physical (GWC), chemical (SOC and WSOC), and biological (microbial and enzymatic) parameters were assessed at different sampling dates during a five-year period after thinning. In this context, the main objective of this study was to determine the effects of thinning applied (i.e., severe thinning of young pine growing in a high density population) at soil level in the short term. Coarse woody debris was retained in situ to prevent soil erosion and improve soil organic matter. Intense thinning can lead to a rapid decline in aboveground carbon stocks, and belowground carbon pools may exhibit variable responses, and this can significantly influence soil carbon pools and microbial enzyme activity with more pronounced short-term effects. In a first approach, three blocks each of treated and control plots were planned for the study. However, after analysing the samples collected, it was decided that a better approach would be to divide the study areas into zones according to soil properties. The differences in soil properties are related to the tomography presented by del Campo et al. [49], since a rock mass present in the upper zone of both experimental plots limits soil depth, which means that zI has less soil depth and higher stoniness compared to zII (Table S1). A significant difference was the higher level of SOC in zI, although forest cover and forest management were similar in both zones (zI and zII). This could be due to accumulation of stable organic matter in this shallow zI. This could explain that the decomposition of organic matter by microorganisms and its translocation to the deep soil is limited, and therefore in zI there was a higher organic carbon content. Note that the boundary between these two zones is not well defined (Figure 1c), and that the heterogeneity of the terrain makes it impossible to establish a clear boundary between them.
SOC has shown to have positive effects on the mechanical properties of the soil, improving its strength, bulk density and porosity, which favours infiltration, drainage and its storage capacity [59,60]. However, this is not the case at the forest floor level, which may be understandable given its higher water holding capacity and greater exposure to climatic variations [61,62]. For the period studied, no differences were found in the GWC of forest floor and mineral soil between the treated and control plots in both study zones. On average, zI had significantly higher GWCms (about 1.4-fold) than zII, which is justified by the higher organic matter content observed in zI (Figure 4, Table S1). The low precipitation in the first year after thinning could explain partly the small differences in soil moisture in the treated plot compared to the control. The lower GWC content until July 2014 is explained by the lack of rainfall. In fact, during the early recovery period of 1–3 years after thinning there was a drought episode that slowed down and reduced soil changes. The results for GWC in mineral soils were also confirmed in laboratory column tests to determine WHC (Table S2).
Soil carbon fractions are directly related to organic matter and microbial activity [63,64]. In a previous study, we found no direct improvement in SOC and WSOC content in a pine forest in the long term (eleven years after thinning) under a clay-loam soil texture by moderate thinning, but did under the same conditions under a low fertility sandy soil [44]. As explained above, the effects of thinning depend on multiple factors, and SOC and WSOC content can be improved or worsened depending on aspects such as the intensity of thinning, species, age, physicochemical properties of soils, microorganisms, etc. [33,34,65,66]. The significantly higher content (about 2- to 3-fold) of SOCms in zI compared to zII (Figure 4) is explained by the peculiarity of the terrain, which was not affected by the silvicultural treatments applied, nor were significant differences observed between treatment and control. In fact, the accumulation of organic matter in a smaller volume of soil justifies the higher zI values obtained. These results are in line with what was observed for the content of WSOCms, which was about 3.8-fold significantly higher in zI; on the contrary, WSOCff presented about 6.7-fold significantly higher values in zII. Higher WSOC values are usually correlated with greater soil moisture and higher SOC levels [44]. In addition, the autumn–winter of 2016 was wetter, with this being a possible explanation for the significantly higher WSOCms values observed in June 2017. No significant differences between treatment and control were observed for WSOCff. However, different studies report that heavy thinning, especially in the short term (i.e., the first 5 years), reduces litterfall and consequently the different organic carbon fractions [66,67]. The reduction in litterfall may be compensated by the organic debris left with the thinning treatment. As indicated by del Río et al. [68], heavy thinning results in a loss of volume yield, but the extent depends on location, site and stand age. No significant differences between T and C were found for MBC in zII, and those found in zI were not consistent. However, Kim et al. [69] observed higher MBC 7 years after an intermediate and a heavy thinning treatment, which was associated with the presence of higher amounts of residue in the soil. Comparing different plots, they reported difficulties in interpreting the relationship between the amount of thinning residues and the site-specific effect of thinning due to the high heterogeneity observed. MBC also confirmed previous results on labile carbon-fractions, showing significant differences of about 1.4-fold greater in zI than in zII (Figure 6). Soil organic carbon acts as a substrate and energy source for microbial biomass growth and activity, with greater differences observed for SOC in zI between the treated and control plots. In fact, soil microbial biomass is mainly found in organic matter and is essential for decomposition and formation of the soil carbon pool, which is used as an indicator of soil quality [70,71]. These results were correlated by Spearman (Figure 9), which showed a clear correlation in the SOC content (r = 0.85) when the data were examined globally between treatment and control, rather than when they were examined comparing zI and zII (r = −0.041). It should be noted that, although it was not possible to establish a clear relationship between the sampled data and climate based on the punctual measurements made, it can be observed that the main component of the abscissa axis in the PCAs (Figure 9) was mainly conditioned by soil and ambient temperatures at the negative end and by soil humidity at the positive end, indicating the close relationship between climate and microbial activity. Zhang et al. [14] explain the direct effects of increasing soil temperature and microbial activity by increasing thinning intensity. This is also explained by changes in microbial communities associated with climate change [72,73]. The ordinate axis of the PCA seems to be related to the treatment, with all the biological variables possibly influenced by the organic matter content, observing that zI seems to be more dependent on temperature than zII, which could be explained by the fact that it is in the high area of the mountain slope and receives greater solar radiation due to the lower slope and NW orientation. BSR is another quality indicator related to soil respiration and corresponds to the CO2 released by microbial mineralisation of soil organic matter [34]. As a result, BSR measured 4 and 5 years after thinning did not show significant differences between the two zones or between the two treatments due to the high variability observed in the samples although, on average, zI had a higher respiration rate than zone II. In fact, BSR is directly related to organic matter content and influenced by the size and activity of the microbial biomass [74,75]. Mainly in zI it is observed that respiration is higher when the MBC is higher.
Two extracellular enzymes related to phosphorus and nitrogen cycles were selected in this study (i.e., AP and UA, respectively), which are also established as indicators of soil quality [76,77]. No significant differences were found between treatment and control for either enzyme activity, indicating no significant changes due to thinning. However, the spatial heterogeneity of both enzymes but mainly that of UA should be taken into account. Significantly, about 2.5-fold higher levels of AP were produced in zI than in zII (Figure 8), associated with higher SOC content. Slightly higher levels of UA were also observed in zI, but not significantly, and this enzymatic activity seemed to be independent of soil and treatment, perhaps because pine debris is a very poor nitrogen material. These results support the importance of the quality of organic matter in the microbial activity [78,79]. A high variability between sampling dates was observed indicating a high activity dependence with climate [44]. In fact, enzyme activity is extremely dependent on temperature, humidity, pH, substrate availability and other related soil chemical properties, as shown in several studies [80,81,82].

5. Conclusions

The main conclusion of this research is that the effect of heavy thinning applied in the young pine stand has not had a negative impact on the seasonally studied carbon pools and microbiological properties of the soil in the short term. A difference in organic matter content conditioned by soil depth and stoniness in the two established zones of the experimental slope explained most of the observed differences found related to carbon pools and microbial activity. In this sense, SOC, MBC and AP were regulated by intrinsic soil properties. However, WSOC and UA variations were correlated with climatic factors. The central hypothesis was not fulfilled because microbial activity is more controlled by soil organic matter content, which in our study site depends more on soil characteristics, than by thinning effects, which were only visible in zI. Although small significant differences were observed at the soil level between treatments for each sampling date, a strong seasonal dependence on microbial activity was observed, conditioned mainly by temperature and humidity. Thinning in semi-arid P. halepensis forests can have complex and site-specific effects on soil organic carbon pools and microbial activity. It can be concluded that the thinning carried out improved the conditions for the development of the pines in the short term, reducing the competition between them for natural resources without having a negative impact in the soil. All this allows the ecology of the site to be in balance and the edaphic processes linked to microbiological aspects to be adequate. Understanding thinning effects is important for promoting sustainable forest management practices and maintaining ecosystem health. Research under the same conditions may reveal greater differences in a non-extreme climate with milder temperatures and higher rainfall. In the context of this study, further research to deepen the understanding of the relationship between soil properties and organic matter accumulation is needed to better understand soil organic carbon dynamics and nutrient availability in managed forest ecosystems and inform forest management decisions. MBC variations should be worth being addressed by further studies in order to better understand its changes with seasonality and thinning treatment. Long-term thinning studies of the variables included in this study are needed for long-term forest ecosystem monitoring. The relationship between MBC, microbial activity, WSOC, enzyme activities and soil microclimate needs further studies to understand the effect of thinning on soil processes such as organic matter decomposition.

Supplementary Materials

The following supporting information can be downloaded at: https://www.mdpi.com/article/10.3390/f15040658/s1, Table S1: Stoniness, root weight and elemental composition of macronutrients (Ca, Mg, S), micronutrients (Fe, Cu, Mn, Zn) and heavy metals (Cd, As) for each zone studied (zI and zII) at depths of 0–5 cm and 5–20 cm. Data are presented as mean ± standard deviation (n = 3 for zI and n = 5 for zII) corresponding to the sampling carried out in March 2013 at the beginning of the study; Table S2: Soil chemical and physical properties for each zone (zI, zII) at depth of 0-15 cm. Data are means and standard deviations of samples (n = 9 and 8 for zI and zII, respectively) taken in May 2014; Table S3: Spearman’s correlation matrix between several soil carbon fractions (soil organic carbon in mineral soil—SOCms, water-soluble organic carbon in forest floor—WSOCff and mineral soil—WSOCms, and microbial biomass carbon in mineral soil—MBCms), gravimetric water content in forest floor—GWCff and mineral soil—GWCms, and climate parameters (ambient temperature—Tempamb and WET temperature—TempWET) separating data by thinning treatment (T) and control (C) plots; Table S4: Spearman’s correlation matrix between several soil carbon fractions (soil organic carbon in mineral soil—SOCms, water-soluble organic carbon in forest floor—WSOCff and mineral soil—WSOCms, and microbial biomass carbon in mineral soil—MBCms), gravimetric water content in forest floor—GWCff and mineral soil—GWCms, and climate parameters (ambient temperature—Tempamb and WET temperature—TempWET) organizing data by zone I (zI) and zone II (zII).

Author Contributions

Conceptualization and methodology, C.L., I.B. and A.L.; formal analysis, C.L., I.B., A.L. and R.G.-O. (data); investigation, C.L., I.B. and A.L.; resources, C.L. and R.G.-O.; writing—original draft preparation, C.L., R.G.-O., I.B. and A.L.; writing—review and editing, C.L., R.G.-O., I.B., A.L. and A.d.C.; funding acquisition, A.d.C. All authors have read and agreed to the published version of the manuscript.

Funding

This study is a component of research projects: HYDROSIL (CGL2011-28776-C02-02) and SILWAMED (CGL2014-58127-C3-2) and CEHYRFO-MED (CGL2017-86839-C3-2-R) funded by the Spanish Ministry of Science and Innovation.

Data Availability Statement

The data presented in this study are available upon request from the corresponding author.

Acknowledgments

The authors are grateful to the Valencia Regional Government (CMAAUV, Generalitat Valenciana) for it supports in allowing the use of the experimental forest. We thank Joana Oliver for her laboratory and technical assistance.

Conflicts of Interest

The authors declare no conflicts of interest.

Appendix A

Table A1. Summary of two-way ANOVA for the gravimetric water content (GWC), soil organic carbon (SOC), water-soluble organic carbon (WSOC) and microbial and enzyme soil parameters (microbial biomass carbon—MBC and basal soil respiration—BSR, acid phosphatase activity—AP, urease activity—UA) tested in each zone/horizon (I, II/forest floor—ff, mineral soil—ms) using treatment (T) or sampling date (S) as factors and their interactions (T × S) in terms of F, df, and p-value.
Parameter 2 Factor/Interaction
Treatment (T)Sampling Date (S)T × S Residuals
ZonehorizonFdfp-Value 1Fdfp-Value 1Fdfp-Value 1df
GWC
(Log10-Transformed)
Iff16.2810.0001 ***45.6111< 0.0001 ***1.47110.1600 ns80
IIff23.631<0.0001 ***74.0811< 0.0001 ***2.13110.0288 *71
Ims7.5010.0074 **19.3312< 0.0001 ***0.91120.540691
IIms9.9410.0023 **32.4312< 0.0001 ***2.77120.0035 **78
SOC
(Log10-Transformed)
Ims0.5710.4531 ns0.79120.6572 ns0.57120.8609 ns91
IIms0.0110.9241 ns0.73120.7169 ns0.48120.9222 ns78
WSOC
(Log10-Transformed)
Iff5.9610.0169 *3.15110.0014 **0.68110.7559 ns79
IIff2.1310.1490 ns11.3511< 0.0001 ***0.94110.5117 ns65
Ims2.6210.1097 ns7.1911< 0.0001 ***1.03110.4292 ns82
IIms0.0010.9502 ns12.9711< 0.0001 ***0.60110.8239 ns72
MBCIms2.3910.1335 ns5.5630.0040 **8.0730.0005 ***28
IIms0.0810.7737 ns1.7230.1901 ns0.6130.6143 ns24
BSR
(Log10-Transformed)
Ims0.0010.9663 ns11.6110.0043 **0.0110.9403 ns14
IIms3.5310.0847 ns0.4810.5014 ns0.0010.9578 ns12
APIms0.0010.9840 ns3.7530.0222 *0.8030.5018 ns28
IIms0.2510.6247 ns2.2730.1057 ns1.8630.1641 ns24
UAIms0.4710.5001 ns4.4030.0121 *0.1330.9383 ns27
IIms2.4710.1294 ns8.7330.0004 ***0.9630.4254 ns24
1 Level of significance: non-significant (ns) or significant results at p ≤ 0.05 (*), 0.01 (**), or 0.001 (***). 2 LOG10 transformation was used to satisfy the normality and homoscedasticity requirements.

References

  1. Mauri, A.; Di Leo, M.; de Rigo, D.; Caudullo, G. Pinus halepensis and Pinus brutia in Europe: Distribution, habitat, usage and threats. In European Atlas of Forest Tree Species; San-Miguel-Ayanz, J., de Rigo, D., Caudullo, G., Houston-Durrant, T., Mauri, A., Eds.; Publication Office of the European Union: Luxembourg, 2016; pp. 122–123. [Google Scholar]
  2. Picornell-Gelabert, L.; Servera-Vives, G.; Carrión Marco, Y.; Burjachs, F.; Currás, A.; Llergo, Y.; Dufraisse, A.; De Luís Arrillaga, M.; Mus Amézquita, M. Late Holocene Aleppo pine (Pinus halepensis Miller) woodlands in Mallorca (Balearic Islands, Western Mediterranean): Investigation of their distribution and the role of human management based on anthracological, dendro-anthracological and archaeopalynological data. Quat. Int. 2021, 593–594, 346–363. [Google Scholar] [CrossRef]
  3. Ruiz-Navarro, A.; Barberá, G.G.; Navarro-Cano, J.A.; Albaladejo, J.; Castillo, V.M. Soil dynamics in Pinus halepensis reforestation: Effect of microenvironments and previous land use. Geoderma 2009, 153, 353–361. [Google Scholar] [CrossRef]
  4. Maestre, F.T.; Cortina, J. Are Pinus halepensis plantations useful as a restoration tool in semiarid Mediterranean areas? For. Ecol. Manag. 2004, 198, 303–317. [Google Scholar] [CrossRef]
  5. Moreno, M.; Bertolín, C.; Arlanzón, D.; Ortiz, P.; Ortiz, R. Climate change, large fires, and cultural landscapes in the mediterranean basin: An analysis in southern Spain. Heliyon 2023, 9, e16941. [Google Scholar] [CrossRef] [PubMed]
  6. Nunes, A.; Oliveira, G.; Cabral, M.S.; Branquinho, C.; Correia, O. Beneficial effect of pine thinning in mixed plantations through changes in the understory functional composition. Ecol. Eng. 2014, 70, 387–396. [Google Scholar] [CrossRef]
  7. Hernandez-Tecles, E.; Osem, Y.; Alfaro Sánchez, R.; Heras, J. Vegetation structure of planted versus natural Aleppo pine stands along a climatic gradient in Spain. Ann. For. Sci. 2015, 72, 641–650. [Google Scholar] [CrossRef]
  8. Kaarakka, L.; Cornett, M.; Domke, G.; Ontl, T.; Dee, L. Improved forest management as a natural climate solution: A review. Ecol. Solut. Evid. 2021, 2, e12090. [Google Scholar] [CrossRef]
  9. Zhang, X.; Guan, D.; Li, W.; Sun, D.; Jin, C.; Yuan, F.; Wang, A.; Wu, J. The effects of forest thinning on soil carbon stocks and dynamics: A meta-analysis. For. Ecol. Manag. 2018, 429, 36–43. [Google Scholar] [CrossRef]
  10. Li, X.; Li, Y.; Zhang, J.; Peng, S.; Chen, Y.; Cao, Y. The effects of forest thinning on understory diversity in China: A meta-analysis. Land. Degrad. Dev. 2020, 31, 1225–1240. [Google Scholar] [CrossRef]
  11. Zhou, T.; Wang, C.; Zhou, Z. Impacts of forest thinning on soil microbial community structure and extracellular enzyme activities: A global meta-analysis. Soil Biol. Biochem. 2020, 149, 107915. [Google Scholar] [CrossRef]
  12. del Campo, A.D.; Otsuki, K.; Serengil, Y.; Blanco, J.A.; Yousefpour, R.; Wei, X. A global synthesis on the effects of thinning on hydrological processes: Implications for forest management. For. Ecol. Manag. 2022, 519, 120324. [Google Scholar] [CrossRef]
  13. Xu, M.; Liu, H.; Zhang, Q.; Zhang, Z.; Ren, C.; Feng, Y.; Yang, G.; Han, X.; Zhang, W. Effect of forest thinning on soil organic carbon stocks from the perspective of carbon-degrading enzymes. Catena 2022, 218, 106560. [Google Scholar] [CrossRef]
  14. Zhang, X.; Chen, L.; Wang, Y.; Jiang, P.; Hu, Y.; Ouyang, S.; Wu, H.; Lei, P.; Kuzyakov, Y.; Xiang, W. Plantations thinning: A meta-analysis of consequences for soil properties and microbial functions. Sci. Total Environ. 2023, 877, 162894. [Google Scholar] [CrossRef] [PubMed]
  15. Zhang, H.; Liu, S.; Yu, J.; Li, J.; Shangguan, Z.; Deng, L. Thinning increases forest ecosystem carbon stocks. For. Ecol. Manag. 2024, 555, 121702. [Google Scholar] [CrossRef]
  16. Olivar, J.; Bogino, S.; Rathgeber, C.; Bonnesoeur, V.; Bravo, F. Thinning has a positive effect on growth dynamics and growth-climate relationships in Aleppo pine (Pinus halepensis) trees of different crown classes. Ann. For. Sci. 2014, 71, 395–404. [Google Scholar] [CrossRef]
  17. Calev, A.; Zoref, C.; Tzukerman, M.; Moshe, Y.; Zangy, E.; Osem, Y. High-intensity thinning treatments in mature Pinus halepensis plantations experiencing prolonged drought. Eur. J. For. Res. 2016, 135, 551–563. [Google Scholar] [CrossRef]
  18. Sohn, J.A.; Saha, S.; Bauhus, J. Potential of forest thinning to mitigate drought stress: A meta-analysis. For. Ecol. Manag. 2016, 380, 261–273. [Google Scholar] [CrossRef]
  19. Gavinet, J.; Ourcival, J.M.; Gauzere, J.; García de Jalón, L.; Limousin, J.M. Drought mitigation by thinning: Benefits from the stem to the stand along 15 years of experimental rainfall exclusion in a holm oak coppice. For. Ecol. Manag. 2020, 473, 118266. [Google Scholar] [CrossRef]
  20. Navarro-Cerrillo, R.M.; Cachinero-Vivar, A.M.; Pérez-Priego, Ó.; Aspizua Cantón, R.; Begueria, S.; Camarero, J.J. Developing alternatives to adaptive silviculture: Thinning and tree growth resistance to drought in a Pinus species on an elevated gradient in Southern Spain. For. Ecol. Manag. 2023, 537, 120936. [Google Scholar] [CrossRef]
  21. Tonelli, E.; Vitali, A.; Brega, F.; Gazol, A.; Colangelo, M.; Urbinati, C.; Camarero, J.J. Thinning improves growth and resilience after severe droughts in Quercus subpyrenaica coppice forests in the Spanish Pre-Pyrenees. Dendrochronologia 2023, 77, 126042. [Google Scholar] [CrossRef]
  22. Dang, P.; Gao, Y.; Liu, J.; Yu, S.; Zhao, Z. Effects of thinning intensity on understory vegetation and soil microbial communities of a mature Chinese pine plantation in the Loess Plateau. Sci. Total Environ. 2018, 630, 171–180. [Google Scholar] [CrossRef] [PubMed]
  23. Bautista, I.; Lidón, A.; Lull, C.; González-Sanchis, M.; del Campo, A.D. Thinning decreased soil respiration differently in two dryland Mediterranean forests with contrasted soil temperature and humidity regimes. Eur. J. For. Res. 2021, 140, 1469–1485. [Google Scholar] [CrossRef]
  24. Elkin, C.; Giuggiola, A.; Rigling, A.; Bugmann, H. Short- and long-term efficacy of forest thinning to mitigate drought impacts in mountain forests in the European Alps. Ecol. Appl. 2015, 25, 1083–1098. [Google Scholar] [CrossRef] [PubMed]
  25. Yang, L.; Niu, S.; Tian, D.; Zhang, C.; Liu, W.; Yu, Z.; Yan, T.; Yang, W.; Zhao, X.; Wang, J. A global synthesis reveals increases in soil greenhouse gas emissions under forest thinning. Sci. Total Environ. 2022, 804, 150225. [Google Scholar] [CrossRef] [PubMed]
  26. Pan, Y.; Birdsey, R.A.; Fang, J.; Houghton, R.; Kauppi, P.E.; Kurz, W.A.; Phillips, O.L.; Shvidenko, A.; Lewis, S.L.; Canadell, J.G.; et al. A large and persistent carbon sink in the world’s forests. Science 2011, 333, 988–993. [Google Scholar] [CrossRef] [PubMed]
  27. Stockmann, U.; Adams, M.A.; Crawford, J.W.; Field, D.J.; Henakaarchchi, N.; Jenkins, M.; Minasny, B.; McBratney, A.B.; Courcelles, V.d.R.d.; Singh, K.; et al. The knowns, known unknowns and unknowns of sequestration of soil organic carbon. Agric. Ecosyst. Environ. 2013, 164, 80–99. [Google Scholar] [CrossRef]
  28. Cheng, X.; Yu, M.; Wang, G. Effects of thinning on soil organic carbon fractions and soil properties in Cunninghamia lanceolata stands in Eastern China. Forests 2017, 8, 198. [Google Scholar] [CrossRef]
  29. Ma, J.; Kang, F.; Cheng, X.; Han, H. Moderate thinning increases soil organic carbon in Larix principis-rupprechtii (Pinaceae) plantations. Geoderma 2018, 329, 118–128. [Google Scholar] [CrossRef]
  30. Mayer, M.; Baltensweiler, A.; James, J.; Rigling, A.; Hagedorn, F. A global synthesis and conceptualization of the magnitude and duration of soil carbon losses in response to forest disturbances. Glob. Ecol. Biogeogr. 2024, 33, 141–150. [Google Scholar] [CrossRef]
  31. Sądej, W.; Żołnowski, C.A. Comparison of the effect of various long-term fertilization systems on the content and fractional composition of humic compounds in Lessive soil. Plant Soil Environ. 2019, 65, 172–180. [Google Scholar] [CrossRef]
  32. Adamczyk, B.; Adamczyk, S.; Kukkola, M.; Tamminen, P.; Smolander, A. Logging residue harvest may decrease enzymatic activity of boreal forest soils. Soil Biol. Biochem. 2015, 82, 74–80. [Google Scholar] [CrossRef]
  33. Gong, C.; Tan, Q.; Liu, G.; Xu, M. Forest thinning increases soil carbon stocks in China. For. Ecol. Manag. 2021, 482, 118812. [Google Scholar] [CrossRef]
  34. Lull, C.; Bautista, I.; Lidón, A.; del Campo, A.D.; González-Sanchis, M.; García-Prats, A. Temporal effects of thinning on soil organic carbon pools, basal respiration and enzyme activities in a Mediterranean Holm oak forest. For. Ecol. Manag. 2020, 464, 118088. [Google Scholar] [CrossRef]
  35. Yang, L.; Wang, J.; Geng, Y.; Niu, S.; Tian, D.; Yan, T.; Liu, W.; Pan, J.; Zhao, X.; Zhang, C. Heavy thinning reduces soil organic carbon: Evidence from a 9-year thinning experiment in a pine plantation. Catena 2022, 211, 106013. [Google Scholar] [CrossRef]
  36. Zhang, Z.; Yan, J.; Han, X.; Zou, W.; Chen, X.; Lu, X.; Feng, Y. Labile organic carbon fractions drive soil microbial communities after long-term fertilization. Glob. Ecol. Conserv. 2021, 32, e01867. [Google Scholar] [CrossRef]
  37. Scaglia, B.; Adani, F. Biodegradability of soil water soluble organic carbon extracted from seven different soils. J. Environ. Sci. 2009, 21, 641–646. [Google Scholar] [CrossRef]
  38. Chen, X.; Chen, H.Y.H.; Chen, X.; Wang, J.; Chen, B.; Wang, D.; Guan, Q. Soil labile organic carbon and carbon-cycle enzyme activities under different thinning intensities in Chinese fir plantations. Appl. Soil. Ecol. 2016, 107, 162–169. [Google Scholar] [CrossRef]
  39. Wang, D.; Chen, X.; Chen, H.Y.H.; Olatunji, O.A.; Guan, Q. Contrasting effects of thinning on soil CO2 emission and above- and belowground carbon regime under a subtropical Chinese fir plantation. Sci. Total Environ. 2019, 690, 361–369. [Google Scholar] [CrossRef] [PubMed]
  40. Lei, L.; Xiao, W.; Zeng, L.; Zhu, J.; Huang, Z.; Cheng, R.; Gao, S.; Li, M.-H. Thinning but not understory removal increased heterotrophic respiration and total soil respiration in Pinus massoniana stands. Sci. Total Environ. 2018, 621, 1360–1369. [Google Scholar] [CrossRef]
  41. Sullivan, B.W.; Kolb, T.E.; Hart, S.C.; Kaye, J.P.; Dore, S.; Montes-Helu, M. Thinning reduces soil carbon dioxide but not methane flux from southwestern USA ponderosa pine forests. For. Ecol. Manag. 2008, 255, 4047–4055. [Google Scholar] [CrossRef]
  42. Yang, L.; Qin, J.; Geng, Y.; Zhang, C.; Pan, J.; Niu, S.; Tian, D.; Zhao, X.; Wang, J. Long-term effects of forest thinning on soil respiration and its components in a pine plantation. For. Ecol. Manag. 2022, 513, 120189. [Google Scholar] [CrossRef]
  43. Zhou, Z.; Wang, C.; Jin, Y.; Sun, Z. Impacts of thinning on soil carbon and nutrients and related extracellular enzymes in a larch plantation. For. Ecol. Manag. 2019, 450, 117523. [Google Scholar] [CrossRef]
  44. Lull, C.; Gil-Ortiz, R.; Bautista, I.; Lidón, A. Seasonal variation and soil texture-related thinning effects on soil microbial and enzymatic properties in a semi-arid pine forest. Forests 2023, 14, 1674. [Google Scholar] [CrossRef]
  45. Zeng, L.; Xiao, W.; Liu, C.; Lei, L.; Jian, Z.; Shen, Y.; Li, M.-H. Effects of thinning and understorey removal on soil extracellular enzyme activity vary over time during forest recovery after treatment. Plant Soil 2023, 492, 457–469. [Google Scholar] [CrossRef]
  46. del Campo, A.D.; González-Sanchis, M.; Lidón, A.; Ceacero, C.J.; García-Prats, A. Rainfall partitioning after thinning in two low-biomass semiarid forests: Impact of meteorological variables and forest structure on the effectiveness of water-oriented treatments. J. Hydrol. 2018, 565, 74–86. [Google Scholar] [CrossRef]
  47. Liu, Y.; Hao, L.; Zhou, D.; Pan, C.; Liu, P.; Xiong, Z.; Sun, G. Identifying a transition climate zone in an arid river basin using the evaporative stress index. Nat. Hazards Earth Syst. Sci. 2019, 19, 2281–2294. [Google Scholar] [CrossRef]
  48. Bešťáková, Z.; Strnad, F.; Vargas Godoy, M.R.; Singh, U.; Markonis, Y.; Hanel, M.; Máca, P.; Kyselý, J. Changes of the aridity index in Europe from 1950 to 2019. Theor. Appl. Climatol. 2023, 151, 587–601. [Google Scholar] [CrossRef]
  49. del Campo, A.D.; González-Sanchis, M.; Molina, A.J.; García-Prats, A.; Ceacero, C.J.; Bautista, I. Effectiveness of water-oriented thinning in two semiarid forests: The redistribution of increased net rainfall into soil water, drainage and runoff. For. Ecol. Manag. 2019, 438, 163–175. [Google Scholar] [CrossRef]
  50. Walkley, A.; Black, I.A. An examination of the Degtjareff method for determining soil organic matter, and a proposed modification of the chromic acid titration method. Soil Sci. 1934, 37, 29–38. [Google Scholar] [CrossRef]
  51. Forster, J.C. Soil physical analysis. Determination of the gravimetric water content and soil dry mass. In Methods in Applied soil Microbiology and Biochemistry; Alef, K., Nannipieri, P., Eds.; Academic Press: London, UK, 1995; pp. 105–116. [Google Scholar]
  52. Bouyoucos, G.J. The hydrometer as a new method for the mechanical analysis of soils. Soil Sci. 1927, 23, 343–354. [Google Scholar] [CrossRef]
  53. Topp, G.C.; Ferré, T.P.A. Measuring Soil Water Content. In Encyclopedia of Hydrological Sciences; Anderson, M.G., McDonnell, J.J., Eds.; John Wiley & Sons, Inc.: Hoboken, NJ, USA, 2005. [Google Scholar] [CrossRef]
  54. MAPAMA. Available online: https://eportal.mapa.gob.es/websiar/SeleccionParametrosMap.aspx?dst=1 (accessed on 1 January 2024).
  55. Vance, E.D.; Brookes, P.C.; Jenkinson, D.S. An extraction method for measuring soil microbial biomass C. Soil Biol. Biochem. 1987, 19, 703–707. [Google Scholar] [CrossRef]
  56. Yakovchenko, V.; Sikora, L.J. Modified dichromate method for determining low concentrations of extractable organic carbon in soil. Commun. Soil Sci. Plant Anal. 1998, 29, 421–433. [Google Scholar] [CrossRef]
  57. Tabatabai, M.A.; Bremner, J.M. Use of p-nitrophenyl phosphate for assay of soil phosphatase activity. Soil Biol. Biochem. 1969, 1, 301–307. [Google Scholar] [CrossRef]
  58. Nannipieri, P.; Ceccanti, B.; Cervelli, S.; Matarese, E. Extraction of phosphatase, urease, proteases, organic carbon, and nitrogen from soil. Soil Sci. Soc. Am. J. 1980, 44, 1011–1016. [Google Scholar] [CrossRef]
  59. Obour, P.B.; Jensen, J.L.; Lamandé, M.; Watts, C.W.; Munkholm, L.J. Soil organic matter widens the range of water contents for tillage. Soil Tillage Res. 2018, 182, 57–65. [Google Scholar] [CrossRef] [PubMed]
  60. Voroney, P. Chapter 4—Soils for Horse Pasture Management. In Horse Pasture Management; Sharpe, P., Ed.; Academic Press, Inc.: London, UK, 2019; pp. 65–79. [Google Scholar] [CrossRef]
  61. Aleš, K.; Pavel, S.; Aleš, B.; Keith Ronald, S.; Tomáš, V.; Valerie, V.; Ram Swaroop, M.; Rahul, D. Forest soil water in landscape context. In Soil Moisture Importance; Ram Swaroop, M., Rahul, D., Eds.; IntechOpen: Rijeka, Croatia, 2020; Chapter 3. [Google Scholar]
  62. Wu, H.; Hu, B.; Yan, J.; Cheng, X.; Yi, P.; Kang, F.; Han, H. Mixed plantation regulates forest floor water retention and temperature sensitivity in restored ecosystems on the Loess Plateau, China. Catena 2023, 222, 106838. [Google Scholar] [CrossRef]
  63. Tian, J.; McCormack, L.; Wang, J.; Guo, D.; Wang, Q.; Zhang, X.; Yu, G.; Blagodatskaya, E.; Kuzyakov, Y. Linkages between the soil organic matter fractions and the microbial metabolic functional diversity within a broad-leaved Korean pine forest. Eur. J. Soil Biol. 2015, 66, 57–64. [Google Scholar] [CrossRef]
  64. Bahadori, M.; Chen, C.; Lewis, S.; Boyd, S.; Rashti, M.R.; Esfandbod, M.; Garzon-Garcia, A.; Van Zwieten, L.; Kuzyakov, Y. Soil organic matter formation is controlled by the chemistry and bioavailability of organic carbon inputs across different land uses. Sci. Total Environ. 2021, 770, 145307. [Google Scholar] [CrossRef] [PubMed]
  65. Mayer, M.; Prescott, C.E.; Abaker, W.E.A.; Augusto, L.; Cécillon, L.; Ferreira, G.W.D.; James, J.; Jandl, R.; Katzensteiner, K.; Laclau, J.P.; et al. Influence of forest management activities on soil organic carbon stocks: A knowledge synthesis. For. Ecol. Manag. 2020, 466, 118127. [Google Scholar] [CrossRef]
  66. Nave, L.E.; Vance, E.D.; Swanston, C.W.; Curtis, P.S. Harvest impacts on soil carbon storage in temperate forests. For. Ecol. Manag. 2010, 259, 857–866. [Google Scholar] [CrossRef]
  67. Han, S.H.; An, J.Y.; Hernandez, J.O.; Yang, H.M.; Kim, E.-S.; Noh, N.J.; Seo, J.M.; Park, B.B. Effects of thinning intensity on litterfall production, soil chemical properties, and fine root distribution in Pinus koraiensis plantation in Republic of Korea. Plants 2023, 12, 3614. [Google Scholar] [CrossRef] [PubMed]
  68. del Río, M.; Bravo-Oviedo, A.; Pretzsch, H.; Löf, M.; Ruiz-Peinado, R. A review of thinning effects on scots pine stands: From growth and yield to new challenges under global change. For. Syst. 2017, 26, eR03S. [Google Scholar] [CrossRef]
  69. Kim, S.; Li, G.; Han, S.H.; Kim, H.-J.; Kim, C.; Lee, S.-T.; Son, Y. Thinning affects microbial biomass without changing enzyme activity in the soil of Pinus densiflora Sieb. et Zucc. forests after 7 years. Ann. For. Sci. 2018, 75, 13. [Google Scholar] [CrossRef]
  70. Das, S.; Deb, S.; Sahoo, S.S.; Sahoo, U.K. Soil microbial biomass carbon stock and its relation with climatic and other environmental factors in forest ecosystems: A review. Acta Ecol. Sin. 2023, 43, 933–945. [Google Scholar] [CrossRef]
  71. Wu, R.; Cheng, X.; Han, H. The effect of forest thinning on soil microbial community structure and function. Forests 2019, 10, 352. [Google Scholar] [CrossRef]
  72. Mukhtar, H.; Wunderlich, R.F.; Muzaffar, A.; Ansari, A.; Shipin, O.V.; Cao, T.N.-D.; Lin, Y.-P. Soil microbiome feedback to climate change and options for mitigation. Sci. Total Environ. 2023, 882, 163412. [Google Scholar] [CrossRef] [PubMed]
  73. Zhou, Z.; Wang, C.; Luo, Y. Meta-analysis of the impacts of global change factors on soil microbial diversity and functionality. Nat. Commun. 2020, 11, 3072. [Google Scholar] [CrossRef] [PubMed]
  74. Yang, Y.; Cheng, S.; Fang, H.; Guo, Y.; Li, Y.; Zhou, Y. Interactions between soil organic matter chemical structure and microbial communities determine the spatial variation of soil basal respiration in boreal forests. Appl. Soil. Ecol. 2023, 183, 104743. [Google Scholar] [CrossRef]
  75. Cheng, F.; Peng, X.; Zhao, P.; Yuan, J.; Zhong, C.; Cheng, Y.; Cui, C.; Zhang, S. Soil microbial biomass, basal respiration and enzyme activity of main forest types in the Qinling Mountains. PLoS ONE 2013, 8, e67353. [Google Scholar] [CrossRef] [PubMed]
  76. Krämer, S.; Green, D.M. Acid and alkaline phosphatase dynamics and their relationship to soil microclimate in a semiarid woodland. Soil Biol. Biochem. 2000, 32, 179–188. [Google Scholar] [CrossRef]
  77. Cetin, S.C.; Ekinci, H.; Kavdır, Y.; Yüksel, O. Using soil urease enzyme activity as soil quality indicator for reflecting fire influence in forest ecosystem. Fresenius Environ. Bull. 2009, 18, 2380–2387. [Google Scholar]
  78. Bueis, T.; Turrión, M.B.; Bravo, F.; Pando, V.; Muscolo, A. Factors determining enzyme activities in soils under Pinus halepensis and Pinus sylvestris plantations in Spain: A basis for establishing sustainable forest management strategies. Ann. For. Sci. 2018, 75, 34. [Google Scholar] [CrossRef]
  79. Błońska, E.; Piaszczyk, W.; Staszel, K.; Lasota, J. Enzymatic activity of soils and soil organic matter stabilization as an effect of components released from the decomposition of litter. Appl. Soil. Ecol. 2021, 157, 103723. [Google Scholar] [CrossRef]
  80. Li, Y.; Ajloon, F.H.; Wang, X.; Malghani, S.; Yu, S.; Ma, X.; Li, Y.; Wang, W. Temporal effects of thinning on soil organic carbon and carbon cycling-related enzyme activities in oak-pine mixed forests. For. Ecol. Manag. 2023, 545, 121293. [Google Scholar] [CrossRef]
  81. Ge, T.; Wei, X.; Razavi, B.S.; Zhu, Z.; Hu, Y.; Kuzyakov, Y.; Jones, D.L.; Wu, J. Stability and dynamics of enzyme activity patterns in the rice rhizosphere: Effects of plant growth and temperature. Soil Biol. Biochem. 2017, 113, 108–115. [Google Scholar] [CrossRef]
  82. Fan, L.; Tarin, M.W.K.; Zhang, Y.; Han, Y.; Rong, J.; Cai, X.; Chen, L.; Shi, C.; Zheng, Y. Patterns of soil microorganisms and enzymatic activities of various forest types in coastal sandy land. Glob. Ecol. Conserv. 2021, 28, e01625. [Google Scholar] [CrossRef]
Figure 1. (a,b) Photographs of 2017 of each thinning treatment (total basal area removal of 74%) and control (trees not thinned). (c) Location map of both experimental plots, thinning treatment (Plot T) (left) and control (Plot C) (right), photographs of July 2014 (Google Earth, Maxar Technologies, Westminster, CO, USA), including the distinction of upper zone I-zI and lower zone II-zII.
Forests 15 00658 g001
Figure 2. Environmental conditions in the experimental blocks. Data correspond to monthly average records of average temperature, precipitation and reference evapotranspiration (ETo). The arrows indicate the soil sampling dates throughout the study period from 2013 to 2017 after the thinning treatment finished in October 2012.
Forests 15 00658 g002
Figure 3. (a) Gravimetric water content in forest floor (GWCff)—zone I and (b) forest floor—zone II, and (c) mineral soil (GWCms)—zone I and (d) mineral soil—zone II along the study period from September 2013 to June 2017 comparing thinning treatment (T) and control (C). Bars represent mean ± standard deviation (n = 6 and 3 for T in zone I and II, respectively; similarly, n = 3 and 5 for C). Asterisks indicate a significant difference between T and C plots by post hoc comparisons at p ≤ 0.05 (*), 0.01 (**) or 0.001 (***) at each sampling date. For each, T or C, different letters between sampling dates indicate significant differences at p ≤ 0.05.
Forests 15 00658 g003
Figure 4. (a) Soil organic carbon in mineral soil (SOCms)—zone I and (b) mineral soil—zone II along the studied period from September 2013 to June 2017 comparing thinning treatment (T) and control (C). Bars represent mean ± standard deviation (n = 6 and 3 for T in zone I and II, respectively; similarly, n = 3 and 5 for C). For each, T or C, different letters between sampling dates indicate significant differences at p ≤ 0.05.
Forests 15 00658 g004
Figure 5. (a) Water-soluble organic carbon in forest floor (WSOCff)—zone I and (b) forest floor—zone II, and (c) mineral soil (WSOCms)—zone I and (d) mineral soil—zone II along the studied period from September 2013 to June 2017 comparing thinning treatment (T) and control (C). Bars represent mean ± standard deviation (n = 6 and 3 for T in zone I and II, respectively; similarly, n = 3 and 5 for C). For each, T or C, different letters between sampling dates indicate significant differences at p ≤ 0.05.
Forests 15 00658 g005
Figure 6. (a) Microbial biomass carbon of mineral soil (MBCms)—zone I and (b) mineral soil—zone II along the studied period from October 2015 to June 2017. Bars represent mean ± standard deviation (n = 6 and 3 for T in soil I and II, respectively; similarly, n = 3 and 5 for C). Asterisks indicate a significant difference between T and C plots by post hoc comparisons at p ≤ 0.05 at each sampling date. For each, T or C, different letters between sampling dates indicate significant differences at p ≤ 0.05.
Forests 15 00658 g006
Figure 7. (a) Basal soil respiration in mineral soil (BSRms)—zone I and (b) mineral soil—zone II along the studied period from December 2016 to June 2017. Bars represent mean ± standard deviation (n = 6 and 3 for T in soil I and II, respectively; similarly, n = 3 and 5 for C). For each, T or C, different letters between sampling dates indicate significant differences at p ≤ 0.05.
Forests 15 00658 g007
Figure 8. (a) Acid phosphatase activity (AP) activity in mineral soil—zone I and (b) mineral soil—zone II, and (c) urease activity (UA) in mineral soil—zone I and (d) mineral soil—zone II along the studied period from October 15 and June 2017. Bars represent mean ± standard deviation (n = 6 and 3 for T in soil I and II, respectively; similarly, n = 3 and 5 for C). For each, T or C, different letters between sampling dates indicate significant differences at p ≤ 0.05.
Forests 15 00658 g008
Figure 9. Principal component analysis biplot (F1, F2) of correlations between gravimetric water content (GWC), soluble organic carbon (SOC), soil labile organic carbon fractions (water-soluble organic carbon—WSOC and microbial biomass carbon—MBC) (symbols represented by squares and triangles) and environmental parameters (ambient temperature—Tempamb, temperature and humidity measured by WET-2 sensor—TWET and HumWET, humidity measured by fixed sensor at 15 cm depth—Hum15 cm) (black lines and circles). Correlations are shown comparing parameters globally by thinning treatment (T) (coloured in red) and control (C) (blue) plots (a) and comparing between zone I (dark brown) and zone II (light brown) (b). Relationships between related parameters are highlighted with dashed grey lines. Data were analysed using the Spearman method at p ≤ 0.05 on untransformed data.
Forests 15 00658 g009
Disclaimer/Publisher’s Note: The statements, opinions and data contained in all publications are solely those of the individual author(s) and contributor(s) and not of MDPI and/or the editor(s). MDPI and/or the editor(s) disclaim responsibility for any injury to people or property resulting from any ideas, methods, instructions or products referred to in the content.

