Abstract
This research analyzes how enzymatic and microbiological soil properties relate to site index (SI) and forest maturity (stand age) in Pinus nigra (P. nigra) even-aged forests. The soil parameters selected for multivariate analysis were four enzymatic activities (β-glucosidase, urease, dehydrogenase, and alkaline phosphatase), two microbiological properties (microbial biomass C and basal respiration), and five physicochemical parameters (TOC, N, P, pH, and soil water content). We used LiDAR, the digital elevation model, and the terrain model to obtain a result for the dominant height in each plot. The soil parameters were analyzed in the function of five site index classes (8, 11, 14, 17, and 20) and six age classes (50, 70, 90, 110, 170, and 210 years). Our findings emphasize that the dehydrogenase enzyme exhibited variations in response to both the site index and stand age. The activity of dehydrogenase positively correlated with sites characterized by a higher nutrient demand, particularly on young and poor-quality sites (lower SI), indicating activation. Therefore, dehydrogenase could serve as an index to elucidate both site quality and stand development in P. nigra stands, making it a potential indicator of forest ecosystem development.
1. Introduction
The importance of studying site quality is widely acknowledged for predicting forest resources and guiding silvicultural management. [1,2]. While it is generally assumed that site quality varies based on climate, tree species, tree age, and soil fertility [3,4,5,6], tree–soil interactions provide crucial feedback that regulates ecosystem processes and productivity, irrespective of the other factors [7]. The development of forest species under specific climatic conditions influences the properties of the soil, thereby impacting its quality [8]. For this reason, in recent years, the study of site quality in terms of the function of soil parameters is of significant interest, especially in forests with high levels of climatic and edaphic variability, such as Mediterranean mountains [9,10]. Although climate is the main driver of the productivity of Mediterranean pines at the large scale, differences in the site quality within a homogenous climatic region can be associated with soil properties [11].
As site quality can be assessed based on stand variables [6], most commonly, and especially for even-aged forests, site quality is defined based on estimates of the dominant height. The “site index” (SI, i.e., the dominant height at a given age) has been widely used to estimate site quality in Mediterranean areas [4,11]. Height growth is significantly correlated with forest productivity, and the dominant height is not affected by the stand density or thinning treatments from below [2]. Although other indexes have been utilized, such as the ratio between the dominant height and the maximum tree height for the same age [3], the benefit of using the SI is its constancy over time [12].
Recognizing the significance of soil functioning in defining site quality, it is pertinent to analyze whether soil parameters alone, without considering other influencing factors, could be associated with highly productive forest stands. Consequently, it is possible to study correlations between soil and forest productivity by using the site index as an indicator of site quality, and enzymatic or microbiological soil parameters as indicators of soil activity [9,13].
Soil enzymes have a decisive influence on the decomposition of organic matter, which makes them essential for explaining soil dynamics [14,15]. It is suspected that enzymatic activities may be the most important indicators of nutrient flux in the soil [8,13,16]. Also, alterations in enzyme activity can directly impact ecosystem processes [17]. Given these crucial properties, soil enzymes have been employed both as indicators of soil quality [13,16,18] and for characterizing successional stand ages in silvicultural treatments within even-aged forests [19,20].
The most frequently studied soil enzymes are those associated with the key macronutrients C, N, and P. Specifically, β-glucosidase, urease, and alkaline phosphatase, respectively, are the enzymes responsible for releasing these elements [13,16]. In addition to these hydrolases, dehydrogenase is a frequently studied intracellular enzyme belonging to the category of oxidoreductases [21,22,23]. This soil enzyme is exclusively present in living microorganisms [14], mainly in bacteria [24]. In contrast, β-glucosidase is mainly produced by fungi [25]. Dehydrogenase is also considered responsible for the functioning of the rest of the extracellular enzymes (precursor enzyme) and plays an important role in the initial stages of the oxidation of organic matter [17,26].
Determining the influence of enzymatic activity on forest productivity in the Mediterranean climate could be helpful for understanding the function and stability of the forest ecosystem [23]. However, considerable uncertainties still exist in terms of the interactions between the soil activity and stand quality. In the few studies conducted on this issue, site quality indexes were poorly explained by edaphic parameters [4,11]. The lack of correlations was noted when correlating soil chemical properties, which serve as indicators of soil fertility, with stand productivity in acidic forest soils [3].
Maturity (or stand age, the variable used to define stand development and SI) is another factor that can affect both forest productivity [27] and enzymatic activity [28]. The stand age can induce changes in enzyme activity through the combined effects of moisture and substrate availability in Mediterranean pine forests [19]. Because soil evolution and height growth are very slow processes, chronosequence studies are necessary for evaluating ecosystem function, especially differences in edaphic characteristics [29].
Despite the decisive factors that affect the forest dynamics discussed above, no work has been conducted to explain soil activity in Pinus nigra (P. nigra) as a function of the site index, and very little is known regarding patterns of microbial activity in relation to variations with stand ages of this species. P. nigra Arnold (“black pine”, Pinaceae) is a conifer with a wide distribution across Europe and Asia Minor [30]. This is an interesting species; due to the warming climate, it is anticipated that the distribution of black pine will change in the future, and the natural regeneration of this species will become more difficult [31]. In Mediterranean areas, the subspecies P. nigra subsp. salzmannii (Spanish or Corsican black pine) is predominant, occupying the supra-Mediterranean altitudinal belt [12]. Hence, it is a typical coniferous species from a Mediterranean climate with attenuated summer drought, which commonly grows in calcareous soils [31].
The P. nigra forests in the “Serranía de Cuenca” mountains (Spain) are managed by even-aged stands, resulting from forest regeneration through shelterwood cutting and a rotation period of 120–200 years. Forest regeneration in P. nigra occurs after cutting for 20–40 years in the mature stands. This silvicultural management method generates a succession of age classes, where the range of tree ages within the stand do not vary by more than 20% of the mature age [19,32].
In our study site, since P. nigra is the dominant tree across the studied forests, we can interrogate whether the enzymatic and microbiological parameters that define soil activity may be correlated with the site index (SI), independently of species and geoclimatic variables. This requires sampling forests of different top heights and ages in a long gradient. Thus, we hypothesized that forest soil should have certain levels of enzymatic and microbiological parameters that can define site quality and forest productivity.
As a consequence, the main aims of this paper were: (i) to analyze the relationships between soil enzymatic and microbiological parameters and the site quality (defined as the SI) in Mediterranean calcareous stands, dominated by P. nigra even-aged forests; and (ii) to investigate the effects of forest maturity (stand age,) on the selected edaphic parameters. Therefore, our study may help us to understand how soil functions affect the development and stability of P. nigra forests. Our experimental setup also provides an opportunity to study the effects of regeneration through shelterwood cutting on the trajectory of soil recovery after forest management.
2. Materials and Methods
2.1. Study Area and Experimental Setup
Data samples were collected in the “Serranía de Cuenca” mountain range (central Spain), which is located in the southern Iberian System, with a length of approximately 100 km. In the Serranía de Cuenca, 15 public forests that belong to the regional administration (i.e., 15 experimental areas) were selected following a latitudinal gradient of about 95 km, with altitudes ranging between 1002 and 1418 m.a.s.l., to achieve a representative sample (Figure 1; Table 1).
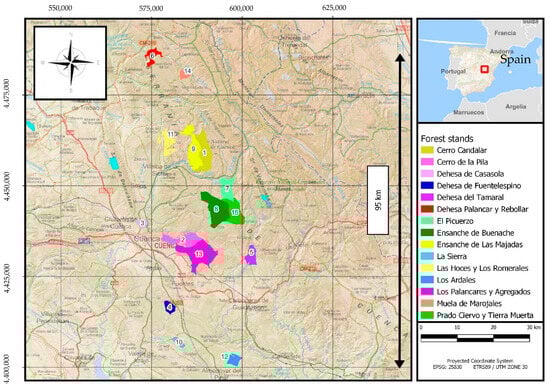
Figure 1.
Map showing the locations of the 15 public forests selected for soil sampling and the determination of stand parameters. In each forest, 12 plots, each with a 20 m radius, were subjected to soil sampling and had their top heights calculated.

Table 1.
Mean stand parameters and geoclimatic characteristics of the 180 plots classified by forest, including the tree cover of Pinus nigra (P. nigra; %), the dominant height (H0; m), the site index (SI; m), and the geoclimatic variables of altitude (m.a.s.l.) and annual rainfall (mm).
The climate conditions in the study area (obtained from the Agricultural Geographic Data Information System, Ministry of Agriculture, Spain) are mainly of a humid Mediterranean type, classified as Csa according to the Köppen–Geiger system [33], in which summer is characterized by high temperatures and winters are cold, with a marked thermic contrast between seasons. The mean annual temperature is 11.9 °C, and the spring–summer period is accompanied by long dry periods with temperatures over 30 °C. The annual rainfall distribution between sites ranged from 593 to 970 mm (Table 1), thus defining the area as having a Mediterranean humid climate. The lithology is dominated by sandstones, dolomites, and marls, as well as clay soils and different kinds of conglomerates. Following the FAO classification [34], the most abundant soil types are Calcisols and Leptosols [32].
To sample the soils and calculate the stand parameters, the 15 experimental areas (public forests) included 12 plots, each with a 20 m radius. The plots comply with the following three conditions: (i) P. nigra was the main tree species (monospecific stands), with pine regeneration achieved after regeneration felling (stand age > 30 years), and an existing canopy cover of 30% or higher; (ii) the forest is characterized by even-aged tree structures, resulting from forest regeneration through shelterwood cutting (in the rotation period at the maturity age), composed of a single age class of trees, where the range of stand tree ages does not vary by more than 20% of the mature age (normally 20–30 years); (iii) the distance between plots was >100 m, allowing for us to consider them independent to avoid pseudo-replication. Thus, maturity was analyzed as a chronosequence, with ages ranging from 40 to 220 years old.
2.2. Dominant Height and Site Index (SI)
We calculated the site index (SI; m) as the total height to which dominant trees grew at one reference age. Different definitions of dominant height are used to calculate the site index, but all involve the measurement of the trees in the upper part of the canopy or the “top height” [2]. We considered dominant trees in terms of tree size (i.e., the tallest trees in the stand), so we calculated the top height of the stand. This method avoids subjective calculations such as assigning trees to crown classes (dominant or codominant) or specifying the number of largest diameters per hectare.
To conduct this calculation, we utilized the QGIS Geographic Information System (©QGIS Project, 2023) to process LiDAR data, the Digital Elevation Model for the vegetation category (DEM), and the Digital Terrain Model (DTM) layers. This enabled us to derive the dominant height for each sampling plot. The assessment of stand height through airborne laser scanning is acknowledged as a valuable data source for modeling top height growth and SI [35]. The method employed consisted of an initial step in which the DEM and DTM outputs were subtracted. Subsequently, utilizing the coordinates of the sampling plots, a shape layer with a 40-meter-diameter buffer was created around those points. This shape layer served as a mask to trim the final raster result of the DEM and DTM subtraction. The final step yielded a 2 × 2 m grid displaying tree heights, with the highest altitude chosen after selecting the dominant stratum. The DTM and DEM were generated from LiDAR point clouds (density: 1 point m−2) in LAS format, obtained from the second coverage of the PNOA-LiDAR project (PNOA-LiDAR 2020, National Center for Geographic Information; Ministry of Development, Madrid, Spain). In this project, the dataset was presented in digital files comprising 3D point clouds obtained through LiDAR technology and enhanced with true color (RGB) rendering. The points are classified into various categories (including soil, vegetation, and buildings), each assigned to specific classes that characterize the type of object reflecting the laser pulse. The LiDAR sensor captured point clouds during flight, with an average density ranging between 1 and 4 points m−2, depending on the batch. The point clouds were automatically classified and colored using RGB values obtained from orthoimages that were captured simultaneously (50 cm pixel size), and National Aerial Orthophotography Plan orthoimages (PNOA-image, National Geographic Institute, Madrid, Spain). The DTM adopted a 2-m grid pitch in Cloud Optimized GeoTIFF format. The surfaces were created through the reclassification of categories, including soil, vegetation, and buildings. The reference system employed was ETRS89, ensuring a standardized geodetic framework for precise spatial positioning.
Finally, the reference age for the SI was obtained from the forest management plans of each forest, identified as the central age of the even-aged stands in which a specific plot was established. Subsequently, the SI was computed for each plot utilizing the site quality curves established for P. nigra in the Iberian System mountains [32]: H0 = t2/(a + bt)2, where H0 is the dominant height (m), t is the age (years), and a and b are the parameters fitted as a function of site quality (Figure 2).
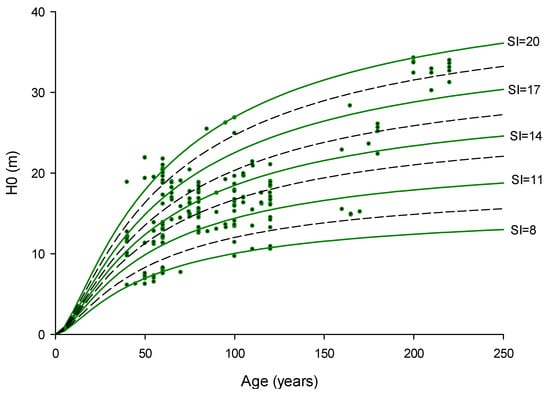
Figure 2.
Sampling plots projected onto the site quality curves explained by Loranca [32] to obtain the site index (SI) for each plot as a function of H0 and the stand age (n = 180 plots). The guide curve has the following parameters: a = 5.22, and b = 0.19. Five site indexes (SI) were established, corresponding to 8, 11, 14, 17, and 20 m at the reference age of 60 years. Plots where the dominant height exceeds the family of curves were assigned as having the best site quality.
These curves correspond with the guide curve procedure (parameters: a = 5.22, and b = 0.19) that uses the Hossfeld model in the integral form [2]. In this model, the SI is the dominant height at 60 years of reference, and it was classified into five quality classes: 8, 11, 14, 17, and 20 m, at the reference age of 60 years old. According to this division, 20 plots were classified into the lowest-quality class (SI = 8), 44 plots were classified as SI = 11, 72 plots as SI = 14, 20 plots as SI= 17, and 24 plots were placed into the highest-quality class (SI = 20; Figure 2).
2.3. Soil Sampling
A dataset of 11 soil parameters (4 enzymatic activities, 2 microbiological properties, and 5 physicochemical parameters, see below) was determined from the 180 P. nigra plots. Soil samples were taken from the 0–10 cm closest to the surface in every plot under the pine canopy after the litter was removed, both because this layer represents the level with the greatest soil activity and because of the shallowness of forest soils. To minimize the effects of the inherent soil variability, each soil sample was composed of a thorough mix of six subsamples (each of approximately 200 g) randomly collected from the plot. Once in the laboratory, the soil samples were sieved (<2 mm) and stored at 4 °C until the analyses were conducted. The samples were analyzed by taking three replicates (pseudo-replicates) in the laboratory, and the mean value of the sample was used. The soil samples were collected in the autumn (November 2020) because, during this season, the microbial activity is generally higher [36,37].
2.4. Enzymatic Activity of Soils
Four soil enzymatic activities were measured in the laboratory using a spectrophotometer (PerkinElmer Lambda 25 UV VIS, PerkinElmer, Inc., Waltham, MA, USA). β-glucosidase (B-GLU; µmol PNF g−1 h−1) and alkaline phosphatase (APA; µmol PNF g−1 h−1) were determined as described [38], but substituting p-nitrophenyl-β-D-glucopyranoside (PNF) as the substrate [18]. Urease activity (UA; µmol N-NH4+ g−1 h−1) was determined using the buffered hydrolysis reaction method [39] in which the NH4+ released was measured. Dehydrogenase activity (DHA; µmol INTF g−1 h−1) was determined by reducing 2-p-iodophenyl-3-p-nitro-phenyl-5-phenyltetrazolium chloride (INT) to iodonitrophenyl formazan (INTF) [40].
2.5. Microbiological Properties of Soils
Two microbiological properties that are potentially related to microbial activity were measured. Basal respiration (BR; µg C-CO2 g−1 day−1) was determined by incubating 15 g of soil for 20 days at 28 °C. The resultant CO2 was measured periodically with an infrared gas analyzer (PBI Dansensor, AMETEK, Inc., Berwyn, IL, USA). Lastly, microbial biomass C (MBC; µg C g−1) was determined with Vance’s fumigation–extraction method [41], using a total organic carbon analyzer (TOC-L ASI-L autosampler, Shimadzu Corporation, Kyoto, Japan).
2.6. Physicochemical Parameters of Soils
To analyze the effects of the soil’s basic physicochemical indicators on the enzymatic and microbiological variables, 3 biochemical and 2 physical parameters were also analyzed in the laboratory using the soil samples: total organic carbon (TOC; mg C g−1), total nitrogen (N; %), available phosphorus (P; mg kg−1), pH, and moisture (M; %). Total organic carbon was measured using the Walkley–Black method [42] to oxidize the samples in an acidic environment. In the case of total nitrogen (N) and phosphorus (P), the methods used to measure them were Kjeldjal’s, modified by Bremner [43] and Olsen and Sommers’s [44], respectively. For the pH, a pH-meter (Navi Horiba, HORIBA Ltd., Kyoto, Japan) was used in a soil–water solution. Finally, all the samples were characterized by the soil moisture determined by the gravimetric method (115 °C for 24 h).
2.7. Statistical Analysis
The 11 soil parameters were used in the statistical analysis. In addition, we introduced the dominant height (H0), the site index (SI), and stand age to the data anlysis as variables defining the site (total: 14 variables).
First, a multivariate analysis was conducted to evidence the correlations between all the 14 variables. For these purposes, Pearson correlation coefficients (r) were calculated (in the correlation matrix), considering p < 0.0001 and r > 0.5 as a significant, strong correlation. After this, the 14 variables defining the soil and forest stands were subjected to exploratory factor analysis (FA) to explain significant relations among both variables and groups of observed variables. To find the factor analysis solution for improving the estimates of communalities and factors, the criterion of principal components extraction (PCA) was used. The varimax orthogonal factor rotation method was used to minimize the number of variables that have high loadings on each factor (component) and to maximize the variance of the squared loadings [45]. To determine the number of factors to be extracted, Kaiser’s criterion (eigenvalue greater than 1) was used, and the convergent validity was established when the average variance extracted was greater than 50%. The factorability of the variables was assessed using two statistical measures [46]: the Kaiser–Meyer–Olkin measure of sampling adequacy (KMO test) and Bartlett’s test of sphericity. KMO values of less than 0.6 indicate that the sampling is not adequate. Bartlett’s test of sphericity was used to test the null hypothesis that the variables are orthogonal (p < 0.05 indicates that an exploratory factor analysis is adequate for the dataset).
In addition to multivariate analysis, we explored the effects of site quality and age on soil activity using both one-way analysis of variance (ANOVA) and linear regression. Soil parameters were analyzed as a function of the quality class (the 5 levels of SI) and age class. For this, six age classes were established based on the stand age of the sampling plots: 50 (40 < stand age ≤ 60 years), 70 (60 < stand age ≤ 80 years), 90 (80 < stand age ≤ 100 years), 110 (100 < stand age ≤ 120 years), 170 (160 ≤ stand age ≤ 180 years), and 210 (stand age ≥ 200 years; the older stands reached 220 years old). Homogenous groups were distinguished with the LSD post hoc test (p < 0.05). To meet the assumptions of homoscedastic residuals and a normal distribution, response variables were transformed logarithmically. Interactions between the site index and age were not considered because of their independence and scarce significance. We analyzed patterns of soil parameters as functions of site index and age through regressions, specifically assessing the coefficient of determination (R2) and the F-ratio (p < 0.05) as statistics of goodness of fit.
All statistical analyses were performed using JMP® pro 17.0.0 software (JMP Statistical Discovery LLC, Cary, NC, USA, 2022).
3. Results
3.1. Soil Parameters in the Studied Forests
In general, the obtained values for the enzymatic parameters were in ranges comparable to those found in previous studies carried out on forest soils under P. nigra tree cover [18,19], except for the APA, which registered low levels of activity (Table 2). Turning to microbiological properties, the values of MBC were slightly elevated compared with the reference values because the soils were sampled in the uppermost layer of the soil. At this level, soil contains a large amount of organic matter; therefore, microbiological activity should be higher in autumnal conditions. As a consequence, the TOC ranged from 5.5 to 9.6 mg g−1 due to the high accumulation of organic matter, which is typical of the upper horizons in forest soils. As a result, the N and P contents were also relevant in the sampled soils (Table 2).
Table 2.
Soil characteristics (n = 180) used to analyze the 15 forest stands in P. nigra in the Cuenca mountain range. B-GLU: β-glucosidase (µmol PNF g−1 h−1): UA: urease (µmol N-NH4+ g−1 h−1); DHA: dehydrogenase (µmol INTF g−1 h−1); APA: alkaline phosphatase (µmol PNF g−1 h−1); TOC: total organic C (mg C g−1); BR: basal respiration (µg C-CO2 g−1 day−1); MBC: microbial biomass C (µg C g−1); TOC: total organic C (mg C g−1); N: total nitrogen (%); P: available phosphorous (mg kg−1); pH: soil acidity; M: soil moisture (%). For each forest stand, the mean and standard deviation are included. Totals: Mean values calculated for the 15 forest stands.
In terms of mean soil pH values by forest, seven of the sampled forests were in the neutral–basic range (pH = 6.5–7.5), four were alkaline (pH > 7.5), and four were acidic (pH < 6.5). This wide range can be attributed to differences in the site (litter production) and age (organic matter accumulation over the years). Soil moisture levels were high because the samples were taken in the autumn, the rainy season (overall mean of 34%).
3.2. Relationships between Variables: Correlation Matrix and Factorial Analysis
As shown in Table 3, we observed an inverse correlation between variables reflecting forest productivity (H0, SI) and enzymatic activity, with DHA reflecting a higher correlation (r > |0.5|; p < 0.0001). No relevant relationship (r < 0.5) was found between the rest of the microbiological properties and the stand variables. Stand age was also mostly negatively correlated with DHA (r = −0.42; p < 0.0001) and positively correlated with B-GLU and TOC, but much more weakly (r < 0.05; p < 0.05). A strong bond (positive correlations; r > 0.5) was shown between B-GLU, and MBC, TOC and BR (carbon-related parameters).
Table 3.
Spearman’s correlation coefficients (r) between forest stand parameters (stand age, H0, SI), enzymatic activities (B-GLU, UA, DHA, APA), microbiological properties (BR, MBC), and physicochemical parameters (TOC, N, P, pH, M) in P. nigra forests of the Cuenca mountain range: age (years); H0: dominant height (m); SI: site index (m); B-GLU: β-glucosidase (µmol PNF g−1 h−1): UA: urease (µmol N-NH4+ g−1 h−1); DHA: dehydrogenase (µmol INTF g−1 h−1); APA: alkaline phosphatase (µmol PNF g−1 h−1); BR: basal respiration (µg C-CO2 g−1 day−1); MBC: microbial biomass C (µg C g−1); TOC: total organic C (mg C g−1); N: total nitrogen (%); P: available phosphorous (mg kg−1); pH: soil acidity; M: soil moisture (%). Correlations were significant at: * p < 0.05, ** p < 0.0001. Correlations in bold and with an orange background: r > 0.5. Correlations with a green background: 0.4 < r < 0.5.
The strongest correlations that were observed in the correlation matrix correspond to the relationships between the soil water content (M) and carbon-related variables (r > 0.70; p < 0.0001). On the contrary, DHA did not show a conclusive result regarding carbon-related parameters or water-indicative values, such as the soil moisture.
In the case of soil pH, this variable was negatively correlated with the forest stand age (r = −0.48; p < 0.0001) and reflected the progressive acidification of the soil with forest maturity. Another important relationship (negative; r > |0.4|; p < 0.0001) was found between Ph and carbon-related parameters (BR, TOC, and MBC). The enzymes DHA (positively) and B-GLU (negatively) also correlated with soil pH (r = |0.4|; p < 0.0001). It is also noteworthy that N was slightly related to the stand variables and negatively correlated with DHA (p < 0.0001), whereas P was positively correlated with carbon-related variables (p < 0.0001).
In general, the high number of correlations detected appears to be essential for the additional factorial analysis conducted to elucidate the differences between groups of variables. Based on the factor analysis, four extracted factors had an eigenvalue over 1. The factorability test of Kaiser–Meyer–Olkin (KMO test) and Bartlett’s test of sphericity confirmed the suitability of the data, with a four-factor solution (KMO = 0.73, “acceptable”; χ2 = 1724, p-value = 0.000). The factor method produced significant results using the first three principal components (88.6% of the overall variance among the measured variables; Table 4). In consequence, after the varimax rotation, we used only three factors to analyze the relationships between groups of variables (Table 4 and Figure 3).
Table 4.
Estimated value of the coefficients (loadings) for the first three factors extracted after the varimax rotation, communalities (variance attributable to factors that all the variables have in common) and the specific variances. H0: dominant height (m); SI: site index (m); B-GLU: β-glucosidase (µmol PNF g−1 h−1): UA: urease (µmol N-NH4 g−1 h−1); DHA: dehydrogenase (µmol INTF g−1 h−1); APA: alkaline phosphatase (µmol PNF g−1 h−1); BR: basal respiration (µg C-CO2 g−1 day−1); MBC: microbial biomass C (µg C g−1); TOC: total organic C (mg C g−1); N: total nitrogen (%); P: available phosphorous (mg kg−1); pH: soil acidity; M: soil moisture (%).
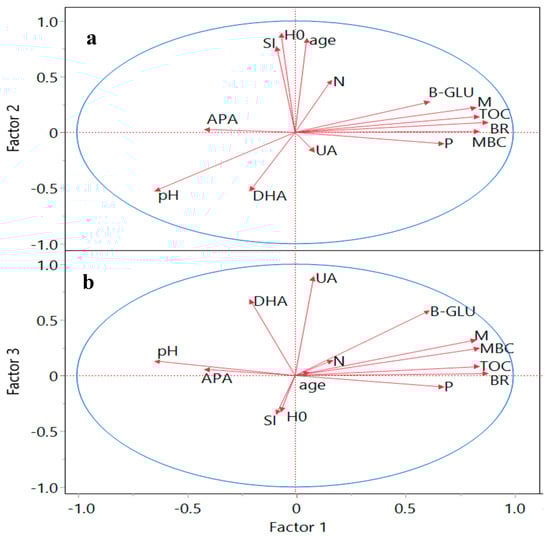
Figure 3.
Projection of variables (vectors marked with lines) on the factor plane as a combination of Factors 1, 2 (a), and Factors 1, 3 (b) extracted by principal components and varimax rotation. The two-dimensional factor plot (biplot) represents the weight of loadings for each chosen factor. Reference lines are drawn at 0.0 in each dimension, and a weight close to 0.0 indicates that the variable contributes little to the factor. H0: dominant height (m); SI: site index (m); B-GLU: β-glucosidase (µmol PNF g−1 h−1): UA: urease (µmol N-NH4 g−1 h−1); DHA: dehydrogenase (µmol INTF g−1 h−1); APA: alkaline phosphatase (µmol PNF g−1 h−1); BR: basal respiration (µg C-CO2 g−1 day−1); MBC: microbial biomass C (µg C g−1); TOC: total organic C (mg C g−1); N: total nitrogen (%); P: available phosphorous (mg kg−1); pH: acidity; M: soil moisture (%).
As shown in Table 4, the variables with large loadings (values > 0.40) are indicated to be representative of the factor. Table 4 also shows that P and APA have a larger specific variance than the other variables, implying that they are not as well accounted for by the extracted factors. In contrast, the H0, SI, physical factors of soil (moisture), and DHA better explained the extracted factors. The three factors were also fitted in two biplots after the varimax rotation (Figure 3).
The first rotated factor (Factor 1) distinguished the dimensions of C-related variables (MBC and TOC, positive axe), jointly with soil activity related to C cycle (BR and B-GLU, positive) and soil properties (P and M positive, and pH negative). Therefore, Factor 1 might be ascribed to the soil processes related to C.
The second rotated factor (Factor 2; Figure 3a) was weighted most heavily in a positive direction for H0, age, SI and N, and clearly in the negative direction for DHA and pH. Thus, Factor 2 differentiated between the forest stand characteristics (site quality and maturity) and the intracellular enzyme (dehydrogenase).
The third factor (Factor 3; Figure 3b) seems to represent the enzymatic activity (urease and dehydrogenase) in the positive axis of the factor and the site index in the negative axis (like Factor 2). Thus, the factor analysis enabled the interpretation of the dimension reduction using principal components and confirmed the negative link between DHA and SI, stand age and N.
The interpretation of the first factor confirmed the relationship between B-GLU activity, and carbon-related variables, due to their dependence on the accumulated supply of organic substrate, whereas the second and third factor reflected hard links between site, age, and enzymatic activity of DHA.
3.3. Effects of Site Quality and Age on Soil Activity
Regarding the enzymatic activity, significant differences (p < 0.0001; Table 5) in the function of the site index were obtained in the variables UA and DHA, whereas the age class affected the average values of DHA (p < 0.0001), as well as UA and B-GLU (p < 0.05). Thus, these results highlighted that the differences in DHA were largely explained as a function of both site quality and stand ages. On the contrary, APA was not affected by the considered factors. With respect to microbiological properties (Table 5), only MBC was influenced by site and age (p < 0.0001). Age class affected the values of TOC (p < 0.0001), and N (p < 0.05), whereas the SI was also significant for the variables TOC and N (but at p < 0.05).
Table 5.
Results of the one-way ANOVA as a function of the F-ratio (* p < 0.05, with a green background; ** p < 0.0001, in bold and with an orange background) for the enzymatic activities, microbiological properties, and biochemical parameters of the soil samples. H0: dominant height (m); SI: site index (m); B-GLU: β-glucosidase (µmol PNF g−1 h−1): UA: urease (µmol N-NH4+ g−1 h−1); DHA: dehydrogenase (µmol INTF g−1 h−1); APA: alkaline phosphatase (µmol PNF g−1 h−1); BR: basal respiration (µg C-CO2 g−1 day−1); MBC: microbial biomass C (µg C g−1); TOC: total organic C (mg C g−1); N: total nitrogen (%); P: available phosphorous (mg kg−1).
Figure 4 reflects that the soil sampled in stands with an inferior site quality (SI = 8) showed greater enzymatic activity (UA, DHA) than the soil from the other forest stands. Significant variability was also observed among the analyzed age classes. Middle-aged and older stands had a significantly lower DHA, despite the higher B-GLU values of the 210-year class. The highest value of DHA and UA was noted for the 50-year class.
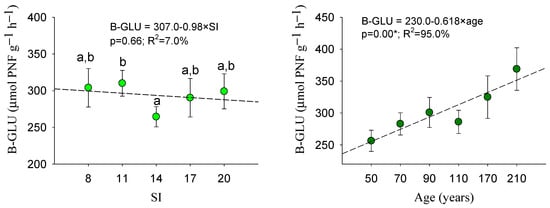
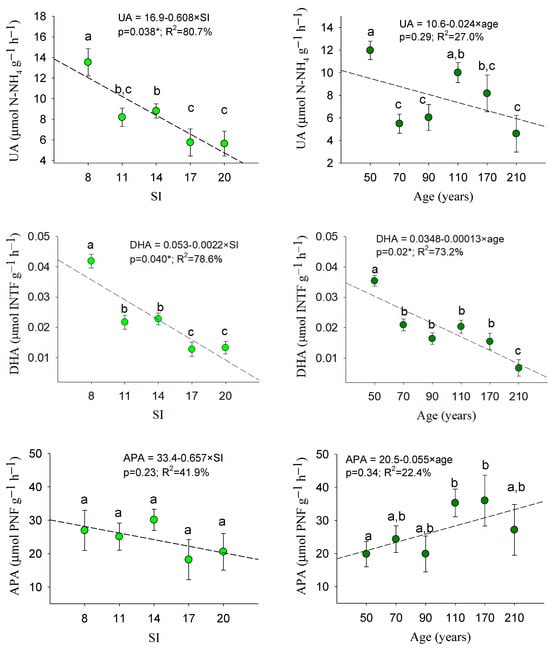
Figure 4.
Mean values of enzymatic soil activity within the site indexes and age classes: mean values with the same letter do not differ at the 0.05 level according to the LSD test. Sample data = 180 plots. Error bars: standard errors. For each soil variable, patterns as functions of site quality and age are also included. H0: dominant height (m); SI: site index (m); B-GLU: β-glucosidase (µmol PNF g−1 h−1): UA: urease (µmol N-NH4+ g−1 h−1); DHA: dehydrogenase (µmol INTF g−1 h−1); APA: alkaline phosphatase (µmol PNF g−1 h−1). *: signifies a significant regression (p < 0.05).
In accordance with the ANOVA, the DHA was the unique variable that fitted significant tendences (p < 0.05) as a function of both site quality and age (Figure 4). We verified that the decrease in the function of the site index was significant (p < 0.05) for the variables UA and DHA, whereas the decrease in the function of age was only significant for DHA. In addition, a positive pattern of an increase in the function of age was noted for B-GLU (Figure 4). However, Figure 4 mainly confirmed that dehydrogenase was activated in situations of nutrient demand, i.e., in poor and younger sites.
Analyzing patterns of microbiological properties (Figure 5), we observed that, for BR and MBC, significant groups in terms of site and age could be deduced, but no significant trend based on the considered factors could be highlighted.
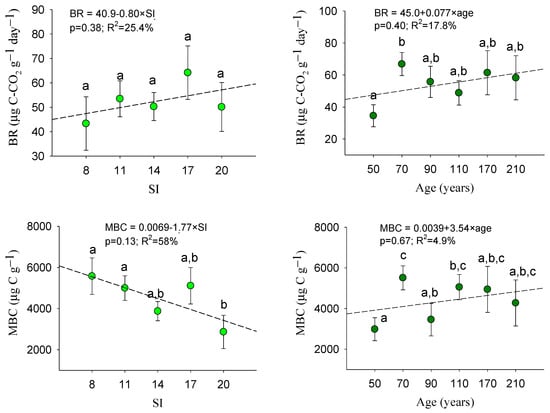
Figure 5.
Mean values of microbiological properties within age classes and site index categories: mean values with the same letter do not differ at 0.05 level according to LSD test. Sample data = 180 plots. Error bars: standard errors. For each soil variable, patterns as functions of site quality and age are also included. BR: basal respiration (µg C-CO2 g−1 day−1); MBC: microbial biomass C (µg C g−1).
Regarding the biochemical parameters associated to soil activity (Figure 6), we noted that the soil in stands with an inferior site quality (SI = 8) showed a lower TOC and N than the soil from the other site qualities. In addition, the average values of the TOC and N pools were significantly greater in mature stands than in young Pinus nigra forests, although no differences were found for available P. Consistent differences in physicochemical conditions were noted as a function of age class: TOC stabilization seems to occur in the 110-year class, whereas N significantly increased up to 170 years.
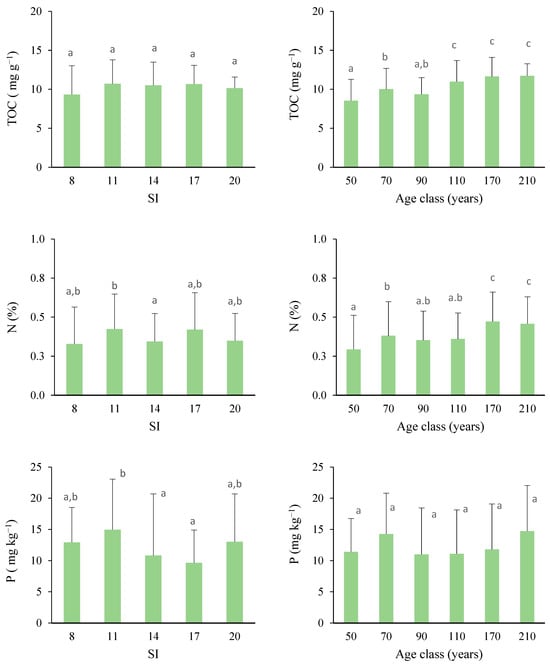
Figure 6.
Variations in total organic C (TOC; mg C g−1), total N (Kjeldahl; %), and available P (mg kg−1) depending on the site quality and age class. Bars represent the standard errors. Mean values with the same letter do not differ at the 0.05 level according to the LSD test. Sample data = 180.
The TOC in soils proved to be influenced by both stand age and the gradual acidification of the soil, indicated by a low pH according to the correlation matrix. The rise in organic carbon can be attributed to the dynamic equilibrium between the input of organic matter and its mineralization over time. The increased litterfall deposition in more productive and mature forests can contribute to soil acidification.
4. Discussion
4.1. Connections between DHA and SI: The Importance of DHA for Soil Function in P. nigra Even-Aged Mediterranean Forests
Our findings highlight that a deficiency in nutrients, indicative of a lower-quality site, prompts the activation of dehydrogenase, which mainly transform organic matter that is not usable by trees into inorganic compounds [9]. This lack of nutrients in the poor sites can be due to several factors, including limited litterfall, drought intensity, soil depth, topography, and other elements that collectively define the site quality within the forest stand [2,27]. In accordance with Zhang et al. [47], higher values of dehydrogenase in poor-quality sites are indicative of soil microbial activity, contributing to the liberation of nutrients available for trees.
When analyzing the links associated with nitrogen content, a key nutrient in forest growth and productivity [27,48], we observed that the availability of this nutrient inhibited soil enzyme activities rather than stimulates them. Although the production of enzymes may also be induced by the presence of a substrate [16], at the intracellular level (such as dehydrogenase activity), enzyme production is subject to “end-product inhibition”: as the availability of a nutrient increases, the production of the enzyme required for the catalysis of that nutrient is down-regulated [49].
For example, the findings of Fatemi et al. [50] demonstrated that the temporary enrichment of nitrogen suppressed the activity of soil enzymes. Additionally, Kumar et al. [51] noted that the dehydrogenase activity of the soil decreased as fertility levels increased, particularly with nitrogen application. In our study sites, this process appears to occur for both dehydrogenase and urease. The presence of greater N content also reduced the urease activity in other Mediterranean conifer woodlands [28]. In that sense, the research of Bueis et al. [4] also showed that SI in Pinus halepensis (P. halepensis) was correlated with N. We can accept that a minor N presence in the soil indicates that dehydrogenase is activated in order to increase this element for pines.
Certainly, climatic variables were not considered in our study to help us to understand how soil processes are triggered to allow for forest productivity. Nevertheless, soil moisture was not correlated with dehydrogenase. It is recognized that water availability is the main factor influencing productivity and enzyme activities [8,9,52], which can be conditioned by edaphic properties [4]. However, previous studies have suggested that the activity of soil dehydrogenases was higher in soils with low moisture because the interchange of O2 is favored [53]. Although an increase in the soil moisture results in a considerable increase in the fungal mass [54,55] dehydrogenases mainly occurs in bacteria [8,24]. In consequence, the bacterial community is more likely to occur in poor and young P. nigra sites. The findings of Bastida et al. [56] showed that the bacterial community was not influenced by drought, but the fungal community was severely impacted by water deficits. This scenario appears to be more common in sites where quality is lower due to climatic and edaphic conditions.
Our findings regarding the relationship between SI and soil enzymes in P. nigra stands represent an advance in the understanding of forest ecosystem functioning. In previous studies, the relationships between site and soil activity were either prominent or nonexistent. For example, when the site index was fitted as a function of both geoclimatic and edaphic variables in Mediterranean forest (findings of Bueis et al. [4] in P. halepensis, and Bravo Oviedo et al. [11] in Pinus pinaster) the results showed that the best qualities were located in rainy and humid sites (due to the importance of drought in Mediterranean areas), thus minimizing the effects of the soil parameters. In this line, soil chemical parameters alone proved to be inadequate predictors of tree productivity, as assessed by a site index (calculated as H0:Hmax) in acidic soils [3]. These conclusions differ from the findings in our study on Mediterranean P. nigra forests.
4.2. Forest Maturity and Dehydrogenase Activity in P. nigra Even-Aged Forests
Independently of the site, in young stands, soil also activated the processes responsible for biological activity. In our experimental layout, the studied chronosequence originate in shelterwood cuttings at a mature age. The time since silvicultural treatment for forest regeneration was carried out can affect soil functioning and the dynamic of recovery [19].
In consequence, our findings support the hypothesis that dehydrogenase activity in younger soils functions as an indicator of the initiation of biochemical processes for the recovery of soil nutrients after mature tree removal (shelterwood cutting). Forest regeneration in P. nigra occurs after cutting for 20–40 years in the mature stands, and in this scenario of scarce litterfall, the mobilization of nutrients is necessary, which results in increased microbial activity that restores the lost nutrients [20].
This process is like that which occurs under the conditions of more limited soil nutrients (low site quality). High levels of dehydrogenase enzymes are found in soils that are more degraded [25]. As such, dehydrogenase can indicate a deterioration in the soil quality in areas subjected to more recent silvicultural treatments [57]. These recently thinned areas tended to have a lower soil quality index (indicating a depletion in soil resources) than those subject to naturally occurring changes [18].
As was the case in poor-quality sites, in younger sites, both the demand for nutrients and fine root production increased [27,58], and dehydrogenase activity is favored in the function of root carbohydrates [8]. In our study site, the maximum rate of the current increment of volume occurred at the stand age of 60 years [32]; thus, the demand for soil nutrients should increase in younger stands because nutrient availability becomes more limited. In that sense, the results of Wic Baena et al. [20] showed that higher values of dehydrogenase were found in recently regenerated Pinus sites, but lower values were found for β-glucosidase, in accordance with our results.
With respect to maturity, also in P. nigra, Lucas-Borja et al.’s research [19] noted a higher enzyme activity in accordance with stand age within the same forest, but the differences were not statistically significant. Our results confirmed this trend for β-glucosidase but not for dehydrogenase. We hypothesize that the behaviors of β-glucosidase and dehydrogenase should not be the same. Unlike extracellular enzymes such as β-glucosidase, dehydrogenases do not accumulate in the soil and degrade very rapidly following cell death [13]. Differences in the patterns of these two enzymes may also be connected to the availability of more easily decomposable organic substances.
For these reasons, dehydrogenase should be activated in younger sites due to the availability of fresh, more recently accumulated organic matter [59], whereas β-glucosidase is more closely linked to the accumulation of C and N over time [26].
In P. nigra stands, a significant increase in litterfall with age was detected, but only until 80 years [54]. Consequently, the decline in litter deposition can be reflected in the lower dehydrogenase activity found at higher stand ages. In contrast, a significant fraction of β-glucosidase activity becomes immobilized in soil solution [24]. As a result, although mature forests constitute less productive stands, older forests can maintain greater β-glucosidase activity because a fraction of the annual C input is also stabilized in the soil [28].
5. Conclusions
Our findings mainly estates that the dehydrogenase activity emerged as the primary factor explaining the site index and forest maturity in Mediterranean Spanish black pine forests. It serves as a pivotal link between the soil and the stand, influenced by the presence of nutrients, particularly nitrogen (N).
While it is challenging to establish that a single enzyme can serve as an index for more complex definitions, such as total soil activity or site quality, the use of dehydrogenase possesses certain advantages. It is produced by living soil organisms independently of extracellular enzymes, which are secreted by roots and fungi or released from dead cells. Additionally, dehydrogenase appears to be sensitive to changes caused by forest recovery and forest management in P. nigra stands.
As a result, our findings enhance our understanding of the interrelations between soil dynamics and forest management in even-aged Pinus stands, enabling us to analyze how silvicultural treatments impact soil activity in the Mediterranean Spanish black pine mountains.
A better understanding of the role of dehydrogenase in forest science will open up further opportunities to use it as an indicator for forest planning, or to analyze the state and evolution of P. nigra stands. Our study also suggests that the measurement of changes in soil dehydrogenase activity may provide a useful index of changes in soil functions in Mediterranean climates.
Author Contributions
Conceptualization, F.A.G.-M., F.G.-S. and M.A.-A.; methodology, M.A.-A., M.P. and F.A.G.-M.; software, F.A.G.-M. and F.G.-S.; validation, C.W., F.R.L.-S. and E.R.; formal analysis, F.G.-S., M.P. and C.W.; resources, M.A.-A. and F.R.L.-S.; writing—original draft preparation, F.G.-S. and F.A.G.-M.; writing—review and editing, F.G.-S., F.A.G.-M. and M.A.-A.; supervision, C.W., F.R.L.-S. and E.R.; funding acquisition, M.A.-A. and F.R.L.-S. All authors have read and agreed to the published version of the manuscript.
Funding
This research was supported by the Education, Culture and Sports Department at the Castilla-La Mancha Regional Council, Project SBPLY/19/180501/000322 (GEFORSOIL), and the Projects MINECO/AEI/FEDER. Ref CGL2017-83538-C3-2-R, and PID2020-119861RB-I00.
Data Availability Statement
The data presented in this study are available on request from the corresponding author. The data are not publicly available due to privacy.
Acknowledgments
We thank the Department of Science and Agroforestry Technology and Genetics and the Renewable Energy Research Institute-IER (University of Castilla-La Mancha), for the help given to Francisco García Saucedo to carry out his doctoral thesis.
Conflicts of Interest
The authors declare no conflicts of interest.
References
- Molina-Valero, J.A.; Diéguez-Aranda, U.; Álvarez-González, J.G.; Castedo-Dorado, F.; Pérez-Cruzado, C. Assessing site form as an indicator of site quality in even-aged Pinus radiata D. Don stands in north-western Spain. Ann. For. Sci. 2019, 76, 113. [Google Scholar] [CrossRef]
- Burkhart, H.E.; Tomé, M. Modeling Forest Trees and Stands; Springer: Dordrecht, The Netherlands, 2012. [Google Scholar]
- Hansson, K.; Laclau, J.-P.; Saint-André, L.; Mareschal, L.; van der Heijden, G.; Nys, C.; Nicolas, M.; Ranger, J.; Legout, A. Chemical fertility of forest ecosystems. Part 1: Common soil chemical analyses were poor predictors of stand productivity across a wide range of acidic forest soils. For. Ecol. Manag. 2020, 461, 117843. [Google Scholar] [CrossRef]
- Bueis, T.; Bravo, F.; Pando, V.; Turrión, M.-B. Site factors as predictors for Pinus halepensis Mill. productivity in Spanish plantations. Ann. For. Sci. 2017, 74, 6. [Google Scholar] [CrossRef]
- Martin-Benito, D.; Kint, V.; del Río, M.; Muys, B.; Cañellas, I. Growth responses of West-Mediterranean Pinus nigra to climate change are modulated by competition and productivity: Past trends and future perspectives. For. Ecol. Manag. 2011, 262, 1030–1040. [Google Scholar] [CrossRef]
- Skovsgaard, J.P.; Vanclay, J.K. Forest site productivity: A review of the evolution of dendrometric concepts for even-aged stands. For. Int. J. For. Res. 2007, 81, 13–31. [Google Scholar] [CrossRef]
- Ushio, M.; Kitayama, K.; Balser, T.C. Tree species effects on soil enzyme activities through effects on soil physicochemical and microbial properties in a tropical montane forest on Mt. Kinabalu, Borneo. Pedobiologia 2010, 53, 227–233. [Google Scholar] [CrossRef]
- Garcia, C.; Roldan, A.; Hernandez, T. Ability of different plant species to promote microbiological processes in semiarid soil. Geoderma 2005, 124, 193–202. [Google Scholar] [CrossRef]
- Bueis, T.; Turrión, M.B.; Bravo, F.; Pando, V.; Muscolo, A. Factors determining enzyme activities in soils under Pinus halepensis and Pinus sylvestris plantations in Spain: A basis for establishing sustainable forest management strategies. Ann. For. Sci. 2018, 75, 34. [Google Scholar] [CrossRef]
- Martín-Sanz, R.C.; Pando, V.; Bueis, T.; Turrión, M.-B. Influence of Soil Properties on P Pools and Its Effect on Forest Productivity in Mediterranean Calcareous Soils. Forests 2021, 12, 1398. [Google Scholar] [CrossRef]
- Bravo-Oviedo, A.; Roig, S.; Bravo, F.; Montero, G.; del-Río, M. Environmental variability and its relationship to site index in Mediterranean maritime pine. For. Syst. 2011, 20, 50–64. [Google Scholar] [CrossRef]
- Martín-Benito, D.; del Río, M.; Cañellas, I. Black pine (Pinus nigra Arn.) growth divergence along a latitudinal gradient in Western Mediterranean mountains. Ann. For. Sci. 2010, 67, 401. [Google Scholar] [CrossRef]
- Gil-Sotres, F.; Trasar-Cepeda, C.; Leirós, M.C.; Seoane, S. Different approaches to evaluating soil quality using biochemical properties. Soil Biol. Biochem. 2005, 37, 877–887. [Google Scholar] [CrossRef]
- Kaczyńska, G.; Borowik, A.; Wyszkowska, J. Soil Dehydrogenases as an Indicator of Contamination of the Environment with Petroleum Products. Water Air Soil Pollut. 2015, 226, 372. [Google Scholar] [CrossRef] [PubMed]
- Zuccarini, P.; Asensio, D.; Sardans, J.; Ogaya, R.; Peñuelas, J. Changes in soil enzymatic activity in a P-limited Mediterranean shrubland subject to experimental nitrogen deposition. Appl. Soil Ecol. 2021, 168, 104159. [Google Scholar] [CrossRef]
- García, C.; Hernández, T.; Costa, F. Microbial activity in soils under mediterranean environmental conditions. Soil Biol. Biochem. 1994, 26, 1185–1191. [Google Scholar] [CrossRef]
- Allison, S.D.; Vitousek, P.M. Responses of extracellular enzymes to simple and complex nutrient inputs. Soil Biol. Biochem. 2005, 37, 937–944. [Google Scholar] [CrossRef]
- Andrés-Abellán, M.; Wic-Baena, C.; López-Serrano, F.R.; García-Morote, F.A.; Martínez-García, E.; Picazo, M.I.; Rubio, E.; Moreno-Ortego, J.L.; Bastida-López, F.; García-Izquierdo, C. A soil-quality index for soil from Mediterranean forests. Eur. J. Soil Sci. 2019, 70, 1001–1011. [Google Scholar] [CrossRef]
- Lucas-Borja, M.E.; Hedo, J.; Cerda, A.; Candel-Perez, D.; Vinegla, B. Unravelling the importance of forest age stand and forest structure driving microbiological soil properties, enzymatic activities and soil nutrients content in Mediterranean Spanish black pine(Pinus nigra Ar. ssp. salzmannii). For. Sci. Total Environ. 2016, 562, 145–154. [Google Scholar] [CrossRef]
- Wic Baena, C.; Andrés-Abellán, M.; Lucas-Borja, M.E.; Martínez-García, E.; García-Morote, F.A.; Rubio, E.; López-Serrano, F.R. Thinning and recovery effects on soil properties in two sites of a Mediterranean forest, in Cuenca Mountain (South-eastern of Spain). For. Ecol. Manag. 2013, 308, 223–230. [Google Scholar] [CrossRef]
- Henriquez, C.; Uribe, L.; Valenciano, A.; Nogales, R. Actividad enzimática del suelo -Deshidrogenasa, -Glucosidasa, Fosfatasa y Ureasa- bajo diferentes cultivos. Agron. Costarric. 2014, 38, 43–54. [Google Scholar] [CrossRef]
- Zuccarini, P.; Asensio, D.; Ogaya, R.; Sardans, J.; Peñuelas, J. Effects of seasonal and decadal warming on soil enzymatic activity in a P-deficient Mediterranean shrubland. Glob. Chang. Biol. 2020, 26, 3698–3714. [Google Scholar] [CrossRef] [PubMed]
- Huang, H.; Tian, D.; Zhou, L.; Su, H.; Ma, S.; Feng, Y.; Tang, Z.; Zhu, J.; Ji, C.; Fang, J. Effects of afforestation on soil microbial diversity and enzyme activity: A meta-analysis. Geoderma 2022, 423, 115961. [Google Scholar] [CrossRef]
- Utobo, E.B.; Tewari, L. Soil Enzymes as Bioindicators of Soil Ecosystem Status. Appl. Ecol. Environ. Res. 2015, 13, 147–169. [Google Scholar] [CrossRef]
- Wolińska, A.; Stepniewska, Z. Dehydrogenase Activity in the Soil Environment. In Dehydrogenases; Canuto, R.A., Ed.; IntechOpen: London, UK, 2012; pp. 183–210. [Google Scholar]
- Salazar, S.; Sánchez, L.E.; Alvarez, J.; Valverde, A.; Galindo, P.; Igual, J.M.; Peix, A.; Santa-Regina, I. Correlation among soil enzyme activities under different forest system management practices. Ecol. Eng. 2011, 37, 1123–1131. [Google Scholar] [CrossRef]
- Landsberg, J.J.; Gower, S.T. Applications of Physiological Ecology to Forest Management; Academic Press: San Diego, CA, USA, 1997. [Google Scholar]
- García Morote, F.A.; López-Serrano, F.R.; Andrés, M.; Martínez-García, E.; Lucas-Borja, M.; Dadi, T.; Candel, D.; Wic, C. Effects of woodland maturity, vegetation cover and season on enzymatic and microbial activity in thermophilic Spanish Juniper woodlands (Juniperus thurifera L.) of southern Spain. Eur. J. Soil Sci. 2012, 63, 579–591. [Google Scholar] [CrossRef]
- Yesilonis, I.; Szlavecz, K.; Pouyat, R.; Whigham, D.; Xia, L. Historical land use and stand age effects on forest soil properties in the Mid-Atlantic US. For. Ecol. Manag. 2016, 370, 83–92. [Google Scholar] [CrossRef]
- Enescu, C.M.; de Rigo, D.; Caudullo, G.; Mauri, A.; Houston Durrant, T. Pinus nigra in Europe: Distribution, Habitat, Usage and Threats; European Commission, Joint Research Centre: Luxembourg, 2016. [Google Scholar]
- del Cerro Barja, A.; Lucas-Borja, M.E.; Martinez Garcia, E.; Lopez Serrano, F.R.; Andres Abellan, M.; Garcia Morote, F.A.; Navarro Lopez, R. Influence of stand density and soil treatment on the Spanish Black Pine (Pinus nigra Arn. ssp. salzmannii) regeneration in Spain. Investig. Agrar.-Sist. Y Recur. For. 2009, 18, 167–180. [Google Scholar] [CrossRef]
- Loranca, J.A.G. Pinus Nigra Arn. en el Sistema Ibérico: Tablas de Crecimiento y Producción; CIFOR-INIA, Ed.; Instituto Nacional de Investigación y Tecnología Agraria y Alimentaria, Ministerio de Agricultura, Pesca y Alimentación: Madrid, Spain, 1996; p. 97. [Google Scholar]
- Kottek, M.; Grieser, J.; Beck, C.; Rudolf, B.; Rubel, F. World Map of the Köppen-Geiger Climate Classification Updated. Meteorol. Z. 2006, 15, 259–263. [Google Scholar] [CrossRef]
- IUSS Working Group WRB. World Reference Base for Soil Resources. International Soil Classification System for Naming Soils and Creating Legends for Soil Maps; International Union of Soil Sciences (IUSS): Vienna, Austria, 2022; 236p. [Google Scholar]
- Socha, J.; Pierzchalski, M.; Bałazy, R.; Ciesielski, M. Modelling top height growth and site index using repeated laser scanning data. For. Ecol. Manag. 2017, 406, 307–317. [Google Scholar] [CrossRef]
- Quilchano, C.; Marañón, T. Dehydrogenase activity in Mediterranean forest soils. Biol. Fertil. Soils 2002, 35, 102–107. [Google Scholar] [CrossRef]
- Andrés Abellan, M.; Wic Baena, C.; García Morote, F.A.; Picazo Cordoba, M.I.; Candel Pérez, D.; Lucas-Borja, M.E. Influence of the soil storage method on soil enzymatic activities. For. Syst. 2011, 20, 379–388. [Google Scholar] [CrossRef]
- Tabatabai, M.A.; Bremner, J.M. Use of p-nitrophenyl phosphate for assay of soil phosphatase activity. Soil Biol. Biochem. 1969, 1, 301–307. [Google Scholar] [CrossRef]
- Kandeler, E.; Stemmer, M.; Palli, S.; Gerzabek, M.H. Xylanase, Invertase and Urease Activity in Particle—Size Fractions of Soils. In Effect of Mineral-Organic-Microorganism Interactions on Soil and Freshwater Environments; Berthelin, J., Huang, P.M., Bollag, J.M., Andreux, F., Eds.; Springer: Boston, MA, USA, 1999; pp. 275–286. [Google Scholar]
- García, C.; Hernández, T.; Costa, F.; Ceccanti, B.; Masciandaro, G. The dehydrogenase activity of soil as an ecological marker in processes of perturbed system regeneration. In Proceedings of the XI International Symposium of Environmental Biochemistry; Gallardo-Lancho, J., Ed.; CSIC: Salamanca, Spain, 1993; pp. 89–100. [Google Scholar]
- Vance, E.D.; Brookes, P.C.; Jenkinson, D.S. An extraction method for measuring soil microbial biomass C. Soil Biol. Biochem. 1987, 19, 703–707. [Google Scholar] [CrossRef]
- Walkley, A.; Black, I.A. An examination of the Degtjareff method for determining soil organic matter, and a proposed modification of the chromic acid titration method. Soil Sci. 1934, 37, 29–38. [Google Scholar] [CrossRef]
- Bremner, J.M. Inorganic Forms of Nitrogen. In Methods of Soil Analysis; American Society of Agronomy Inc.: Madison, WI, USA, 1965; pp. 1179–1237. [Google Scholar]
- Olsen, S.R.; Sommers, L.E. Phosphorus. In Methods of Soil Analysis; American Society of Agronomy Inc.: Madison, WI, USA, 1983; pp. 403–430. [Google Scholar]
- Johnson, R.A.; Wichern, D.W. Applied Multivariate Statistical Analysis; Pearson Prentice Hall: Hoboken, NJ, USA, 2007. [Google Scholar]
- Shrestha, N. Factor Analysis as a Tool for Survey Analysis. Am. J. Appl. Math. Stat. 2021, 9, 4–11. [Google Scholar] [CrossRef]
- Zhang, N.; He, X.-D.; Gao, Y.-B.; Li, Y.-H.; Wang, H.-T.; Ma, D.; Zhang, R.; Yang, S. Pedogenic Carbonate and Soil Dehydrogenase Activity in Response to Soil Organic Matter in Artemisia ordosica Community. Pedosphere 2010, 20, 229–235. [Google Scholar] [CrossRef]
- Yang, H.; Li, Y.; Cao, Y.; Shi, W.; Xie, E.; Mu, N.; Du, G.; Shen, Y.; Tang, D.; Cheng, Z. Nitrogen nutrition contributes to plant fertility by affecting meiosis initiation. Nat. Commun. 2022, 13, 485. [Google Scholar] [CrossRef]
- Allison, V.J.; Condron, L.M.; Peltzer, D.A.; Richardson, S.J.; Turner, B.L. Changes in enzyme activities and soil microbial community composition along carbon and nutrient gradients at the Franz Josef chronosequence, New Zealand. Soil Biol. Biochem. 2007, 39, 1770–1781. [Google Scholar] [CrossRef]
- Fatemi, F.R.; Fernandez, I.J.; Simon, K.S.; Dail, D.B. Nitrogen and phosphorus regulation of soil enzyme activities in acid forest soils. Soil Biol. Biochem. 2016, 98, 171–179. [Google Scholar] [CrossRef]
- Kumar, R.M. Rhizosphere Dehydrogenase Activity, Soil Organic Carbon and Post-Harvest Nutrient Status of Soil as Influenced by Hybrids, Planting Density and Fertility Levels of Maize in Irrigated Eco-System of Northern Karnataka. Biomed. J. Sci. Tech. Res. 2019, 23, 17124–17128. [Google Scholar] [CrossRef]
- Díaz-Pinés, E.; Rubio, A.; Van Miegroet, H.; Montes, F.; Benito, M. Does tree species composition control soil organic carbon pools in Mediterranean mountain forests? For. Ecol. Manag. 2011, 262, 1895–1904. [Google Scholar] [CrossRef]
- Borowik, A.; Wyszkowska, J. Soil moisture as a factor affecting the microbiological and biochemical activity of soil. Plant Soil Environ. 2016, 62, 250–255. [Google Scholar] [CrossRef]
- Cseresnyés, I.; Csontos, P.; Bózsing, E. Stand age influence on litter mass of Pinus nigra plantations on dolomite hills in Hungary. Can. J. Bot. 2006, 84, 363–370. [Google Scholar] [CrossRef]
- Fioretto, A.; Musacchio, A.; Andolfi, G.; Virzo De Santo, A. Decomposition dynamics of litters of various pine species in a Corsican pine forest. Soil Biol. Biochem. 1998, 30, 721–727. [Google Scholar] [CrossRef]
- Bastida, F.; Torres, I.F.; Andres-Abellan, M.; Baldrian, P.; Lopez-Mondejar, R.; Vetrovsky, T.; Richnow, H.H.; Starke, R.; Ondono, S.; Garcia, C.; et al. Differential sensitivity of total and active soil microbial communities to drought and forest management. Glob. Chang. Biol. 2017, 23, 4185–4203. [Google Scholar] [CrossRef]
- Zornoza, R.; Acosta, J.A.; Bastida, F.; Domínguez, S.G.; Toledo, D.M.; Faz, A. Identification of sensitive indicators to assess the interrelationship between soil quality, management practices and human health. Soil 2015, 1, 173–185. [Google Scholar] [CrossRef]
- García Morote, F.A.; López Serrano, F.R.; Andrés, M.; Rubio, E.; González Jiménez, J.L.; de las Heras, J. Allometries, biomass stocks and biomass allocation in the thermophilic Spanish juniper woodlands of Southern Spain. For. Ecol. Manag. 2012, 270, 85–93. [Google Scholar] [CrossRef]
- Wiatrowska, K.; Komisarek, J.; Olejnik, J. Variations in Organic Carbon Content and Dehydrogenases Activity in Post-Agriculture Forest Soils: A Case Study in South-Western Pomerania. Forests 2021, 12, 459. [Google Scholar] [CrossRef]
Disclaimer/Publisher’s Note: The statements, opinions and data contained in all publications are solely those of the individual author(s) and contributor(s) and not of MDPI and/or the editor(s). MDPI and/or the editor(s) disclaim responsibility for any injury to people or property resulting from any ideas, methods, instructions or products referred to in the content. |
© 2024 by the authors. Licensee MDPI, Basel, Switzerland. This article is an open access article distributed under the terms and conditions of the Creative Commons Attribution (CC BY) license (https://creativecommons.org/licenses/by/4.0/).