Article

Temporal–Spatial Characteristics and Influencing Factors of Forest Fires in the Tropic of Cancer (Yunnan Section)

1
Faculty of Geography, Yunnan Normal University, Kunming 650500, China
2
College of Geography and Environment, Shandong Normal University, Jinan 250358, China
3
Southwest United Graduate School, Kunming 650092, China
4
Key Laboratory of Resources and Environmental Remote Sensing for Universities in Yunnan, Kunming 650500, China
5
Center for Geospatial Information Engineering and Technology of Yunnan Province, Kunming 650500, China
*
Author to whom correspondence should be addressed.
Forests 2024, 15(4), 661; https://doi.org/10.3390/f15040661
Submission received: 16 January 2024 / Revised: 23 March 2024 / Accepted: 3 April 2024 / Published: 5 April 2024
(This article belongs to the Section Natural Hazards and Risk Management)

Abstract

:
Forest fires often cause many casualties and property losses, and it is important to explore the time and space laws of forest fires and the influencing factors. The present study used the cities (prefectures) crossed by the Tropic of Cancer (Yunnan section) as the study area. Based on burned land data, a combination of natural factors, such as climate, topography, vegetation, and human activities, such as distance from settlements and population density, a binary logistic regression model, and a boosted regression tree model, were used to analyze the temporal–spatial characteristics and influencing factors of forest fires in 2000 to 2020. The following results were obtained: (1) During 2000–2020, the overall forest fire area in the study area showed a trend of fluctuating decline. The high incidence period of forest fires occurred in 2010. After 2010, the forest fire area in the study area was greatly reduced. (2) The forest fire area in the study area was greater in the east and less in the west. The forest fire areas in Wenshan Prefecture and Honghe Prefecture in the east were larger, accounting for 68%, and the forest fire areas in Pu’er City, Lincang City, and Yuxi City in the west were smaller, accounting for only 32%. (3) The contribution rate of the average precipitation and average temperature factors ranked in the top two in the two driving force analysis models, which indicated that precipitation and temperature had a significant effect on the incidence of forest fires in the study area.

1. Introduction

Forests are the largest terrestrial ecosystems on earth [1,2], playing a crucial role in maintaining biodiversity. However, with the succession and renewal of forests, forest fires have become one of the most significant disturbance factors in forest ecosystems [3]. As the global climate warms, the conditions conducive to the ignition and spread of fires are continuously increasing, leading to a higher frequency of forest fires worldwide [4]. Yunnan Province is an important forest area in the southern region of China with a high incidence area of forest fires due to the distinct dry (November–April) and wet (May–October) seasons, severe and long-lasting spring droughts, long borders, large areas requiring fire protection, and difficult fire management [5]. Therefore, monitoring and evaluating the spatial and temporal distribution and drivers of forest fires in Yunnan Province will provide a scientific basis for the prevention and management of forest fires and the sustainable development of forestry in Yunnan Province.
The current data sources for forest fires are primarily historical fire information data [6,7] and remote sensing data [8,9,10]. Historical fire statistics generally include more detailed records, such as fire occurrence time, fire cause, and overfire area, but the data lack spatial information. In comparison, the technology of satellite sensors in remote sensing, with advantages such as acquiring spatial location information, conducting repetitive observations, and quickly obtaining data, can enable faster and more effective extraction of fire information and dynamic monitoring of wildfires [11]. The forest fire research that has been carried out based on remote sensing data mainly includes the following parts: (1) The study on the frequency of forest fire occurrences at certain times and within a certain range. The occurrence of forest fires within a certain range is not completely random but 21shows a certain spatiotemporal distribution pattern [12]. So, current studies of the spatiotemporal patterns of forest fire occurrence primarily include the frequency of forest fire occurrence on multiple spatial scales, such as global [13], national [14], provincial [15], and municipal [16], and the frequency of forest fire occurrence on different temporal scales, such as annual [17], monthly [18], and daily [19]. (2) The study on the influencing factors of forest fires. For example, Zhang Xinyue et al. [20], Zeng Aicong et al. [21], and Jing Xiaodong [22] found that meteorological conditions played a dominant role in the occurrence of forest fires. Tian Ye et al. [23], Jayshree Das et al. [24], and Kantarcioglu et al. [25] showed that elevation, slope, slope direction, and other topographical elements influenced the incidence of forest fires. Yan Thinking et al. [26] concluded that the probability and scale of fire occurrence varied between different forest types. Aleksandrov et al. [27] estimated the high incidence period of forest fires from the water content of forest combustibles. Aqil Tariq et al. found a significant relationship between the probability of forest fires and the density of the population [28], and Ikhsan et al. [29] found a notable link between the forest fire probability and population density in a spatial simulation of forest fire occurrence. A spatial modeling study of forest fire occurrence found that areas closest to rivers and roads were more prone to forest fires, and areas closest to settlements were less likely to occur. Some scholars believe that the scale of forest fire occurrence is related to latitude [30], atmospheric circulation [31], and night-time light [32]. Numerous studies demonstrated that forest fires were primarily influenced by natural and human factors, such as climate, topography, surface combustibles, and human activities.
The above studies show that many scholars have investigated the spatial and temporal patterns of regional forest fires, and there have been numerous studies on the factors affecting the occurrence of fires. However, China covers a vast area with complex and variable topography and climate types, and geospatial differences lead to different characteristics and patterns of forest fire occurrence. The applicability of a large-scale forest fire analysis framework is poor, and small- and medium-scale forest fire studies based on long-term series of remotely sensed data are relatively insufficient. Therefore, more case studies are needed. The regions of prefectures (cities) in Yunnan Province crossed by the Tropic of Cancer are characterized by a plateau subtropical monsoon climate on a macro scale. However, due to the complex high mountain and canyon terrain in this area, there are significant local temperature variations caused by the large altitude differences, forming a rich variety of microclimates [33]. Additionally, the region has a large forest area, with many key protected areas and border forest areas. Therefore, the forest fire prevention work within the region covers multiple characteristics of forest fire prevention work in Yunnan Province, and it is a typical forest fire management region within Yunnan Province, which makes it necessary to perform research on forest fire prevention and control. Considering this, this study takes the prefectures (cities) crossed by the Tropic of Cancer in Yunnan Province as the study area. Based on remote sensing data on forest fire scars from 2000 to 2020, the study explores the spatiotemporal pattern of forest fires. It uses a binary logistic regression model and a boosted regression tree model to investigate the main influencing factors of forest fire occurrence and spatiotemporal changes from natural geographic conditions and human activities, aiming to provide a scientific basis for forest fire prevention in the area.

2. Study Area and Data Sources
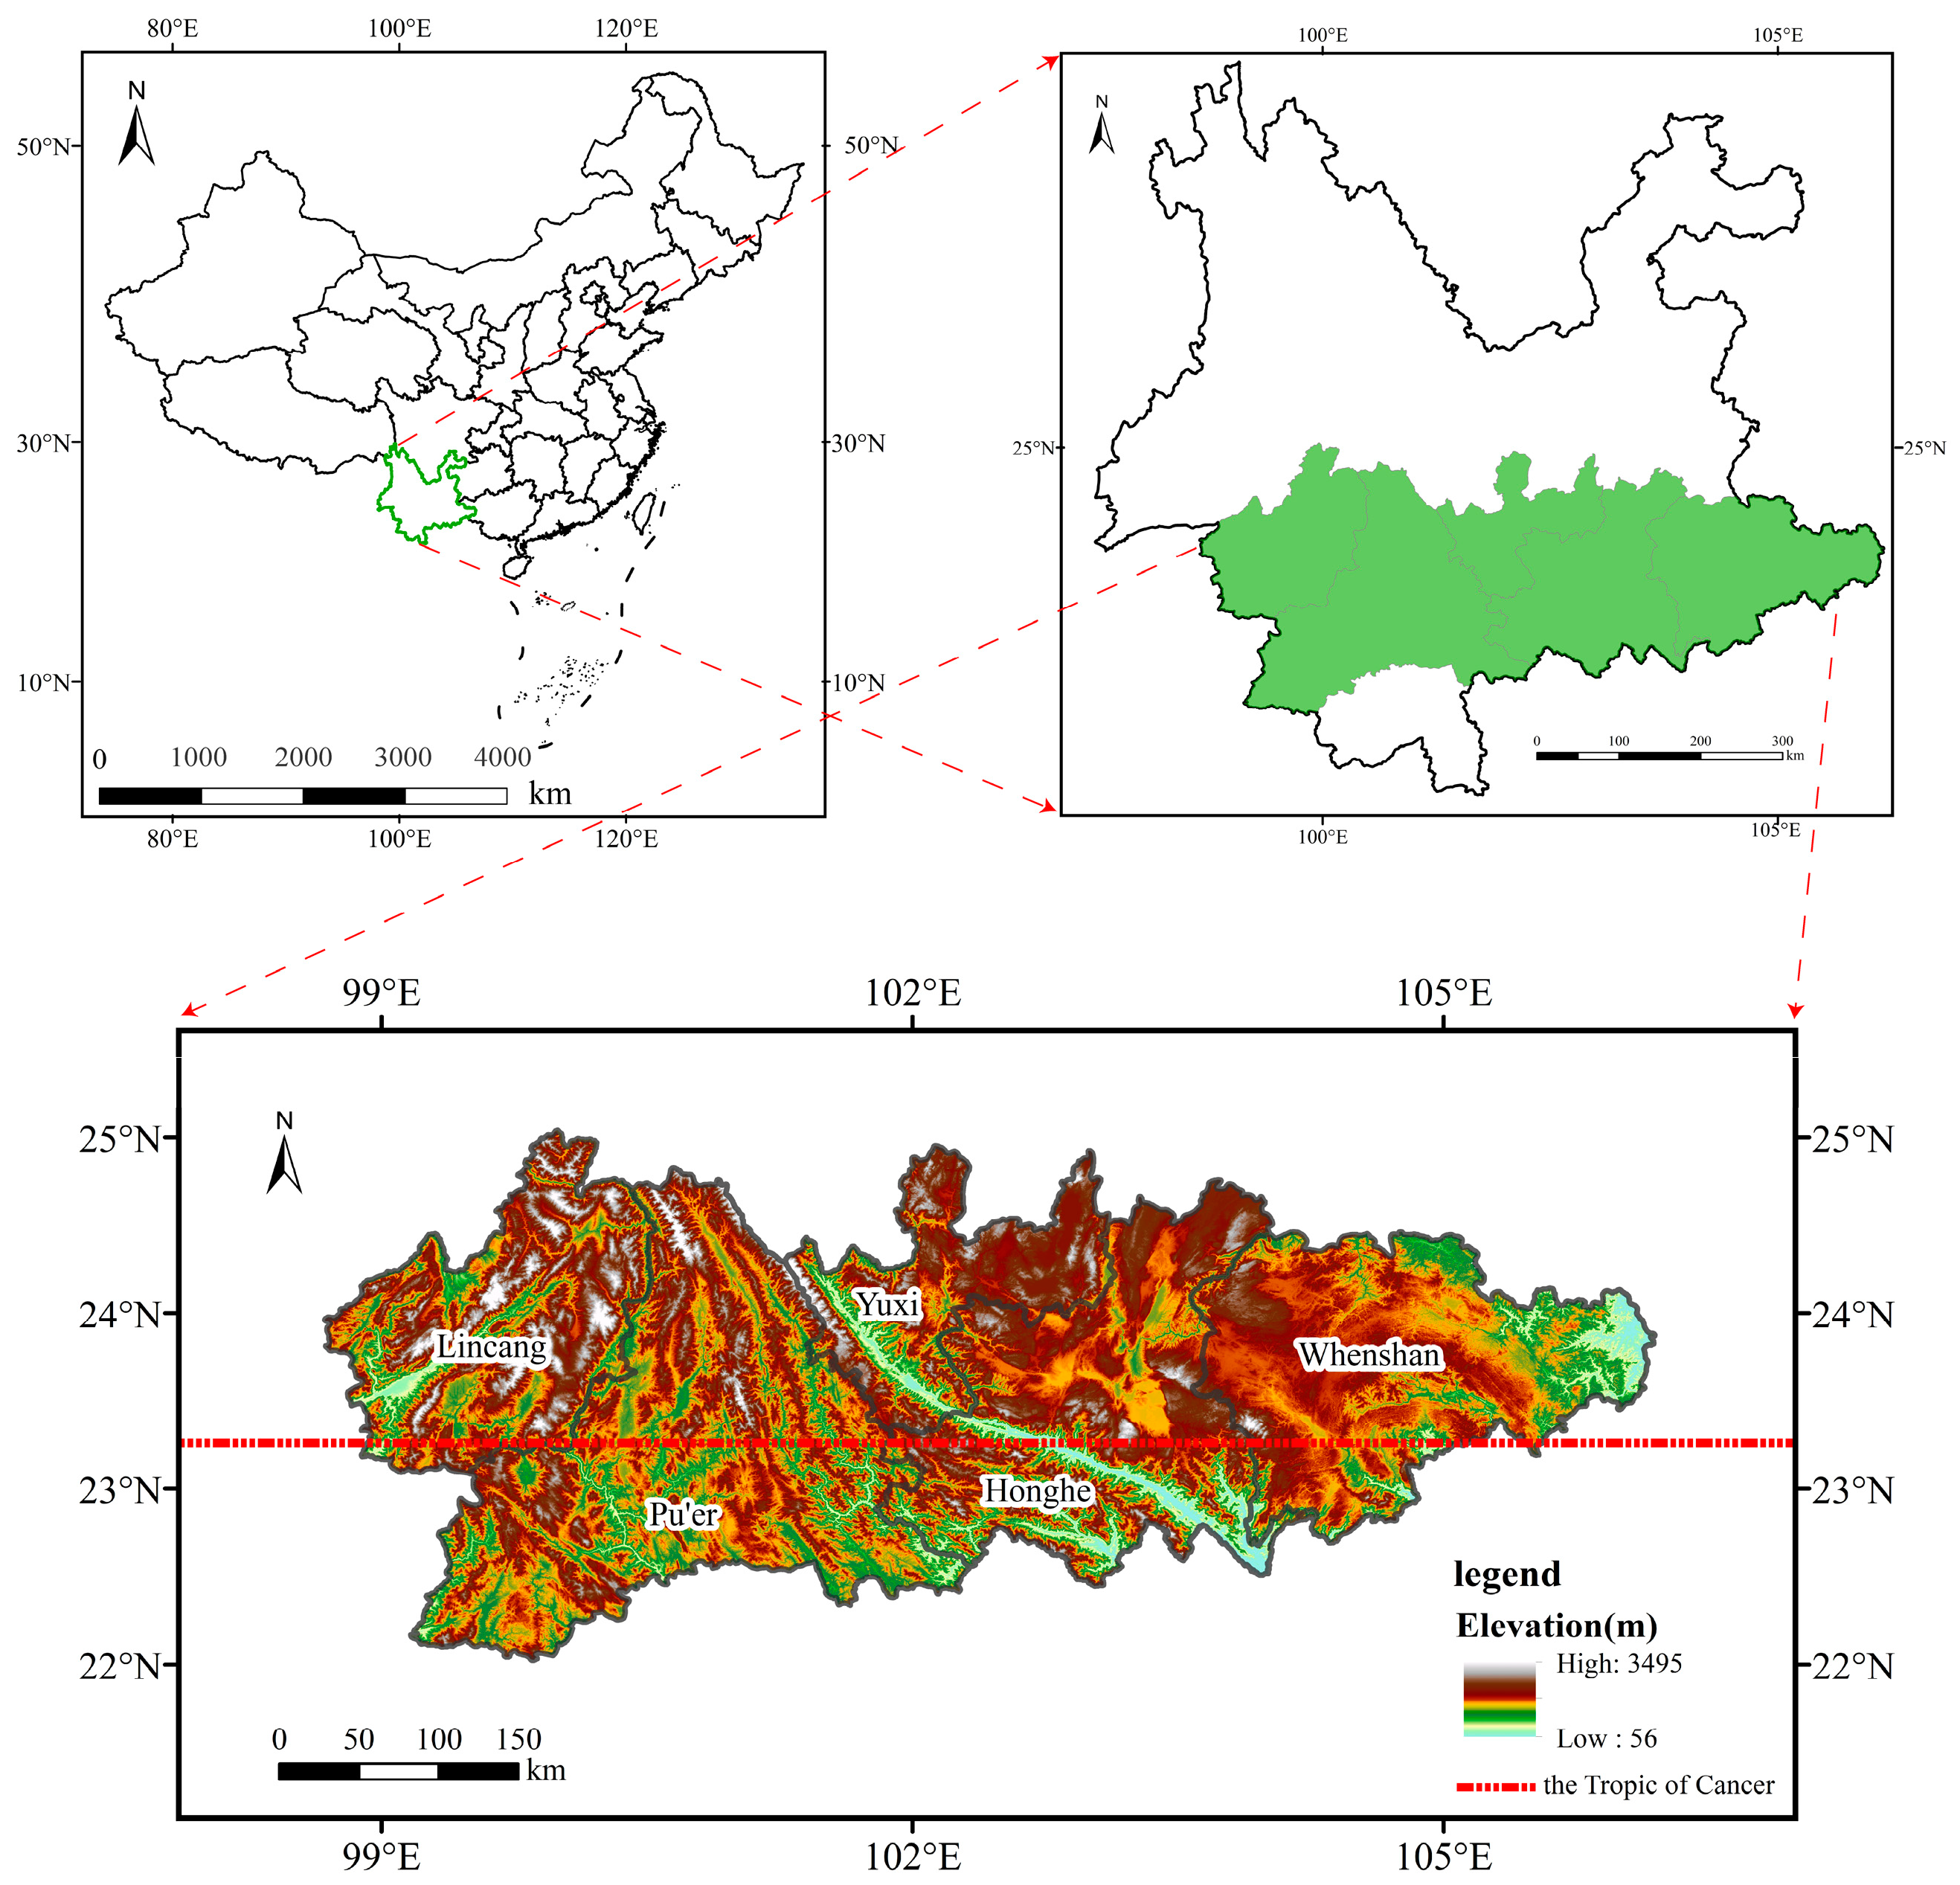
2.1. Study Area

The Tropic of Cancer is located at approximately 23.5° N, and it is a latitudinal line of special significance because it divides the northern temperate zone from the tropics. Five cities (prefectures) in Yunnan Province crossed by the Tropic of Cancer, Lincang City, Pu’er City, Yuxi City, Honghe Prefecture, and Wenshan Prefecture, contain 48 counties (districts) (Figure 1). The study area lies between 21°58′ N and 25°3′ N and 98°22′ E and 106°20′ E. The study area is located in the Red River Rift Valley. The study area was divided into two parts, east and west, bound by the Red River Rift Valley. The terrain in the western part is high in the north and low in the south, with deep valleys and high mountains and a large difference in elevation (between 56 m and 3495 m). The terrain in the eastern part is relatively gentle. Due to the influence of geographic factors within the region, there are obvious microclimatic phenomena, but the type of climate is primarily a subtropical monsoon climate, with high temperatures and rainfall in summer, wet and dry, with annual precipitation in most of the area ranging from 1800 to 2500 mm and an average annual temperature of approximately 21 °C. The precipitation in the summer season reaches greater than 80 percent of the entire year, and the precipitation in winter and spring is the lowest, which makes it easy for forest fires to occur. From the perspective of Yunnan Province, the study area has complex combustible material types and a long fire history, and most of the cities (prefectures) have a cumulative number of forest fires higher than 1000 between 2001 and 2020, and it has a high frequency of forest fires and a large area of fires [34]. Therefore, the study area has a high incidence of forest fires and a high fire risk in Yunnan Province.

2.2. Data Sources and Pre-Processing

The data for the study consisted of burned area data, land cover data, meteorological data, topographic data, vegetation data, and human factor data (Table 1). This study utilizes the spatial data management and spatial analysis functions in the ArcGIS10.2 software developed by the Environmental Systems Research Institute (Esri, Redlands, CA, USA) to process data. The study used ArcGIS10.2 software to transform the relevant data into location-relative raster files. To maintain data consistency, all data were resampled to a 100 m × 100 m grid, where the geographic coordinate system uniformly used the National Geodetic 2000 coordinate system and the projected coordinate system uniformly used the Gauss–Kruger projection.

2.2.1. Burned Area Data

Based on the global fire trace product dataset [35], the fire trace data for the study year in the study area was extracted. The data was then vectorized using ArcGIS10.2 software and overlaid onto the forest data from the global landcover product to extract the forest fire trace data of the study area.

2.2.2. Meteorological Data

The climate observation station dataset includes data such as station temperature, air pressure, dew point, wind direction and speed, cloud cover, and precipitation. The temporal scale of these station data is resampled to an annual scale. Subsequently, the processed station data are spatially interpolated using the kriging tool in ArcGIS10.2 software to obtain the annual average precipitation (mm) and annual average temperature (°C) of the study area.
This study obtained the aridity index by calculating the ratio of annual potential evapotranspiration to annual precipitation [36], which was used to indicate the degree of aridity. The aridity index is an indicator representing the dryness/wetness of an area. According to the aridity index classification, regions can be categorized as humid (aridity index < 1), semi-humid (1 < aridity index < 1.5), semi-arid (1.5 < aridity index < 4), and arid areas (aridity index > 4) [37].

2.2.3. Topographic Data

Elevation data were obtained from the DEM dataset, and slope data were generated from the DEM data using ArcGIS10.2 software.

2.2.4. Vegetation Data

Fractional vegetation cover (FVC) refers to the proportion of the vertical projection area of vegetation, including branches, leaves, and stems, on the horizontal ground surface to the total area of the study area. The monthly vegetation cover of the study area for the year of the study was extracted from the dataset of the China Regional Monthly Vegetation Cover product. The maximum synthesis method was used to synthesize the 12-month FVC product data on an annual scale to obtain the vegetation cover FVC data for each year.
Vegetation type data were obtained from the global landcover product, which contains a total of 38 surface cover types. We extracted the vegetation type data of the study area in the study year, quantified the expression of the vegetation types, and based on the different degrees of fire susceptibility of each vegetation type, evergreen broad-leaved forest, deciduous broad-leaved forest, and evergreen needle-leaved forest are assigned values of 1, 2, and 3, respectively [9,38].

2.2.5. Human Factor Data

The human factor data were obtained from the 1:250,000 national basic geographic database of the National Geographic Information Resources Catalogue Service System, and the distance from each pixel to the nearest settlement and highway was calculated using the “Euclidean Distance” of ArcGIS10.2 software. Population density data were extracted from the World Population Density Map published by WorldPop, from which the population density data of the study area were extracted for the study year.

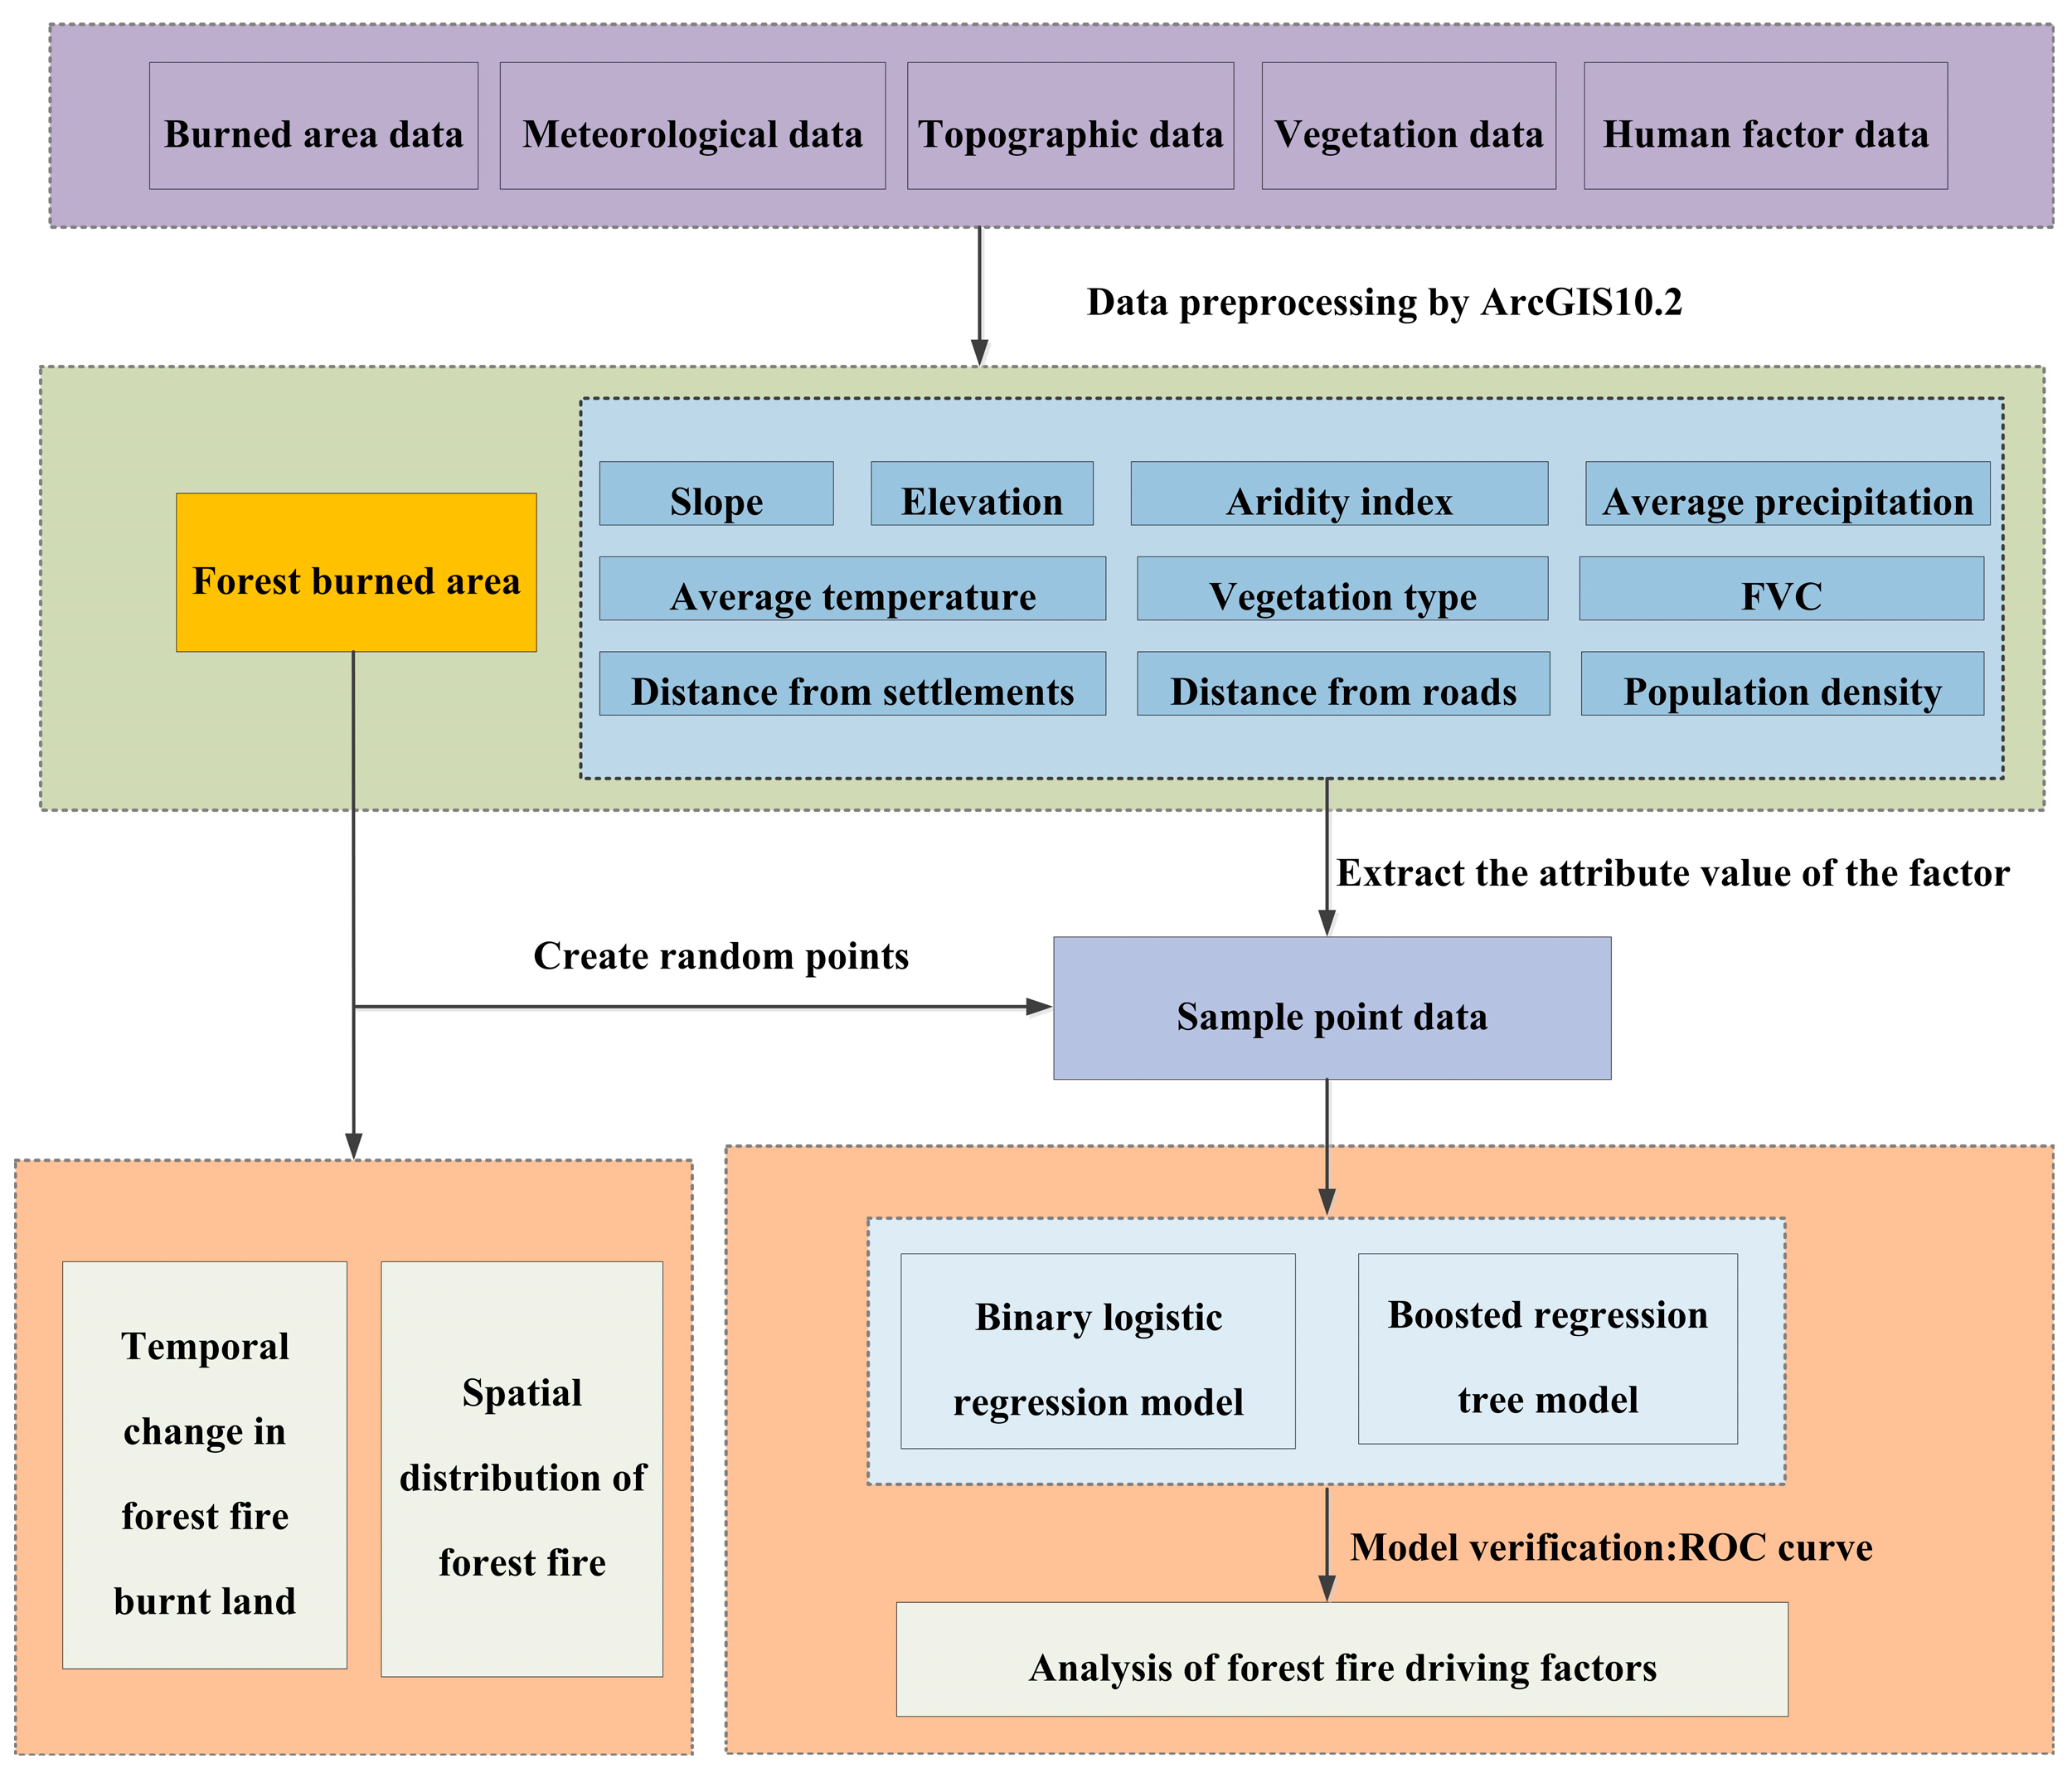
3. Research Methodology

This study analyzed the spatiotemporal pattern of forest fires in the study area using forest burned area data from 2000 to 2020. Simultaneously, 10 driving factors affecting the occurrence of forest fires were selected from four aspects: climate, topography, vegetation, and human activities, and a factor analysis was conducted. Factor analysis was conducted using a binary logistic regression model and a boosted regression tree model, and the models were verified using receiver operating characteristic (ROC) curve analysis. Figure 2 shows the flowchart of the research process followed.

3.1. Selection of Forest Fire Driving Factors and Processing of Sample Points

The outbreak of forest fires has a certain correlation with geomorphology, climate, vegetation, and human activities, and there are many driving factors that lead to the occurrence of forest fires as a whole. There is also a mutual influence relationship between these factors. Referring to related studies and following the principles of consistency and science, the study selected a total of 10 driving factors affecting the occurrence of fires in four aspects: average temperature, average precipitation, aridity index, elevation, slope, fractional vegetation cover (FVC), vegetation type, distance from roads, distance from settlements, and population density. Figure 3 shows a schematic diagram of the raster values for each factor.
According to differences in the areas of fire trails in each study year, an equal number of fire-starting points and non-fire-starting points were randomly selected each year to obtain sample point data, with a total of 7600 sample points (Table 2). For each point, the raster values of the corresponding driving factors were extracted using the “Extract Values to Points” tool in ArcGIS10.2 software, obtaining sample point attribute table data containing various raster attribute values. To eliminate the influence of different scales between the factors on the final results, the data for each driving factor of the sample points were standardized before modeling.

3.2. Binary Logistic Regression Model

3.2.1. Multicollinearity Test

Multicollinearity refers to the existence of a certain degree of correlation between the independent variables in a linear regression model, which may lead to the loss of significance of the variable significance test, model prediction results with a larger deviation, low accuracy, and other consequences [39]. The multicollinearity test is applied when there are multiple independent variables in the model and there is a certain degree of correlation between the independent variables. Research primarily uses the variance inflation factor (VIF) diagnostic method for testing [40]. Larger VIF values indicate more serious covariance between the respective variables and generally cannot be greater than five. VIF values greater than 10 represent the existence of a very serious covariance problem between the independent variables.
The multicollinearity test results of all factors involved in the correlation analysis in this study are shown in Table 3. The VIF values of the 10 forest fire driving factors are all less than 5, indicating their participation in the binary logistic regression model building.

3.2.2. Binary Logistic Regression Modeling

Binary logistic regression (BLR) refers to logistic regression where the dependent variable is binary and the dependent variable only has two values, “yes” and “no”. The value of the dependent variable in the model is recorded as only 1 and 0. The independent variables may be continuous or different classifications, and regression analysis is used to obtain the weight coefficients that produce the relationship between the independent variables and the dependent variable [41]. The results of the BLR model analysis primarily include regression coefficients, standard errors, Wald’s statistic, degrees of freedom, the level of significance, and other parameters. The BLR model has been widely used in the analysis of forest fires [41,42,43], and the present paper used the occurrence or non-occurrence of forest fires as the dependent variable, with values of 0 (no forest fires) and 1 (forest fires), and each forest fire driving factor was the independent variable to construct the BLR model with the expression:
h y = 1 = e ( γ 0 + x i γ i ) 1 + e ( γ 0 + x i γ i )
where h(y = 1) is the probability of forest fire occurrence,   γ 0   is a constant term, χ i is the forest fire driving factor, and γ i is the weight of the corresponding forest fire driving factor, which indicates the degree of influence of the independent variable ( χ i ) on the probability of forest fire occurrence [43].

3.2.3. Significance Test of Factors in the Binary Logistic Regression Model

In this study, using the Wald statistic to test the driving factors of the binary logistic regression model, when the p-value corresponding to the Wald statistic of a driving factor is less than a given significance level, it is considered that the driving factor passes the significance test; otherwise, it fails to pass the significance test [44]. The significance level was 0.05 in the present study.

3.3. Boosted Regression Tree Model

The boosted regression tree (BRT) is a scientific algorithm with an autonomous learning function among the categorical regression tree algorithms. It combines the two major advantages of regression trees and boosting algorithms and generates multiple regression trees via random selection and autonomous learning methods, which overcomes the shortcomings of single tree models and greatly improves the explanatory power of the model and the accuracy of the results [45]. Its advantages lie in its ability to handle different types of predictor variables, insensitivity to the covariance problem of the data, no transformation of the data or removal of outliers beforehand, the ability to fit complex nonlinear relationships and interactions, and the output of the marginal effect plot reflecting the degree of contribution of the correlation factors at different threshold intervals and more intuitive fitted function curves [46]. Quantitative data are randomly extracted several times in the operation process, and the value of the degree of influence of the independent variable on the dependent variable is iteratively calculated. The fitting results are compared and tested with the remaining data, and the optimal solution is output [47]. This study used the gbm package in R for boosted regression tree analysis. The parameter combination for the boosted regression tree model in R was set to 0.0001 for the learning rate and 10 for the tree complexity. The optimal fit was achieved through 10,000 iterations and 5-fold cross-validation.

3.4. Model Evaluation

In this study, the receiver operating characteristic (ROC) curve was used to verify the binary logistic regression model and a boosted regression tree model. The ROC curve, also known as the receptivity curve, is plotted with the true-positive rate as the vertical coordinate and the false-positive rate as the horizontal coordinate. The value of the area under the curve (AUC) ranges from 0.5 to 1.0. Larger area values indicate higher model accuracy, a better fit of the regression results, and a stronger explanatory effect of the independent variables on the dependent variable. Smaller area values mean that the regression results of the dependent variable cannot be reasonably explained, and there is no practical significance [43].

4. Results and Analyses

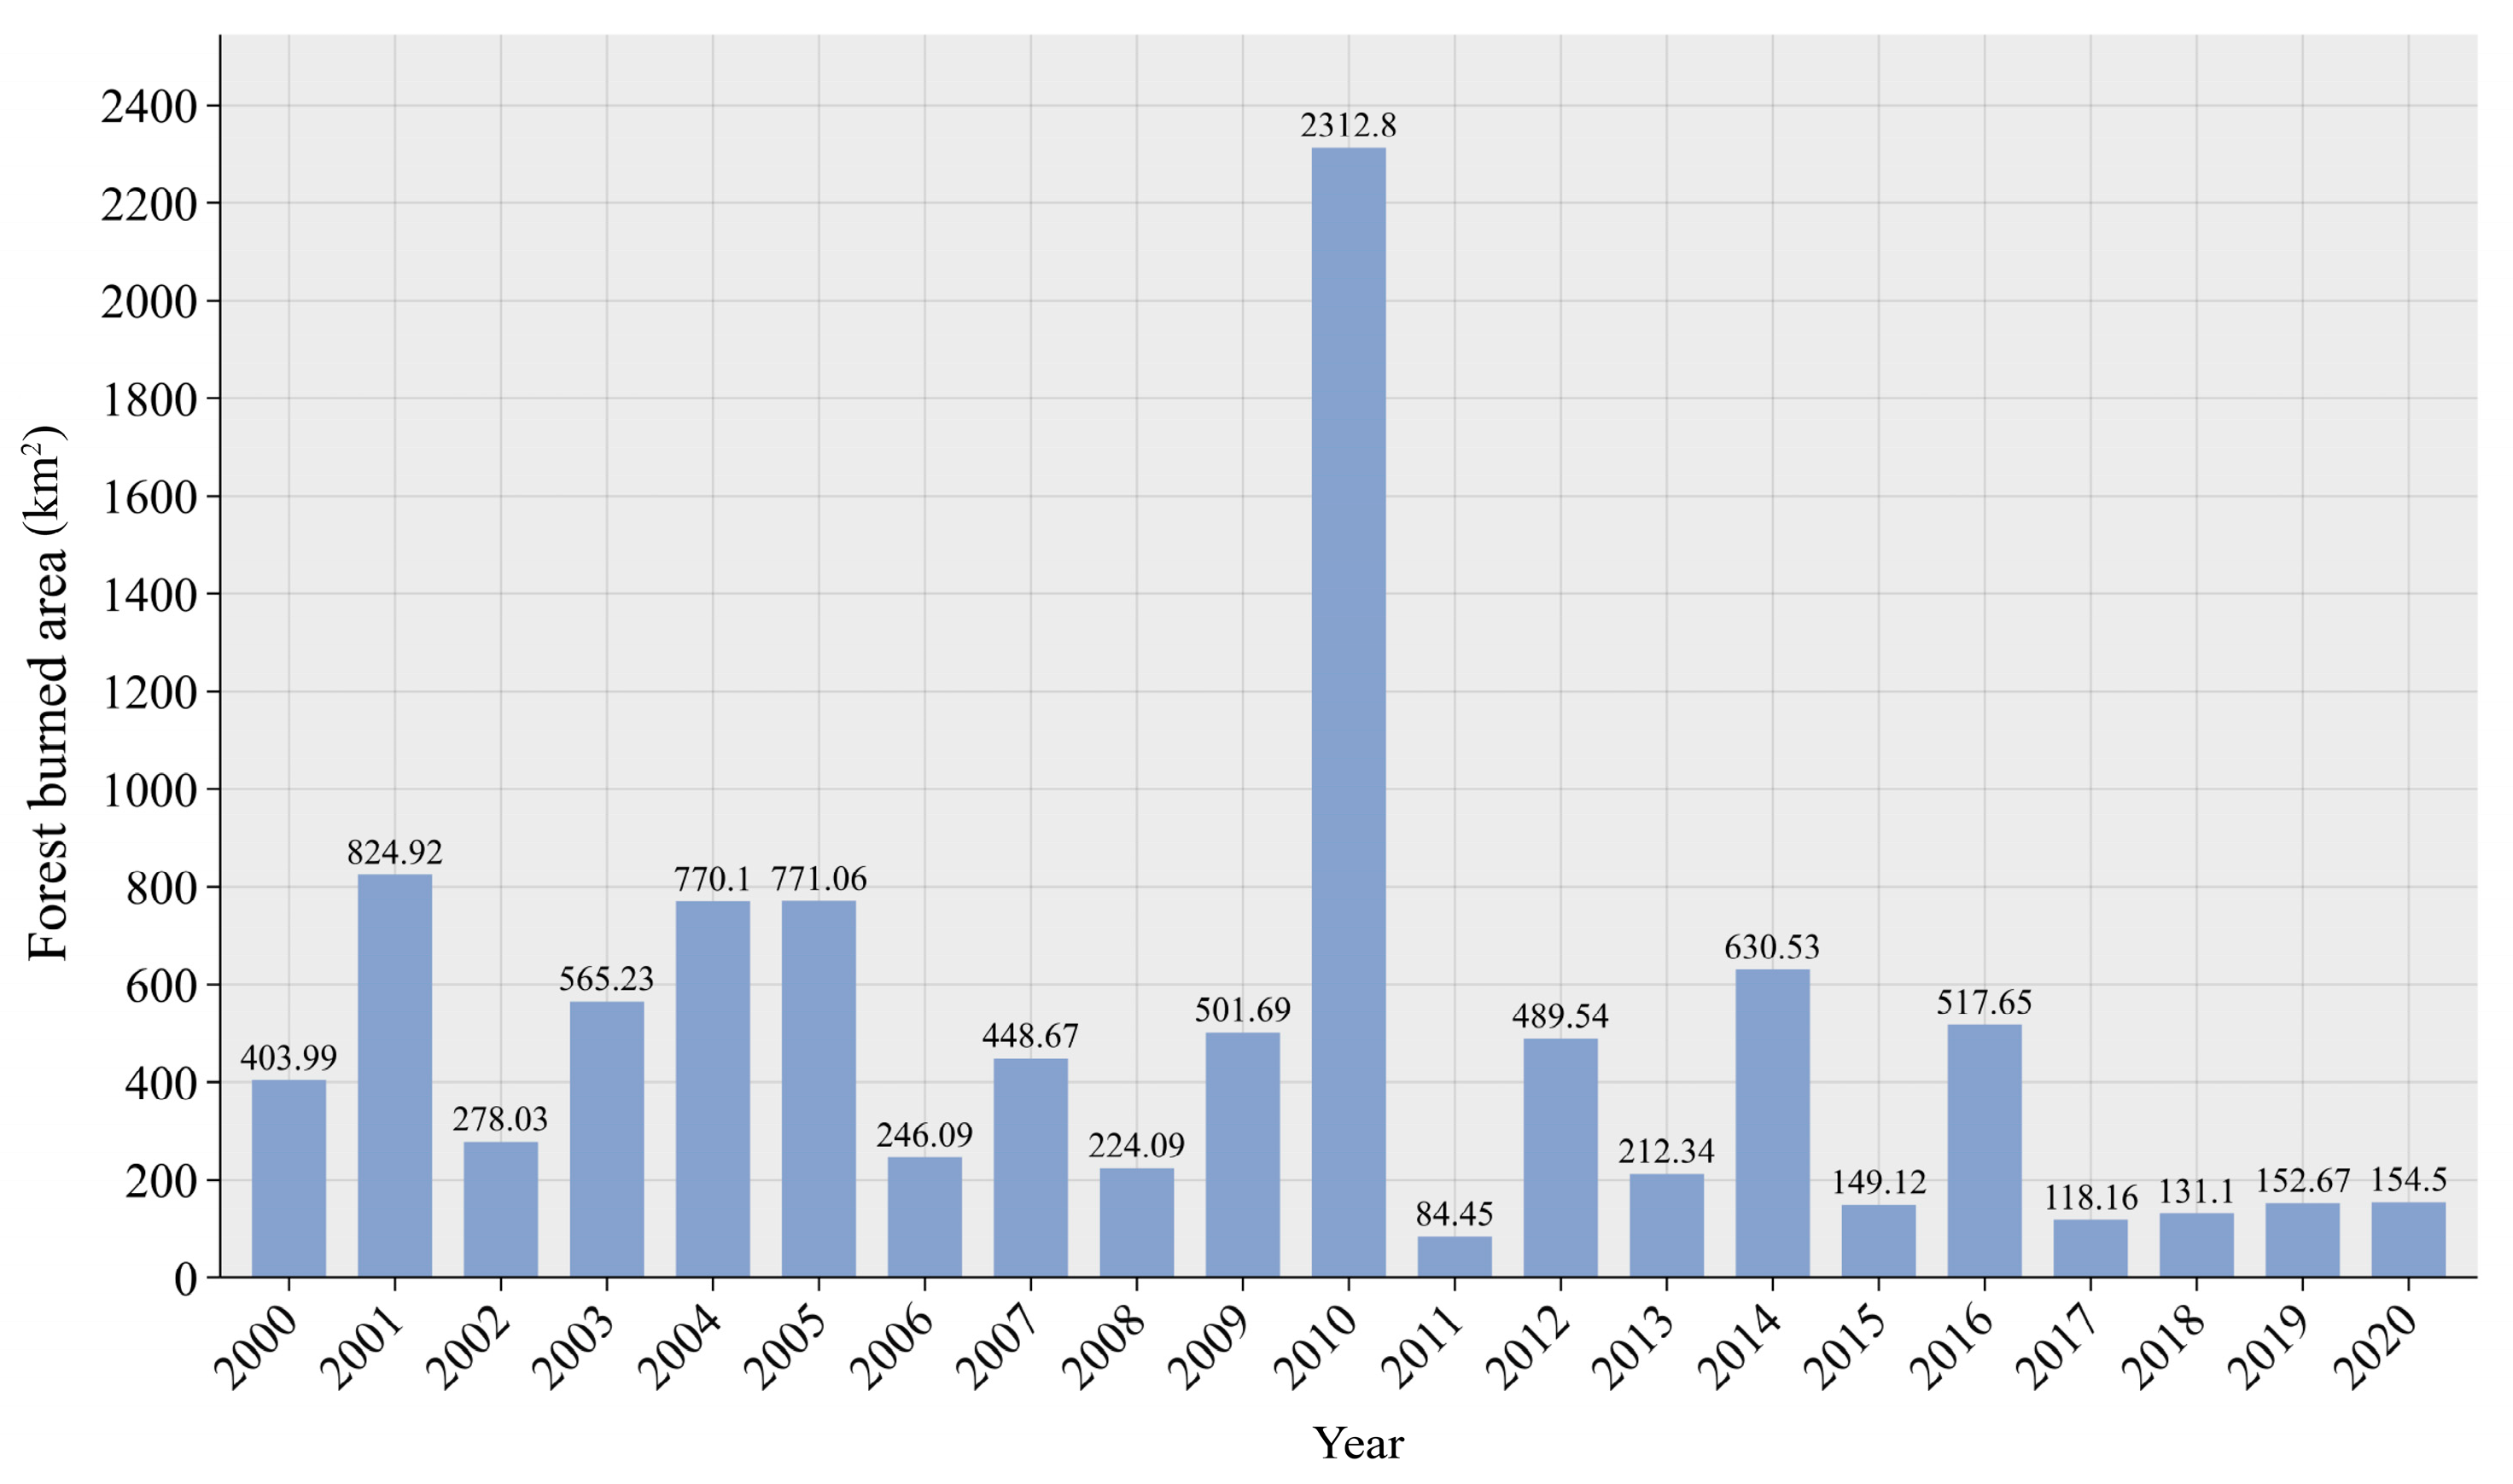
4.1. Temporal Change in Forest Fire Burnt Land

By analyzing the forest burned area data in the study area, the total area of forest fire scars in the study area from 2000 to 2020 was obtained (Figure 4). The results show that the total area of forest fire scars in the study area from 2000 to 2020 was 9986.73 km2, with an average annual area of 475.56 km2. The maximum and minimum values occurred in 2010 (2312.8 km2) and 2011 (84.45 km2), respectively. The interannual variation of forest fire scar area can be divided into two stages: (1) an increasing stage from 2000 to 2010, during which forest fires in the study area were relatively frequent, and the total forest fire scar area was 7346.67 km2, with the peak occurring in 2010, accounting for approximately 31% of the total forest fire scar area in this stage. (2) a decreasing stage from 2011 to 2020, with a total forest fire scar area of 2640.06 km2. Compared to the previous stage, the forest fire scar area during this period significantly decreased, with a reduction of 64%. In terms of interannual variation, except for 2010, the forest fire scar area showed a fluctuating, declining trend overall, with 2010 being an important turning point in the annual variation of the forest fire scar area.

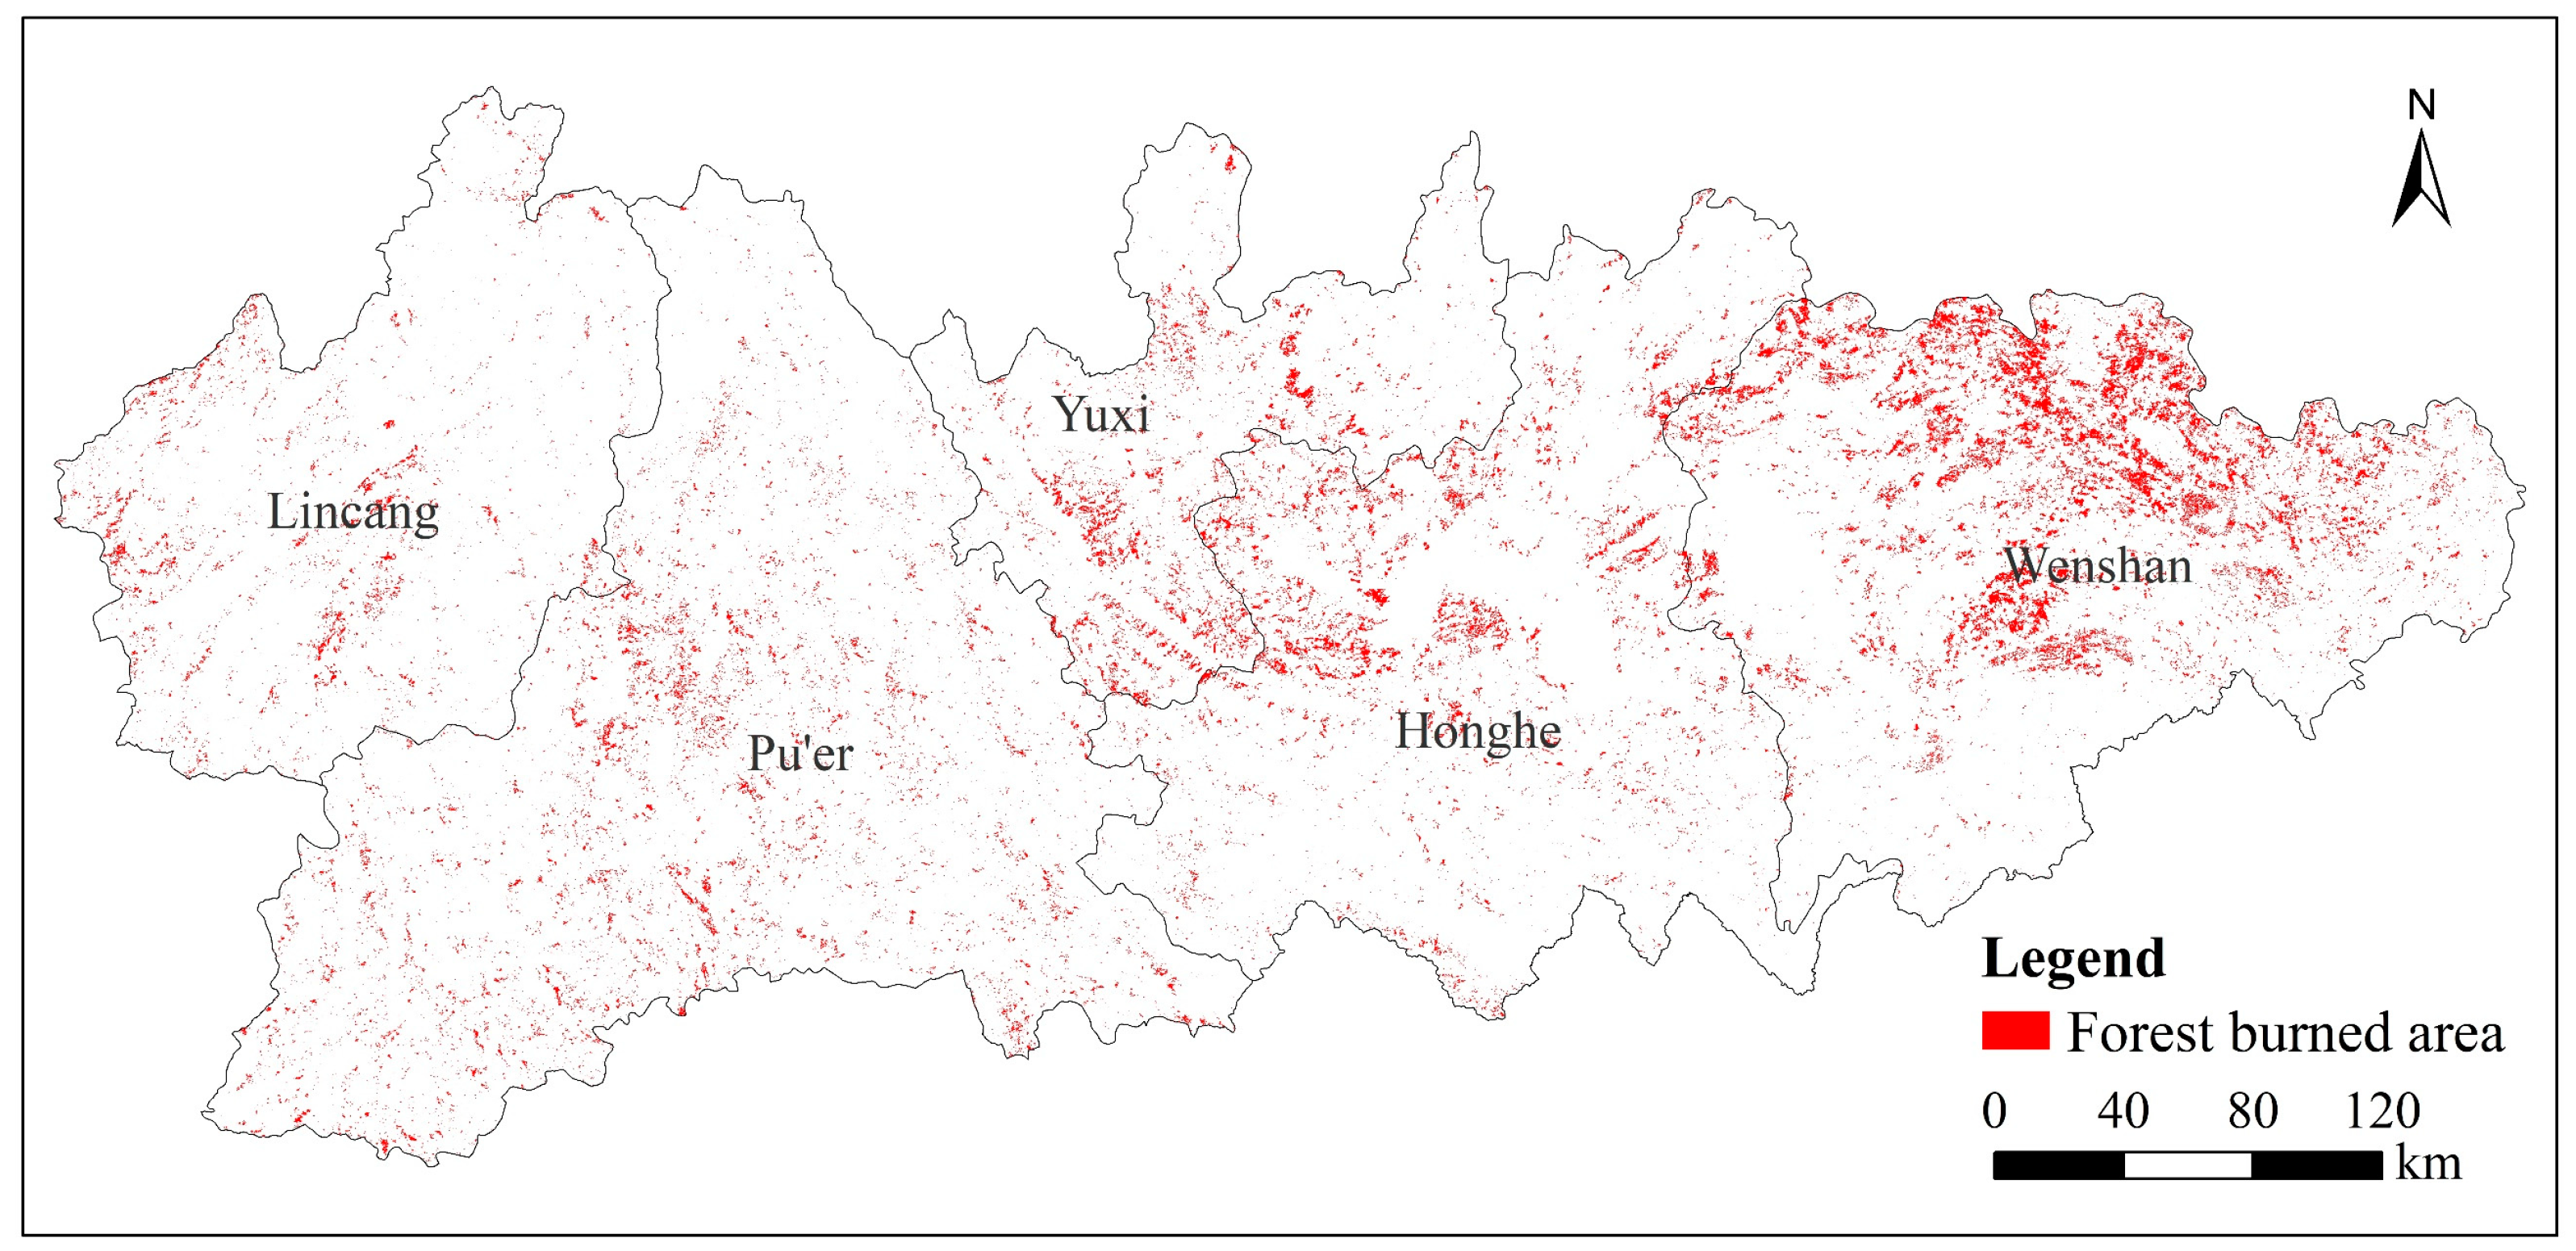
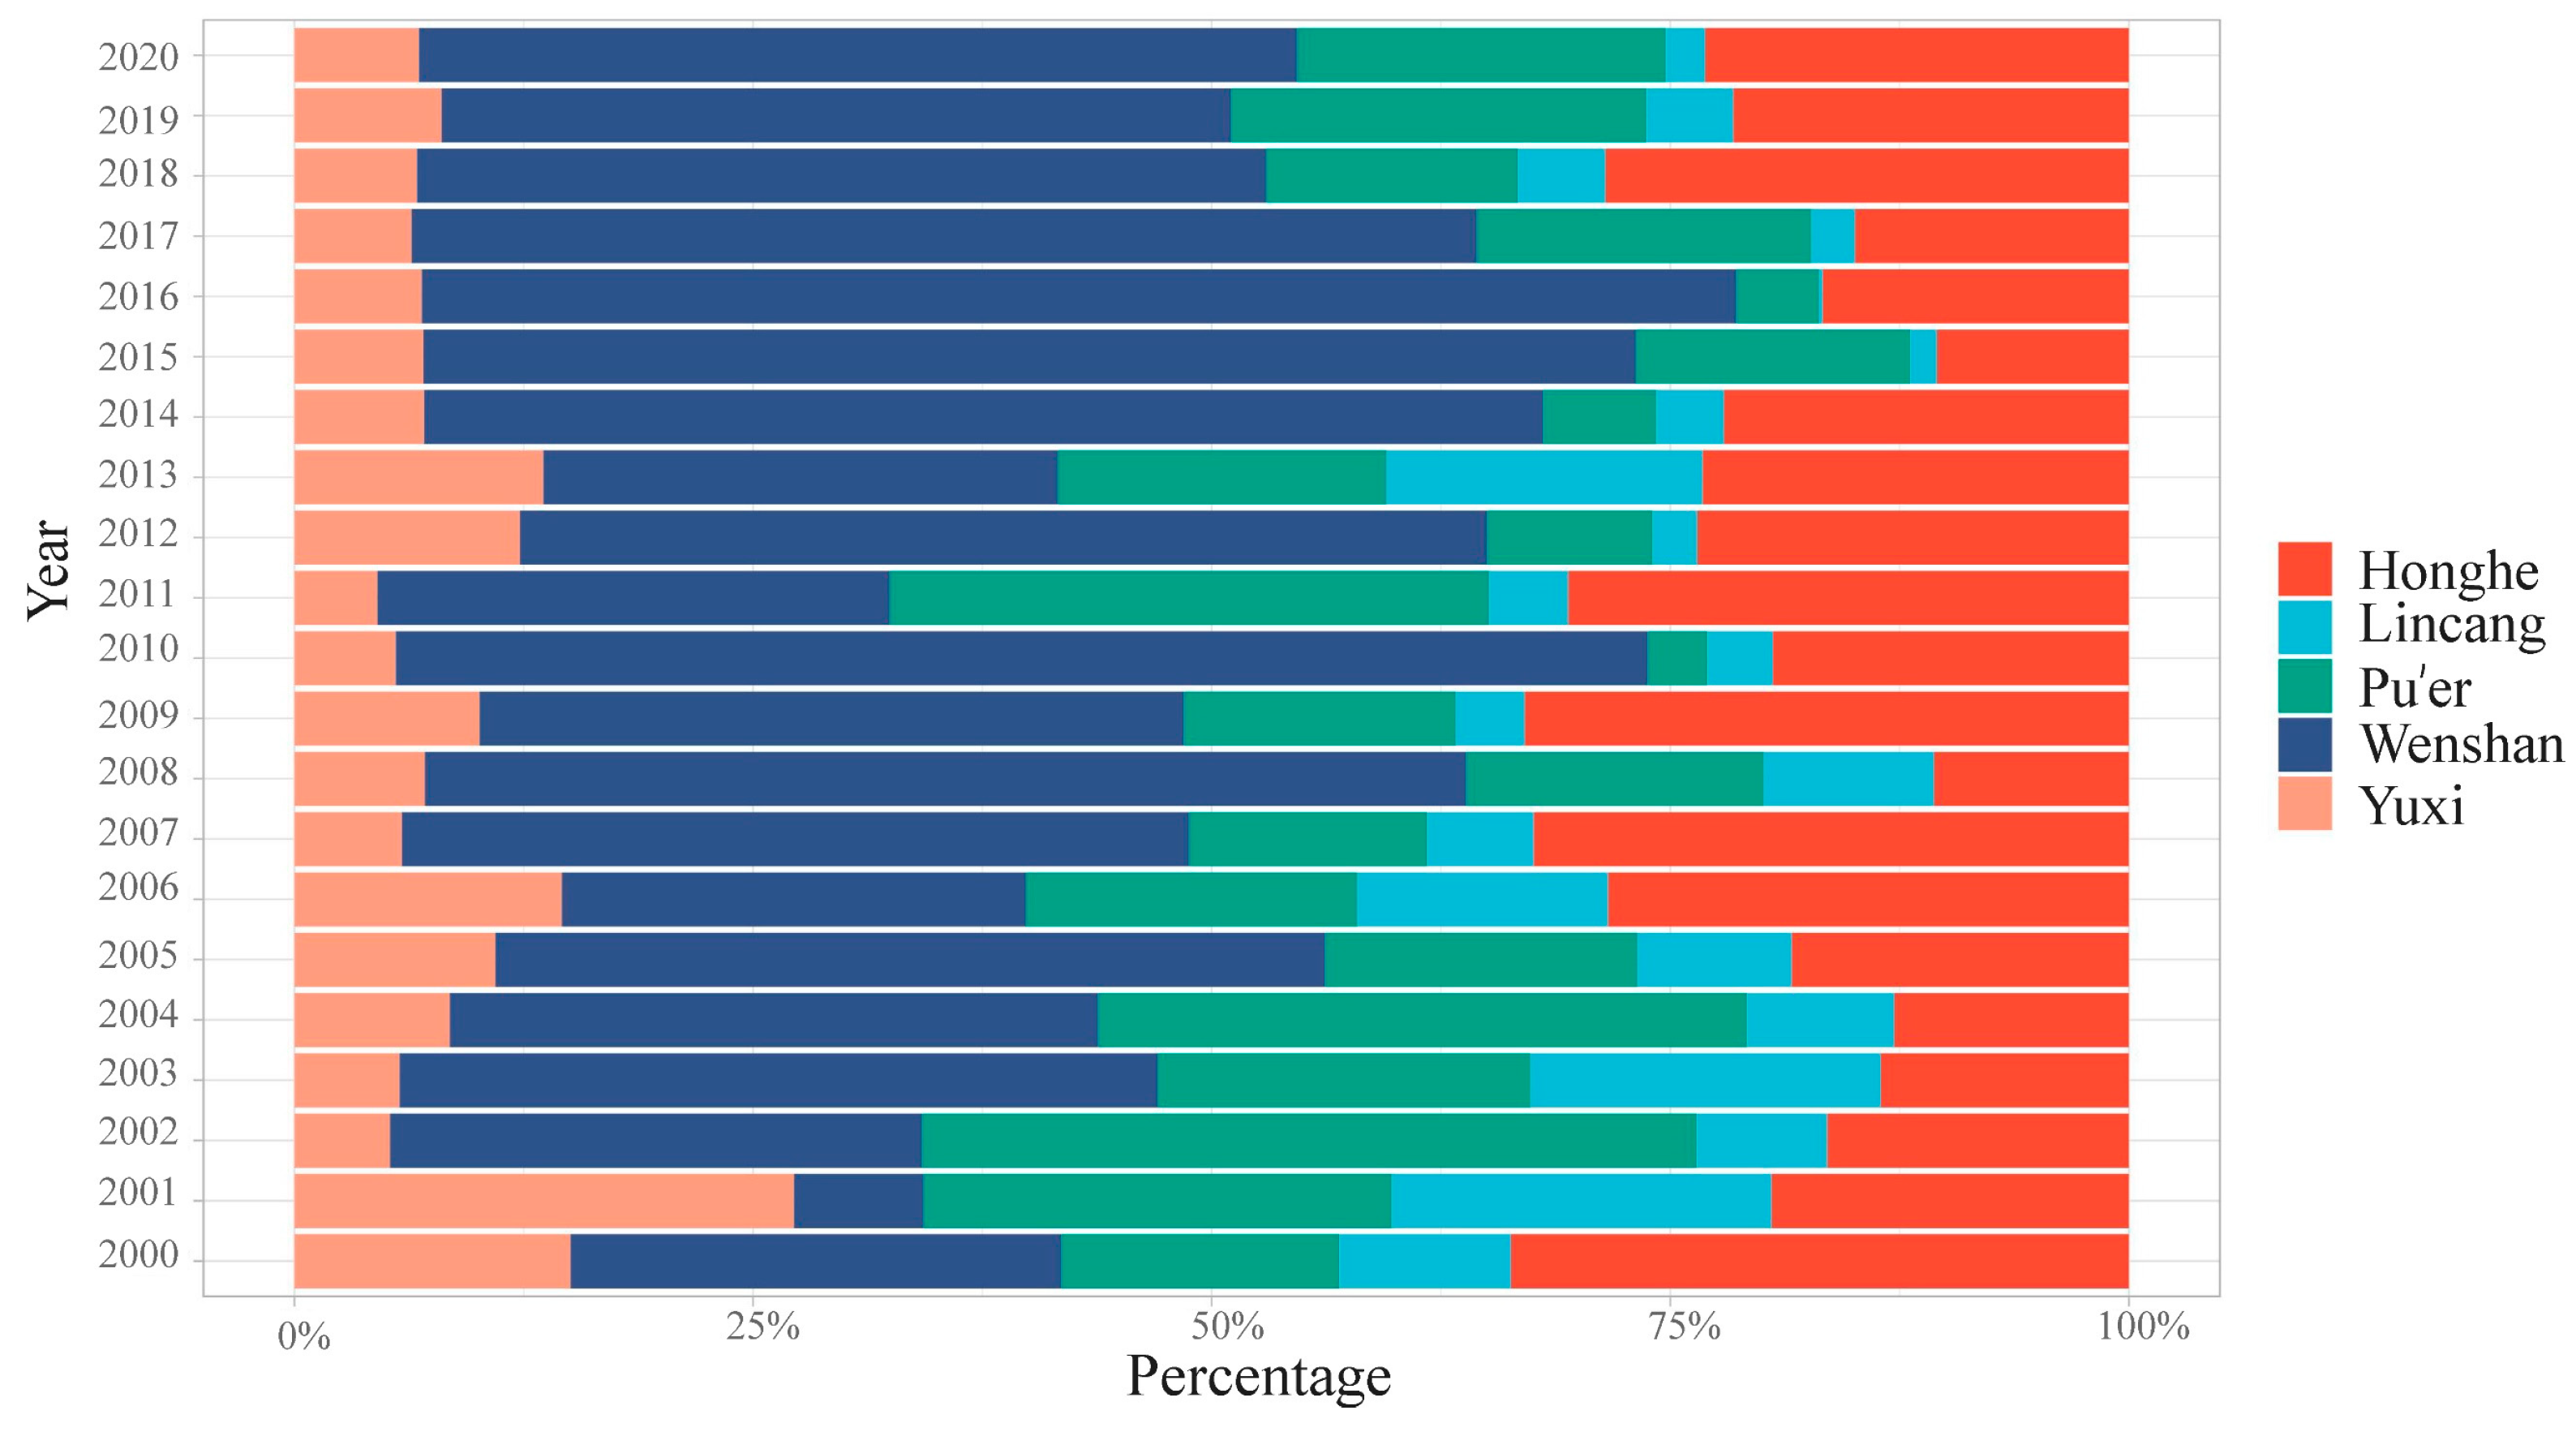
4.2. Spatial Distribution of Forest Fire

Stacking the forest burned area data from 2000 to 2020, the distribution map of forest fire scars in the study area is obtained (Figure 5), and the proportion of forest fire scar areas in different prefectures (cities) within the study area for each year is statistically analyzed (Figure 6). It can be seen that the spatial distribution of forest fire scars in the study area from 2000 to 2020 fluctuates greatly. The area with the most frequent forest fires is Wenshan Prefecture, with an accumulated forest fire scar area of 4718.17 km2, accounting for 47% of the total forest fire scar area in 21 years. Lincang City has the smallest accumulated forest fire scar area, with a total forest fire scar area of 742.83 km2, accounting for only 7% of the total forest fire scar area in 21 years. From a spatial scale perspective, the forest fire scars in the study area from 2000 to 2020 tend to be clustered spatially and roughly exhibit a spatial distribution pattern of “more in the east and less in the west”.

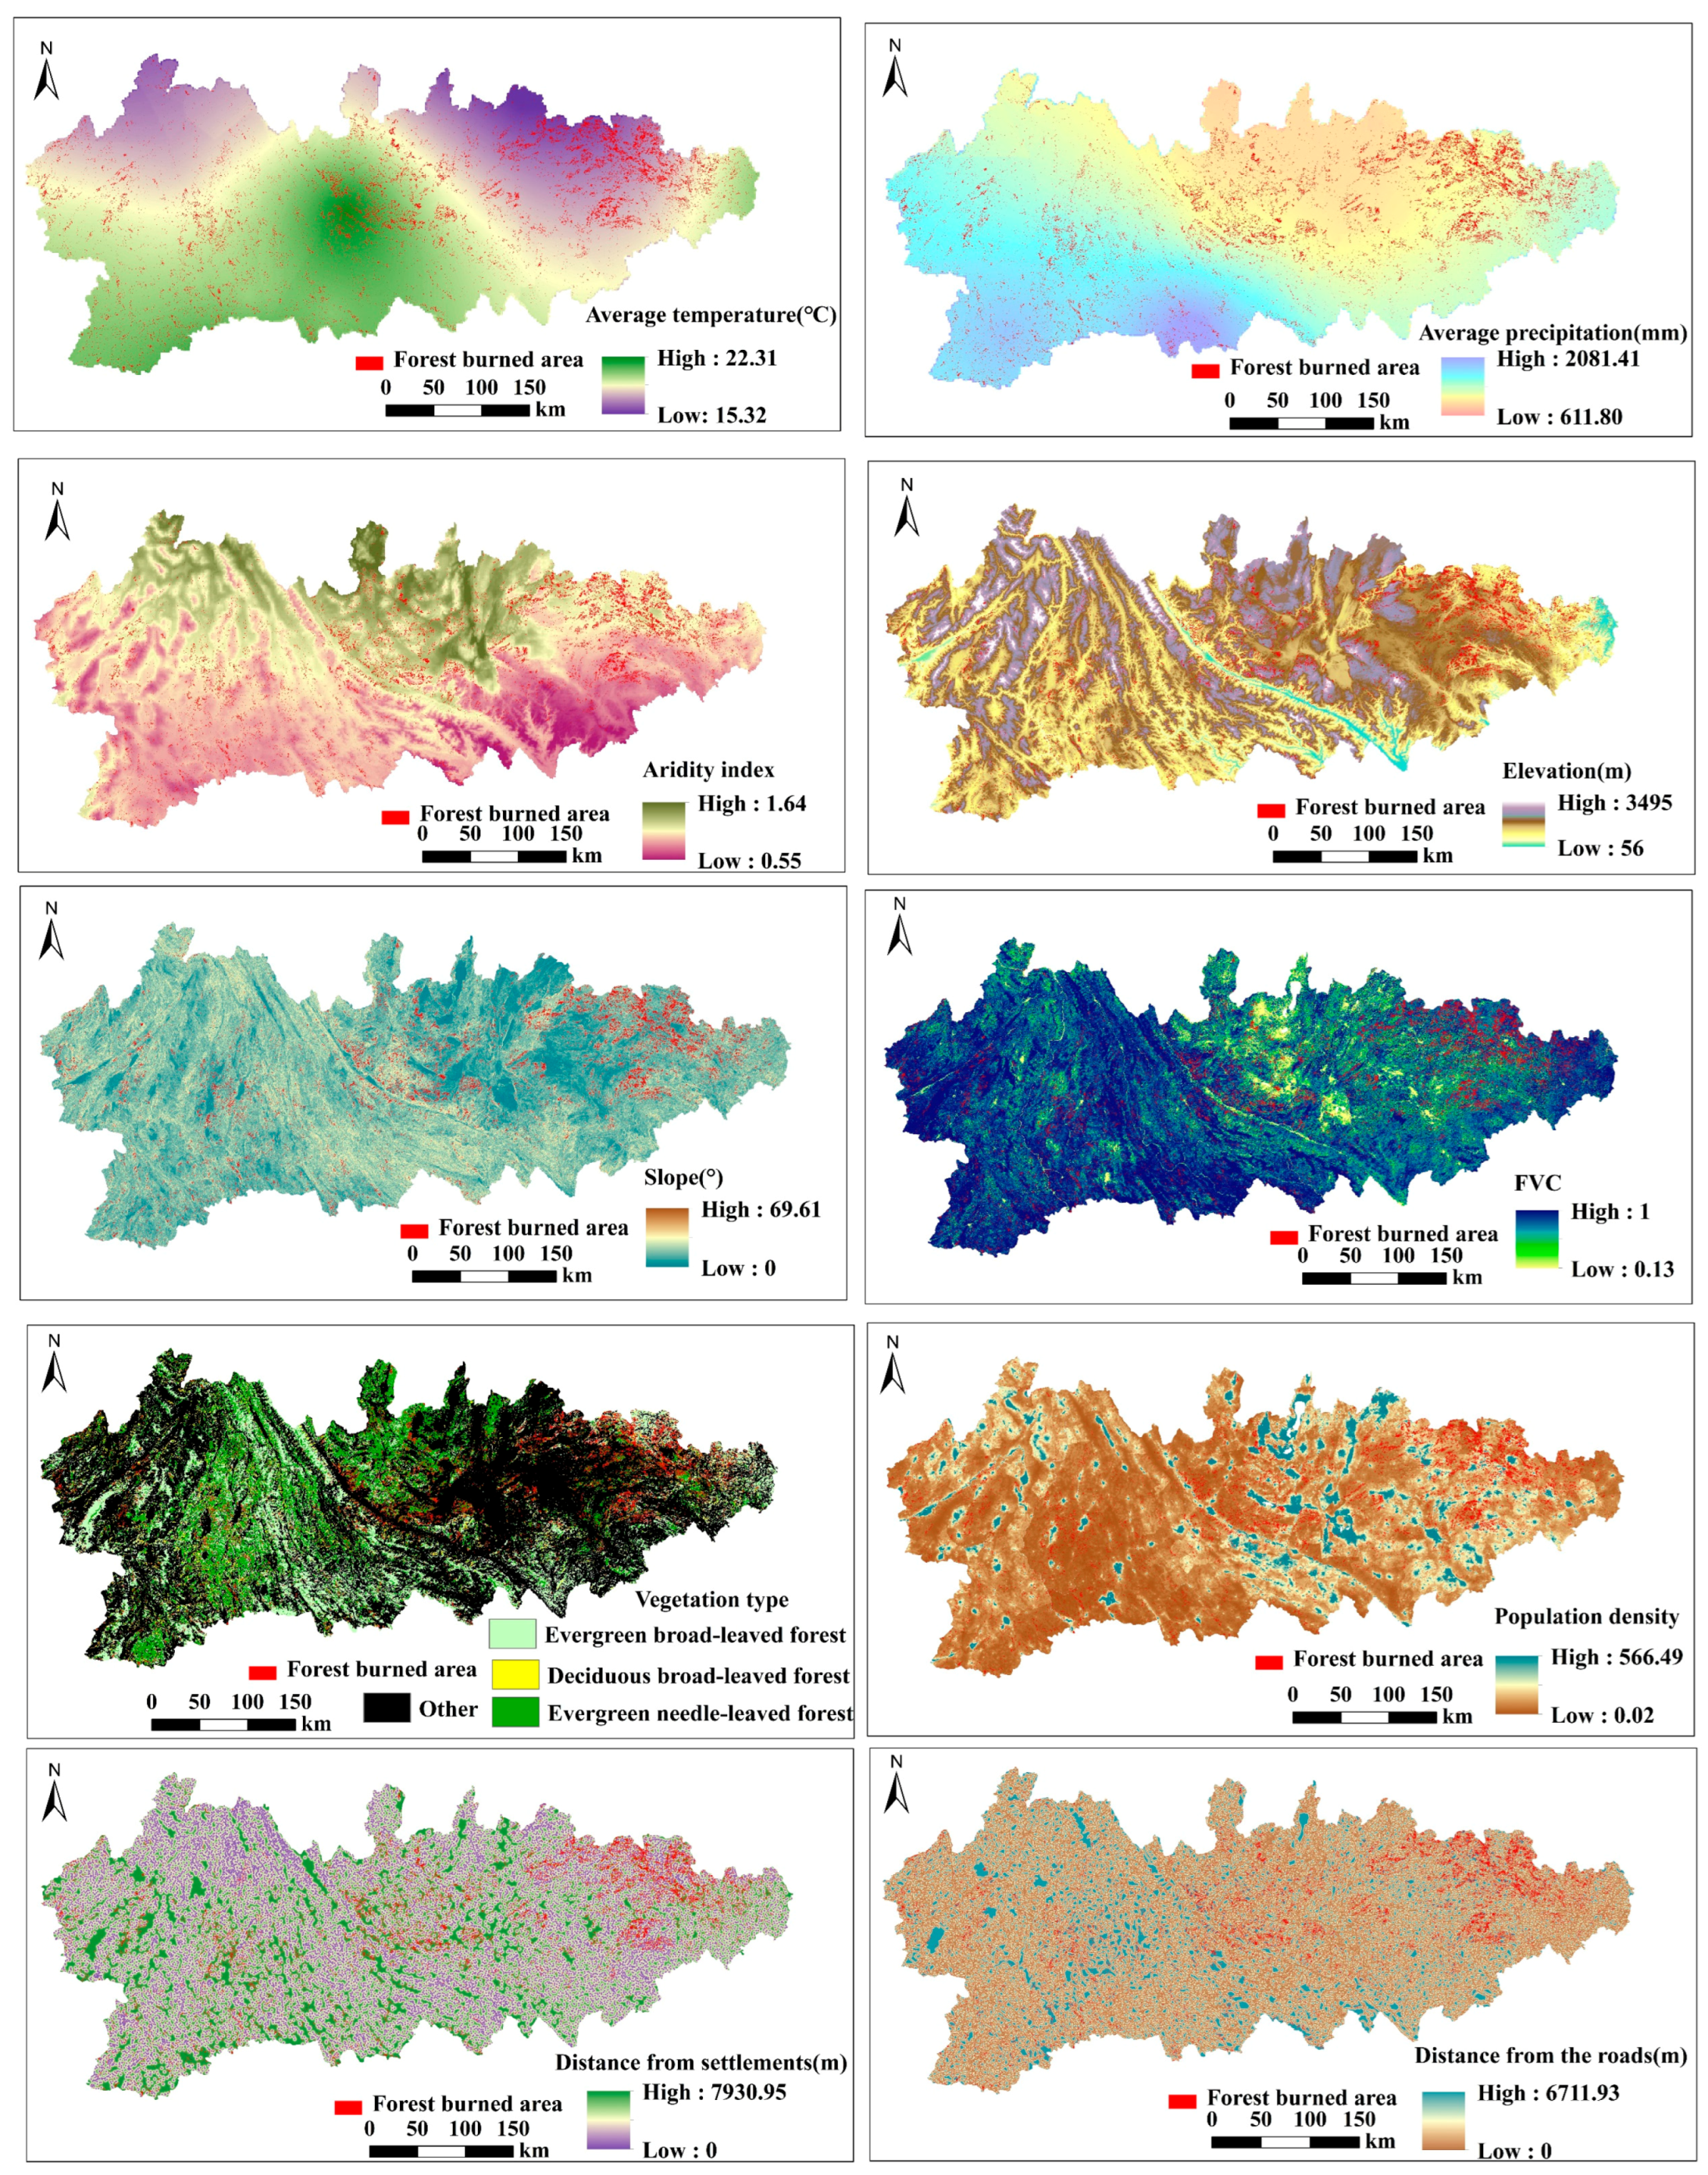
4.3. Analysis of Forest Fire Driving Factors

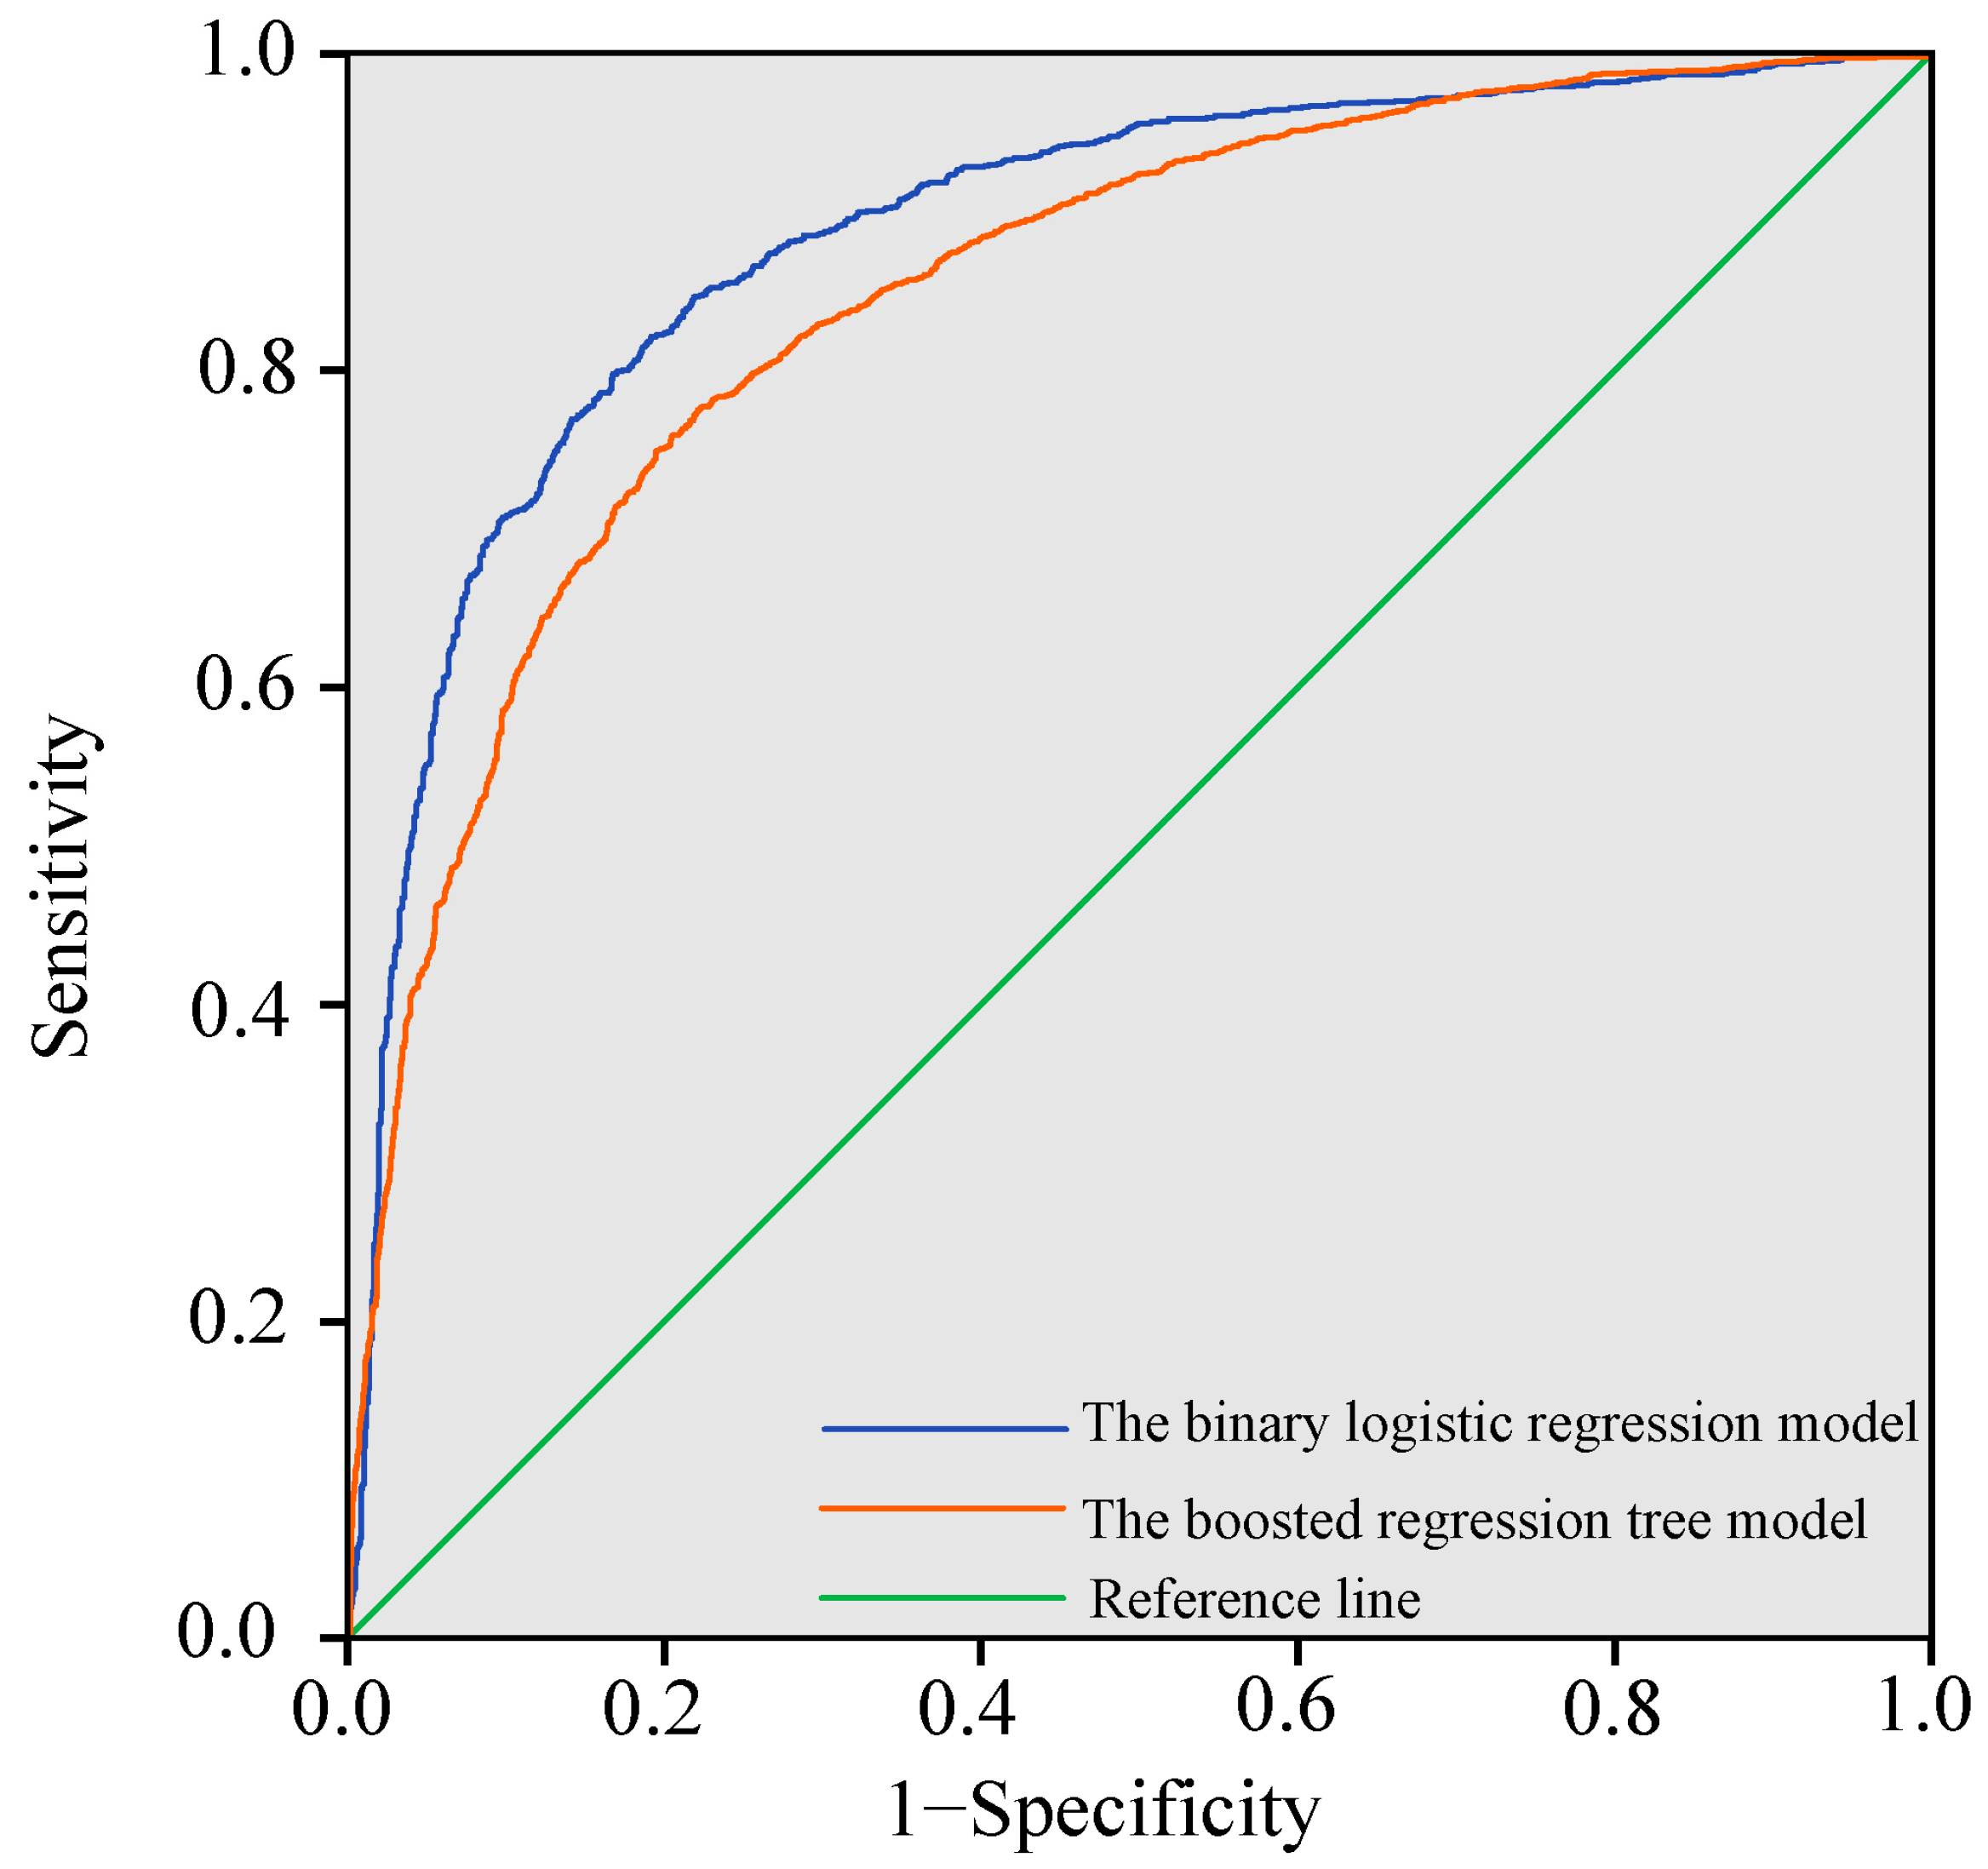
4.3.1. Results of Model Evaluation

The ROC curve analysis is simple and intuitive, and it is a typical method to evaluate model performance based on the value of the AUC. This study utilizes SPSS21.0 software developed by International Business Machines Corporation (IBM, Armonk, NY, USA), which has statistical analysis capabilities, for ROC curve analysis. Using the predicted values of the binary logistic regression model and the boosted regression tree model as independent variables, and the corresponding forest occurrence status as the dependent variable, ROC curve analysis was conducted in SPSS21.0 software to obtain the corresponding results (Table 4) and ROC curves (Figure 7). The AUC values of the binary logistic regression model and the boosted regression tree model were 0.885 and 0.852, respectively, both greater than 0.7, indicating that the two analysis models have reasonable fitting effects, meet the accuracy requirements, and can be used for the analysis of forest fire driving factors.

4.3.2. Mechanistic Analysis of Forest Fire Drivers

Binary Logistic Regression Results and Analysis

Binary logistic regression analysis was performed on the independent variable factors in the study area, and the analysis results of the regression model were obtained (Table 5). The table shows that the significance of the factors of elevation, aridity index, average precipitation, average temperature, FVC, vegetation type, distance from settlements, and population density was less than 0.05, which passes the Wald test. The significance of the variables of slope and distance from the roads was greater than 0.05, which means that their influence on the occurrence or non-occurrence of forest fires was not significant.
As shown in Table 5, the contributions of the driving factors (Wald statistic) in descending order are average precipitation, average temperature, vegetation type, aridity index, distance from settlements, FVC, elevation, and population density. Whether forest fires occur is a result of the coupling of climate, topography, vegetation, human activities, and other factors, and precipitation had the greatest influence. The average precipitation, distance from the settlements, and population density whether forest fires occur were negatively correlated, and elevation, aridity index, average temperature, FVC, and vegetation type whether forest fires occur were positively correlated.

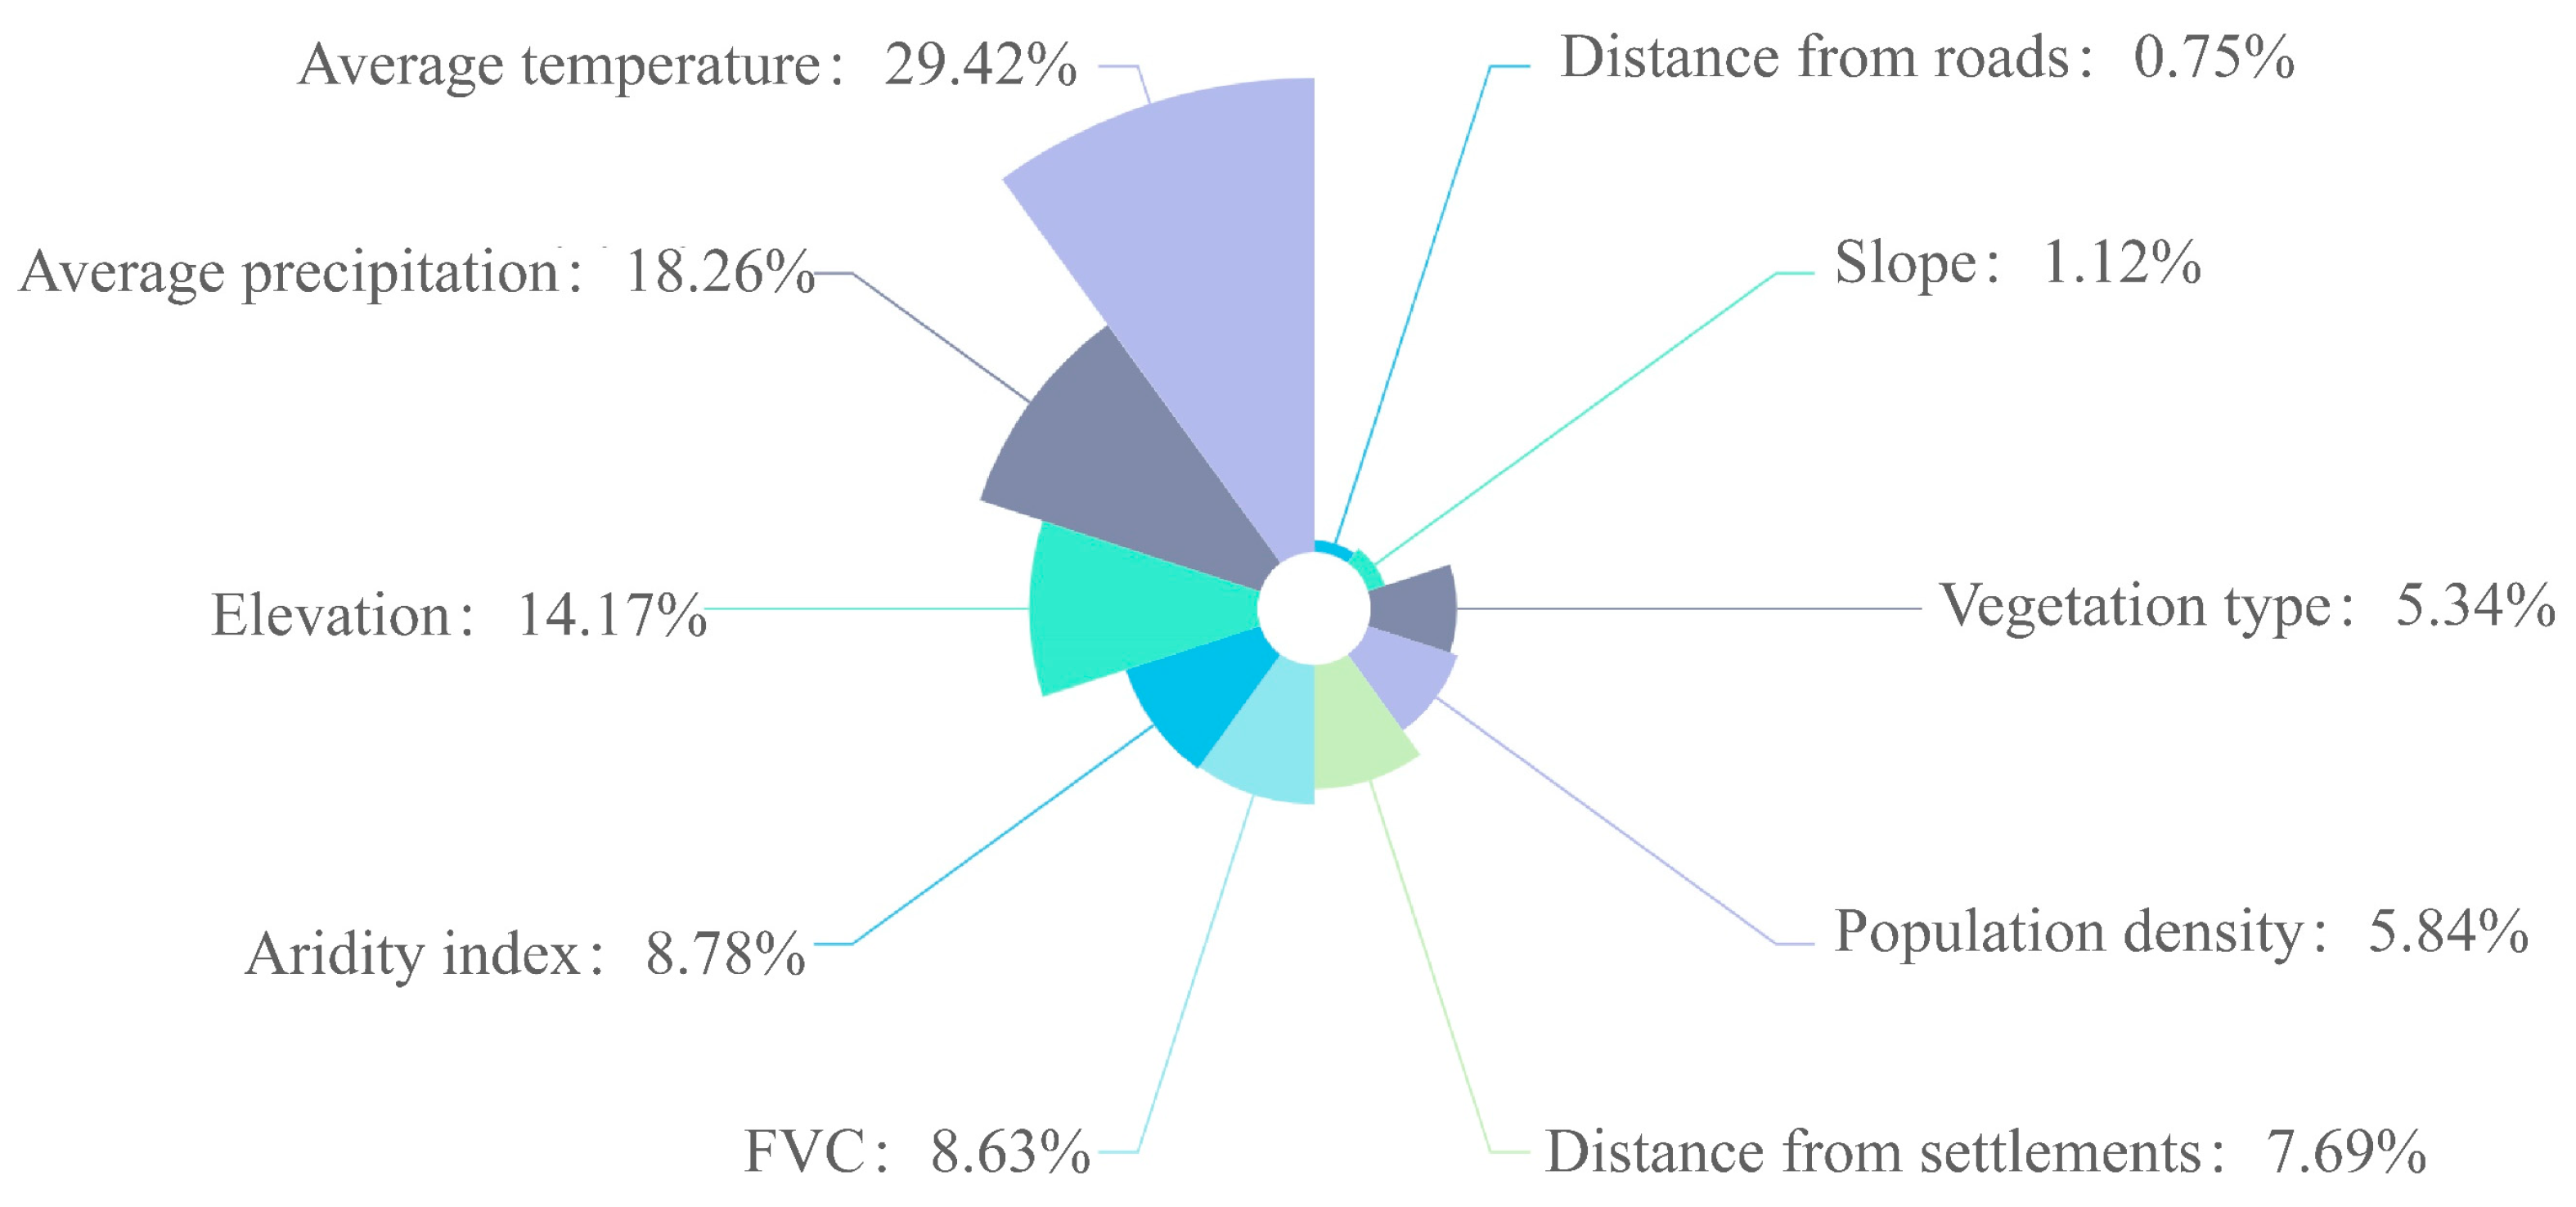
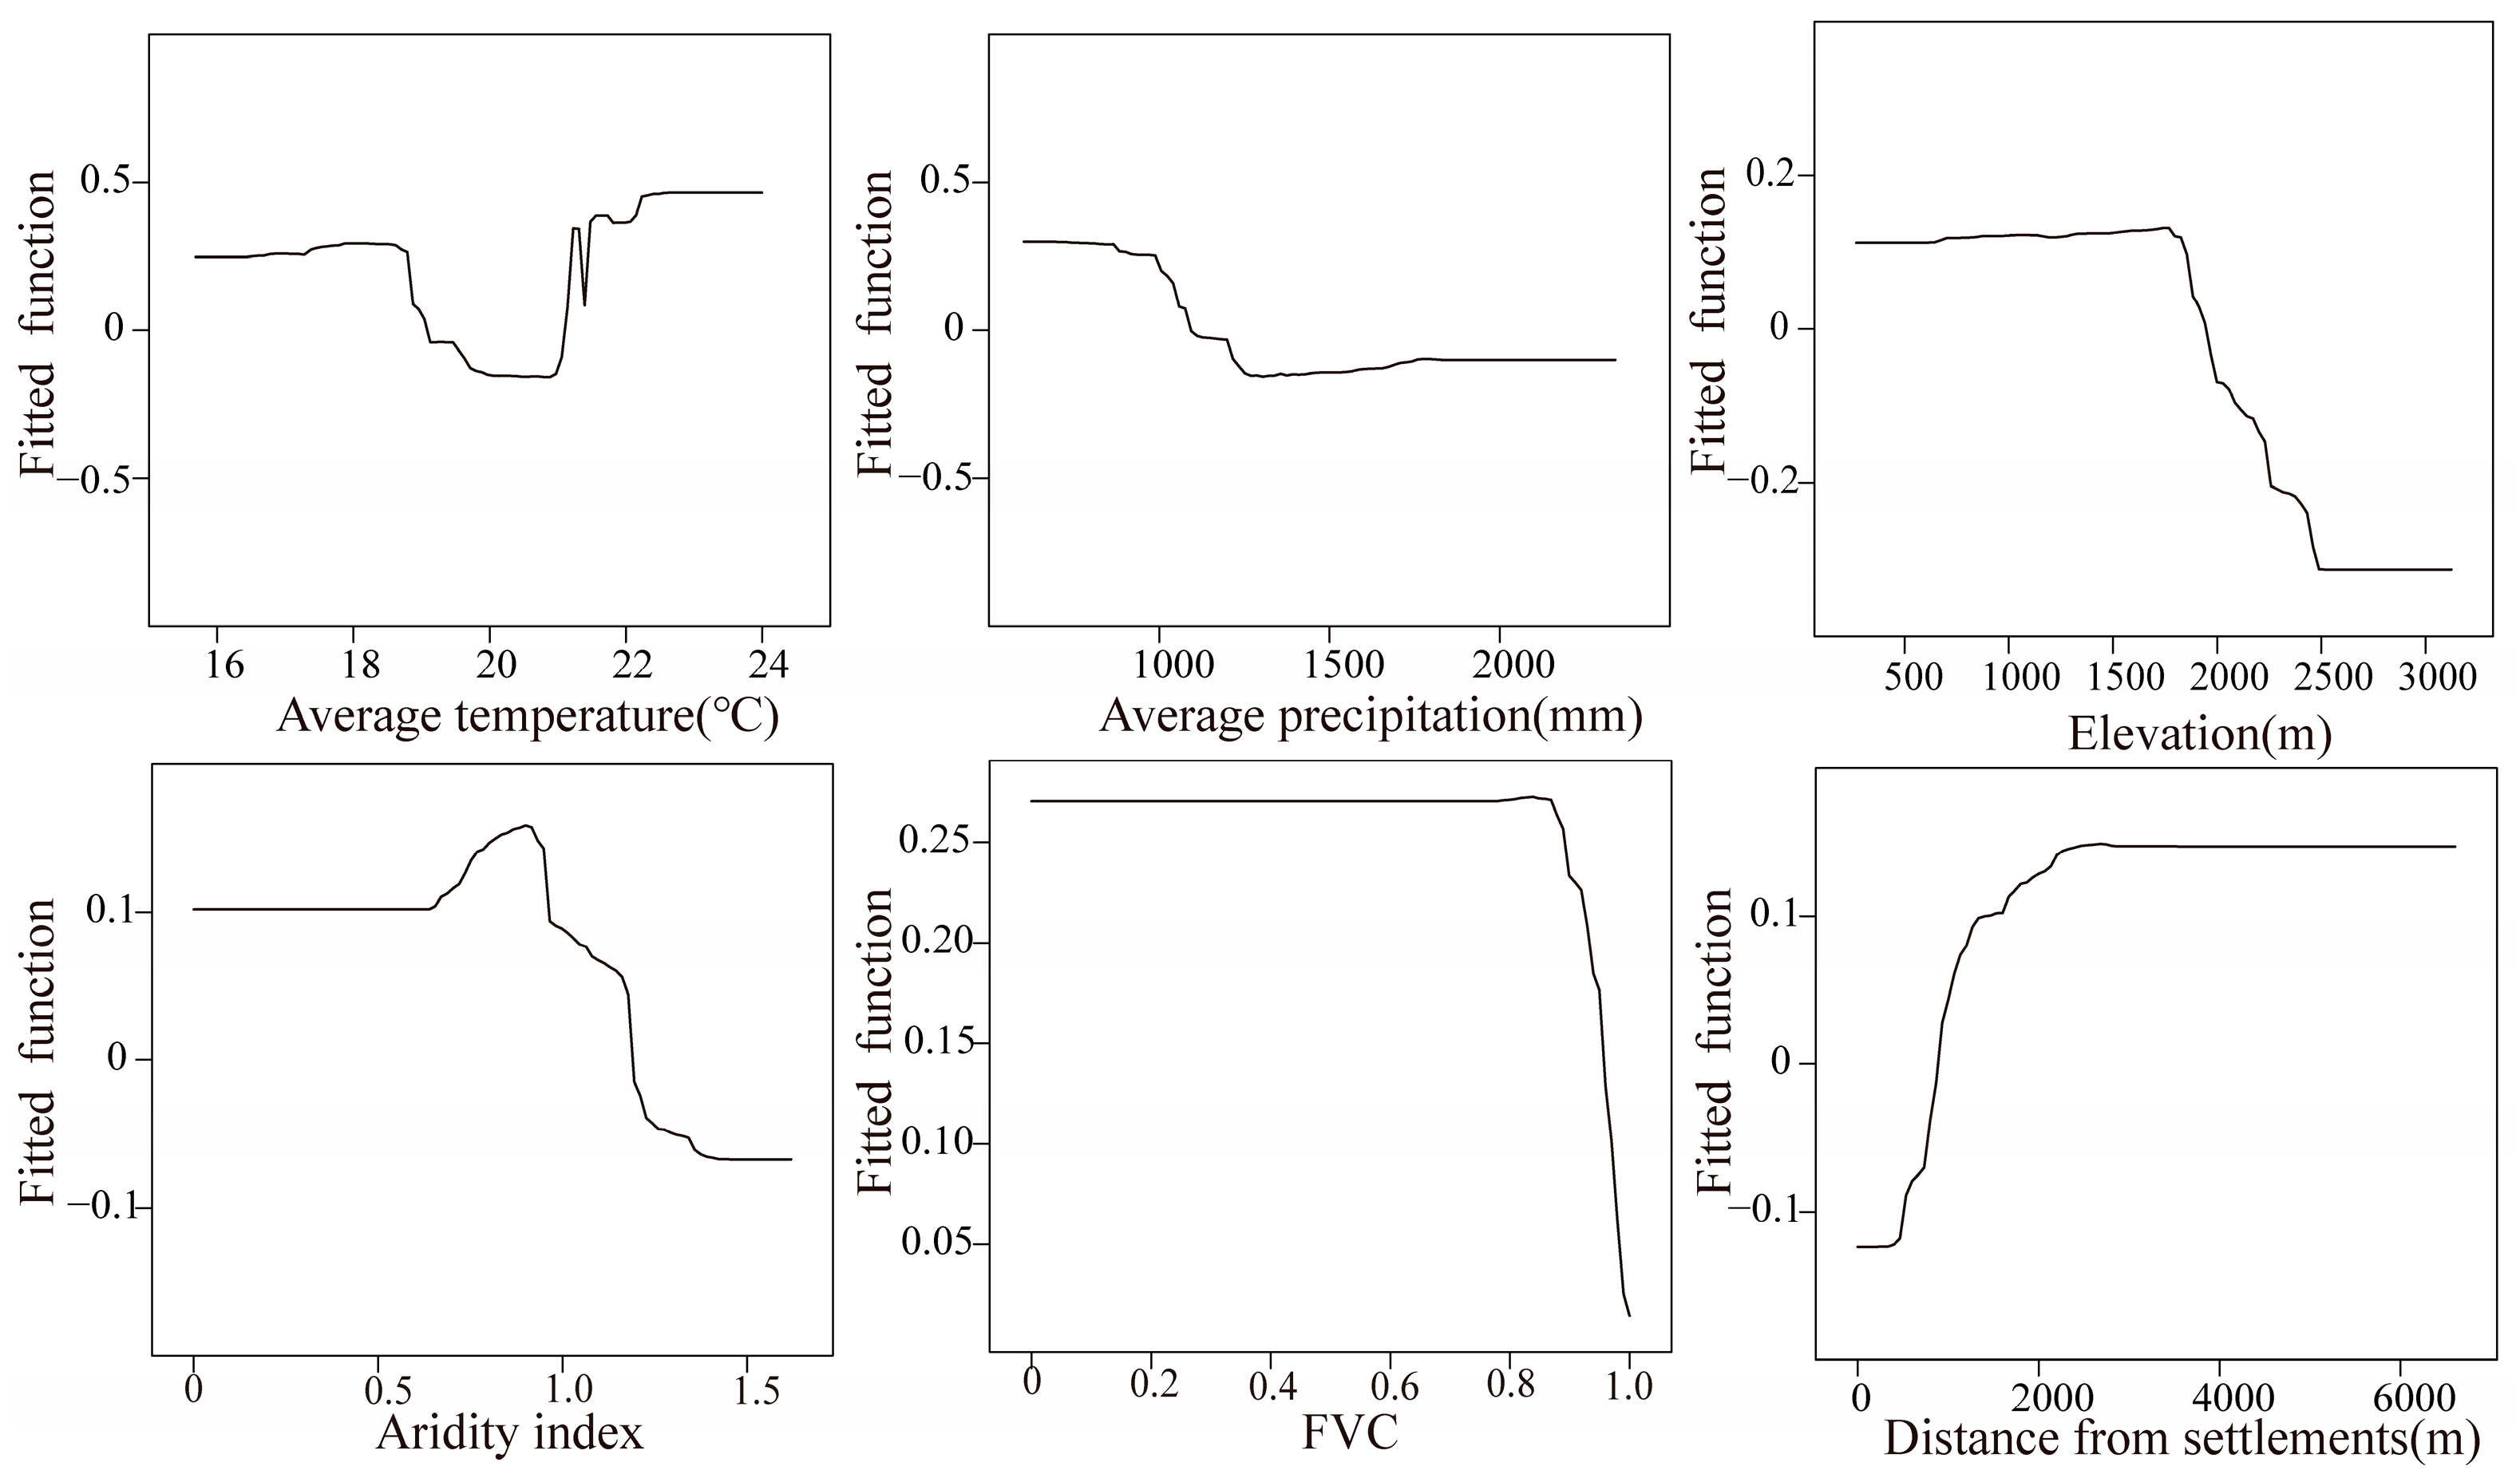
Boosted Regression Tree Model Results and Analysis

The results of the relative importance of the factors analyzed in the boosted regression tree model are shown in Figure 8. The contribution rates of the factors—average temperature, average precipitation, elevation, aridity index, FVC, distance from settlements, population density, vegetation type, slope, and distance from roads—among the 10 driving factors of forest fires decreased as follows: 29.42%, 18.26%, 14.17%, 8.78%, 8.63%, 7.69%, 5.84%, 5.34%, 1.12%, and 0.75%, respectively. The total contribution of the three leading driving factors, average temperature, average precipitation, and elevation, reached 61.85%, which indicated that moisture conditions and elevation largely determined the occurrence and spatial distribution pattern of forest fires in the study area.
Figure 9 shows the marginal effect of the top six factors in terms of the factor contribution rate, which indicated that the influence of the driving factors on the occurrence of forest fires changed with the increase in the value of the driving factors. A marginal effect value greater than 0 indicated that the influence factor was positively related to the occurrence of forest fires; less than 0 indicated a negative correlation; and 0 indicated no correlation between the two factors.
As the average annual temperature increases, the overall correlation between temperature and forest fire occurrence shows a positive correlation. When the temperature is around 20 °C, the correlation between the annual average temperature and forest fire occurrence in the study area shows a trend of fluctuation in the low-value area between positive and negative correlations. After the temperature exceeds 21 °C, the correlation between temperature and forest fire occurrence gradually increases. After increasing to 22.5 °C, the correlation between temperature and forest fire occurrence remains basically unchanged.
When the average annual precipitation in the study area was lower than 1000 mm, the correlation between the effect of precipitation on forest fires was large and positive. With the increase in precipitation, the effect of precipitation factors on the occurrence of forest fires becomes negatively correlated, and the influence decreases. After the increase in precipitation to 1700 mm, the correlation between the effect of precipitation factors on the occurrence of forest fires basically remained unchanged.
As the value of elevation increased, the correlation between the effect of elevation on the occurrence of forest fires was generally positive to negative. When the elevation value was below 1700 m, the correlation of the influence of elevation on the occurrence of forest fires was positive. After 2000 m, the correlation changed from positive to negative. After the elevation value increased to 2500 m, the relationship between elevation and forest fire occurrence basically remained unchanged.
When the aridity index in the study area is less than 1.2, the correlation between the aridity index and the occurrence of forest fires is positive. When the aridity index is greater than 1.2, the correlation between the aridity index and the occurrence of forest fires changes to negative.
In the study area, the overall correlation between FVC and the occurrence of forest fires is positive. When FVC in the study area is higher than 0.8, the correlation between FVC and the occurrence of forest fires decreases rapidly.
As the distance to settlements increases, the correlation between the distance to settlements and the occurrence of forest fires changes from negative to positive. After the distance to settlements reached 3000 m, the correlation basically remained unchanged.

5. Discussion

5.1. Spatial and Temporal Patterns of Forest Fires

In terms of time, 2010 was the node of change in the area of forest fires in the study area (Figure 4). Before 2010, the area of forest overfires increased significantly from year to year, and 2010 had the highest incidence of forest fires. The occurrence of these forest fires was the result of a combination of factors. Under the influence of a monsoon climate and global warming, Yunnan province-wide precipitation was low after 2000 [48], and 2010 was an El Niño year. The precipitation in October 2009–February 2010 was 60%–75% less than the same period of a normal year, and the temperatures were much higher than normal [49]. Yunnan Province experienced an unprecedented persistent extreme drought. This result suggests that the arid climate caused by the continuous increase in temperature is the main reason for the frequent occurrence of forest fires in the study area, which is consistent with the results of Zhang Wenwen’s related study [15].
Forest fires in the study area showed a spatial pattern of more in the east and less in the west, which has some correlation with the spatial differences in topography in the area. The topography of the study area varies greatly [50], with obvious spatial variations in slope and elevation, including high mountains and deep valleys on the western side of the Ailao Mountains, while the eastern part of the Ailao Mountains is gentler. The topography of the study area also directly affects the sensitivity of the climate factors in the study area, which affect the probability of forest fires. Chen and Xu Yanyan et al. [51,52] noted that the mountain ranges in the study area played a more significant role in guiding and blocking the cold air at the lower level, and the “corridor” effect of the Ailao Mountains and the elevation gradient changes significantly altered the evapotranspiration on both sides of the mountain ranges. The “corridor” effect and the elevation gradient change make the evapotranspiration on both sides of the mountain range different, which leads to a wetter climate on the western side of the Mourning Mountains and a drier climate on the eastern side of the Mourning Mountains. In summary, regional differences in topography lead to differences in the spatial distribution of forest fires in the study area.

5.2. Fire Driving Force Analysis

Natural factors play a dominant role in influencing the occurrence of forest fires. The analysis results of the binary logistic regression model and the boosted regression tree model for forest fire drivers both show that temperature and precipitation are the most important factors influencing fire occurrence. The overall correlations between these factors and forest fire occurrence are positive and negative, respectively. Therefore, a reasonable climate monitoring and warning system can effectively predict and prevent local forest fires, reducing the losses caused by fires. Additionally, the marginal effects plot of the aridity index shows a unique regional pattern: as the aridity index increases, the correlation with the occurrence of forest fires gradually changes from positive to negative. Generally, as the aridity index increases, the probability of forest fires should also increase. However, the opposite is true in the study area. Further analysis of the classification description of the aridity index and the vegetation status in the study area shows that, based on the classification of the aridity index [37], the study area mainly belongs to the humid and semi-humid regions. The overall environment of the study area is relatively humid, but the degree of humidity varies in different regions. Secondly, the vegetation in areas with higher dryness indices is mostly semi-humid evergreen broad-leaved forests, which are a unique type of forest vegetation found in China’s subtropical semi-humid monsoon climate [53]. Both previous studies and this study have shown that broad-leaved forests are less prone to fire compared to coniferous forests. One reason is that coniferous forests are more flammable than broad-leaved forests due to their resin and volatile oils, making them more susceptible to forest fires [23]. Another reason is that the tree species in evergreen broad-leaved forest communities are mostly tall and have rounded crowns, which results in less direct sunlight reaching the forest floor in areas with high vegetation coverage. This leads to lower surface temperatures, less evaporation of soil moisture, higher moisture content in surface combustibles, and thus, lower flammability. This explains why, in areas with higher dryness indices in the study area, where the vegetation type is mostly semi-humid evergreen broad-leaved forests, the correlation with forest fire occurrence is negative. At the same time, in this study, the pattern shown by FVC is that the higher the vegetation coverage, the lower the probability of forest fires, which is also well supported by and consistent with the changing patterns of the aridity index’s impact on forest fires. Among the topographic factors, altitude has a significant impact on forest fires. Changes in altitude lead to gradients in moisture and temperature in mountainous areas, indirectly affecting the water and heat conditions in the study area. When the altitude is greater than 1700 m, the probability of forest fires decreases gradually with increasing altitude. This is because higher altitudes have lower temperatures and higher vegetation moisture content, resulting in a relatively lower probability of forest fires [54].
Compared to natural factors, the importance of the three driving human factors—population density, distance to roads, and distance to settlements—in influencing forest fires in the study area is relatively low. However, the impact of human factors should not be ignored. This study found that areas farther from residential areas have a higher probability of forest fires. This is similar to the results of Cai et al., who found that forest fires occur more frequently farther from residential areas [41]. Penman et al. found that forest fires occur more frequently farther from residential areas because combustible materials in relatively remote areas are usually more continuous, and the integrity of vegetation is relatively higher, making them more susceptible to burning [55]. On the other hand, these areas far from human activities have lower levels of firefighting resources and forest management, so the probability of forest fires occurring in relatively remote areas increases. Therefore, local fire departments should allocate forest fire prevention forces and resources reasonably. For forests in remote areas, additional lookout towers and video surveillance equipment can be installed to enhance the detection and control capabilities of forest fires.
Furthermore, in terms of the impact of driving factors on forest fire occurrence, vegetation type is ranked as the third most important driving factor in the analysis results of the binary logistic regression model. However, in the boosted regression tree model, it is ranked as the eighth most important contributing factor. This indicates that there is a certain difference between the results of binary logistic regression and boosted regression tree analysis, but the main driving factors for forest fires are basically similar. Previous studies on the driving factors affecting forest fire occurrence [41,56,57], as well as this study, have all highlighted the reliability of logistic regression analysis model results. However, the factors influencing forest fires are numerous and their mechanisms are complex, including meteorological factors, altitude, human activities, and vegetation types. The relationships between these factors and forest fires are not necessarily simple linear relationships. The boosted regression tree model can complement the binary logistic regression analysis model well, and is suitable for identifying the contribution and nonlinear relationships of various driving factors to forest fire occurrence. The present study showed that the combination of a binary logistic regression analysis model and boosted regression tree model, rather than the traditional research method of forest fire influencing factors, compared and analyzed the relative influence of each driving factor and obtained changes in each influencing factor in the change in the value of the occurrence of forest fires. The output of the marginal effect curve of the driving factor is also more intuitive and graphical.

6. Conclusions

The present study thoroughly analyzed the spatial and temporal distribution patterns and driving factors of forest fire trails in prefectures (cities) crossed by the Tropic of Cancer (Yunnan section) from 2000 to 2020 and reached the following conclusions:
(1)
The area of forest fire traces in the study area showed obvious spatial aggregation characteristics between different years and presented two distinct periods. Using 2010 as the boundary, there is a period of high incidence from 2000 to 2010 and a relatively stable period after 2010, with the overall trend of area change showing an increase followed by a decrease. The distribution of forest fires in the study area showed obvious clustering characteristics, and the main clustering area was the eastern part of the study area. Therefore, forest fire prevention work should focus on Wenshan and Honghe Prefecture.
(2)
The binary logistic regression model showed that the top three factors influencing forest fire occurrence in the study area were average precipitation, average temperature, and vegetation type, which indicated that meteorological conditions and vegetation environment were important factors in the generation of forest fires. The results of the boosted regression tree model showed that the overall contribution rate of the three factors, average temperature, average precipitation, and elevation, reached 61.85%, which indicated that, in addition to climate and vegetation factors, the influence of topography, especially elevation, should also be considered.

Author Contributions

Conceptualization, H.X., R.H. and J.W.; Data curation, H.X.; Formal analysis, H.X.; Funding acquisition, J.W.; Investigation, H.X.; Methodology, H.X., R.H., J.W. and Y.L.; Project administration, J.W.; Software, H.X.; Supervision, R.H. and J.W.; Validation, H.X.; Visualization, H.X.; Writing—original draft, H.X.; Writing—review and editing, H.X., R.H., J.W. and Y.L. All authors have read and agreed to the published version of the manuscript.

Funding

This research was funded by the Science and Technology Special Project of Southwest United Graduate School–Major Projects of Basic Research and Applied Basic Research (202302AO370003); the National Natural Science Foundation of China (41961060); the Yunnan Key Project of Basic Research (2019FA017); and the Yunnan Normal University’s Research and Innovation Fund (YJSJJ23-B141).

Data Availability Statement

The data presented in this study are available in Table 1.

Acknowledgments

The authors wish to thank the Yunnan Provincial University Science and Technology Innovation Team.

Conflicts of Interest

The authors declare no conflicts of interest.

References

  1. Gralewicz, N.J.; Nelson, T.A.; Wulder, M.A. Factors Influencing National Scale Wildfire Susceptibility in Canada. For. Ecol. Manag. 2012, 265, 20–29. [Google Scholar] [CrossRef]
  2. Boulanger, Y.; Parisien, M.-A.; Wang, X. Model-Specification Uncertainty in Future Area Burned by Wildfires in Canada. Int. J. Wildland Fire 2018, 27, 164. [Google Scholar] [CrossRef]
  3. Hu, H.; Wei, S.; Wei, S.; Sun, L. Effect of Fire Disturbance on Forest Ecosystem Carbon Cycle under the Background of Climate Warming. J. Catastrophol. 2012, 27, 37–41. [Google Scholar]
  4. Jones, M.W.; Abatzoglou, J.T.; Veraverbeke, S.; Andela, N.; Lasslop, G.; Forkel, M.; Smith, A.J.P.; Burton, C.; Betts, R.A.; Van Der Werf, G.R.; et al. Global and Regional Trends and Drivers of Fire Under Climate Change. Rev. Geophys. 2022, 60, e2020RG000726. [Google Scholar] [CrossRef]
  5. He, Y.; Xu, H.; Cheng, J. Analysis of temporal and spatial distribution of forest fire in Yunnan Province. J. Cent. South Univ. For. Technol. 2017, 37, 36–41. [Google Scholar] [CrossRef]
  6. Wei, J.; Li, Z.; Ma, Z.; Wang, H.; Wang, Q.; Shu, L.; Yang, Y.; Gao, Z. Study on spatial and temporal aggregation of forest fire in Yunnan province. Fire Sci. Technol. 2020, 39, 1425–1429. [Google Scholar]
  7. Mishra, B.; Panthi, S.; Poudel, S.; Ghimire, B.R. Forest Fire Pattern and Vulnerability Mapping Using Deep Learning in Nepal. Fire Ecol. 2023, 19, 3. [Google Scholar] [CrossRef]
  8. Shao, Y.; Feng, Z.; Cao, M.; Wang, W.; Sun, L.; Yang, X.; Ma, T.; Guo, Z.; Fahad, S.; Liu, X.; et al. An Ensemble Model for Forest Fire Occurrence Mapping in China. Forests 2023, 14, 704. [Google Scholar] [CrossRef]
  9. Cui, Y.; Di, H.; Xing, Y.; Chang, X.; Shan, W. Spatial and temporal distributions of forest fires in Heilongjiang Province from 2001 to 2018 based on MODIS data. J. Nanjing For. Univ. Sci. Ed. 2021, 45, 205–211. [Google Scholar]
  10. Chan, A.H.Y.; Guizar-Coutiño, A.; Kalamandeen, M.; Coomes, D.A. Reconstructing 34 Years of Fire History in the Wet, Subtropical Vegetation of Hong Kong Using Landsat. Remote Sens. 2023, 15, 1489. [Google Scholar] [CrossRef]
  11. Feng, L.; Zhou, W. The Forest Fire Dynamic Change Influencing Factors and the Impacts on Gross Primary Productivity in China. Remote Sens. 2023, 15, 1364. [Google Scholar] [CrossRef]
  12. Podur, J.; Martell, D.L.; Csillag, F. Spatial Patterns of Lightning-Caused Forest Fires in Ontario, 1976–1998. Ecol. Model. 2003, 164, 1–20. [Google Scholar] [CrossRef]
  13. Mukunga, T.; Forkel, M.; Forrest, M.; Zotta, R.-M.; Pande, N.; Schlaffer, S.; Dorigo, W. Effect of Socioeconomic Variables in Predicting Global Fire Ignition Occurrence. Fire 2023, 6, 197. [Google Scholar] [CrossRef]
  14. Jo, H.-W.; Krasovskiy, A.; Hong, M.; Corning, S.; Kim, W.; Kraxner, F.; Lee, W.-K. Modeling Historical and Future Forest Fires in South Korea: The FLAM Optimization Approach. Remote Sens. 2023, 15, 1446. [Google Scholar] [CrossRef]
  15. Zhang, W.; Wang, J.; Wang, Q.; Zhang, X.; Cao, M.; Long, T. Analysis on spatial and temporal characteristics of forest fires in Yunnan Province based on MODIS from 2001 to 2020. J. Nanjing For. Univ. Sci. Ed. 2023, 47, 73. [Google Scholar]
  16. An, J.; Feng, Z.; Ma, T.; Gao, K. Zoning of forest fire risk levels in the Hechuan District of Chongqing based on GIS grid. J. Cent. South Univ. For. Technol. 2022, 42, 91–101. [Google Scholar] [CrossRef]
  17. Shao, Y.; Fan, G.; Feng, Z.; Sun, L.; Yang, X.; Ma, T.; Li, X.; Fu, H.; Wang, A. Prediction of Forest Fire Occurrence in China under Climate Change Scenarios. J. For. Res. 2023, 34, 1217–1228. [Google Scholar] [CrossRef]
  18. Jiao, Q.; Fan, M.; Tao, J.; Wang, W.; Liu, D.; Wang, P. Forest Fire Patterns and Lightning-Caused Forest Fire Detection in Heilongjiang Province of China Using Satellite Data. Fire 2023, 6, 166. [Google Scholar] [CrossRef]
  19. Namburu, A.; Selvaraj, P.; Mohan, S.; Ragavanantham, S.; Eldin, E.T. Forest Fire Identification in UAV Imagery Using X-MobileNet. Electronics 2023, 12, 733. [Google Scholar] [CrossRef]
  20. Zhang, X.; Su, X. Correlation Analysis on Forest Fire Occurring Frequency and Meteorological Factors in Sichuan. J. Northwest For. Univ. 2017, 32, 176–180. [Google Scholar]
  21. Zeng, A.; Cai, Q.; Su, Z.; Guo, X.; Jin, Q.; Guo, F. Seasonal variation and driving factors of forest fire in Zhejiang Province, China, based on MODIS satellite hot spots. Chin. J. Appl. Ecol. 2020, 31, 399–406. [Google Scholar] [CrossRef]
  22. Jing, X.; Zhang, D.; Li, X.; Zhang, W.; Zhang, Z. Prediction of Forest Fire Occurrence in Southwestern China. Forests 2023, 14, 1797. [Google Scholar] [CrossRef]
  23. Tian, Y.; Niu, S.; Chen, F.; Wang, J. Temporal and Spatial Distribution of Forest Fire in Lijiang Area. J. Northwest For. Univ. 2018, 33, 142–148. [Google Scholar]
  24. Das, J.; Mahato, S.; Joshi, P.K.; Liou, Y.-A. Forest Fire Susceptibility Zonation in Eastern India Using Statistical and Weighted Modelling Approaches. Remote Sens. 2023, 15, 1340. [Google Scholar] [CrossRef]
  25. Kantarcioglu, O.; Schindler, K.; Kocaman, S. Forest fire susceptibility assessment with machine learning methods in north-east turkiye. Int. Arch. Photogramm. Remote Sens. Spat. Inf. Sci. 2023, 46, 161–167. [Google Scholar] [CrossRef]
  26. Yan, X.; Wang, Q.; Li, C.; Li, X.; Li, S.; Han, Y. Combustibles in Fires of Major Forest Fires in Kunming. J. Southwest For. Univ. 2019, 39, 157–164. [Google Scholar]
  27. Aleksandrov, A.A.; Ksenofontov, B.S.; Kozodaev, A.S.; Taranov, R.A.; Vyazova, V.D.; Ivanov, M.V. Development of an Algorithm for Calculating the Moisture Content and Time of Forest Fire Maturation of Forest Combustible Materials for Determining Forest Fire Hazards. Electronics 2023, 12, 1937. [Google Scholar] [CrossRef]
  28. Tariq, A.; Shu, H.; Siddiqui, S.; Munir, I.; Sharifi, A.; Li, Q.; Lu, L. Spatio-Temporal Analysis of Forest Fire Events in the Margalla Hills, Islamabad, Pakistan Using Socio-Economic and Environmental Variable Data with Machine Learning Methods. J. For. Res. 2022, 33, 183–194. [Google Scholar] [CrossRef]
  29. Ikhsan, A.N.; Hadmoko, D.S.; Widayani, P. Spatial Modeling of Forest and Land Fire Susceptibility Using the Information Value Method in Kotawaringin Barat Regency, Indonesia. Fire 2023, 6, 170. [Google Scholar] [CrossRef]
  30. Ying, L.; Han, J.; Du, Y.; Shen, Z. Forest Fire Characteristics in China: Spatial Patterns and Determinants with Thresholds. For. Ecol. Manag. 2018, 424, 345–354. [Google Scholar] [CrossRef]
  31. Antokhina, O.Y.; Antokhin, P.N.; Belan, B.D.; Gochakov, A.V.; Martynova, Y.V.; Pustovalov, K.N.; Tarabukina, L.D.; Devyatova, E.V. Effects of Rossby Waves Breaking and Atmospheric Blocking Formation on the Extreme Forest Fire and Floods in Eastern Siberia 2019. Fire 2023, 6, 122. [Google Scholar] [CrossRef]
  32. Zhang, X.; Lan, M.; Ming, J.; Zhu, J.; Lo, S. Spatiotemporal Heterogeneity of Forest Fire Occurrence Based on Remote Sensing Data: An Analysis in Anhui, China. Remote Sens. 2023, 15, 598. [Google Scholar] [CrossRef]
  33. Liu, Q.; Wang, J.; Yu, Y. Evaluation of tourism climate suitability in the Tropic of Cancer area in Yunnan based on remote sensing data. J. Yunnan Univ. Nat. Sci. Ed. 2020, 42, 906–915. [Google Scholar]
  34. Zhang, G.; Wang, M.; Liu, K. Forest Fire Susceptibility Modeling Using a Convolutional Neural Network for Yunnan Province of China. Int. J. Disaster Risk Sci. 2019, 10, 386–403. [Google Scholar] [CrossRef]
  35. Long, T.; Zhang, Z.; He, G.; Jiao, W.; Tang, C.; Wu, B.; Zhang, X.; Wang, G.; Yin, R. 30 m Resolution Global Annual Burned Area Mapping Based on Landsat Images and Google Earth Engine. Remote Sens. 2019, 11, 489. [Google Scholar] [CrossRef]
  36. Gao, Y.; Xu, J.; Zhang, M.; Jiang, F. Advances in the Study of the 400 mm Isohyet Migrations and Wetness and Dryness Changes on the Chinese Mainland. Adv. Earth Sci. 2020, 35, 1101–1112. [Google Scholar]
  37. Peng, S. 1 Km Annual Arid Index Dataset in China (1901–2022). Natl. Tibet. Plateau Third Pole Environ. 2023. [Google Scholar] [CrossRef]
  38. Luo, X.; He, H.; Liang, Y.; Wu, Z.; Huang, C.; Zhang, Q. Simulating the effects of fire disturbance for predicting aboveground biomass of major forest types in the Great Xing’an Mountains. Acta Ecol. Sin. 2016, 36, 1104–1114. [Google Scholar]
  39. Zhang, L.; Yang, Y.; Liang, X. The Diagnostic Approach of Multicollinearity in Geographically Weighted Regression Model. Geomat. Spat. Inf. Technol. 2017, 40, 28–31. [Google Scholar]
  40. Deng, O.; Li, Y.; Feng, Z.; Zhang, D. Model and zoning of forest fire risk in Heilongjiang province based on spatial Logistic. Trans. Chin. Soc. Agric. Eng. 2012, 28, 200–205. [Google Scholar]
  41. Cai, Q.; Zeng, A.; Su, Z.; Guo, F. Driving factors of forest fire in Zhejiang Province based on logistic regression model. J. Northwest AF Univ. 2020, 48, 102–109. [Google Scholar]
  42. Pourghasemi, H.R. GIS-Based Forest Fire Susceptibility Mapping in Iran: A Comparison between Evidential Belief Function and Binary Logistic Regression Models. Scand. J. For. Res. 2016, 31, 80–98. [Google Scholar] [CrossRef]
  43. Shuang, W.; Gui, Z.; Sangqing, T.; Ping, W.; Xin, W. Assessment of forest fire risk in Hunan province based on spatial logistic model. J. Cent. South Univ. For. Technol. 2020, 40, 88–95. [Google Scholar] [CrossRef]
  44. Aruhan; Du, L.; Sheng, Y. Asina Driving forces on land desertification in Duolun County Inner Mongolia based on Logistic regress model. Arid Land Geogr. 2019, 42, 137–143. [Google Scholar]
  45. Elith, J.; Leathwick, J.R.; Hastie, T. A Working Guide to Boosted Regression Trees. J. Anim. Ecol. 2008, 77, 802–813. [Google Scholar] [CrossRef] [PubMed]
  46. Jouffray, J.-B.; Wedding, L.M.; Norström, A.V.; Donovan, M.K.; Williams, G.J.; Crowder, L.B.; Erickson, A.L.; Friedlander, A.M.; Graham, N.A.J.; Gove, J.M.; et al. Parsing Human and Biophysical Drivers of Coral Reef Regimes. Proc. R. Soc. B Biol. Sci. 2019, 286, 20182544. [Google Scholar] [CrossRef] [PubMed]
  47. Jiao, L.; Chang, Y.; Shen, D.; Hu, Y.; Li, C.; Ma, J. Using boosted regression trees to analyze the factors affecting the spatial distribution pattern of wildfire in China. Chin. J. Ecol. 2015, 34, 2288–2296. [Google Scholar] [CrossRef]
  48. Rong, Y.; Gong, L.; Lu, S. Analysis on characteristics and causes of persistent meteorological and hydrological drought in Yunnan from 2009 to 2014. Water Resour. Prot. 2018, 34, 22–29. [Google Scholar]
  49. Ma, Z.; Gao, Z.; Wang, H.; Yang, H. Research on the evolution characteristics and laws of forest fires in Yunnan Province under the background of climate change. Fire Sci. Technol. 2023, 42, 115–119. [Google Scholar]
  50. Zhang, Y.; Wang, J.; Su, H.; Cheng, F. Study on landform classification of Cual-Scale watershed units based on CART: A case study of the tropic of cancer (Yunnan section). Geogr. Geo-Inf. Sci. 2021, 37, 84–92. [Google Scholar]
  51. Xu, Y.; Wang, M.; Ma, Z.; Liang, H. The influence of mountain terrain on the cold front shear heavy rain in Yunnan. J. Yunnan Univ. 2015, 37, 717–727. [Google Scholar]
  52. Chen, J.; Zhang, J.; Peng, J.; Zou, L.; Fan, Y.; Yang, F.; Hu, Z. Alp-Valley and Elevation Effects on the Reference Evapotranspiration and the Dominant Climate Controls in Red River Basin, China: Insights from Geographical Differentiation. J. Hydrol. 2023, 620, 129397. [Google Scholar] [CrossRef]
  53. Shen, Z.; Zhang, J. 1 School of Ecology and Environmental Science, Yunnan University, Kunming 650091; 2 Key Laboratory of MOE for Earth Surface Processes, College of Urban and Environmental Sciences, Peking University, Beijing 100871; 3 School of Ecological and Environmental Sciences, East China Normal University, Shanghai 200241 Semi-humid evergreen broad-leaved forests: Characteristics and status of plant diversity. Biodivers. Sci. 2023, 31, 23436. [Google Scholar] [CrossRef]
  54. Zhang, D.; Deng, O.; Li, Y.; Li, G.; Feng, Z. Temporal and Spatial Characteristics of Forest Fires in Heilongjiang Province between 1980 and 2005. Sci. Silvae Sin. 2012, 48, 175–179. [Google Scholar]
  55. Penman, T.D.; Bradstock, R.A.; Price, O. Modelling the Determinants of Ignition in the Sydney Basin, Australia: Implications for Future Management. Int. J. Wildland Fire 2013, 22, 469. [Google Scholar] [CrossRef]
  56. Gao, B.; Chen, X.; Shan, Z.; Han, X.; Shan, Y.; Yin, S.; Yu, B. Prediction of forest fire probability in Daxing’an Mountains area based on Logistic regression model. J. Saf. Sci. Technol. 2022, 18, 163–168. [Google Scholar]
  57. Zhu, Z.; Zhao, F.; Wang, Q.; Gao, Z.; Deng, X.; Huang, P. Driving factors of forest fire and fire risk zoning in Kunming City. J. Zhejiang AF Univ. 2022, 39, 380–387. [Google Scholar]
Figure 1. Location of the study area.
Forests 15 00661 g001
Figure 2. The flowchart represents the research process followed in this study.
Forests 15 00661 g002
Figure 3. Driving factors of forest fires in the research area.
Forests 15 00661 g003
Figure 4. Forest burned area at different years in prefectures (cities) of the Tropic of Cancer (Yunnan section).
Forests 15 00661 g004
Figure 5. Distribution map of forest burned area in prefectures (cities) of the Tropic of Cancer (Yunnan section) from 2000 to 2020.
Forests 15 00661 g005
Figure 6. Map of percentage of forest burned area in prefectures (cities) of the Tropic of Cancer (Yunnan section) from 2000 to 2020.
Forests 15 00661 g006
Figure 7. ROC curve fitting between binary logistic regression model and the boosted regression tree model.
Forests 15 00661 g007
Figure 8. Comparison of the relative importance of factors.
Forests 15 00661 g008
Figure 9. Changes in the influence of influencing factors.
Forests 15 00661 g009
Table 1. Data sources for the study.
Data TypeDataData SpecificationData Source
Burned area dataGlobal annual burned area mapSpatial resolution of 30 mEarth Big Data Science Project https://data.casearth.cn (accessed on 15 January 2024)
Meteorological dataAir temperatureThree hours at a time, vector dataNational Centers for Environmental Information https://www.ncdc.noaa.gov (accessed on 15 January 2024)
PrecipitationThree hours at a time, vector data
Aridity indexSpatial resolution of 1 kmNational Tibetan Plateau Data Centre https://data.tpdc.ac.cn (accessed on 15 January 2024)
Topographic dataDigital elevation model (DEM)Spatial resolution of 30 mGeospatial Data Cloud https://www.gscloud.cn (accessed on 15 January 2024)
Vegetation dataFractional vegetation cover (FVC)Monthly, spatial resolution of 250 mNational Tibetan Plateau Data Centre
https://data.tpdc.ac.cn (accessed on 15 January 2024)
Global landcover productSpatial resolution of 300 mEuropean Space Agency
https://maps.elie.ucl.ac.be (accessed on 15 January 2024)
Human factor data1:250,000 national basic geographic databaseVector dataNational Catalogue Service for Geographic Information https://www.webmap.cn (accessed on 15 January 2024)
Population densitySpatial resolution of 100 mWorldPop https://hub.worldpop.org (accessed on 15 January 2024)
Table 2. Number of random points involved in modeling in the study area in each year.
YearFire PointNon-Ignition PointYearFire PointNon-Ignition Point
200015015020115050
20013003002012200200
20021001002013100100
20032002002014300300
200430030020155050
20053003002016200200
200610010020175050
200715015020185050
200810010020195050
200920020020205050
2010800800
Table 3. Collinearity evaluation results.
Model VariableToleranceVIF Value
Slope0.9671.034
Elevation0.8951.117
Aridity index0.6121.634
Average precipitation0.5911.691
Average temperature0.8921.121
FVC0.9641.037
Vegetation type0.9431.060
Distance from settlements0.8731.145
Distance from roads0.9041.106
Population density0.9691.032
Table 4. ROC analysis curve output table.
ModelAUCStandard ErrorProgressive Significance95%EXP(B) Confidence Interval
Lower LimitUpper Limit
BLR0.8850.0070.0000.8720.899
BRT0.8520.0060.0000.8410.863
Table 5. Regression analysis results of influencing factors leading to forest fires.
Model VariableBS.E.WaldDfSignificanceExp(B)95%EXP(B) Confidence Interval
Upper LimitLower Limit
Slope0.0880.0552.5661.0000.1091.0921.2150.981
Elevation0.4770.05672.1721.0000.0001.6111.7981.443
Aridity index0.7980.073119.0471.0000.0002.222.5621.924
Average precipitation−1.3000.081255.6341.0000.0000.2720.3200.232
Average temperature0.9160.062217.9261.0000.0002.4992.8222.213
FVC0.5210.05880.0721.0000.0001.6841.8881.502
Vegetation type0.7960.058186.2651.0000.0002.2162.4841.977
Distance from settlements−0.6040.060100.2451.0000.0000.5470.6150.486
Distance from roads0.0860.0562.3391.0000.1261.0901.2170.976
Population density−0.1550.0596.7811.0000.0090.8570.9620.762
Constant−0.0210.0540.1521.0000.6960.9791.0890.881
Note: B denotes the logistic regression coefficient; Exp(B) is the dominance ratio, which reflects the magnitude of the effect of each evaluating factor on hazard; S.E. is the standard error, which indicates the mean error of the estimate; Wald statistic tests whether the independent variable has an effect on the dependent variable; and Df is the degrees of freedom.
Disclaimer/Publisher’s Note: The statements, opinions and data contained in all publications are solely those of the individual author(s) and contributor(s) and not of MDPI and/or the editor(s). MDPI and/or the editor(s) disclaim responsibility for any injury to people or property resulting from any ideas, methods, instructions or products referred to in the content.

