Article

Subgrade Strength Recovery of Fine-Grained-Soil-Containing Roads in Western Oregon Forest

1
Kevin Boston, Center for Forest Business, University of Arkansas, Monticello, AR 71656, USA
2
National Park Service, Moose, WY 83012, USA
3
Oregon Department of Forestry, Salem, OR 97310, USA
*
Author to whom correspondence should be addressed.
Forests 2024, 15(4), 671; https://doi.org/10.3390/f15040671
Submission received: 8 February 2024 / Revised: 15 March 2024 / Accepted: 26 March 2024 / Published: 8 April 2024
(This article belongs to the Section Forest Soil)

Abstract

:
Forest roads are composed of surface and subsurface layers. Determining the seasonal strength and associated moisture changes in these roads is required to understand their capacity. This study looks at changes in the subgrade layer. Laboratory and field studies were conducted to determine the changes in subgrade conditions by measuring moisture content and subgrade strength for fine-grained, non-plastic soils in Western Oregon. One field and one laboratory experiment were conducted. Drying in the field experiment occurred during the summer months in the absence of rainfall, while the laboratory study allowed drying for 48 h under controlled suction. In both cases, there was a slight reduction in the subgrade’s moisture content and no significant improvement in subgrade strength. These findings are supported by the soil physics theory that shows that limited water content reduction is expected for these fine-grained soils, as the numerous tiny soil pores can hold water at high capillary tensions. Adding rock layers adds an insulation effect for the subgrade, further reducing evaporation. Consequently, the moisture content remains high, and there will be little change in subgrade strength during the measurement periods.

1. Introduction

Forest roads provide public access to various forest resources, including forest products and recreational services [1]. However, these forest roads can have significant impacts on the environment. These impacts include accelerated surface erosion and increased sedimentation in nearby watercourses [1]. When hauling is performed on highly saturated roads, there is an opportunity for increased road-generated sediment [1]. Thus, understanding the changes in subgrade strength is necessary to minimize these impacts. Heinemann [2] describes various methods to build the pavements of forest roads. In the Pacific Northwest Region, these roads are commonly constructed using a two- or three-layer structure [3]. The lower layers consist of a subgrade composed of compacted native soils. The following two layers both use aggregate materials. The base course is often built using unprocessed aggregate material measuring a maximum of 10 cm (4.5-inch rock). The surface layer will use smaller stones with a diameter of 7.5 cm (3 inches). The cost of this rock can exceed USD 7.80 to USD 32.5 per cubic meter (USD 6 to USD 25 per cubic yard) when royalties, processing, and hauling are included in the cost [4], and recently reviewed contracts from the Oregon Department of Forestry revealed an appraised value of USD 10.4 per cubic meter for spot rocking costs of USD 8 per cubic yard in 2019.
Ghosh [5] and several others demonstrated the effect of moisture content on a soil’s shear strength. Their results showed that as the moisture content increased, there was an exponential decrease in the soil’s shear strength for various soil types [5]. The stronger-subgrade soils can better resist wheel loads and reduce subsequent rutting when the subgrades fail. Many studies document the impact of moisture on road strength, which adds to this body of knowledge.
Failure occurs when these aggregate-surfaced roads cannot support the vehicle’s weight. Deep ruts can form during hauling when the aggregate, subgrade, or aggregate layers are compressed by loads exceeding the bearing strength of a given layer or the layers below. Following rut formation, future precipitation collects in the ruts. Channelized flow in these ruts detaches and transports fine soil particles, leading to accelerated erosion. The severity of accelerated erosion is a function of the road gradient and rut dimensions. This erosional process can cause a significant loss of fine grains in the aggregate surface and subgrade and decrease the binding of the aggregate by filling the gaps in the aggregate [6]. Another erosion process is described by Toman and Skaugset [7], which represents the process of “subgrade mixing,” where fine soils from the subgrades move through the aggregate layer during repeated loading in wet weather hauling and are easily transported when they arrive on the surface. There have been efforts to reduce these impacts by imposing wet weather hauling restrictions [2].
These hauling restrictions may include the cessation of hauling upon the appearance of ruts in the road or sediment in a nearby stream. For example, a contract provision in the Oregon Department of Forestry’s (ODF) timber sale contracts for selling state-owned timber from lands managed, not just regulated by the ODF, has additional limitations: “hauling shall not be permitted until 48 h after a significant rainstorm events, [which are defined as] …periods when rainfall exceeds 1 ½ inch (3.8 cm) in 24 h”.
In California, similar forest practice rules restrict hauling when sediment is being generated. “Hydrologically disconnected roads are prohibited for use when they exhibit highly saturated soil conditions. Use is prohibited on roads not hydrologically disconnected and exhibiting saturated soil conditions. CCR § 923.6(g)”.
Private companies have also taken steps to limit sediment delivery to streams. By developing a protective plan for species listed under the Endangered Species Act, Humboldt Redwood Company, in the northwestern part of California, has been issued incidental take permits by the appropriate federal agency to obtaining approval for their habitat conservation plan (HCP). One constraint included in Humboldt Redwood’s HCP is as follows: “Roads used for hauling shall not resume [hauling] until 48 h without any precipitation or until the road surface is dry” [8].
These are examples of regulations that use the period following rain events to restrict hauling until the roads recover. Thus, this paper aims to investigate one aspect of subgrade strength recovery following saturation. It considers the measure of both strength and moisture content in its recovery. Field and laboratory procedures were performed to gain insight regarding soil strength and moisture content recovery after drying.

Literature Review

This literature review investigates the reduction in the subgrade strength of fine-grained soils when used in a road’s subgrade, which can lead to environmental damage. There are mixed results regarding how fast these soils dry and the strength of the subgrades improves. Li and Selig [9] describe how moisture in fine-grained soils can reduce the strength and stiffness of subgrade soils. Roslan et al. [10] showed that repeatedly submerging well-graded sandy and silty clay gravelly soils for one hour per day for one, three, and seven days reduced CBR by almost 80% from non-soaked samples [10]. Thus, the impact of moisture content on strength reduction is well known. Lary and Mahoney [11] measured changes in the resilient modulus and moisture content of the subgrades of roads in Oregon and Washington. Their results showed a change varying between 54 and 16 percent from the maximum strengths due to seasonal changes in subgrade moisture. They demonstrated a potential change in soil strength with cycles of drying and wetting.
Hanek et al. [12] measured moisture and strength from an aggregate-surfaced forest road in Willamette National Forest in Western Oregon (USA). Moisture contents were recorded using time-domain reflectometry (TDR) probes at depths below the road’s surface. Road strength measurements were made utilizing a falling-weight deflectometer (FWD), and the data were used to back-calculate the strength indices. Their results reported a gradual increase in subgrade moisture content leading into the wet season and stabilizing through the winter. There were no short-term dramatic changes in moisture and strength values. Short-term load restrictions based on seasonal variation in subgrade moisture are probably not feasible in this rain-dominated environment of Western Oregon.
In a different study on the Willamette National Forest, Linares’s [13] project monitored subgrade strength and moisture content along two forest roads located within the Lowell Ranger District. From November 1987 to April 1988, Linares monitored moisture content and measured subgrade strength using 4.5 and 10 kg Clegg Hammers and a dynamic cone penetrometer. Moisture content data were obtained at 7.6 and 15.2 cm (3 and 6 in.) below the subgrade surface using a soil moisture–temperature cell. Strength measurements were taken weekly or bi-weekly at the subgrade surface. The 4.5 and 10 kg Clegg Hammer results showed large variability between sampling periods, but a discernible drying or wetting trend was not observed.
Hinshaw and Northrup [14] developed a model to predict the moisture content for aggregate-surfaced roads in Idaho (USA). Their study areas comprised low-plasticity subgrade soils with 10 to 30 cm (4 to 12 in.) of aggregate. Hinshaw and Northrup [14] found that following precipitation, a one- to two-week lag was observed before the water reached the subgrade moisture sensors. Subgrade saturation levels decreased from a high of 95% following winter precipitation to a low of 65% in the early fall. However, they found too much variability in the data to predict soil density or strength for the soils in the area [14].
Bolander [15] studied various road segments in the Oregon Cascades and showed that roads with good drainage could reduce their saturation from 90% to 68%. Roads with poor drainage structures maintained a saturation level between a low of 75% and a high of 93%. Additionally, all roads had low soaked CBR values below 1.0 for GW and GP soil types and MH and CH soil types when compacted to the 95% AASHTO T99 levels.
Truebe and Bolander [16] presented the results of their Lowell Road tests, which measured ruts under changing weather and hauling conditions. Their results showed that during wet weather, there was accelerated surface deterioration on the roads. CBRs were measured under different moisture and traffic regimes and showed variation. Rut formation was primarily associated with the densification and lateral displacement of the aggregate layer, and only 20 percent was due to their formation in the subgrade. Reducing the ruts reduces the sediment production from forest roads and minimizes the effects on water quality [17].
Only two methods allow water to leave the soil in a newly constructed road without vegetation due to lacking transpiration. One is based on the liquid phase of water governed by the Darcy–Buckingham law, and the second is water vapor modeled by Fick’s law (Figure 1). As the road was newly constructed and no roots were seen at any of the sites, we assumed there was no transpiration in the subgrade during this study.
The Darcy–Buckingham equation describes the movement of water in a liquid phase under unsaturated soil conditions:
q L = K ψ , θ H
where
K = h y d r a u l i c c o n d u c t i v i t y
ψ = m a t r i c p o t e n i a l
θ = v o l u m e t r i c w a t e r c o n t e n t
H = p o t e n t i a l g r a d i e n t
Equation (1) states that the liquid flux equals the product’s potential gradient and the hydraulic conductivity of the soil. The potential gradient is found by dividing the change in total potential (elevation, matric, and osmotic potential) between two points by the distance separating the points. In unsaturated flow, the most common condition, the hydraulic conductivity of the soil, is a function of water content and matric potential, which is strongly influenced by pore size. As water content decreases, the matric potential increases, smaller pores hold onto water more tightly, and hydraulic conductivity decreases. Therefore, the relationship between water content and matric potential is an inherent property of the soil matrix and is expressed in terms of a moisture release characteristic curve [18].
The other method for which water may leave the subgrade is vapor loss. Fick’s first law describes water movement in vapor form through a diffuse medium (Equation (2)):
q v = D V ρ V z
where
Dv = the diffusion coefficient for water vapor;
ρV = vapor density;
z = the distance between points of evaluation.
The theoretical maximum diffusion coefficient of water vapor in the air is 0.256 cm2/s. Still, it is lower in soil due to the restricted volume and tortuosity of the non-continuous air-filled pores [18]. The vapor density gradient is determined by dividing the change in vapor density between two points by the distance separating the points. Vapor density within air-filled pores is a function of matric potential and temperature [18]. However, under normal field conditions, vapor density is considered to be only a function of temperature (Equation (3)) [18]. Thus, the movement of water vapor is from a warmer area to a cooler area within the soil matrix [18]. The result is downward movement during the day and upward movement at night.
ρ V = 5.018 + 0.32321 T + 8.1847 × 10 3 T 2 + 3.1243 × 10 4 T 3 g m 3
In the above equation, T is the air temperature in degrees Celsius.

2. Materials and Methods

Two experiments were conducted in this project. The first was a field-based experiment that measured the change in moisture content and collected various measures of subgrade strength from late spring after winter rains to autumn before the return of wet weather. The second was a laboratory experiment in which soil samples were compacted and saturated through immersion in a water tank for 96 h as part of the standard California Bearing Ratio (CBR) test [19]. Half of the samples were tested after 10 min, per the ASTM CBR test requirements, with the other half subjected to 48 h of drying with a 60.7 kPa (0.6 atmospheres) pump supplying suction to the mold. This was the maximum pump capacity available to us to simulate the drying that would occur in the field. The CBR values, density, and saturation measurements were compared for the laboratory trials to determine if there was a significant difference among the samples tested at 10 min and 48 h. Finally, the air-entry values were determined for the tested soils to determine the suction that would need to be exerted on the soils to dry these soils [20].
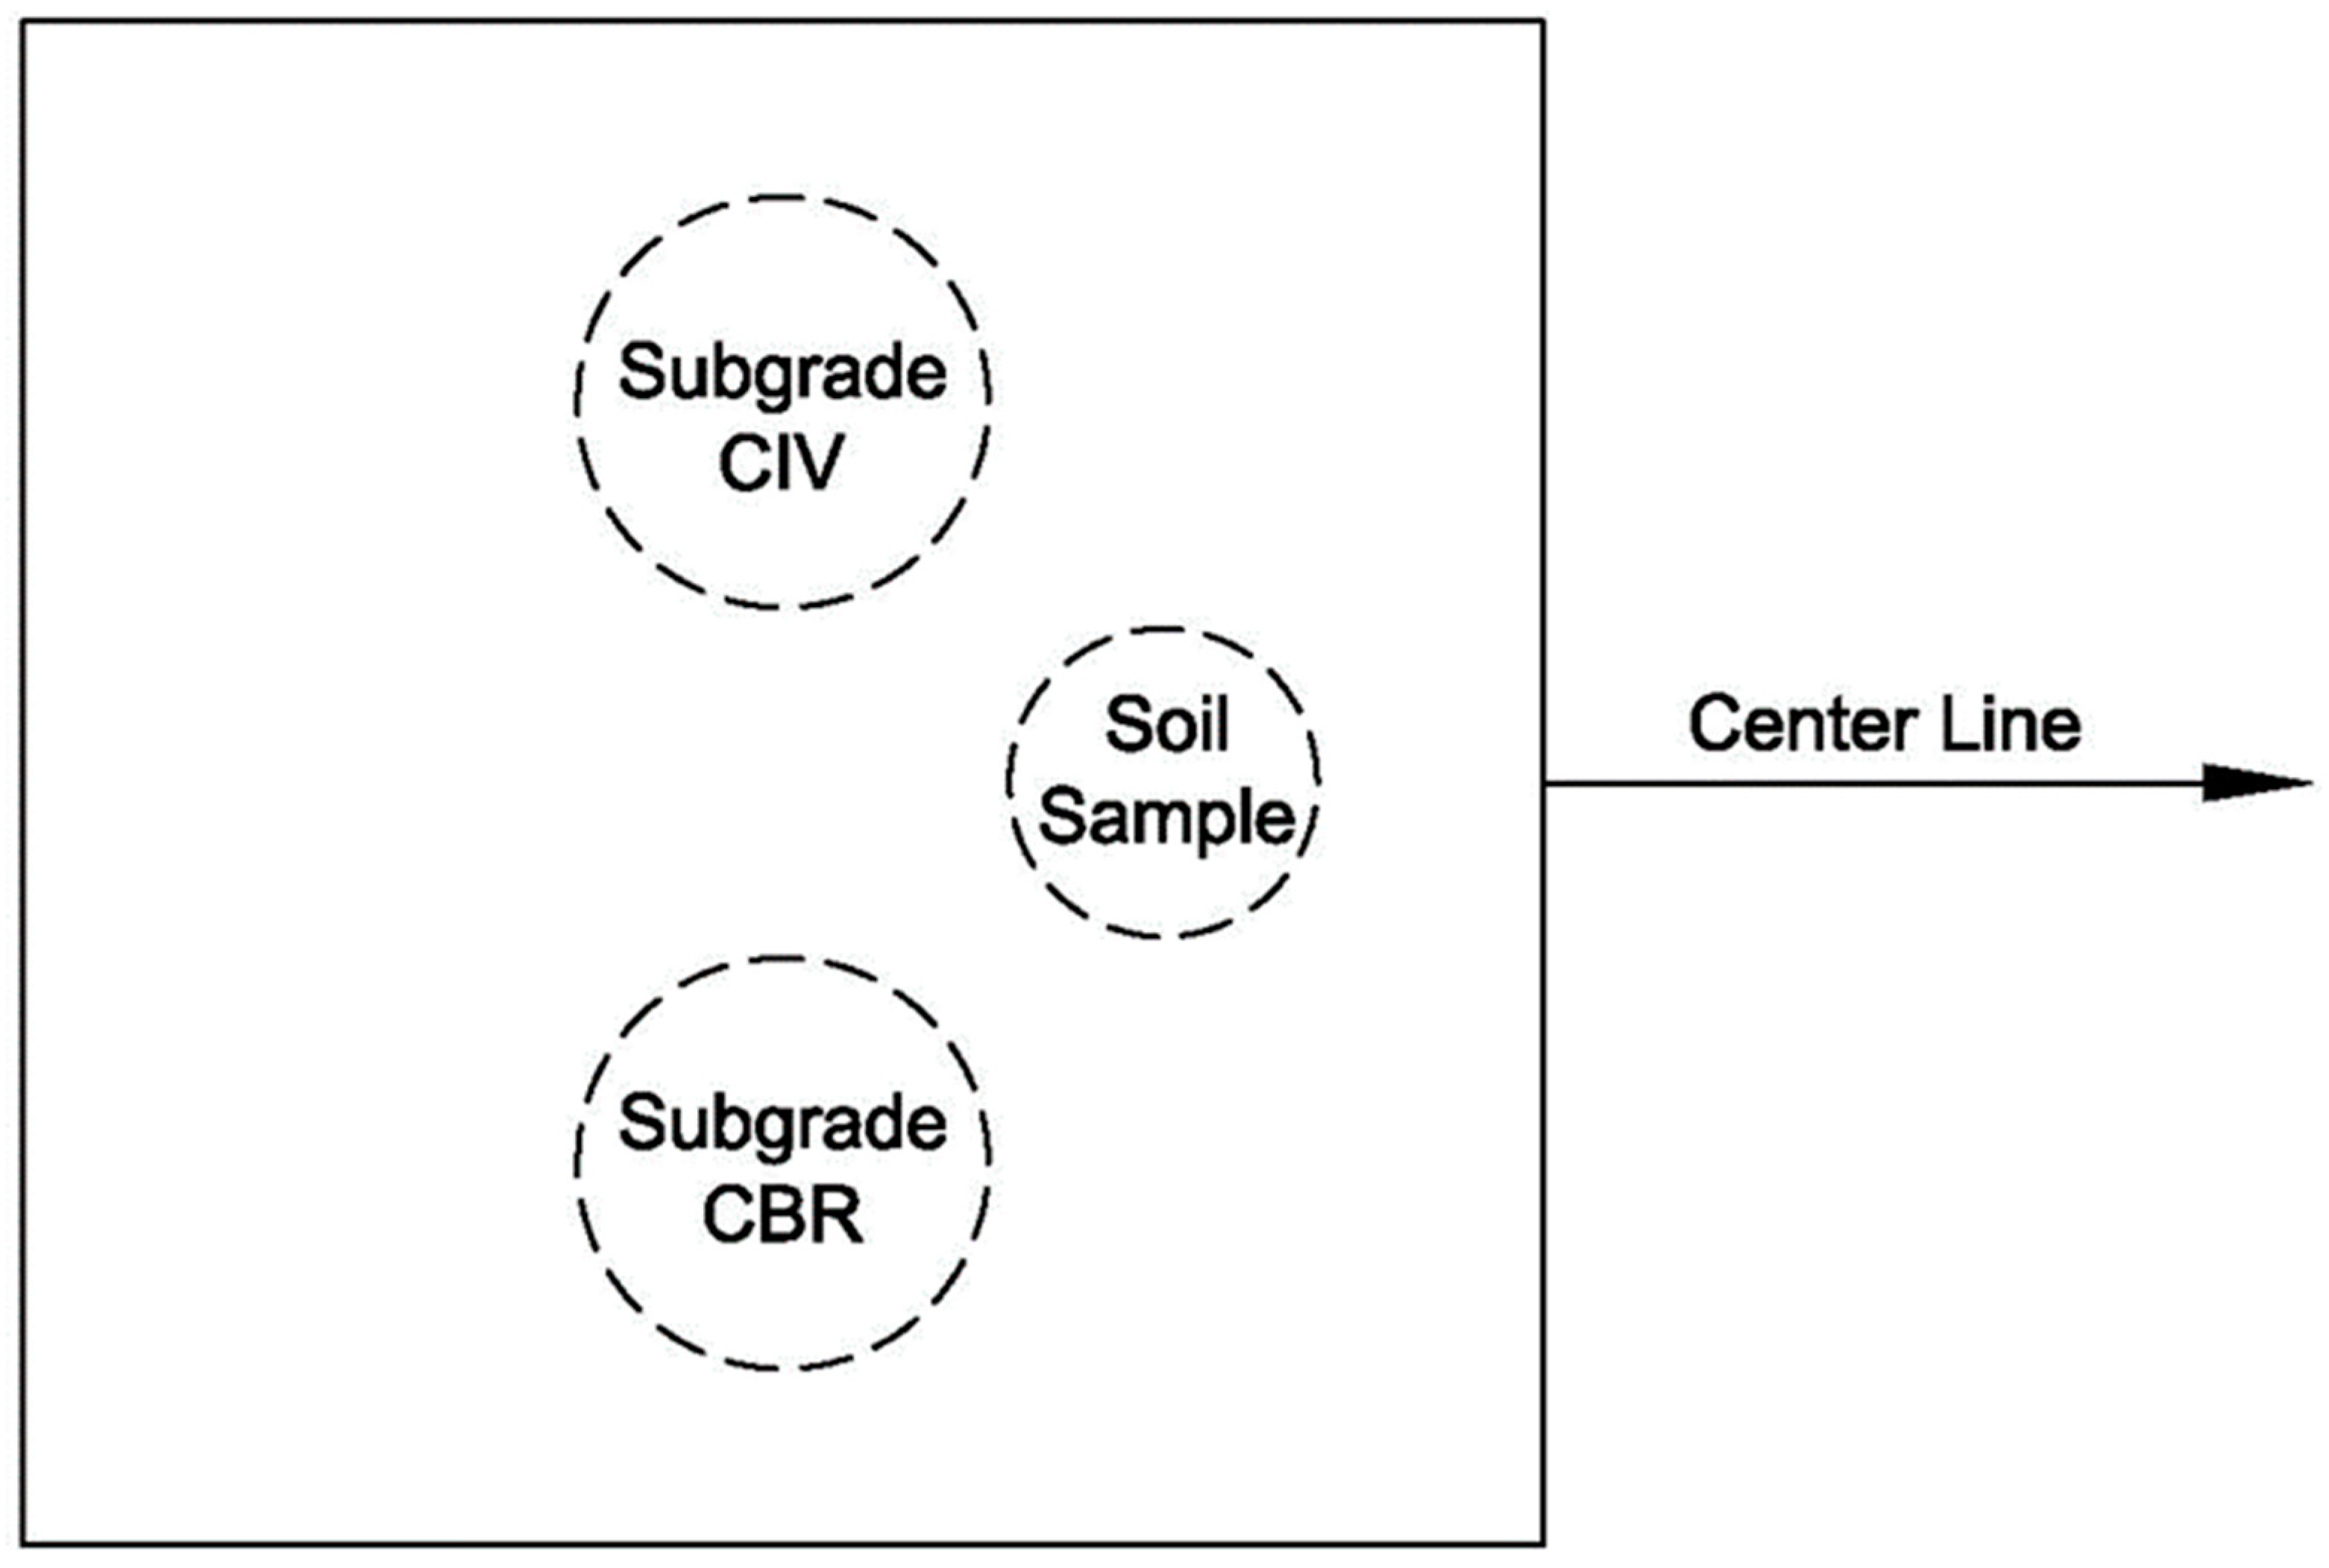
The field samples were collected from a newly constructed forest road in Western Oregon along the centerline road, whose grade varied from 2 to 6 percent. The road was located on the upper slope on the northern aspect of the road. The subgrade soil was classified as SM soil using the Unified Soil Classification System, and as a silty-sand soil using the classification in [21]. The road had not been used and had approximately 30 cm (12 inches) of aggregate covering the subgrade that received minimal subgrade compaction with no control. The road was out-sloped, with no ditch, and with vegetation removed beyond the cut and bottom of the fill beyond the clearing limits. A series of destructive samples were applied to the road between April and August 2007 at approximately four-week intervals, during which no rainfall occurred. Figure 2 shows the arrangement of the subgrade samples at each point along the road. The overlying aggregate was removed, exposing the top of the subgrade, which was easily defined due to the lack of hauling on the road, which often results in aggregate being pushed into the subgrade. Two strength variables were collected: field CBR using the method in [22] and the 20 kg Clegg impact value using the method in [23]. A soil sample was also collected to determine the soil’s moisture content, density, classification, and moisture release characteristics. In July, aggregate and subgrade temperatures were continually monitored using a Hobo Pro V2 data logger HOBO, Bourne, MA, USA.
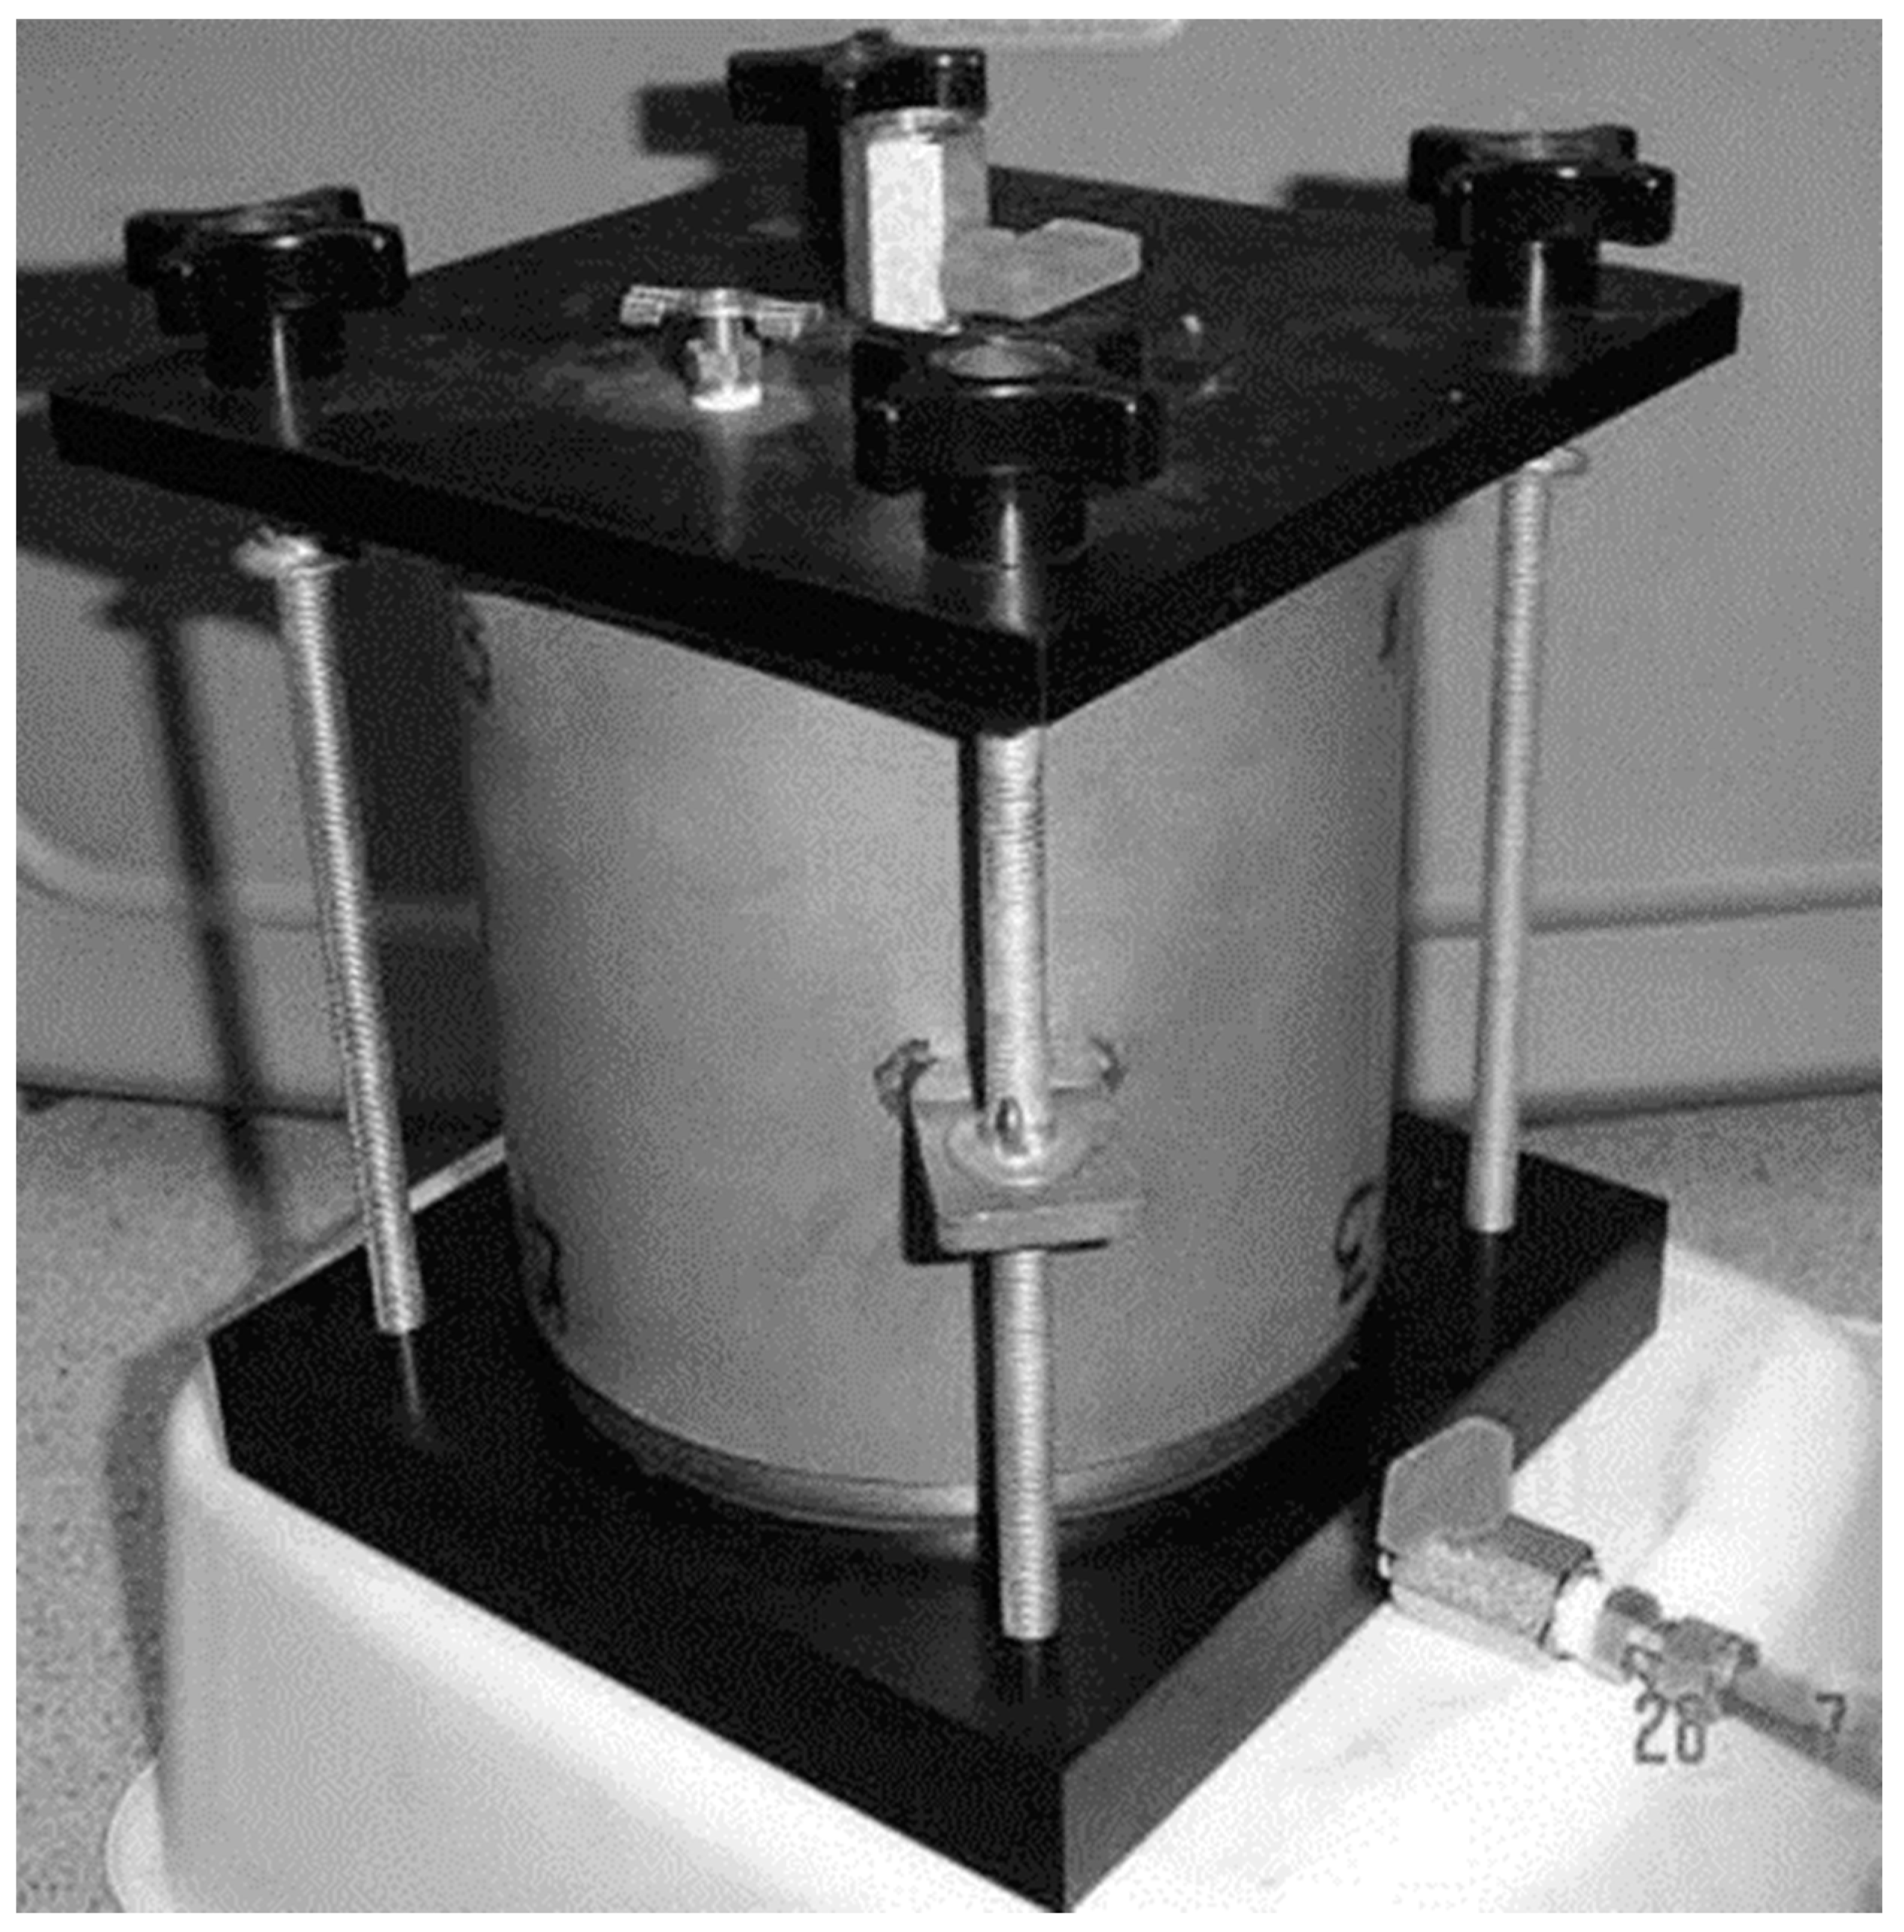
The laboratory tests used similar soil classifications, SM and ML, sandy silt, and silt soils with low-plasticity properties. They were compacted in 15 cm (6-inch) molds to 85% of standard proctor levels. All molds were placed in a water tank for 96 h to allow the soil to become saturated. This best represents the worst-case conditions found following a high-precipitation storm. Upon completion of their soak, half of the samples were removed from the tank and allowed to drain for ten minutes as specified by the standard laboratory CBR method [19]. Each sample’s CBR value was then measured, followed by determination of the sample’s moisture content. The other half were subjected to 48 h of drying before testing in a sealed environment connected to the 60.7 kPa pump (0.6-atmosphere suction) (Figure 3). A subsample from the CBR was selected and placed in the sealed chambers to determine the air-entry value using the method in [20].

3. Results

3.1. Field Results

The average CBR was approximately seven during this period. Statistical analysis of the results from the field data using the Kruskal–Wallis nonparametric test due to unequal variances showed no statistically significant subgrade strength recovery when measured using the field CBR for June through November (Figure 4 and Figure 5); the p-value was 0.88. A similar result was produced using the Kruskal–Wallis test for the Clegg impact value (CIV). No significant difference was found around a mean value of 5.1 during this period; the p-value was 0.96.
The moisture content slightly decreases during the spring but quickly returns to pre-drying levels with autumn rains (Figure 6). The moisture contents range from an average high of 45% to a low of 40% shortly before the autumn rain, when the moisture quickly returns to 45%. Again, there is a wide range of moisture content found in the subgrade of this road that may reflect the preferential drainage pathway common in the Oregon coast range, but no surface explanation can be found.
The moisture release curve (Figure 7) shows the tension required to produce drainage from the soil. Changes in moisture content by mass, when subjected to suction values of 0 to 378 kPa (0 to 3.74 atmospheres), range between 5.4 and 13.7 percent. Most moisture losses occur between suction values of 0 to 68.7 kPa (0 to 0.68 atmospheres). The subsequent decline in moisture occurs when the suction is between 3.06 and 3.74 atmospheres. This accounts for 60–70 percent of the moisture change.
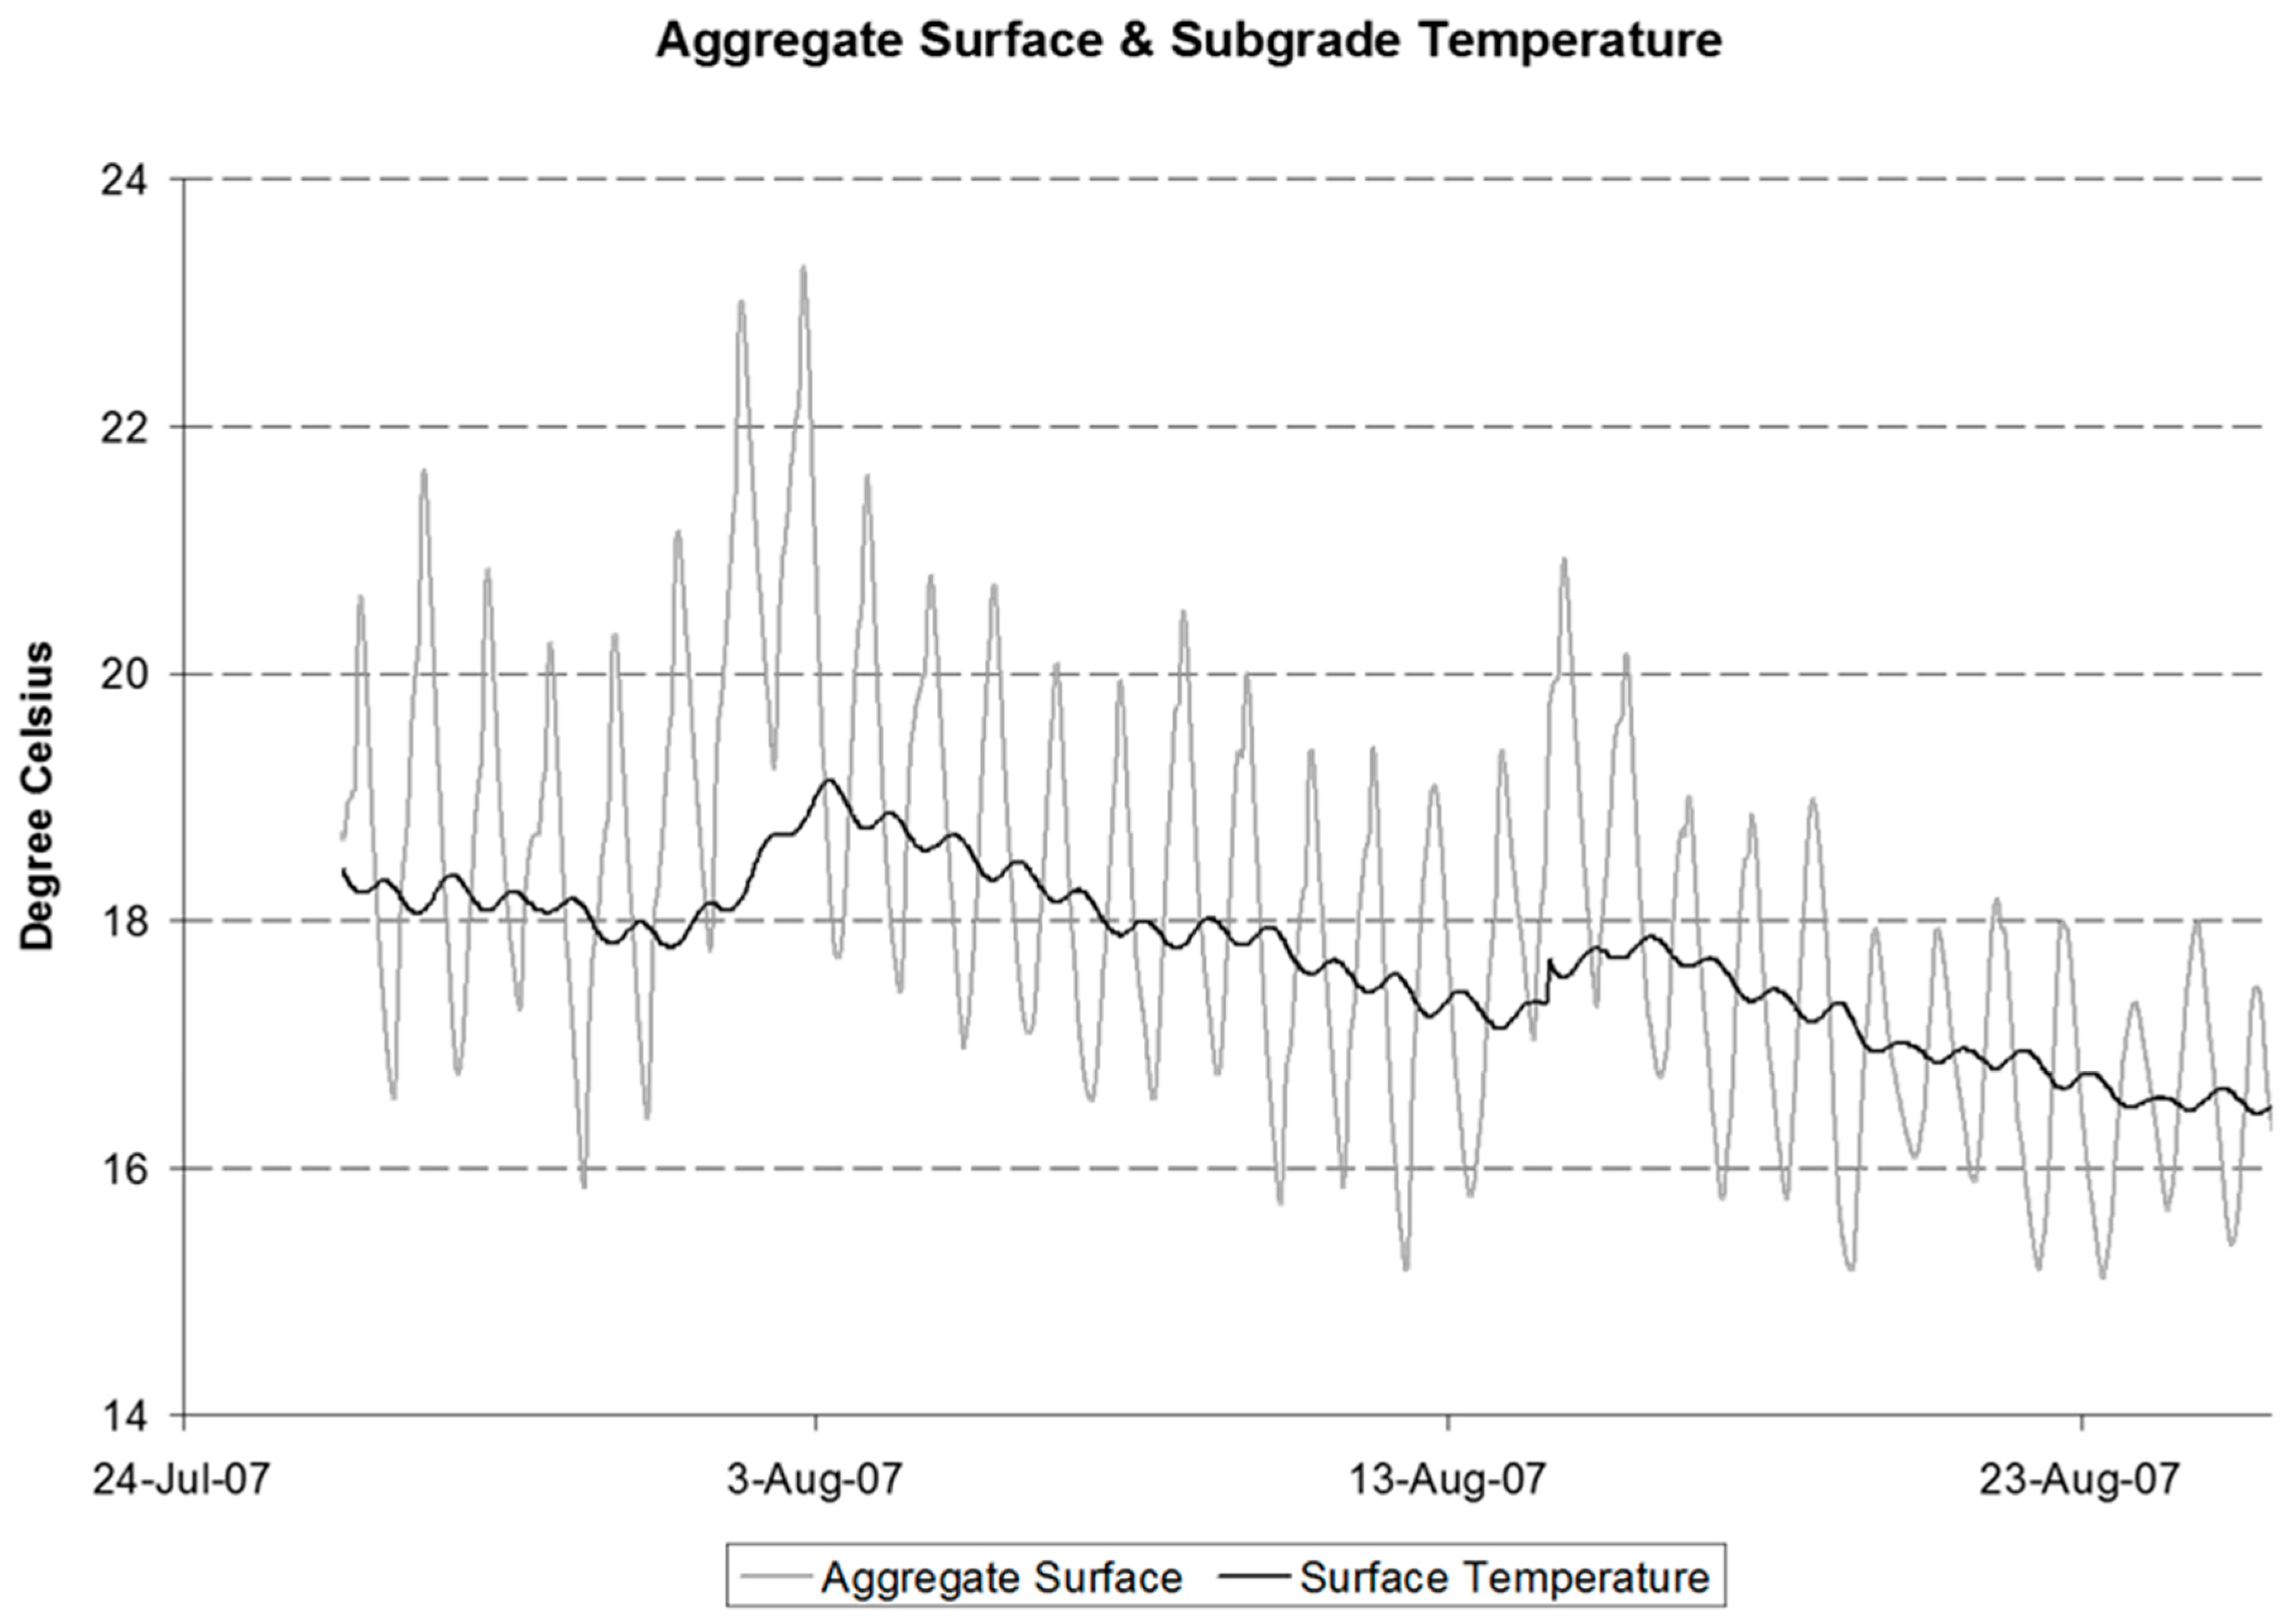
The surface and subgrade temperatures were collected to determine the potential moisture loss due to evaporation that could be modeled using Wick’s law. The data show that the aggregate effectively insulates the subgrade from the daily temperature flux as the temperature at the aggregate–subgrade interface varies less than 1 degree Celsius on a given day. A lagged and dampened response to diurnal aggregate temperature changes is found in the subgrade, with approximately a 12 h lag in maximum temperature when compared with the temperature of the aggregate surface. Overall, the temperature only varies by about 3 degrees Celsius during the summer (Figure 8). Utilizing these temperature data, Fick’s first law, and the vapor density equation (2 and 3), the estimation of the total change in moisture content due to vapor movement is shown to be approximately 0.03 percent.

3.2. Laboratory Results

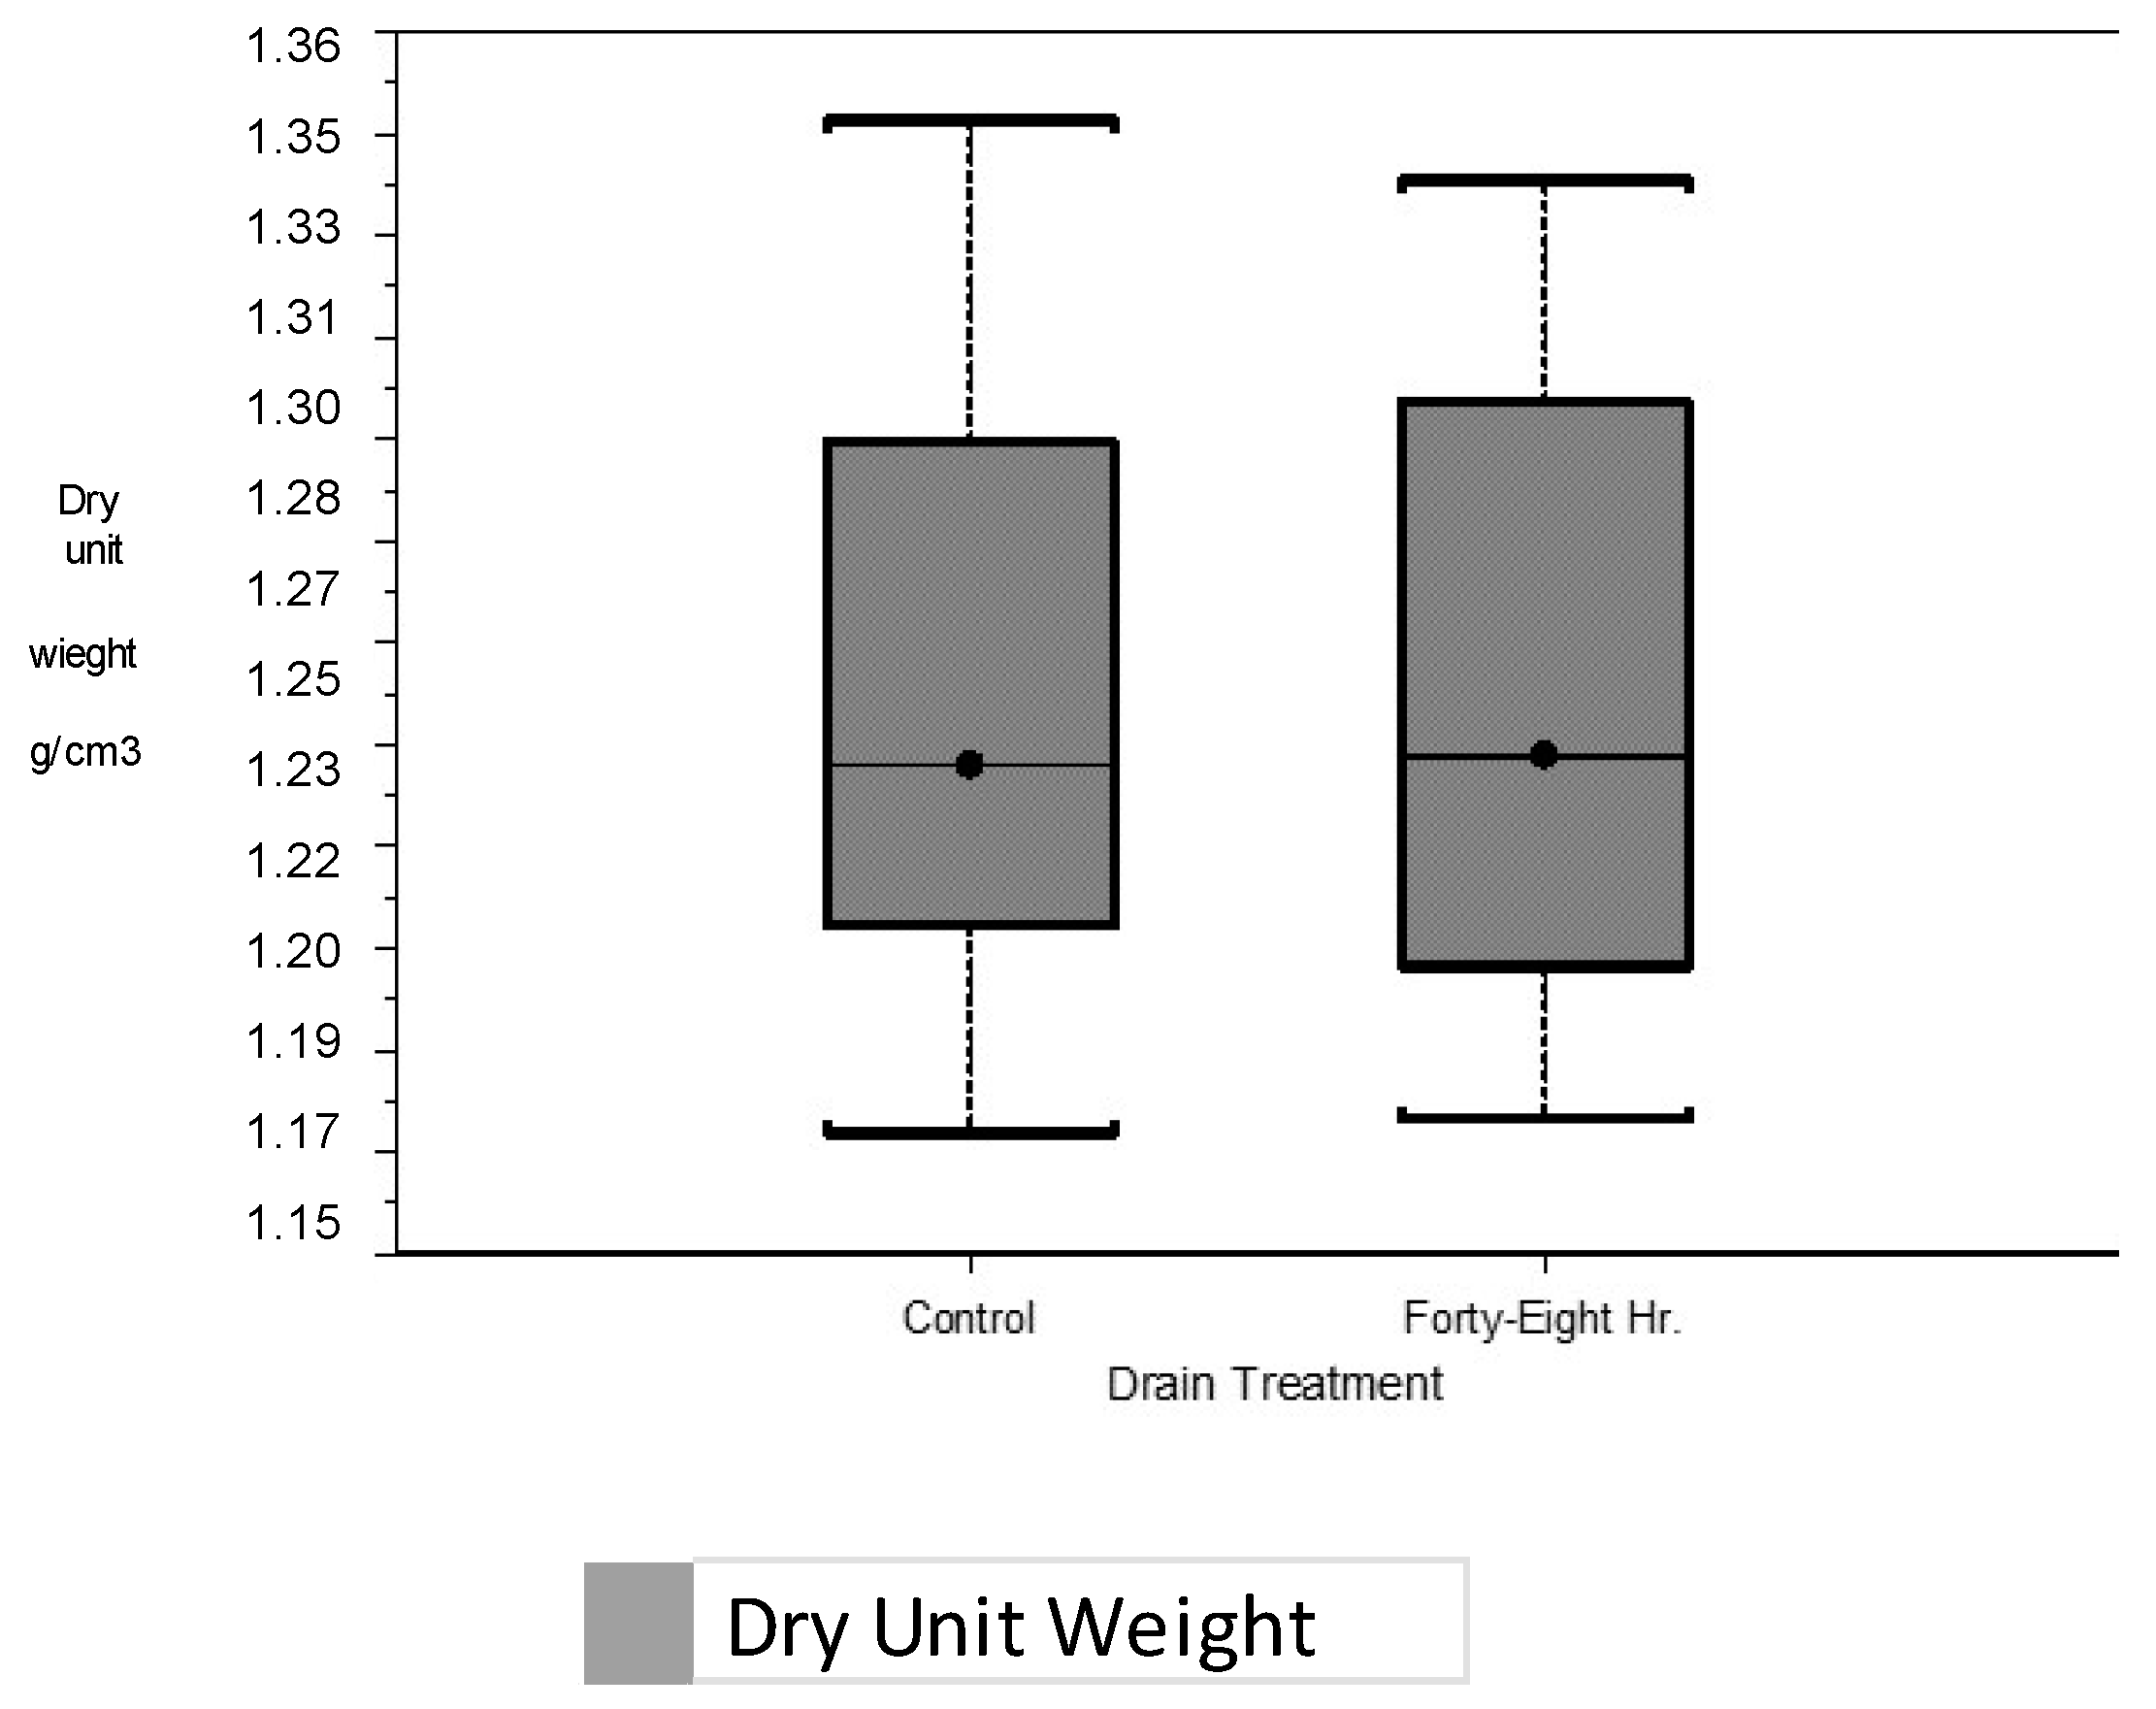
Figure 9 shows the soil samples’ average dry unit weight before testing, which was 378 kg/m2 (77.5 pcf). The statistically insignificant difference (p-value = 0.9848) in densities between the samples tested at 10 min versus those tested at 48 h indicates proper replication used in the experiment.
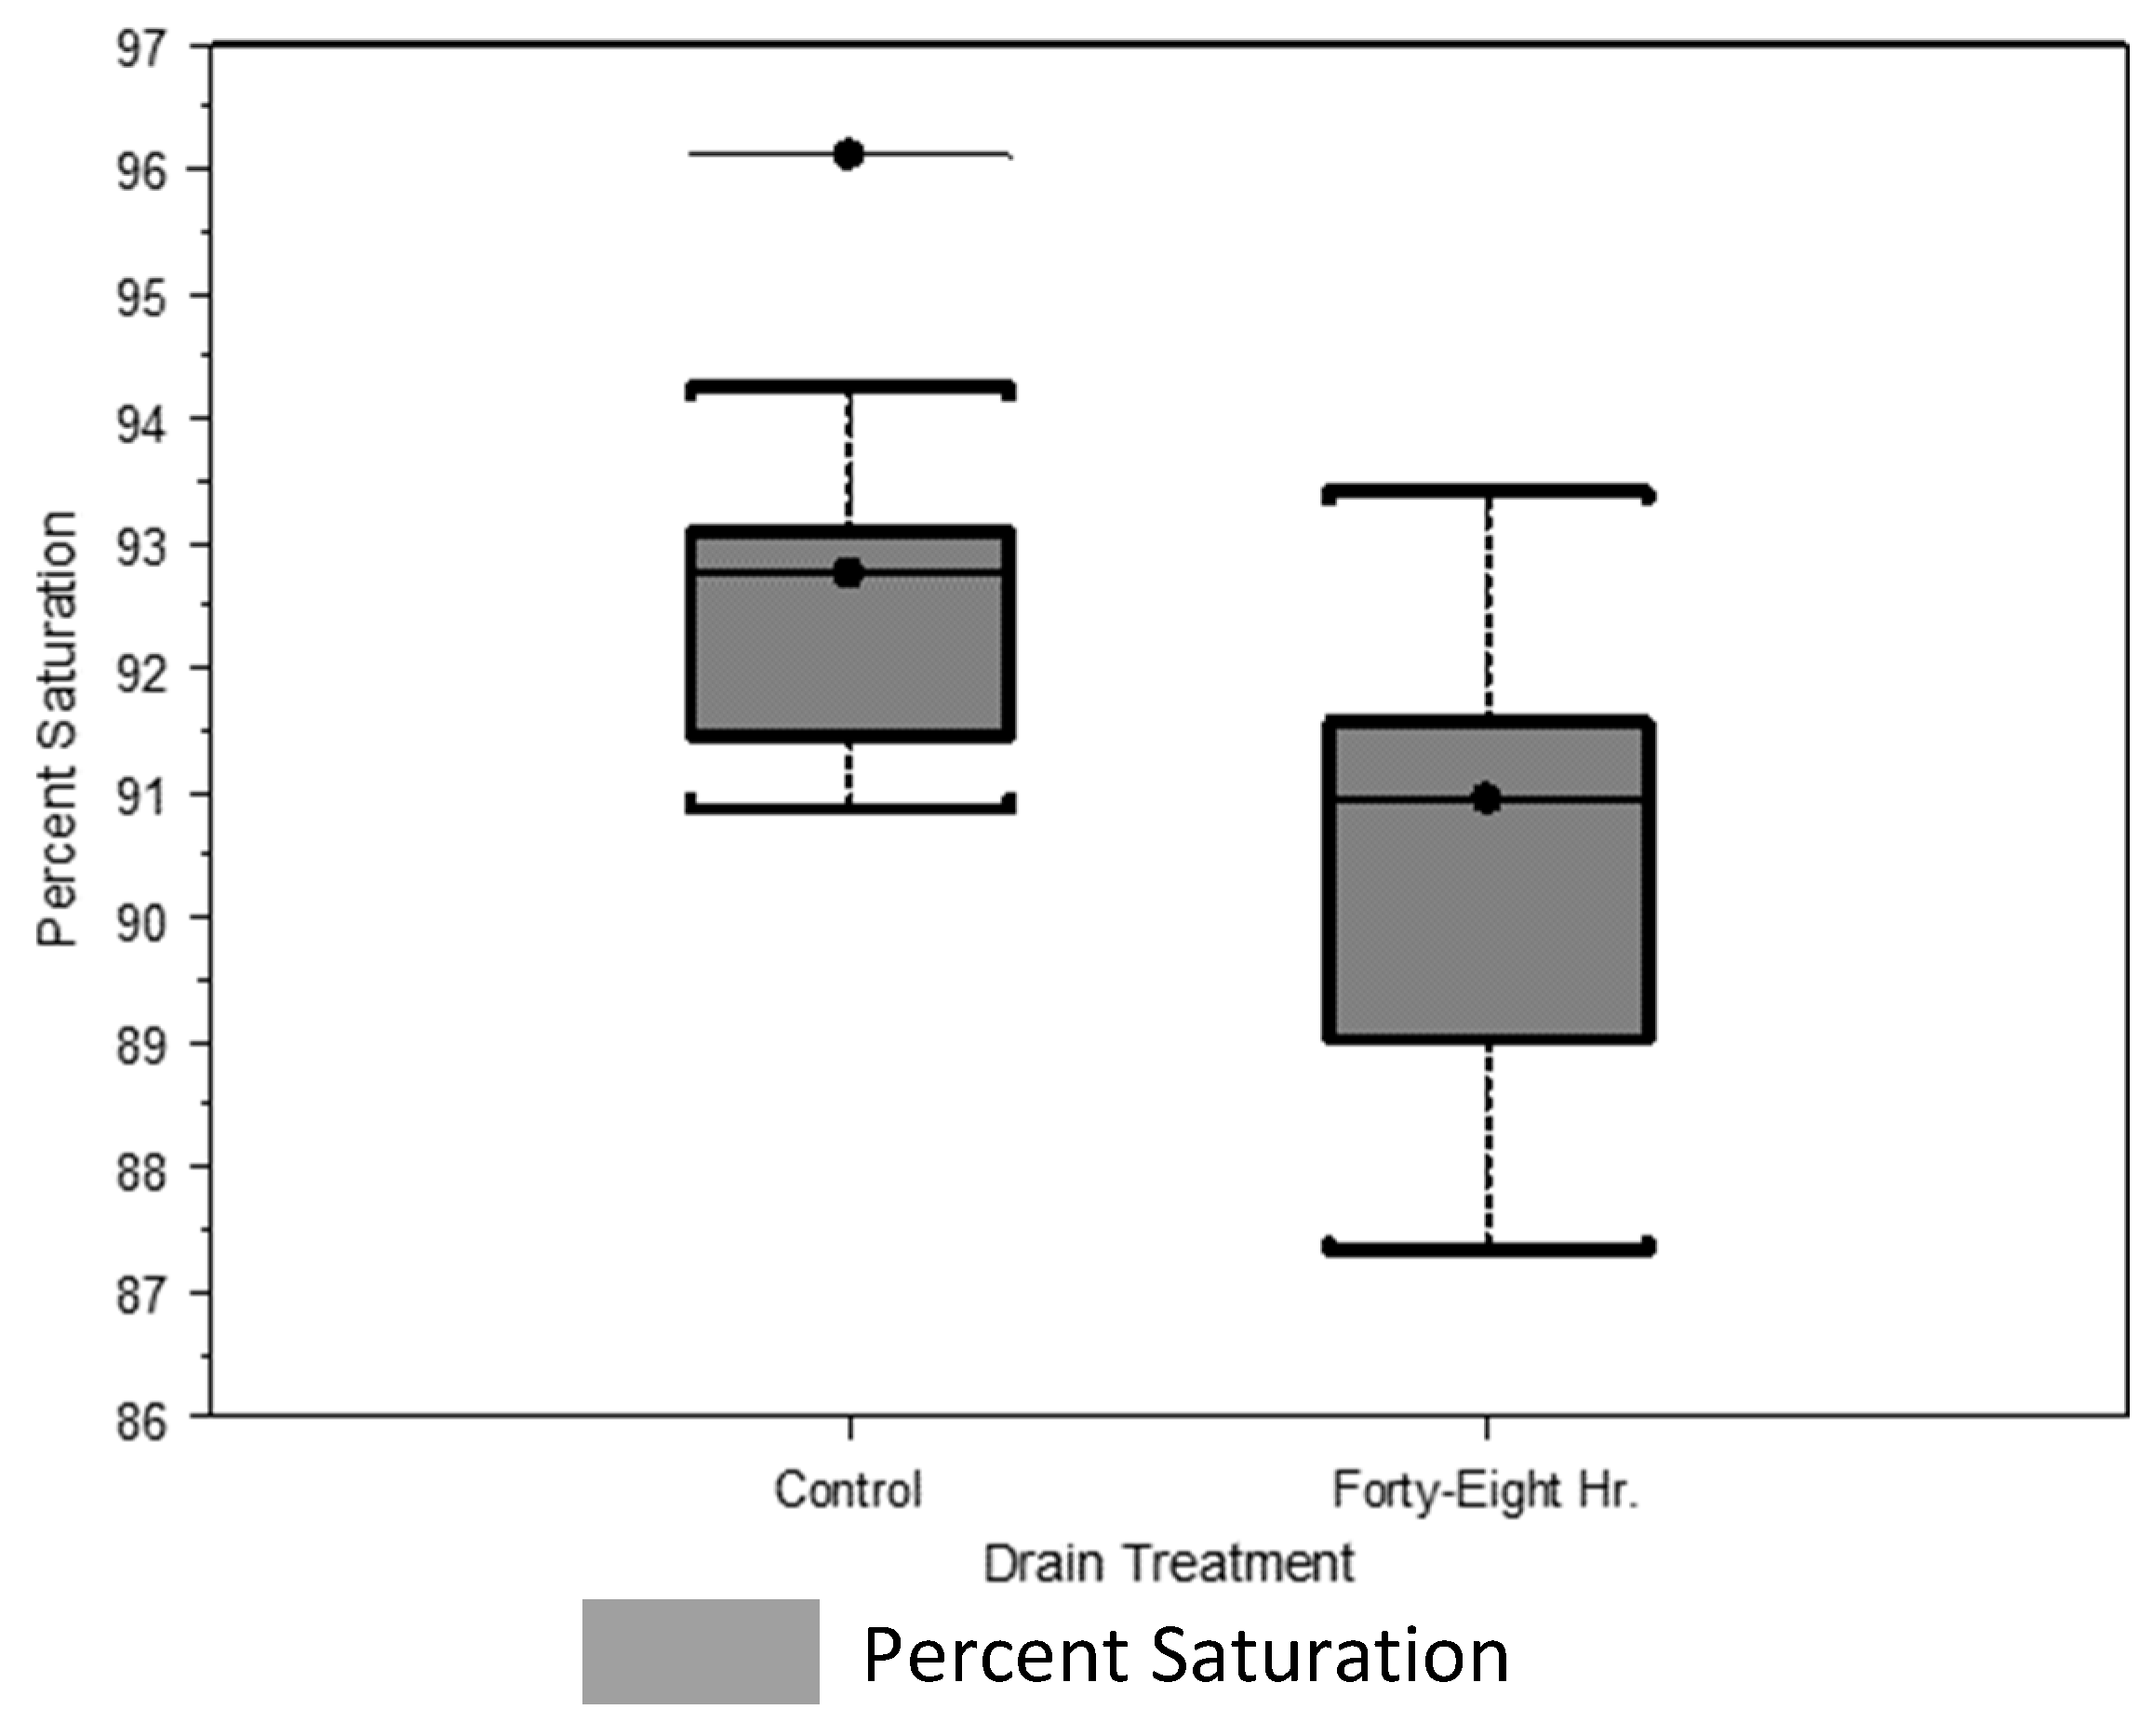
There is a slight reduction in the percent saturation between the control (10 min) and the samples exposed to 48 h of drying at 60.8 kPa (0.6 atmospheres) of suction. The result is a statistically significant difference in the saturation levels between the soil subjected to drying and those tested according to the standard CBR procedure. This decrease is between 93% and 91% saturation. The p-value is 0.0004 (Figure 10). In contrast, the CBR data show no statistically significant difference between the control and the samples exposed to 48 h of drainage at 0.06 atmospheres of suction. The p-value for this comparison is 0.2454 (Figure 11), with both sample populations producing an average CBR value near 16.
As discussed, a subsample was tested to determine each soil type’s air-entry value. The air-entry value quantifies the pressure or suction necessary to dislodge the water from the soil matrix. The air-entry value was between 3 and 6 atmospheres for these SM-ML soils.

4. Discussion

This study’s field and laboratory results showed slight strength recovery in these fine-grained soils on a seasonal and 48 h time scale. The results were similar to those of [13], which showed slight recovery in subgrade strength. These differ from the results of [11]; their results showed more significant improvements in subgrade strength. Thus, there remains uncertainty about how subgrade strength recovers during drying. Similar reports are reported for subgrade saturation. Refs. [14,15] showed a much more substantial decrease in subgrade saturation than our results. There is a need for well-controlled experiments using various soil types and densities.
The two environmental processes determining the drying and, thereby, subgrade soil strength recovery, drainage of liquid water, and evaporation of water vapor cannot significantly change the moisture content of fine-grained soils over a 24 to 48 h time frame.
The migration of moisture in liquid form is limited due to capillary forces that hold the water in these fine-grained soils. It was confirmed by the high air-entry value found for these soils that forces between three and six times the normal atmospheric pressure are necessary to dislodge water from the soils. The moisture release characteristics of compacted fine-grained soils indicate that substantial changes in matric potential result in small changes in moisture content (see Figure 7). Water movement that does occur is slowed due to the low values of hydraulic conductivity found in compacted fine-grained soil.
Water vapor movement is slight due to small temperature changes and low vapor density values. The aggregate layer provides an insulating blanket, resulting in minimal variation in temperature and no airflow, significantly reducing evaporation rates from these soils. The northern aspects of the project site may have limited the energy applied to the road, resulting in low movement in water vapor. A road located on a southern aspect with higher solar radiation may have produced more drying.
The environmental processes controlling subgrade moisture movement and changes in strength are well described in the theories of soil physics. For fine-grained soils, these theories lead us to conclude that there should be little change in subgrade strength in a 24–48 h period or on a seasonal scale. These theories are justified by the study presented here and lead us to conclude that only a tiny amount of water can be removed from subgrade soils due to environmental processes. However, these results were from a single road and lab study. Despite the limited sample size, our results show a similar pattern to many patterns described in the literature reviewed earlier. The pattern is a seasonal pattern of drying, but it does not correspond to an increase in density or its correlation with strength.
Since few changes in subgrade strength occur on a micro and macro scale, the strength in these soils will need to be established during construction. The comparison of the field and laboratory CBR values shows a possible mean soaked CBR value of 16, while the field CBR is approximately half this result, with a value of 8. The laboratory is at 85% of the Proctor test value, while the field compaction is uncontrolled. Thus, a large portion of potential strength in the subgrade needs to be achieved. This results from a need to establish a proper subgrade compaction target and monitor construction to achieve this result.

5. Conclusions

The results from our fine-grained soils showed little change in the subgrade strength or moisture content when subjected to drying. These results may be applicable to fine-grained soils in a Mediterranean climate that are constructed with no control of compaction. Short-duration hauling restrictions may not allow sufficient time for subgrade saturation conditions to improve, and that component of the overall road structure may not improve. Future work should consider designing an experiment with a range of soil types and initial compaction to determine the role construction quality has on a road’s environmental performance. The focus should be to obtain the highest strength possible at the time of construction when moisture content and compaction can be best controlled, as this may be when the subgrade has the highest strength.

Author Contributions

Conceptualization, J.P.; Methodology, K.B., J.P. and A.I.; Formal analysis, K.B. and A.I.; Investigation, K.B., J.P. and A.I.; Writing—original draft, J.P. All authors have read and agreed to the published version of the manuscript.

Funding

This research was funded by Oregon State University.

Data Availability Statement

The data is available on request from the corresponding author.

Conflicts of Interest

There are no conflicts of interests.

References

  1. Boston, K. The Potential Effects of Forest Roads on the Environment and Mitigating their Impacts. Curr. For. Rep. 2016, 2, 215–222. [Google Scholar] [CrossRef]
  2. Heinimann, H. Pavement Engineering for Forest Roads: Development and Opportunities. Croat. J. For. Eng. 2017, 42, 91–106. [Google Scholar] [CrossRef]
  3. Sessions, J.; Boston, K.; Wing, M.; Akay, A.; Theisen, P.; Heinrich, R. Forest Road Operations in the Tropics; Springer: New York, NY, USA, 2007; 166p. [Google Scholar]
  4. Sessions, J.; Boston, K.; Thoreson, R.; Mills, K. Optimal Policies for Managing Aggregate Resources on Temporary Forest Roads. West. J. Appl. For. 2006, 21, 207–216. [Google Scholar] [CrossRef]
  5. Ghosh, G. Effect of soil moisture in analyzing undrained shear strength of compacted clayey soil. J. Civ. Eng. Constr. Technol. 2013, 4, 23–31. [Google Scholar]
  6. Utterback, P.; Moore, T.L.; Kestler, M.A.; Affleck, R. The Effects of Winter Haul on Low Volume Forest Development Roads; US Forest Service, Technology & Development Program: San Dimas, CA, USA, 1995.
  7. Toman, E.M.; Skaugset, A.E. Reducing sediment production from forest roads during wet-weather hauling. Transp. Res. Rec. J. Transp. Res. Board 2011, 2203, 13–19. [Google Scholar] [CrossRef]
  8. Sullivan, K.; Dhakal, A.S.; Kunz, M.J.; Medlin, M.; Griffith, A.; Rossen, R.; Williams, K. Sediment Production from Forest Roads on Humboldt Redwood Company Lands: Study of Erosion Rates and Potential Delivery to Streams; Technical Report; Humboldt Redwood Company: Scotia, CA, USA, 2011; 108p. [Google Scholar]
  9. Li, D.; Selig, E.T. Evaluation of railway subgrade problems. Transp. Res. Rec. 1995, 1489, 17–25. [Google Scholar]
  10. Roslan, N.I.; Ghani, A.N.A.; Hamid, A.A. Road subgrade strength under various flooding events. J. Teknol. 2015, 75, 39–43. [Google Scholar] [CrossRef]
  11. Lary, J.A.; Mahoney, J.P. Seasonal effects on the strength of pavement structures. Transp. Res. Rec. 1984, 954, 88–94. [Google Scholar]
  12. Hanek, G.L.; Truebe, M.A.; Kestler, M.A. Using Time Domain Reflectometry (TDR) and Radio Frequency (RF) Devices to Monitor Seasonal Moisture Variation in Forest Road Subgrade and Base Materials; Technical Report; Technology & Development Program, USDA Forest Service: Washington, DC, USA, 2001.
  13. Linares, J.L. A Case Study: The Performance of Aggregate Surfaced Roads during Wet Weather. Master’s Thesis, Department of Civil Engineering, Oregon State University, Corvallis, OR, USA, 1988. [Google Scholar]
  14. Hinshaw, R.F.; Northrup, J. Predicting Subgrade Moisture under Aggregate Surfacing. Transp. Res. Rec. 1991, 1291, 00611800. [Google Scholar]
  15. Bolander, P. Evaluation of Aggregate-Surfaced Roads for Timber Haul. Transp. Res. Rec. J. Transp. Res. Board 2015, 2473, 116–125. [Google Scholar] [CrossRef]
  16. Truebe, M.A.; Evans, G.L.; Bolander, P. Lowell test road: Helping improve road surfacing design. In Proceedings of the 6th International Conference on Low Volume Roads, Minneapolis, MN, USA, 25–29 June 1995; Volume 2. [Google Scholar]
  17. Foltz, R.B.; Burroughs, E.R., Jr. Sediment Production from Forest Roads with Wheel Ruts; U.S. Department of Agriculture: Forest Service—National Agroforestry Center: Washington, DC, USA, 1990.
  18. Hillel, D. Environmental Soil Physics: Fundamentals, Applications, and Environmental Considerations; Academic Press: Cambridge, MA, USA, 1998. [Google Scholar]
  19. ASTM D (1883-99); Standard Test Method for CBR (California Bearing Ratio) of Laboratory-Compacted Soils. ASTM International: West Conshohocken, PA, USA, 1999.
  20. ASTM D (2325-68); Standard Test Method for Capillary—Moisture Relationships for Coarse and Medium Textured Soils by Porous–Plate Apparatus. ASTM International: West Conshohocken, PA, USA, 1968.
  21. ASTM D (2487-00); Standard Practice for Classification of Soils for Engineering Purposes (Unified Soil Classification System). ASTM International: West Conshohocken, PA, USA, 1996.
  22. ASTM D4429-09a; Standard Test Method for CBR (California Bearing Ratio) of Soils in Place. ASTM International: West Conshohocken, PA, USA, 2009.
  23. Boston, K.; Pyles, M.; Bord, A. Compaction of forest roads in Northwestern Oregon–room for improvement. Int. J. For. Eng. 2008, 19, 24–28. [Google Scholar] [CrossRef]
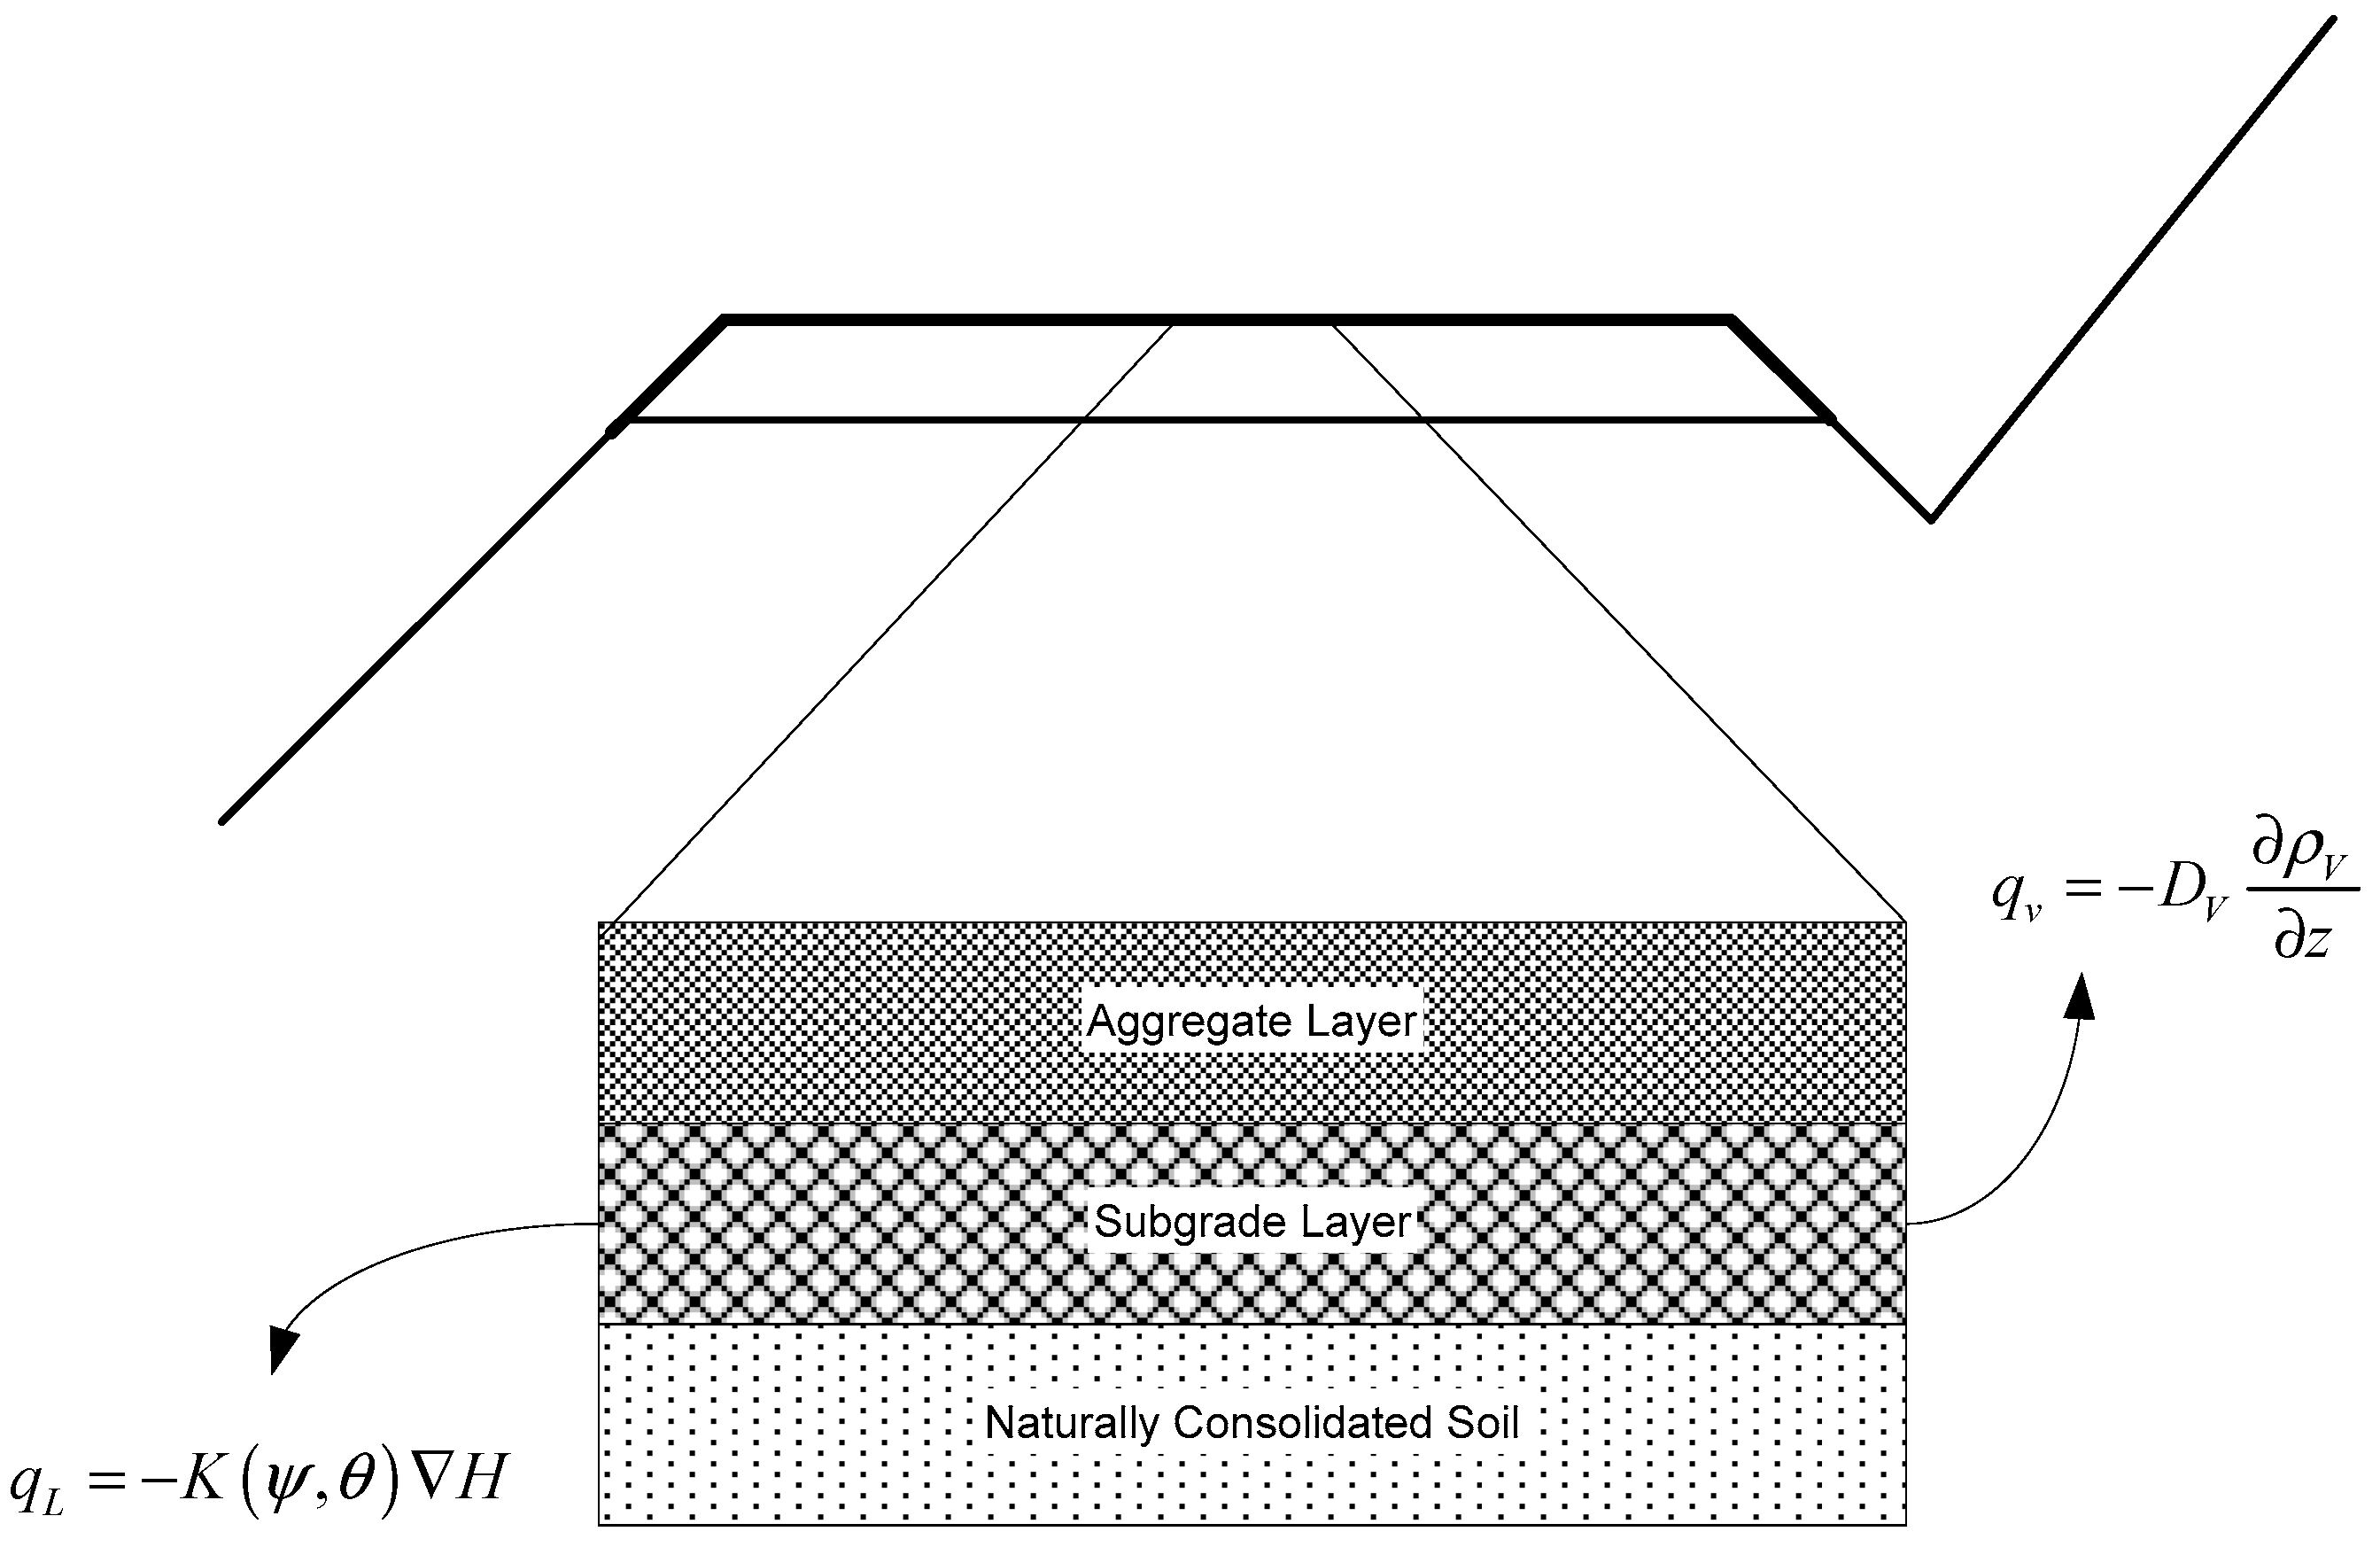
Figure 1. Cross sectional shape of road with description of water movements.
Forests 15 00671 g001
Figure 2. Sampling system for each point on the road.
Forests 15 00671 g002
Figure 3. Sealed CBR mold.
Forests 15 00671 g003
Figure 4. Filed CBR throughout summer sampling period.
Forests 15 00671 g004
Figure 5. Field Clegg impact values (CIVs) throughout summer sampling period.
Forests 15 00671 g005
Figure 6. Subgrade moisture content from road during sampling period.
Forests 15 00671 g006
Figure 7. Moisture release curve various pressure levels.
Forests 15 00671 g007
Figure 8. Temperature curves at aggregate and surface temperatures.
Forests 15 00671 g008
Figure 9. Density measurements for control and tests specimens.
Forests 15 00671 g009
Figure 10. Percent saturation for control and test specimens.
Forests 15 00671 g010
Figure 11. CBR values for control and test specimens.
Forests 15 00671 g011
Disclaimer/Publisher’s Note: The statements, opinions and data contained in all publications are solely those of the individual author(s) and contributor(s) and not of MDPI and/or the editor(s). MDPI and/or the editor(s) disclaim responsibility for any injury to people or property resulting from any ideas, methods, instructions or products referred to in the content.