Article

A Study on the Characteristics and Influencing Factors of Soundscape Perception in Landscape Spaces of Urban Greenways

College of Landscape Architecture and Art, Fujian Agriculture and Forestry University, Fuzhou 350108, China
*
Author to whom correspondence should be addressed.
Forests 2024, 15(4), 670; https://doi.org/10.3390/f15040670
Submission received: 6 March 2024 / Revised: 31 March 2024 / Accepted: 3 April 2024 / Published: 8 April 2024
(This article belongs to the Section Urban Forestry)

Abstract

:
The acoustic landscape directly affects people’s perceptual experience, which is crucial to enhancing urban greenways’ visibility experience. This study analyzed data from three typical urban greenways in Fuzhou City. By classifying and combining the landscape space into two levels of “enclosure–coverage”, the space was categorized into six types: covered, uncovered, open, semi-open, semi-enclosed, and enclosure space. We explored the characteristics of soundscape perception and the factors affecting the evaluation of soundscape perception in different landscape spaces. The results showed that differences in sound sources between day and night led to differences in the soundscape of different spatial types. The sound pressure level decreased with an increasing degree of enclosure and coverage. The evaluation scores of sound source perception and soundscape perception were significantly different in different degrees of spatial enclosure and coverage, where the open space and covered space were the most sensitive to sound, and the open space played a positive role in enhancing the harmony of the artificial sound. Pleasantness and richness were the main factors influencing overall perception, contributing 50% and 17%, respectively. Visitors’ age, residence type, and visit frequency were the main factors affecting the evaluation of soundscape perception. The conclusions provide a reference and data for improving urban greenways’ soundscape quality.

1. Introduction

With the rapid advancement of urbanization, environmental problems are becoming more prominent, residents’ demand for an urban natural environment is becoming increasingly persistent, and urban greenways have been rapidly developed [1,2]. An urban greenway is a multi-functional green corridor network formed by linking various natural or artificial elements in the urban spatial environment [3], which is essential for the city’s ecological protection and optimization, leisure and recreation development, and chronic transportation [4,5]. Urban greenways can better serve residents’ recreation and fitness needs and become an essential place for urban residents’ daily leisure activities [6]. Therefore, it is crucial to enhance the visiting experience of urban greenways.
Current research on the urban environment has gradually progressed from the visual landscape to multi-dimensional senses in which the acoustic landscape, as an essential part of the urban landscape, has an excellent restorative effect on the public’s psychological perception and health benefits [7,8,9,10]. A soundscape refers to “the acoustic environment that an individual or group perceives, experiences or understands in the environment under a specific scene”, and the soundscape has gradually been paid attention to by scholars as an important factor affecting human life and behavioral habits. The research objects of soundscape perception characteristics are mainly different spatial environments, such as parks, green spaces, neighborhoods, classrooms, etc. [11,12,13,14,15]. For example, Zhang X et al. found that changes in soundscape dimensions in the urban plaza space can help improve soundscape comfort [16]. Xie, H et al. found that the soundscape of historic districts mainly consists of artificial sounds of folk activities, sounds of street vendors, and natural sounds, such as running water and birdsong [17]. Liu, J et al. found that soundscape pleasantness and eventfulness in historic districts positively affect the historical and modern landscapes, respectively [18]. F. Ruotolo et al. found that green parks accompanied by natural sounds were preferred [19]. Nikhil Bhandari et al. found that poor acoustic conditions in the classroom could interfere with effective teaching and learning [20]. However, few studies on soundscape perception in ribbon green spaces, such as urban greenways, have been conducted to date.
In the study of urban greenways, their grid pattern, landscape design and evaluation, greenway vegetation, and the land use status of neighboring areas play an essential role in urban construction and development [21,22,23,24]. Many scholars have researched this issue [25,26,27]. Fan SS et al. studied the landscape structure and network characteristics of the Guangzhou urban greenway system and analyzed the possible impact of natural and socio-economic factors on the construction of urban greenways [3]. Teng MJ et al. developed an innovative method for analyzing a multifunctional urban greenway network based on remote sensing and a geographic information system [5]. Iran J.C. Lopes et al. provided recommendations for the construction of urban greenway networks based on the MCR methodology for building sustainable green space systems in cities [28]. Junga Lee et al. found that people preferred vegetation-rich environments in urban greenways [6]. Samuel J. Keith et al. found that motivation to socialize, de-stress, and enjoy nature facilitated longer greenway trips [26]. Urban greenways connect diverse landscape spaces through linear natural elements, essential constitutive factors that give urban greenways multiple characteristics, such as connectivity, permeability, radiation, and versatility. However, more studies must be performed on the spatial characteristics of the landscape shaped by greenways and their impacts on visitors. Scholars use various types of plant forms, specifications, etc. to create distinctive landscape spaces, combining the three levels of “base–enclosure–cover” and the three materials of “water–plants–construction surface” to form 17 types of landscape space, such as architectural surface base open space [29]. There are differences in the effects of different landscape space types on users’ soundscape perception [30,31]; for example, soundscape perception was rated well in open and covered spaces [30]; social and natural sound perception was most significant in semi-open and semi-enclosed spaces [29]; and covered spaces were most negatively affected by specific sound sources in urban parks [31]. Partially open or dense green spaces were considered the quietest and most welcoming environments [32]. Open space facilitated acoustic comfort [33]. The character and quality of the soundscape of a site directly affect visitors’ satisfaction with the site [34]. Therefore, exploring the soundscape perception characteristics of different landscape spaces in urban greenways is essential to enhance visitors’ recreational experience.
This study takes three typical urban greenways in Fuzhou City as an example, breaks through the traditional way of dividing the landscape space by plants, classifies urban greenway landscapes more comprehensively at the level of “coverage–enclosure”, collects subjective and objective data within different types of landscape spaces, and analyzes these data through data measurements of physical acoustic parameters, statistical analysis of questionnaire data, and other methods. The objective attributes and perceptual characteristics of the soundscape in urban greenways are analyzed from different dimensions. The influence of demographic and sociological factors on the perceptual characteristics of sound sources and the soundscape in urban greenways is explored. Then, the perception and preference differences are determined to provide a theoretical basis for constructing and developing urban greenways. The specific questions of this study are the following:
  • How are soundscapes in urban greenways characterized?
  • What are the characteristics of sound source and soundscape perception in different landscape spaces in urban greenways?
  • What are the factors influencing soundscape perception in different types of landscape spaces in urban greenways?

2. Data Sources and Processing

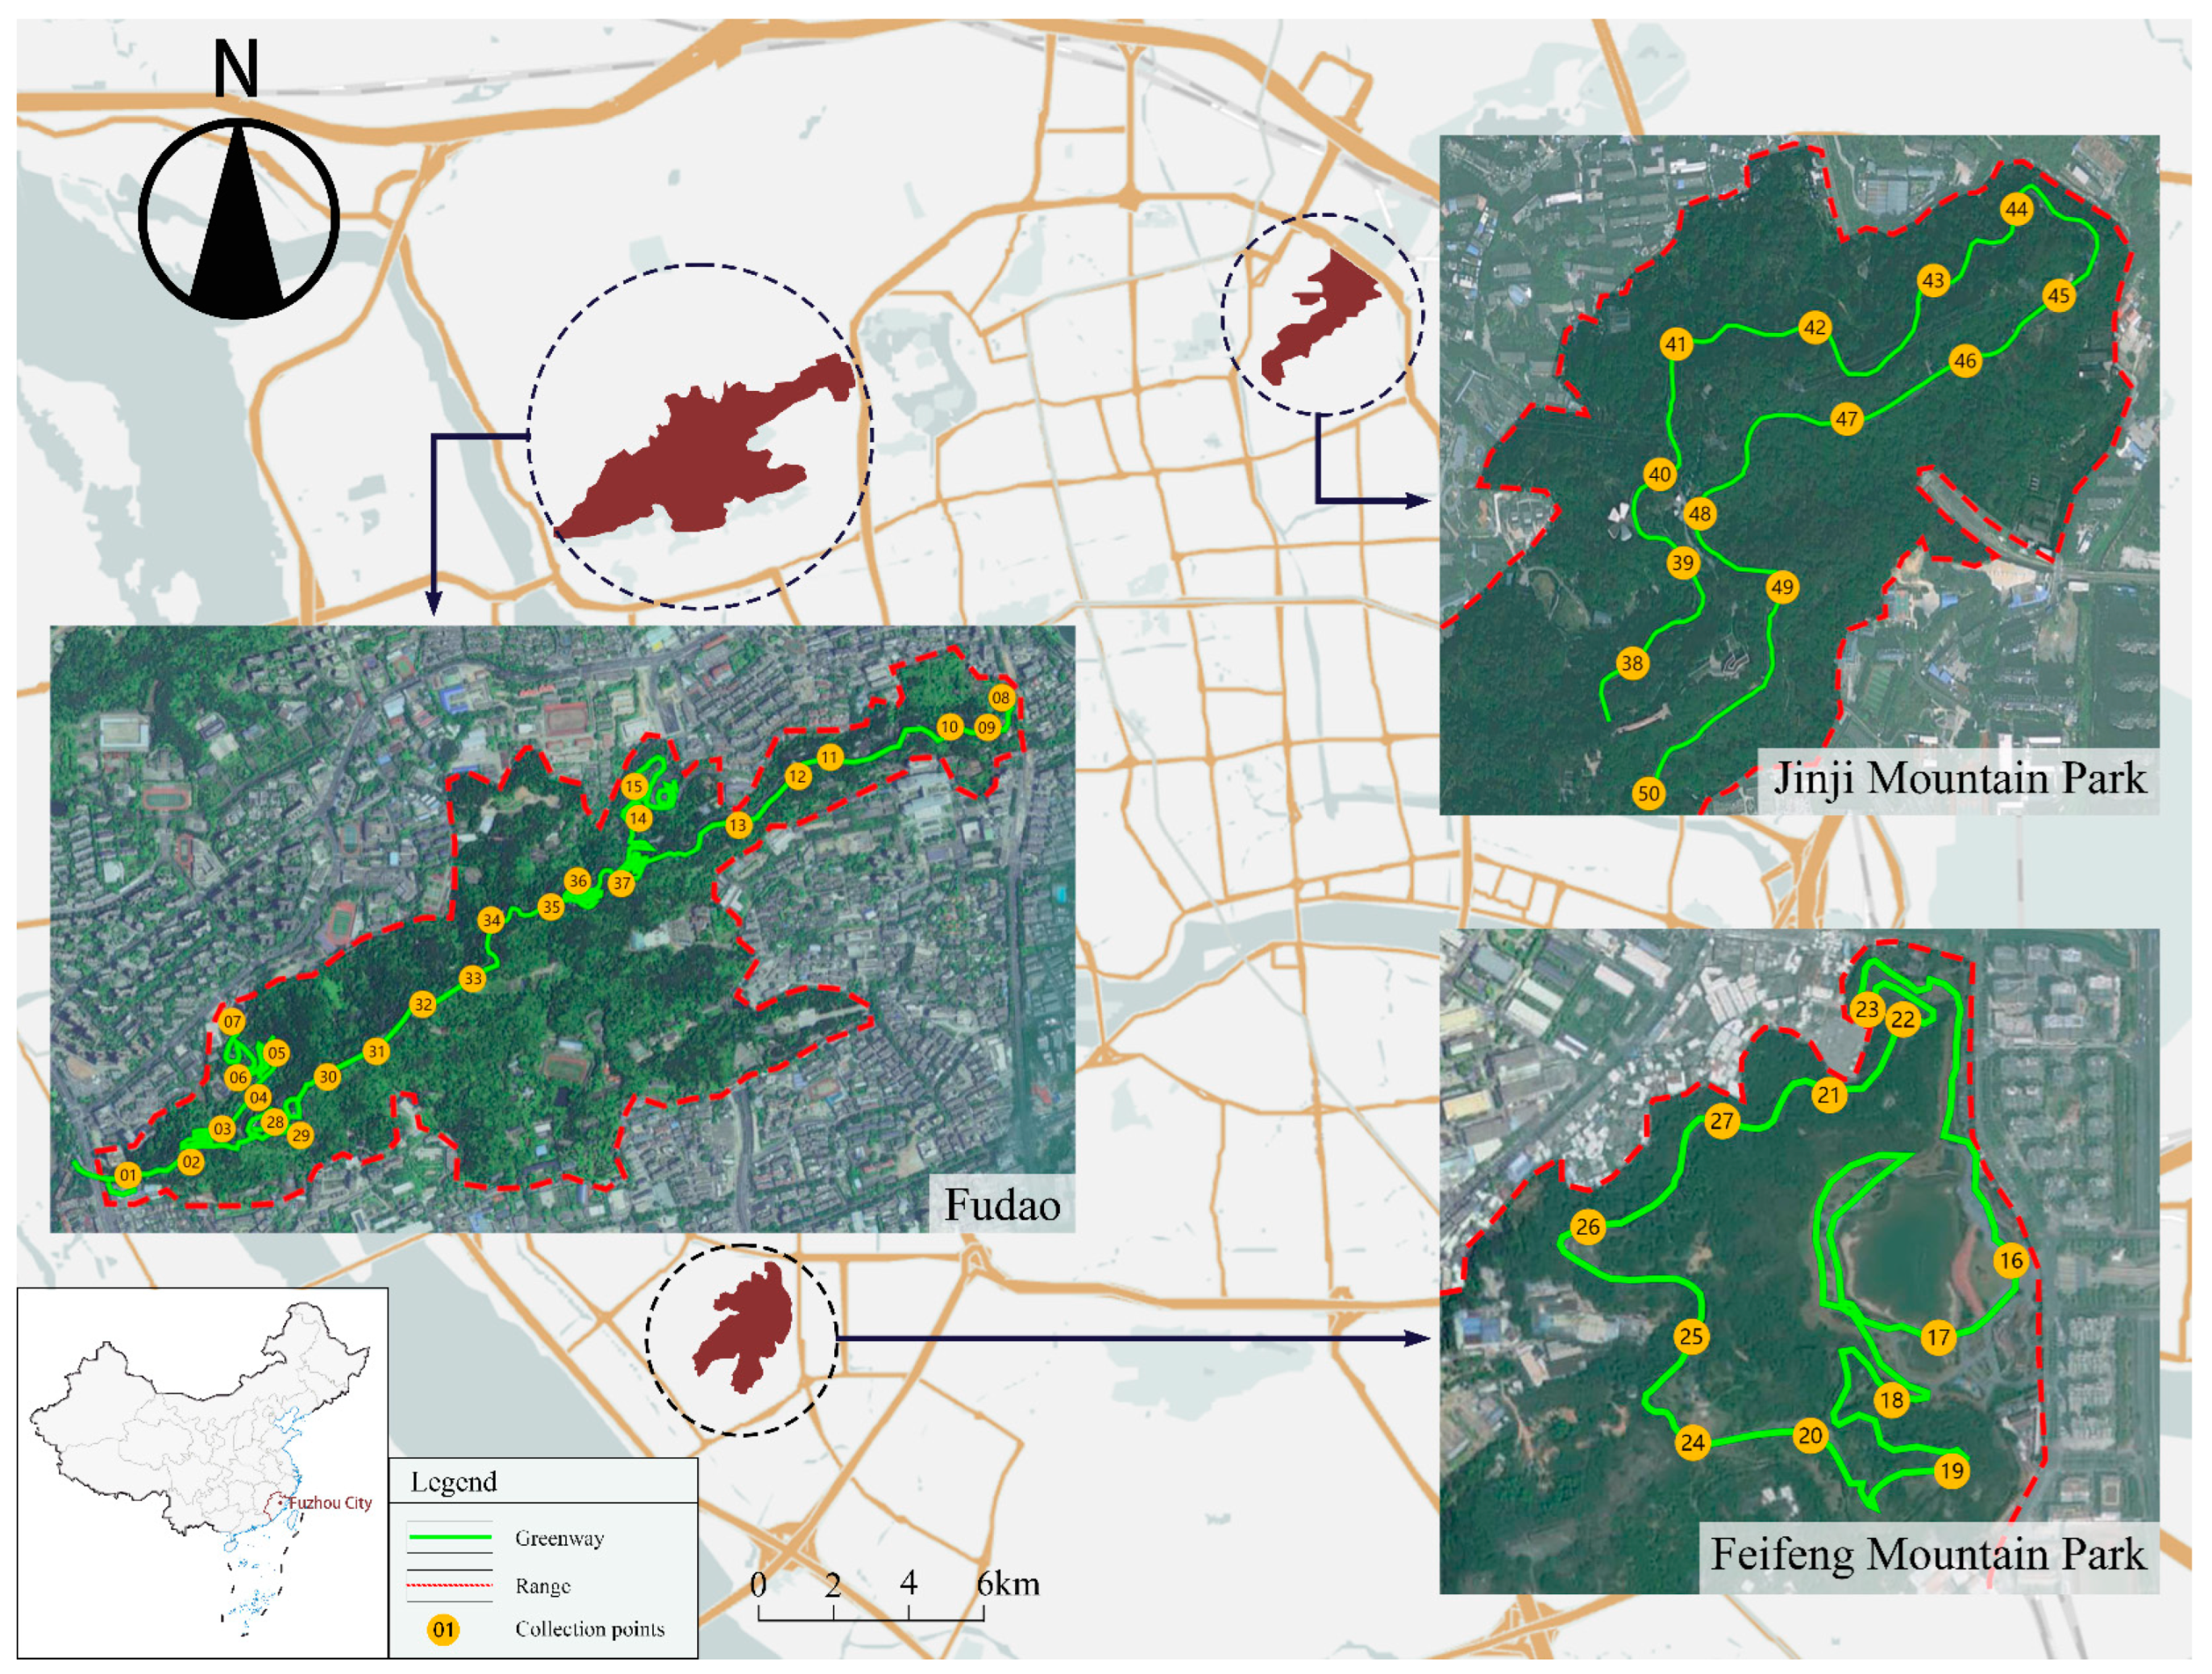
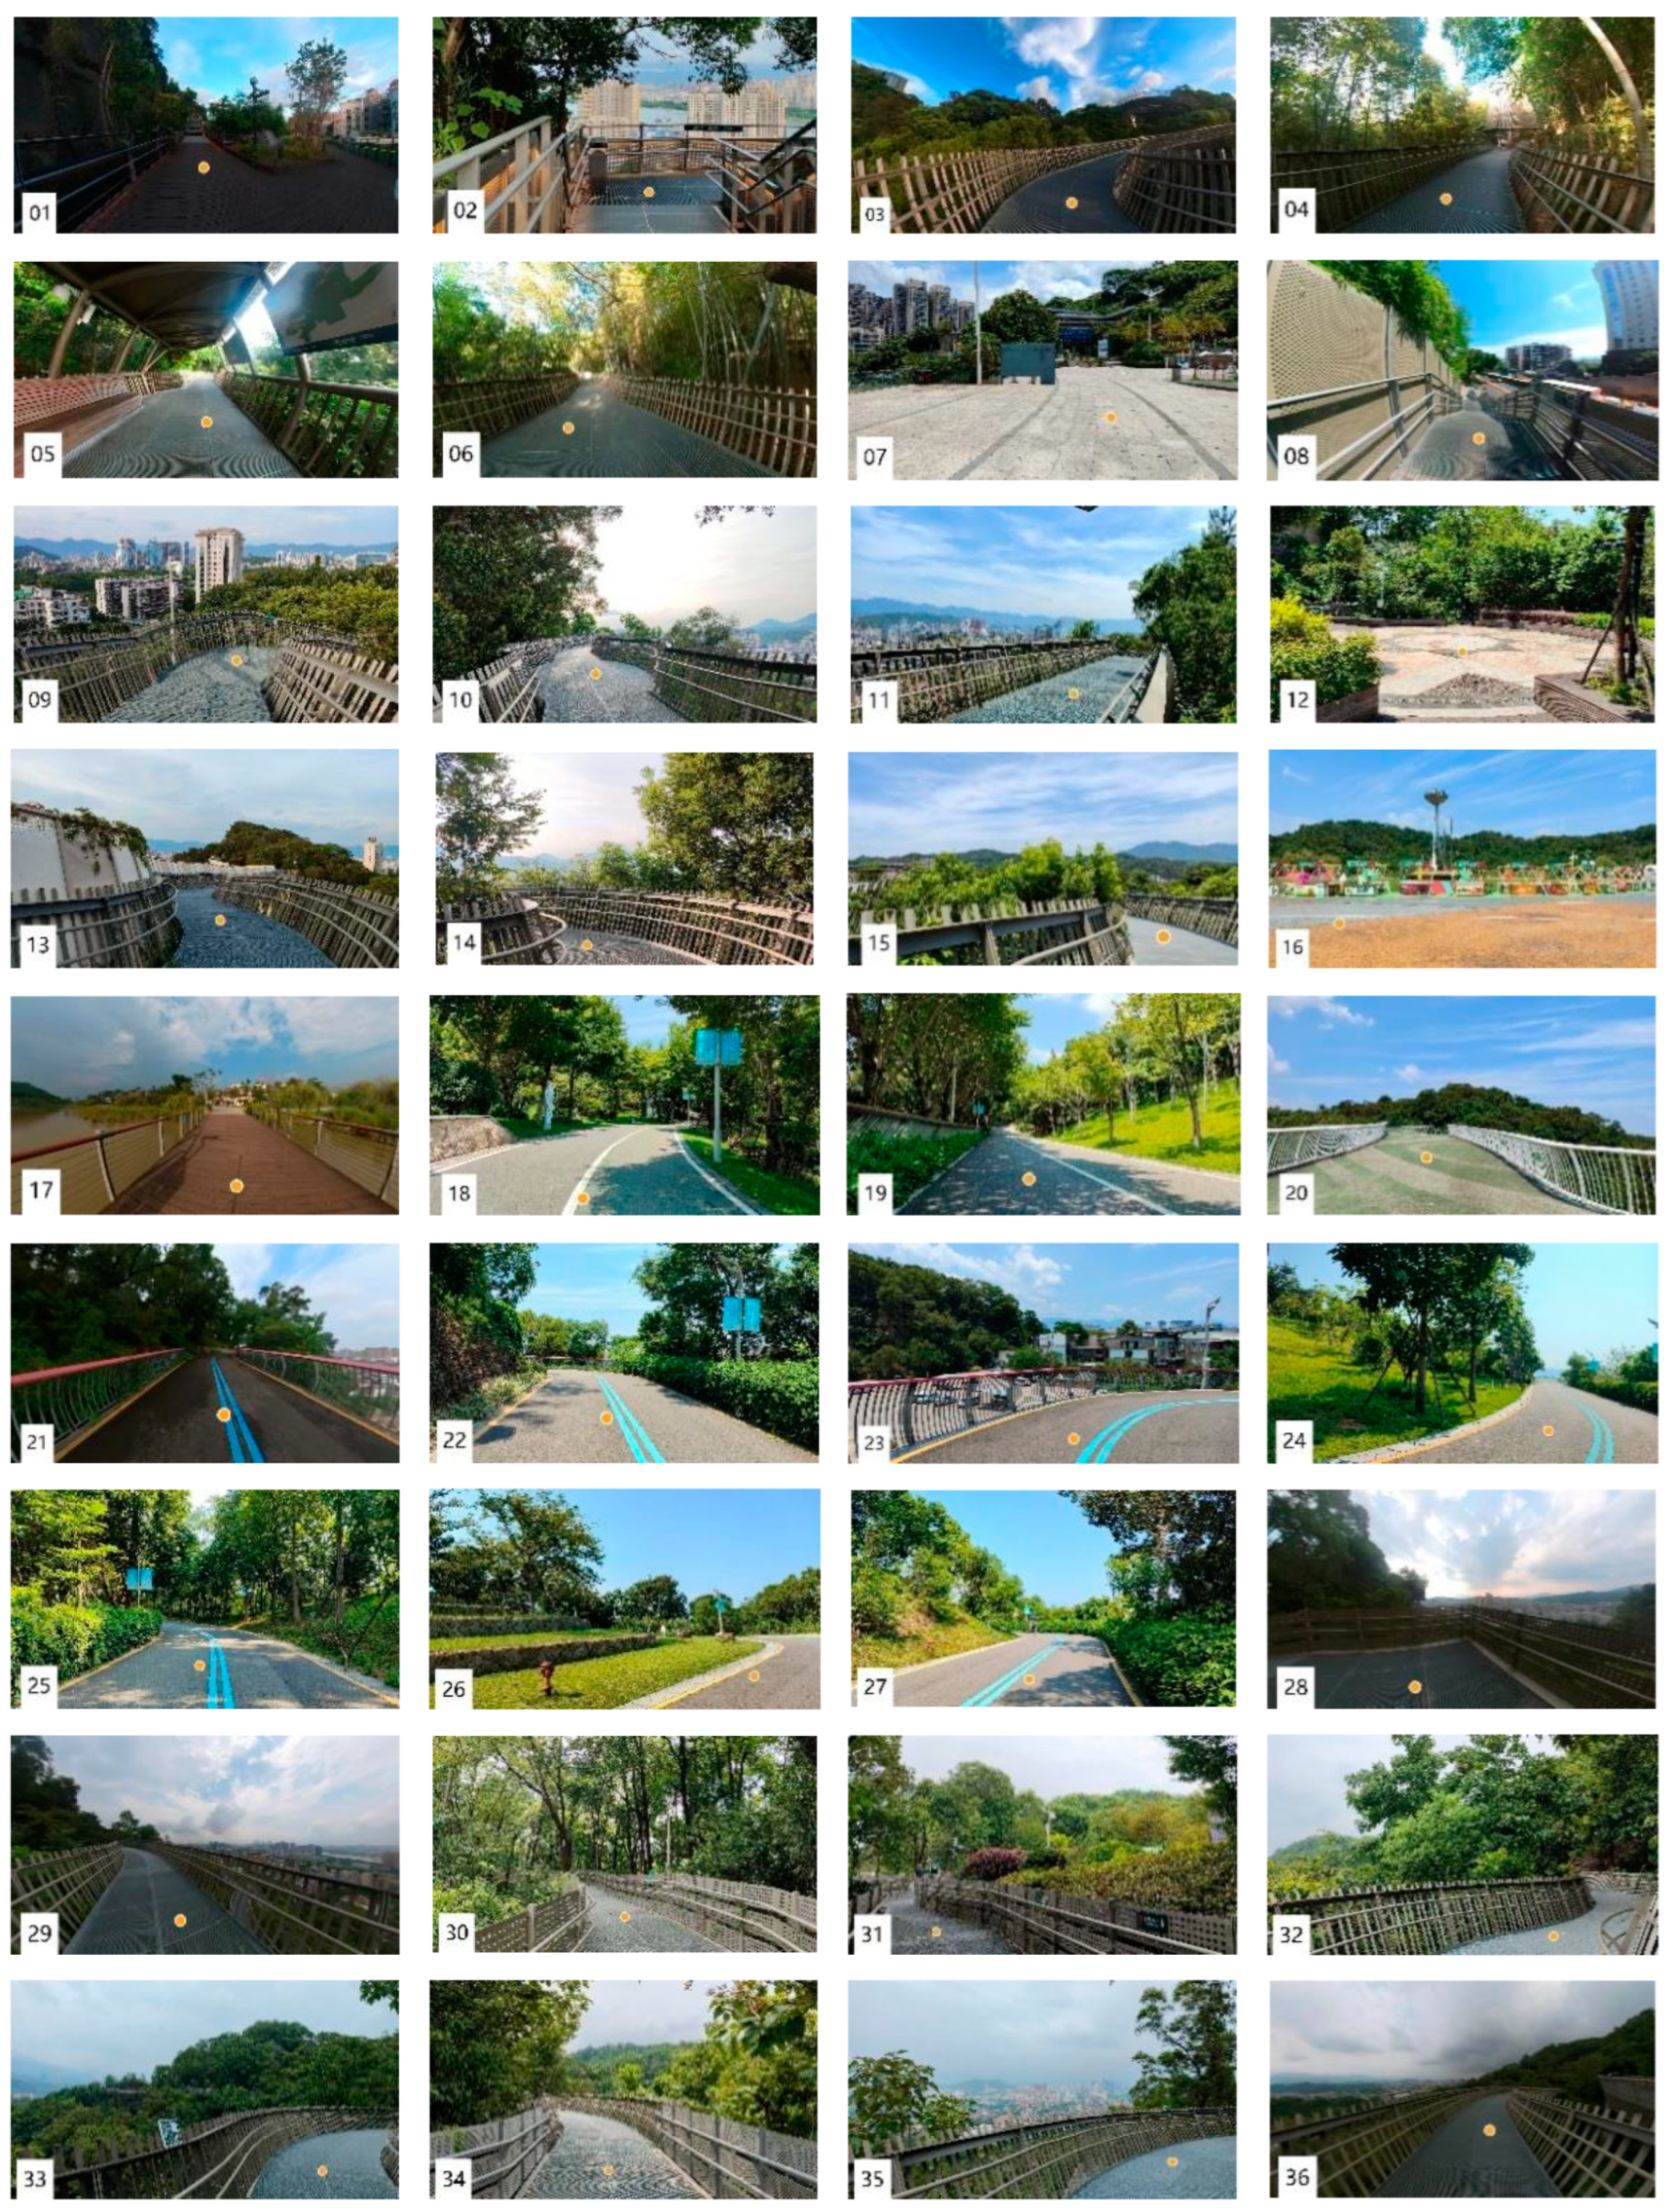
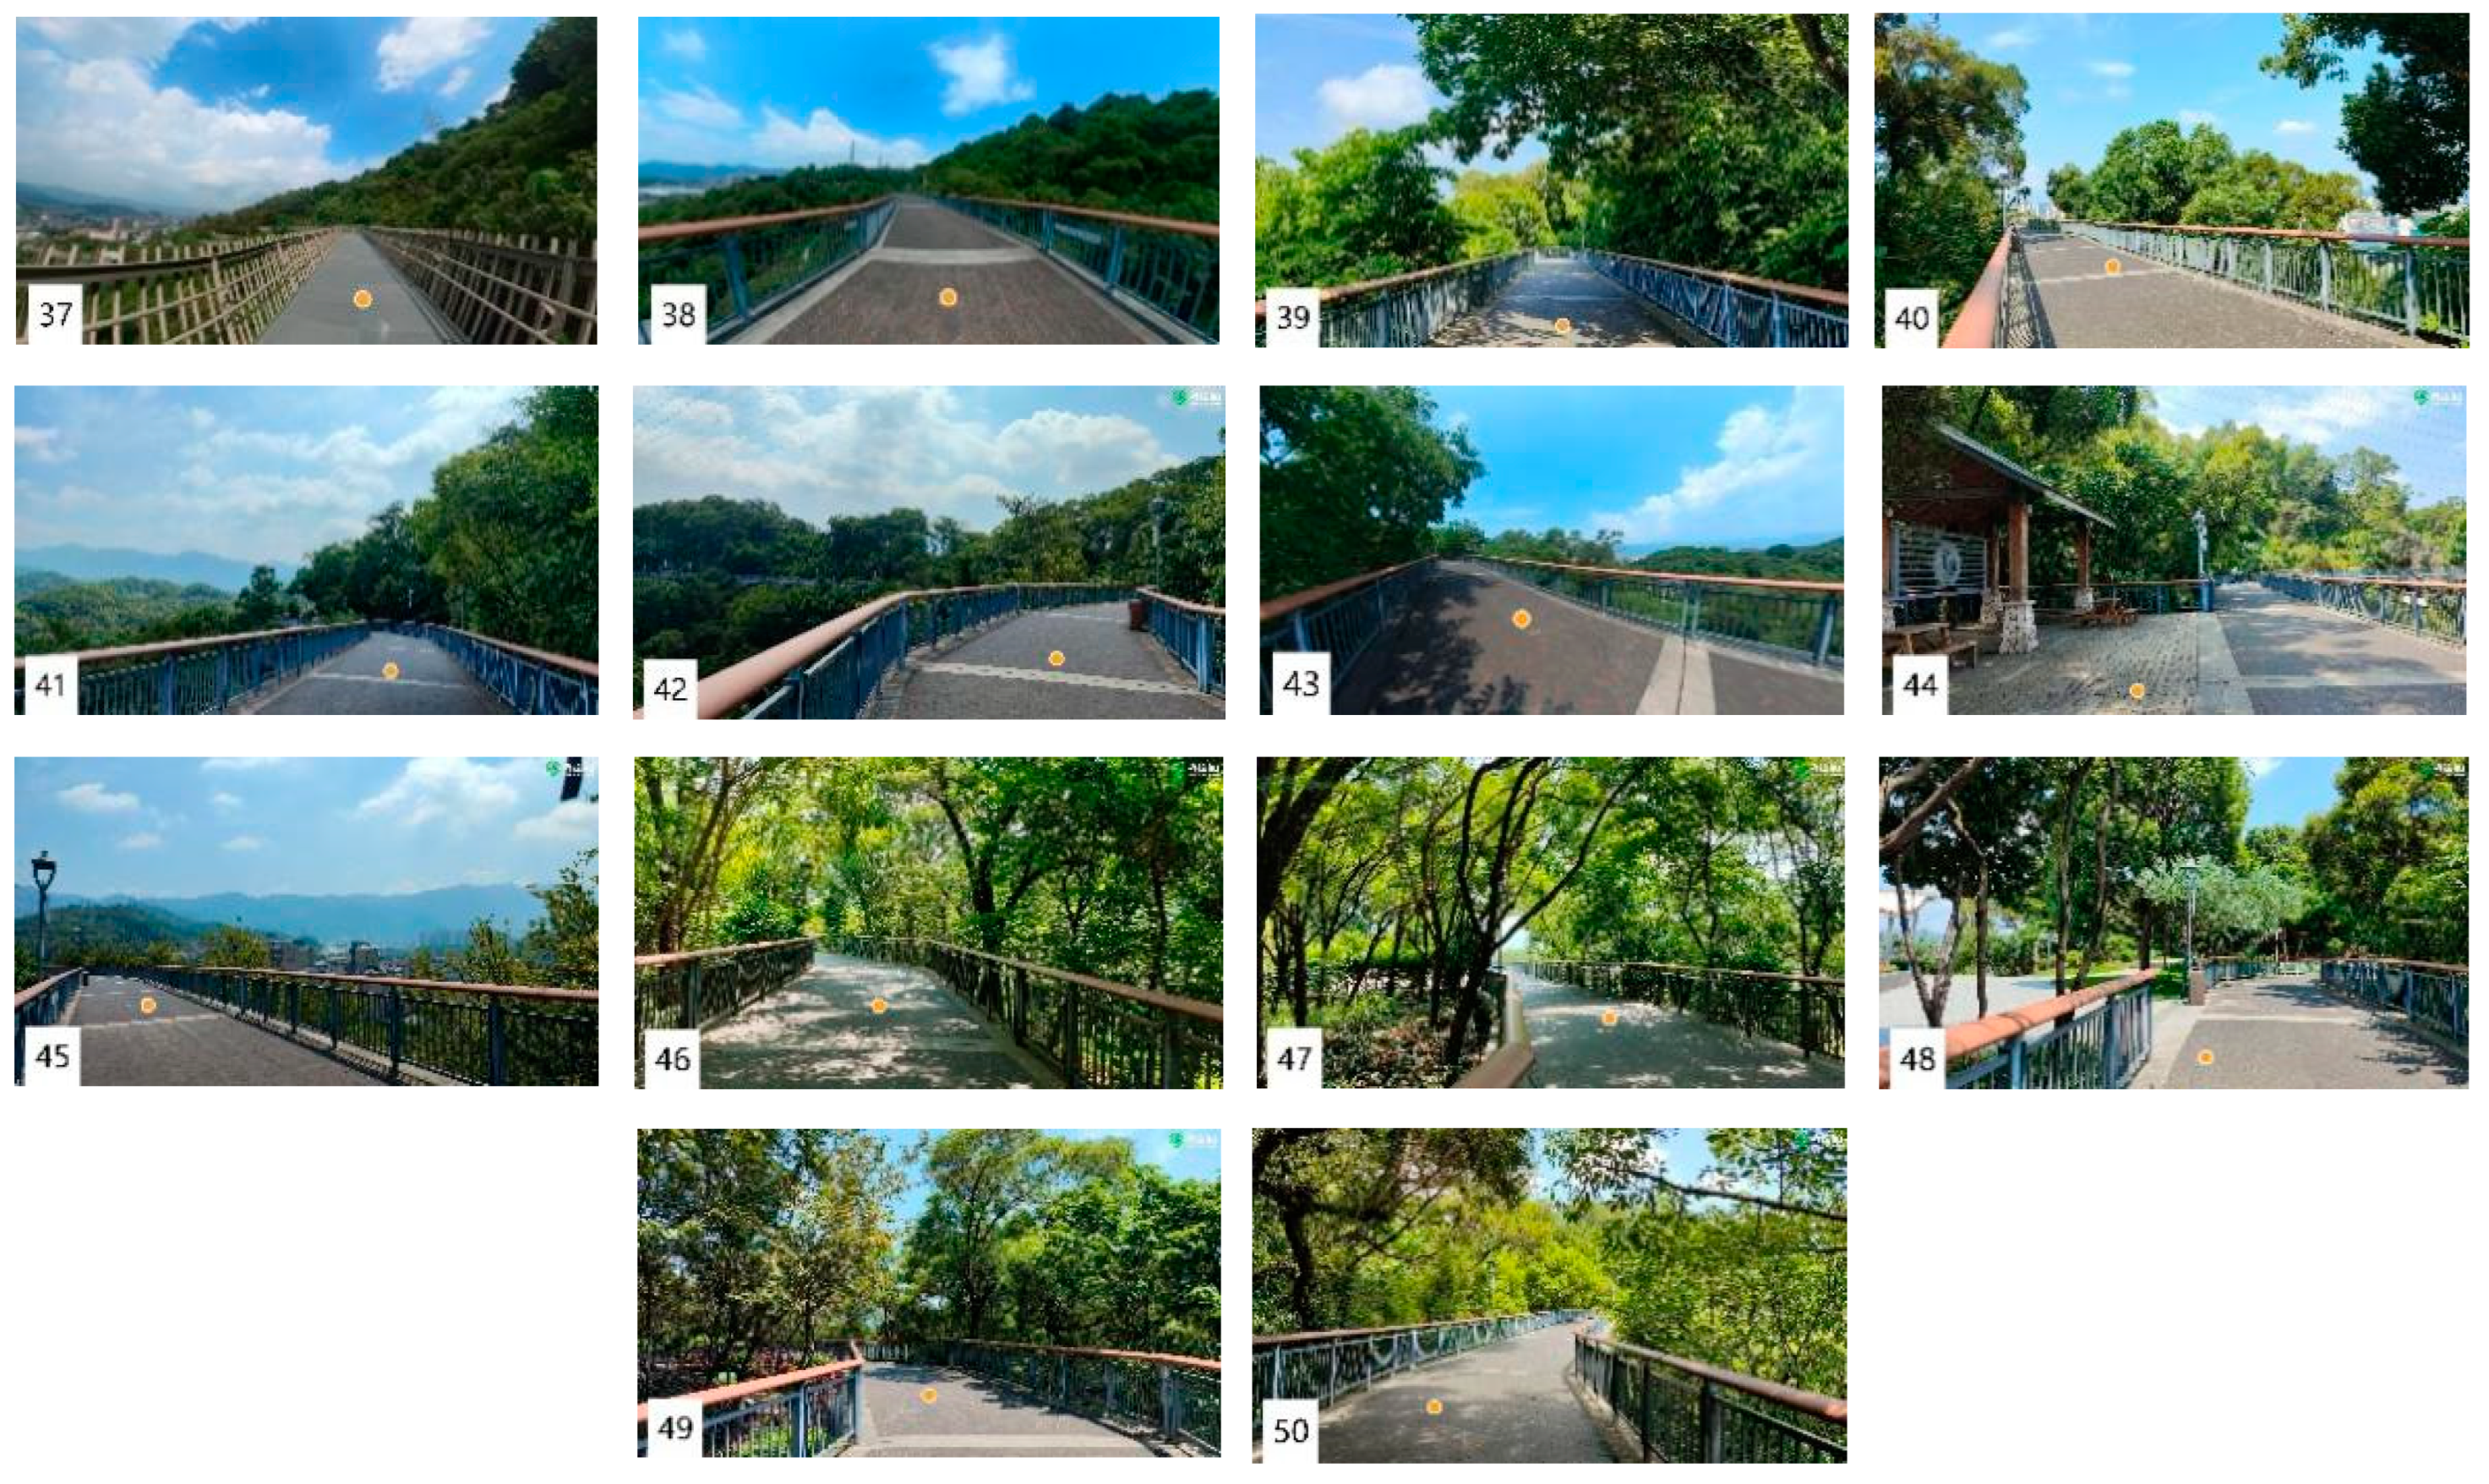
2.1. Sample Site Selection

Located on the East China Sea coast, Fuzhou is the capital of Fujian Province, with a population of more than 8.4 million people, and it has a massive demand for urban recreational space. Fuzhou emphasizes constructing an “urban slow walking system” and an “urban community ten-minute fitness circle”. In this study, three typical urban green spaces were selected as case study sites, namely, Fuzhou Urban Forest Trail (“Fu Dao”), Jinji Mountain Park City View Trail (“Jinji Mountain Trail”), and Feifeng Mountain Olympic Park Health Trail (“Feifeng Mountain Trail”) (Figure 1). All three greenways are characterized by free access, abundant space, and high foot traffic; they also differ in size, location, and environment and cover Fuzhou’s main types of greenways. Fudao, with a length of 19 km, is located in the center of the city and is a crown forest trail; Jinji Mountain Trail has a length of 3.4 km, is located in the center of urban traffic, and provides an overview of the city forest trail; Feifeng Mountain Trail, with a length of 4.2 km, is located on the outskirts of the city. It is a wetland forest trail, and the trail weaves around the mountain, the lake, and the buildings. The selected measurement points meet the accessibility and typical characteristics to ensure the correct functional space, landscape, and spatial scale differences; to ensure that the spacing between two adjacent measurement points is more significant than 100 m; to ensure that the spatial distribution is relatively uniform; and to ensure that the specific locations of the measurement points are correct, as in Figure 1.
Through the preliminary pilot survey, the typical sound sources of the greenway were recorded and categorized into three categories (natural sound (biological and geophysical sound), artificial sound (human sound), and mechanical sound (sound made by machinery)) [35], with a total of eleven typical sound sources (Table 1), which were used as the essential information for the subsequent public questionnaire survey.

2.2. Questionnaire Design

The questionnaire for this study was conducted in three selected urban greenway areas. The questionnaire was designed to be divided into three main sections (Supplementary Materials, File S1), the first of which was a survey of the respondents’ basic information related to gender (male and female), age (<18, 18–24, 25–30, 31–40, 41–50, 51–60, 61–70, and >70 years of age), educational attainment (junior high school or below, senior high school or secondary school, bachelor’s degree or college, and postgraduate student and above), occupation (tradesperson, student, not working), whether they feel stress in their lives (tiny, a little bit, average, a lot, very much), type of residence (foreign tourists, local tourists, neighboring residents), frequency of visits (multiple times per week, once per week, once per month, two to four times per month, one time in several months, first time), and length of visit (less than 1 h, 1–2 h, 2–3 h, 3–4 h, half a day, and more). The statistical information of the survey results is shown in Figure 2.
In the second part, respondents were asked to evaluate their perceptions of the various types of sound sources in the greenway in which they were located, including three aspects of perceived frequency, perceived strength, and preference, which were evaluated using the following 5-point scales: Perceived Frequency Scale, with contents of 1—very infrequent, 2—quite infrequent, 3—average, 4—quite frequent, 5—very frequent; Perceived Strength Scale, with contents of 1—extremely weak, 2—quite weak, 3—average, 4—quite strong, 5—extremely strong; and Preference Scale, with contents of 1—extremely disliked, 2—quite disliked, 3—average, 4—favored, 5—extremely favored [36].
The third part asked respondents to provide an overall evaluation of the soundscape perception of their greenway space. In soundscape evaluation, semantic differentials are often used to identify critical factors in soundscape features to assess soundscape quality [37,38]. Pleasantness and eventfulness are the main components of soundscape perception [39]. In this study, these two main components were measured using six indicators containing pleasantness, harmony, comfort, richness, change, and quietness [31,40,41], which were also evaluated using a 5-point scale, and the content of the perceptual evaluation scale was 1—strongly disapprove, 2—more disapprove, 3—average, 4—more approve, and 5—strongly approve.

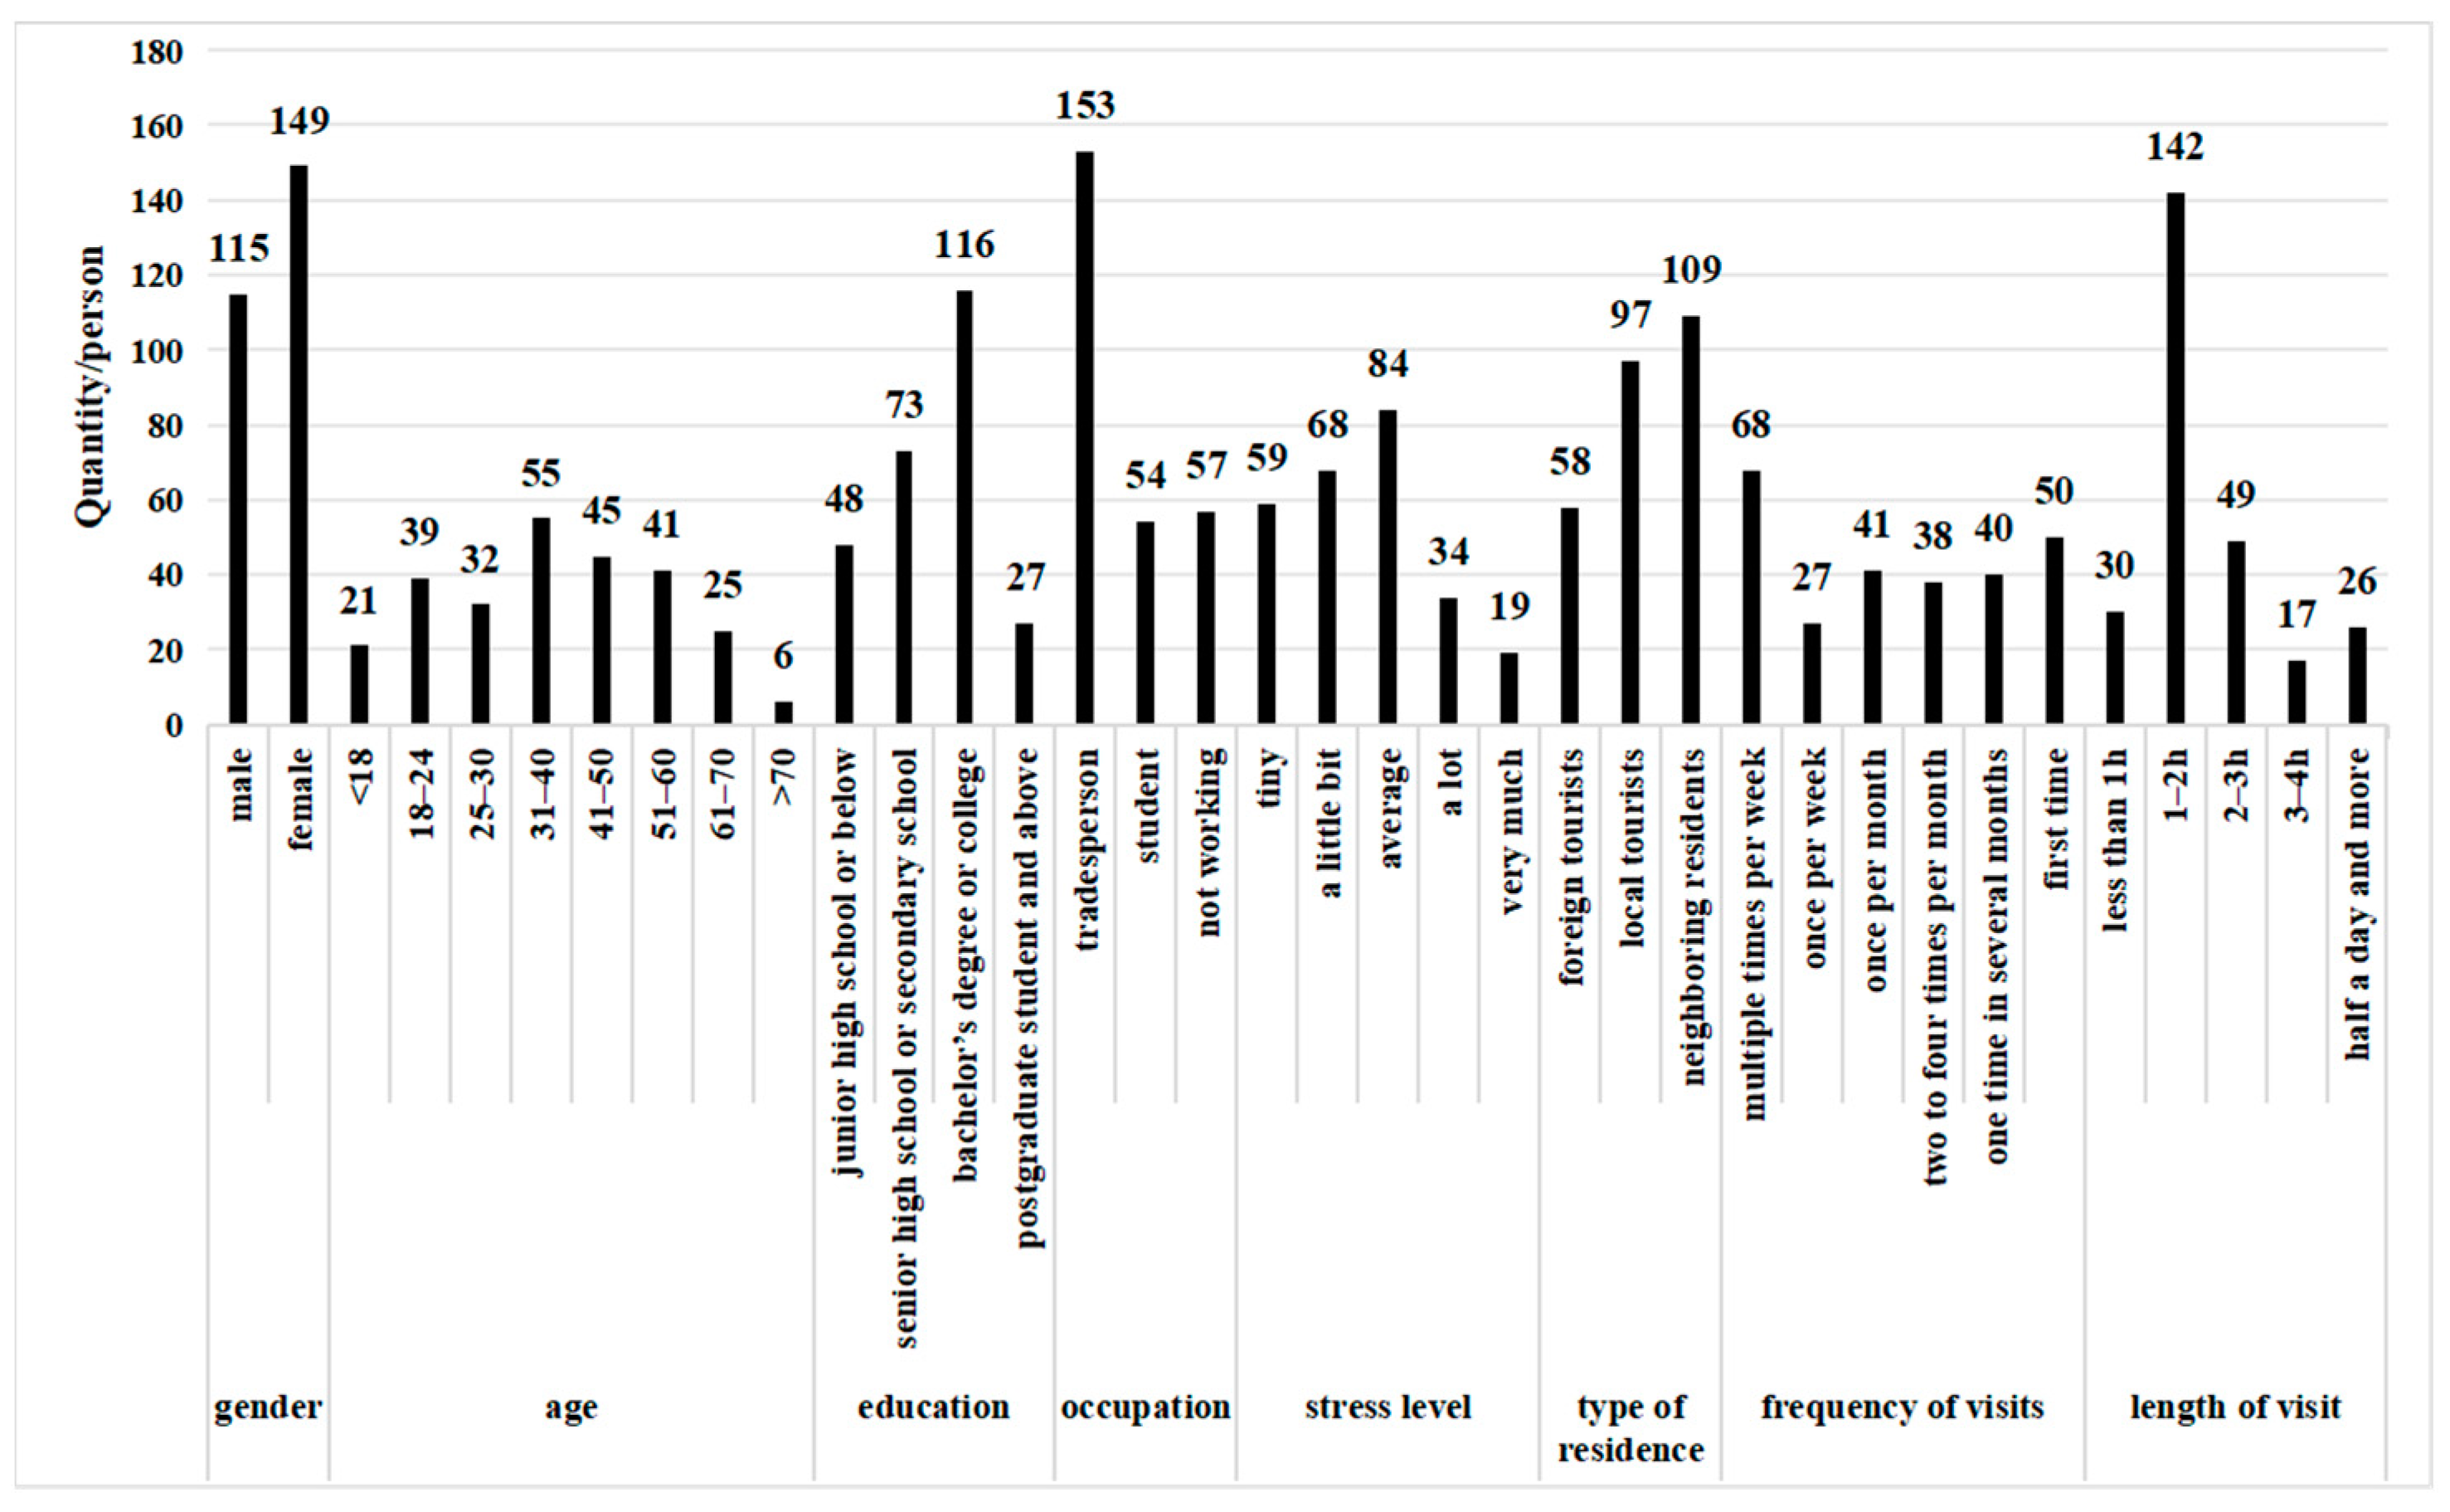
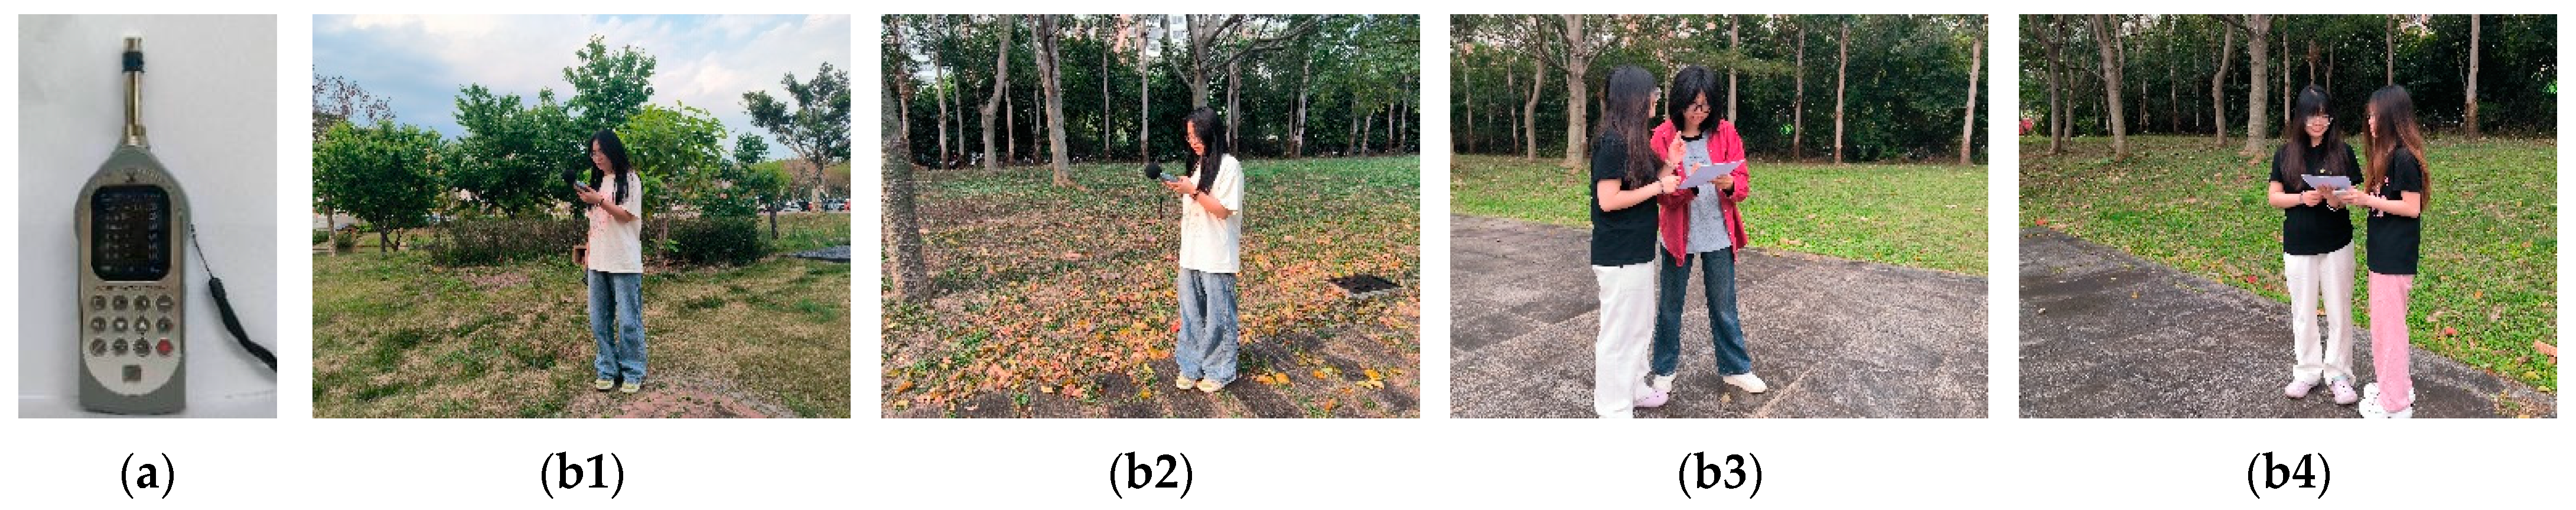
2.3. Data Collection

The field survey was carried out from July to October 2023. Physical acoustic parameter data were measured at each collection point using a sound level meter (AWA6228) with a sensitivity of −28 dB and a sound pressure level measurement range of 20–132 dBA in the low range and 30–142 dBA in the high range. Each point was measured once in the morning, once in the afternoon, and once in the evening. Each measurement lasted 10 min, with the handheld instrument approximately 1.6 m above the ground. The sound level meter was calibrated before each measurement, including the continuous equivalent sound pressure level (LeqT) and the cumulative percentile sound level (L10 and L90), which represent the foreground and background sounds of the soundscape environment, respectively. During the measurement process, the measurements were conducted quietly, and pedestrian visits were avoided to ensure that the results accurately reflected the soundscape characteristics of the greenway at each measurement point.
After the data collection of acoustic parameters was completed, randomly selected tourists in the greenway were informed of the purpose of the survey and the way of answering, and the interviewer did not guide the expression of the content of the related soundscape perception. The questionnaire was anonymous, and respondents who agreed to participate were given a separate questionnaire conducted by the interviewer at a place where they could stay to fill it out so as not to be disturbed by other tourists or hinder other tourists’ sightseeing. To minimize the bias caused by the chance of selecting respondents at a given time, the number of questionnaires equal to the number of measurement points was controlled separately for each sampling point, and arrangements were made to conduct multiple surveys at different times. The questionnaires were selected to be administered in a favorable-weather environment. Each questionnaire lasted 14 h, concentrating on three periods: 8:00–12:00, 15:00–18:00, and 19:00–21:00.

2.4. Statistical Analysis

The survey was conducted in three greenways in Fuzhou City from 8:00 to 21:00, 264 questionnaires were distributed, and 263 valid questionnaires were obtained after excluding invalid questionnaires, with a recovery rate of 99.62%. Reliability analysis and factor analysis were used to test the reliability and validity of the questionnaires, respectively. The reliability of the data was analyzed using the Cronbach α reliability value of the Sound Source Perception and Soundscape Perception Evaluation Scale; the validity of the data was analyzed using Bartlett’s Spherical Test and the KMO value. Two comprehensive sound source perception indicators, namely sound source dominance degree and sound source harmony degree [42], were quoted for in-depth statistical analysis (Table 2). The multiple independent samples test of the Kruskal–Wallis nonparametric test was used to analyze the variability of sound source perception in different types of landscape spaces and the overall soundscape perception characteristics in landscape spaces, and the one-way ANOVA test of the Kruskal–Wallis nonparametric test was used to make two-by-two comparisons in different spaces. The salient factors in the soundscape perception were then extracted using principal component analysis. The relationship between soundscape perception and sound source perception in different types of landscape spaces was analyzed using Spearman’s rho correlation and then through stepwise linear regression, respectively, with soundscape pleasantness and richness as dependent variables and 27 perception indicators of 10 categories of sound sources with significant correlation with the overall soundscape perception Spearman’s rho as independent variables. The six categories of space were analyzed separately to explore the relationship between sound source perception and the general soundscape perception. Differences in soundscape perceptions between tourists interviewed for different attributes were analyzed using nonparametric tests, in which gender was tested by Mann–Whitney U and age, education, occupation, stress level, type of residence, frequency of play, and length of play were tested using the Kruskal–Wallis test. Spearman’s rho correlation was used to analyze the correlation between the two. All of the above analyses were performed using SPSS 27.0 software to analyze the statistics.

3. Results and Analysis

3.1. Classification of Landscape Space Types

To comprehensively explore the relationship between the acoustic landscape perception characteristics and spatial type characteristics of urban greenways, this study draws on the method of Xingzi Zhao to break through the traditional use of plants to divide the landscape space [29] and more comprehensively categorize the urban greenways with rich landscape space. The three levels of “substrate–enclosure–cover” and the three materials of “water–plants–construction surface” are combined to classify the landscape space because the urban greenway is a continuous belt corridor that is coherent in terms of substrate and materials, and there is not much difference. Therefore, this study draws on the methodology of “enclosure–coverage” to categorize the landscape space and divides the space into six types of space: covered space, uncovered space of the coverage type, open space, semi-open space, semi-enclosed space, and enclosed space of the enclosure type.
The spatial types and classification indexes of greenway landscape are shown in Table 3; because the “base” level of the sample plots is coherent and generally consistent, this study only analyzes the spatial classification of the urban greenway in terms of the vertical structure of the “cover” and the horizontal structure of the “enclosure”, two types [29]. The coverage type contains two kinds of spaces, uncovered spaces and covered spaces, and the enclosure type includes four kinds, enclosed spaces, semi-enclosed spaces, semi-open spaces, and open spaces. Among them, uncovered space refers to incomplete closure of the visual nature at the top of the vertical; covered space refers to almost closure of the top materiality in the vertical; open space refers to the visualization in the horizontal direction that is completely open, including to the plaza, the view of the city landscape, less than a face of the shade, and all around openness without secrecy; semi-open space means that the visual nature of the horizontal direction is not entirely closed, and one to two surfaces limit the penetration of the view; semi-enclosed space means that the optical system is roughly wholly enclosed, with two to three sides closed to the line of sight; enclosed space means that it is utterly closed both visually and physically in the horizontal direction, with more than three sides blocking the view. Combining both coverage and enclosure types yields a comprehensive coverage of eight landscape space classifications: uncovered–open space, uncovered–semi-open space, uncovered–semi-enclosed space, uncovered–enclosed space, covered–open space, covered–semi-open space, covered–semi-enclosed space, and uncovered–enclosed space (Appendix A).

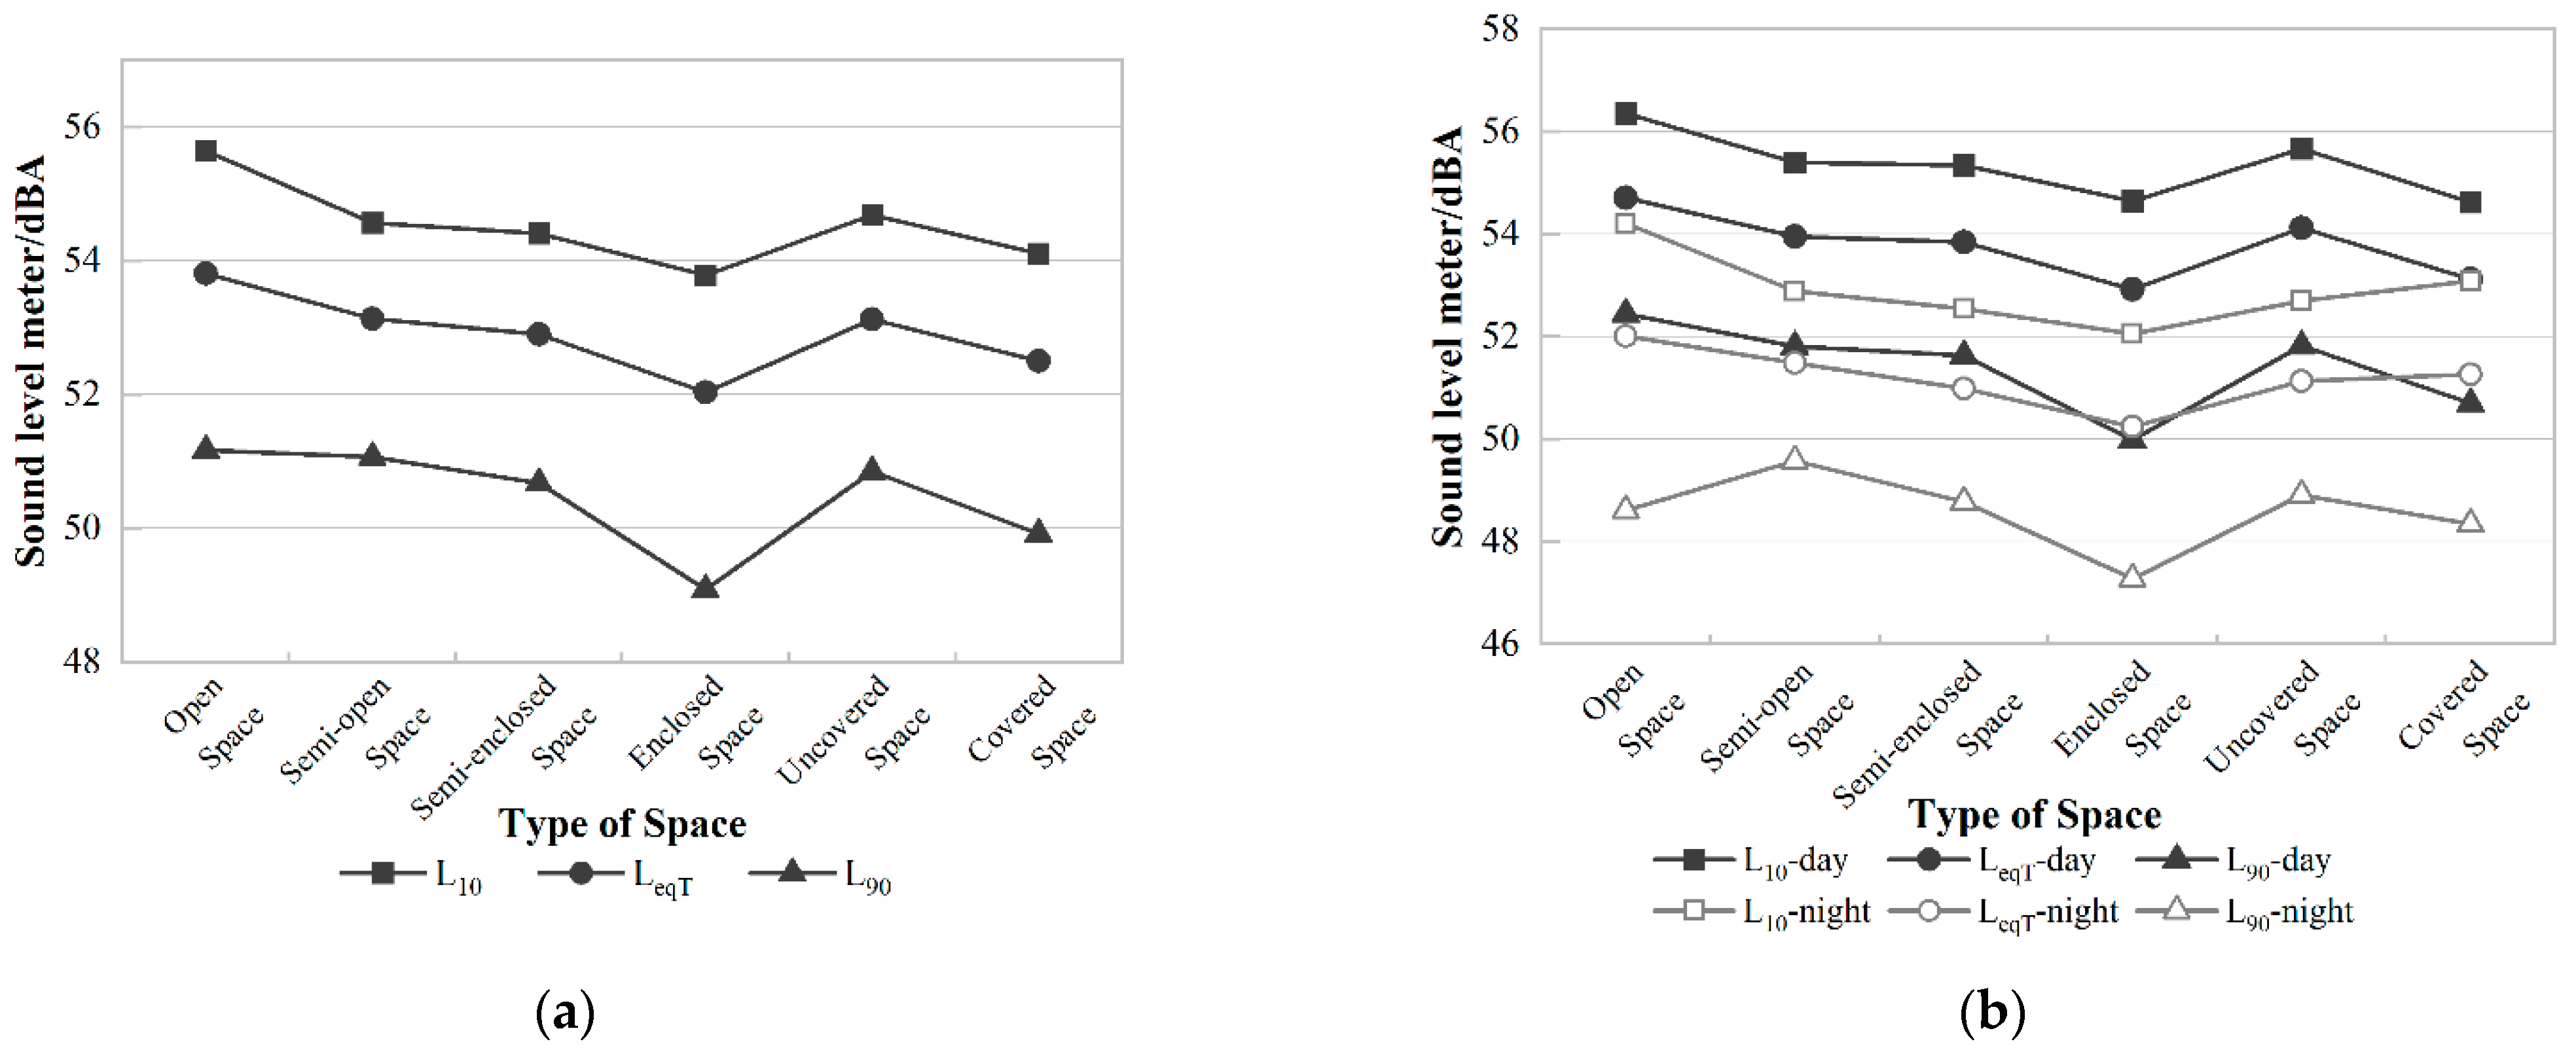
3.2. Characterization of Objective Attributes of the Soundscape in Different Types of Landscape Spaces

China’s national acoustic environment quality standard stipulates that “the daytime sound limit is 55 dBA, and the nighttime sound limit is 45 dBA”, according to the day–night distinction [43]. To deeply investigate the soundscape characteristics and sound environment quality of urban greenways and to more clearly understand the day and night characteristics of soundscape perception to provide data support for the construction of greenways, the data collected in this study will be categorized by day and night. The daytime research time is from 8:00 a.m. to 6:00 p.m., and the nighttime is from 7:00 p.m. to 10:00 p.m., to further characterize the objective attributes of the soundscape from the time dimension to the different types of landscape spaces in the space of urban greenways, as well as to provide references for the future spatial construction of urban greenways.
The L10, LeqT, and L90 trends for the six landscape spaces were roughly the same, with L10 having the highest sound pressure level and L90 the lowest. In terms of coverage type, the acoustic indicators in uncovered spaces were all higher than those in covered spaces; in terms of enclosure type, open spaces had the highest sound pressure levels, and enclosed spaces had the lowest; a comparison of the two revealed that the changes in sound pressure levels within spaces of the coverage type were more significant than those of the enclosure type (Figure 3a). Regarding the time dimension, the acoustic indicator values of various landscape spaces during the daytime complied with the standard except for the L10 indicator of open space, semi-open space, semi-enclosed space, and uncovered space, which slightly exceeded 55 dBA. Still, at nighttime, all of the indicators exceeded the standard of 45 dBA, and it is worth noting that the L90 background sound intensity of open space was different from the highest in the daytime (Figure 3b).

3.3. Characterization of Spatial Sound Source Perception in Different Types of Landscapes

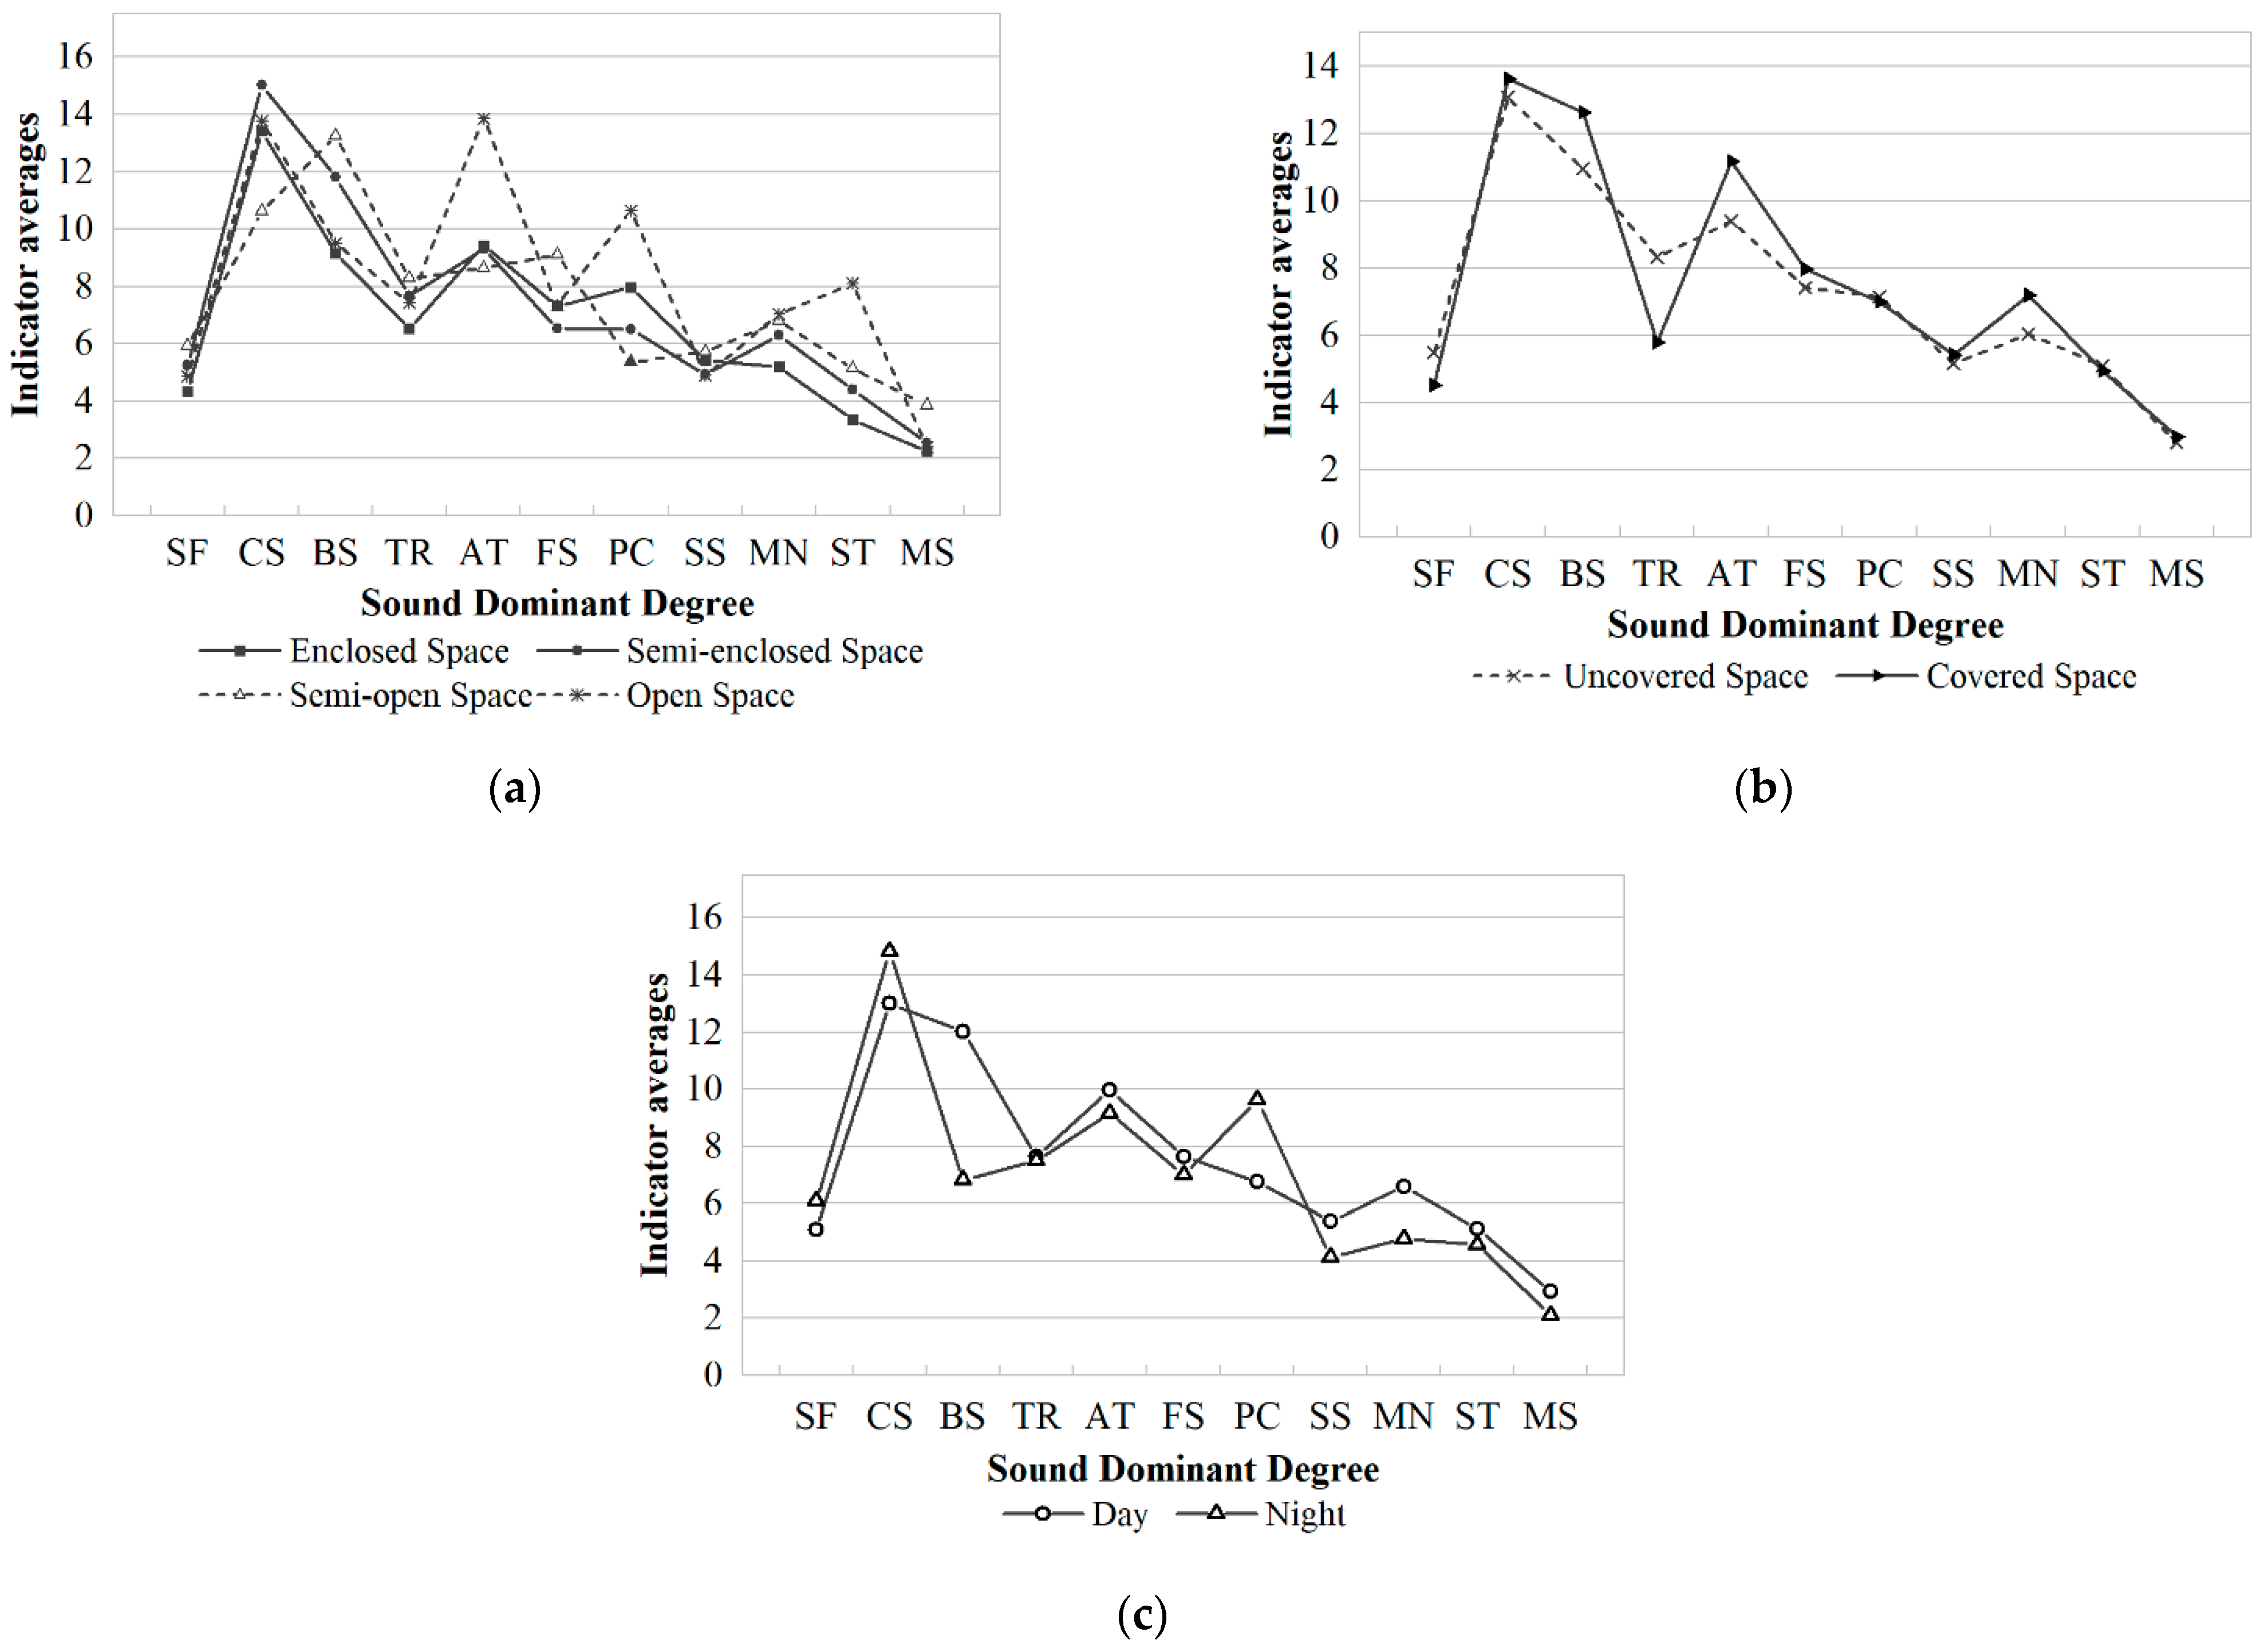
3.3.1. Perceived Characterization of Sound Source Dominance

The analysis of the dominant degree of sound sources in different types of landscape spaces is shown in Figure 4. Among the different enclosure types (Figure 4a), the sound source with the highest dominance degree in the enclosed and semi-enclosed spaces was the cicada sound; in the semi-open space, the birdsong was the sound source with the highest dominance degree. In the enclosed, semi-enclosed, and semi-open spaces, the dominance of natural sounds (cicada and birdsong) was higher than that of artificial and mechanical sounds. In open spaces, cicadas and talking sounds were the most dominant sound sources; children’s play and traffic sounds were much more prevalent than in other types of spaces. In different cover types (Figure 4b), cicadas were the most dominant sound source, and cicada and bird sounds were more prevalent than artificial and mechanical sounds. Overall, the dominance of sound sources in covered spaces was higher than in uncovered ones. Comparing each space in the enclosure type and the coverage type, in the enclosure type, sound sources in open and semi-open spaces had the highest degree of dominance; in the coverage type, the supremacy of sound sources in covered spaces was higher. Looking at different times of day (Figure 4c), cicadas were the sound source with the highest dominance, and both natural and artificial sounds had higher dominance than mechanical sounds. The day–night differences between the various types of sound sources were minor. Still, it is worth noting that the day–night differences between birdsong and children’s playfulness were significant in that the dominance of birdsong was higher in the daytime than in the nighttime, and the predominance of children’s playful sounds was higher at night than during the day.

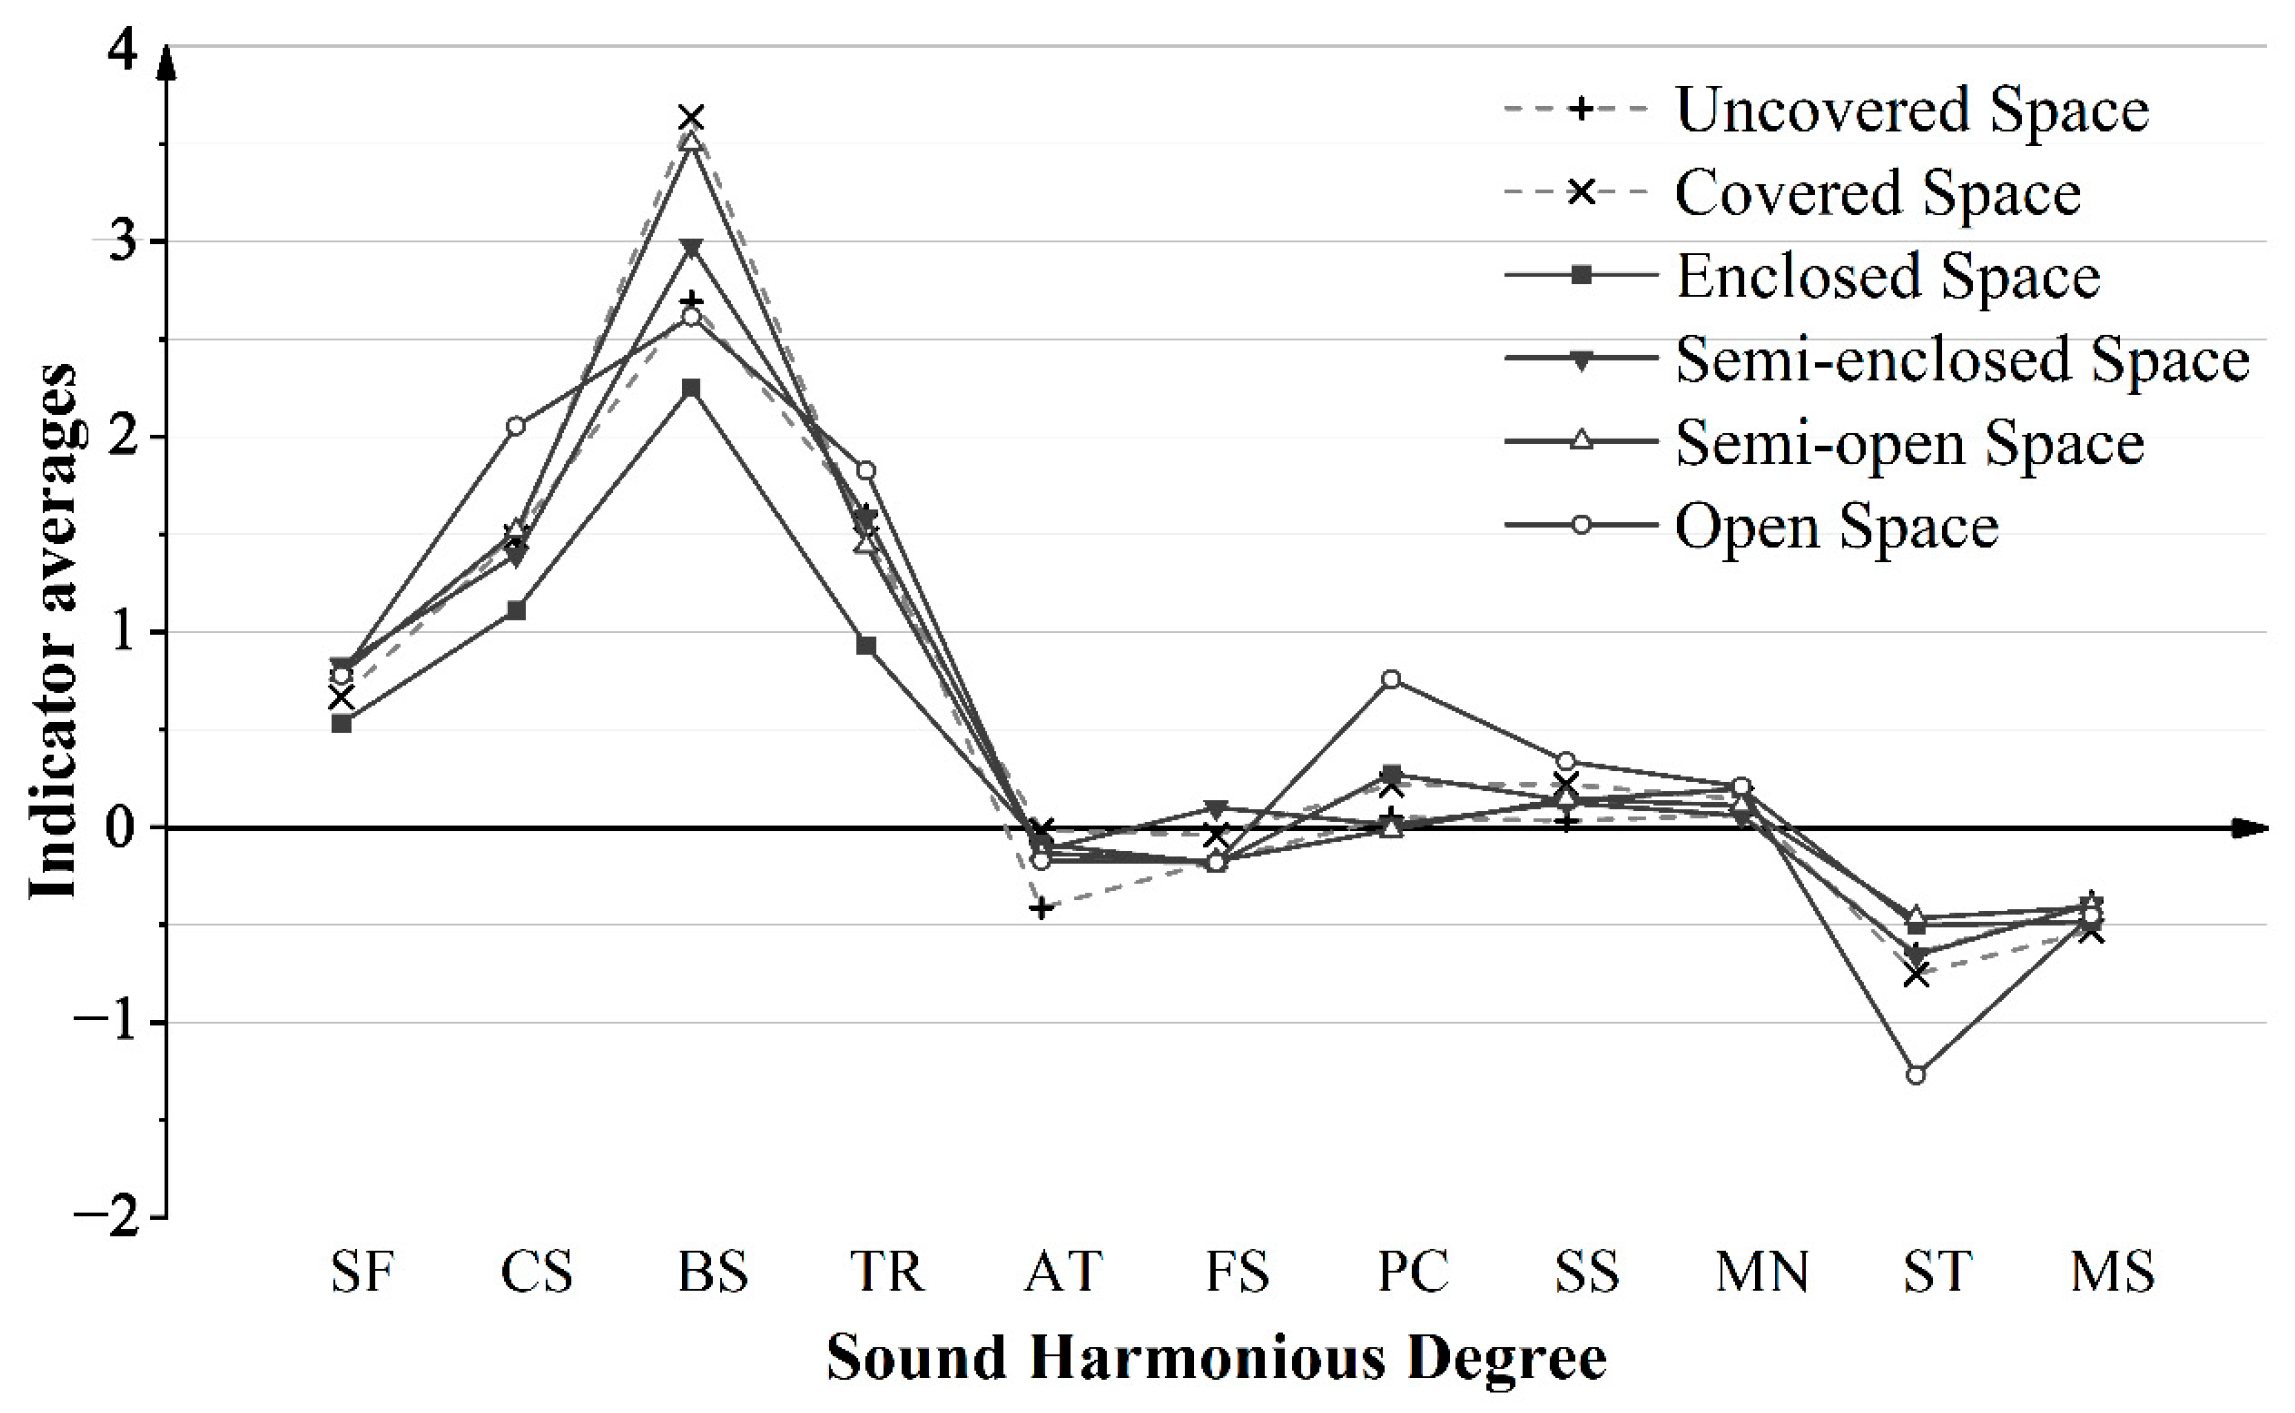
3.3.2. Characterization of Sound Source Harmony Perception

The characterization of sound source harmony perception is shown in Figure 5. From a general point of view, the harmonic characteristics of each sound source in each type of space were similar, and the harmonics of natural sounds were higher than those of artificial and mechanical sounds. The sounds of birdsong, cicadas, and wind blowing on leaves were the three sound sources with the highest harmony ratings among the multiple sound sources. In contrast, the sounds of conversation, traffic, and machines had the lowest harmony ratings. Comparing the various types of spaces, the harmony of traffic sound (SHD = −1.2694) was the weakest in the open space, and the harmony of cicadas (SHD = 2.6152), birdsong (SHD = 2.0537), and windblown leaves (SHD = 1.8255) was the highest. Birdsong sound harmony (SHD = 2.2510) was the highest, and traffic sound harmony (SHD = −0.5033) was the lowest in the enclosure space, indicating that space with a taller enclosure amplifies the effect of sound on people and increases their preference for sound. Regarding sound source type, natural sound harmony was the highest, and mechanical sound harmony was the lowest. The harmony of sound sources affects tourists’ perceptual preference for sound and tour experience, and natural sounds, such as birdsong, significantly influence soundscape perception. In contrast, artificial sounds, such as mechanical and traffic sounds, had a more significant negative impact [31,44,45].

3.3.3. Perceived Variability Analysis of Sound Sources

The results of the analysis of the variability of sound source perception in different landscape space types are shown in Table 4. In the coverage-type space, there was a significant difference in the dominance degree of wind-blown leaf sound, conversation sound, and music sound (p < 0.05, p < 0.001). Among them, the difference in the dominance degree of wind-blown leaf sound was the largest (r = 12.156); in terms of the harmony of sound sources, only the sound of birds chirping had a significant difference (p < 0.05). In the enclosure-type space, the dominant degree of cicadas, conversations, children’s playfulness, and traffic sounds showed highly significant differences (p < 0.001), in addition to the dominance degree of birdsong, footsteps, and machine sounds (p < 0.05). Only children’s playfulness differed in the harmony index (r = 8.667).
The dominance degree of wind-blown leaf sound, conversation sound, music sound, and harmony degree of birdsong significantly differed within the covered and uncovered spaces (Table 4). This study further analyzed the two-by-two comparisons of typical sound source perceptions with significant differences in the four types of spaces in the enclosure type, and the results are shown in Table 5. In terms of sound source dominance, cicada sounds showed highly significant differences between semi-open and semi-enclosed spaces (p < 0.001); bird sounds showed substantial differences between semi-open and enclosed spaces (p < 0.05); and conversation sounds and children’s playful sounds showed highly significant differences between open and semi-open spaces (p < 0.001). In addition, the sound of conversation showed a significant difference between open and semi-enclosed spaces and open and enclosed spaces (p < 0.01); the sound of footsteps showed a substantial difference between semi-open and semi-enclosed spaces (p < 0.01); the sound of children’s playfulness showed a significant difference between open and semi-enclosed spaces (p < 0.01); the sound of traffic showed a significant difference between open and semi-enclosed spaces (p < 0.05), in addition to offering a highly significant difference between open and enclosed spaces (p < 0.001); and, finally, machine sounds were significantly different between semi-open and semi-enclosed spaces and semi-open and enclosed spaces (p < 0.05, p < 0.01). In terms of sound source harmony, there was a significant difference between children’s playful sounds within open space and semi-open space (p < 0.05).

3.4. Characterization of Overall Soundscape Perception in Different Types of Landscape Spaces

3.4.1. Analysis of Overall Soundscape Perception Dimensions

The six evaluation indicators of soundscape perception were analyzed using principal component analysis, and two common factors of overall soundscape perception were extracted, with a cumulative contribution of variance of 67.952% (Table 6), which is higher than similar studies [28], that better explain the characteristics of soundscape experience in urban greenways. Therefore, the overall soundscape perception of landscape space contains two dimensions. Among them, the variance contribution rate of the common factor F1 was 50.329%, which was mainly related to “pleasant”, “harmonious”, and “comfortable” and was expressed as soundscape pleasantness. The variance contribution rate of the common factor F2 was 17.623%, and it was mainly related to “rich” and “varied”. It was expressed as soundscape richness.

3.4.2. Analysis of Variability in Overall Soundscape Perception

The differential analysis of the overall soundscape perception characteristics in the six types of landscape spaces (Table 7) showed that the soundscape pleasantness and richness scores showed significant differences in the enclosure space types (p < 0.05).
Further pairwise comparisons were made to characterize the perceived differences in soundscape pleasantness and richness in the enclosed landscape spaces (Table 8). The results showed that there was a significant difference in soundscape pleasantness in the “open–enclosed” space (p < 0.05 open space pleasantness M = 27.6721, enclosed space pleasantness M = 29.3361). There was a significant difference in soundscape richness between “open and semi-open” spaces (p < 0.05, open space richness M = 4.0748, semi-open space richness M = 4.7514), further illustrating that different degrees of greenery affect the pleasantness and richness of the soundscape [31,36].

3.5. Analysis of Influencing Factors of Overall Soundscape Perception in Different Types of Landscape Spaces

3.5.1. Relationship between Sound Source Perception and Overall Soundscape Perception

Spearman’s rho correlation analysis was conducted between sound source perception and overall soundscape perception in different landscape spaces, and the results are shown in Table 9. Sound source dominance and harmony differed significantly from the general soundscape perception indicators of pleasantness and richness. Among the coverage types, most sound sources were dominant, with correlation in uncovered spaces. In contrast, the correlation between sound source harmony and soundscape perception was more robust in covered spaces. Among the enclosure types, both dominance and harmony of sound sources in open spaces were most significantly related to overall soundscape perception. In comparing the two dimensions of soundscape perception of pleasantness and richness, the correlation between pleasantness and sound source perception was more significant than richness.
To further explore the sound source factors that influence the overall soundscape perception of tourists in different types of landscape spaces, including soundscape pleasantness and richness as dependent variables and 21 perceptual indicators from 12 categories of sound sources with significant correlations with the overall soundscape perception Spearman’s rho, described above as independent variables, stepwise linear regression analysis was performed for each of the six spatial categories. The results are shown in Table 10. The model variables did not have the problem of covariance (VIF < 10). Still, the R2 values were small, indicating that the regression model was adequate but needed a more assertive explanation related to the complex influence mechanism of soundscape perception, which was also confirmed in the previous studies [46,47,48,49,50].
The results of the stepwise linear regression analysis between the different spaces and the overall soundscape perception are shown in Table 10. Concerning cover type, traffic sound dominance was negatively correlated with soundscape pleasantness and richness in uncovered space. In the covered space, wind-blown leaf sound harmony was significantly positively correlated with soundscape pleasantness, and birdsong sound harmony positively affected both soundscape pleasantness and richness. Therefore, increasing birdsong has a positive effect on enhancing soundscape perception in the covered space. There was a significant negative correlation between sweeping sound harmony and soundscape pleasantness, so in the management of public hygiene of urban greenways, it is necessary to consider the reasonable setting of the time and frequency of sweeping activities to reduce the impact of sweeping activities on users’ subjective perception. Regarding enclosure type, in semi-enclosed space, there was a significant negative correlation between the harmony of sweeping sound and the richness of soundscape. In semi-enclosed spaces, the harmony of birdsong has a significant positive correlation with the pleasantness and richness of soundscape perception, and the dominance of birdsong also has a significant positive effect on the pleasantness of soundscape. There was a negative correlation between traffic sound and both dimensions of soundscape perception in the open space. No significant correlation was presented between the two dimensions of related sound source and soundscape perception in the enclosed space. In summary, the results of the above data further confirm that natural sounds played a positive role in enhancing the evaluation of soundscape perception [51], in which the positive effect of birdsong was more prominent. In contrast, artificial sounds were not conducive to enhancing soundscape pleasantness [46], and, at the same time, synthetic sounds would weaken people’s perception of soundscape richness [52].

3.5.2. Relationship between Tourists’ Demographic, Social, and Behavioral Characteristics and Overall Soundscape Perception

Using reliability analysis and factor analysis in SPSS 27.0, the reliability and validity of the scale part of the questionnaire were tested, respectively, resulting in the Cronbach’s α reliability value of the questionnaire’s sound source perception and soundscape perception evaluation scales as 0.751 and 0.783, which were both greater than 0.7, indicating that the data had good reliability; the validity analysis was mainly carried out through Bartlett’s test of sphericality and the KMO value analysis test, and the results showed that KMO was 0.6 and Bartlett sphericity p < 0.001, indicating good data validity.
Numerous cases have shown strong correlations between demographic factors, sociological factors, and soundscape evaluation [34,36]. This study analyzed the relationship between demographic and sociological characteristics and the soundscape perception of urban greenways through Spearman’s rho correlation analysis (Table 11). The results showed that age was the most significant user characteristic. As age increased, the degree of harmony of cicadas, birdsong, and children’s playful sounds and the sense of pleasure and quietness in soundscape perception were higher. In comparison, the degree of predominance of frog sounds, wind-blown leaves, footsteps, machine sounds, and the harmony of traffic sounds was lower. Secondly, regarding the influence of the type of residence, neighboring residents rated the soundscape perception of cicadas and birdsong and the harmony of footsteps higher than foreign tourists and the dominant degree of wind-blown leaves sound, machine sound, and the harmony of traffic sound lower. As the frequency of visiting increased, the ratings of perceived dominance of cicadas, birdsong, and sweeping sounds increased, and the ratings of perceived harmony perception of birdsong and footsteps increased. Still, the ratings of perceived harmony of soundscape perception decreased. In terms of education level, educational background showed a significant positive correlation (p < 0.05) on the perceived harmony of frog sounds, wind-blown leaf sounds, and traffic sounds, as well as the perceived dominance of machine sounds and the perceived quietness of the soundscape, indicating that the higher the education level, the more sensitive the perceived machine sounds and the higher the ratings of the perceived harmony of frog sounds, wind-blown leaf sounds, and traffic sounds, as well as the perceived quietness of the soundscape. The effect of gender on soundscape perception was mainly focused on the perception of the dominance of various types of sound sources, with males being more sensitive than females to the perception of wind-blown leaf sounds, footsteps, and sweeping sounds and scoring lower on soundscape harmony perception. The stress level showed a significant positive correlation (p < 0.05) with the perception of footsteps and music sounds, indicating that the higher the stress, the higher the predominance and harmony perceptions of footsteps and music sounds. The longer the playing time, the more sensitive the perception of footsteps, sweeping, and music sounds, but the perceived harmony of children’s playful sounds was rated lower. The data showed an insignificant correlation between occupational aspects and the overall soundscape perception of the urban greenway.

4. Discussion

4.1. Perceived Characteristics of Sound Sources in Different Types of Landscape Spaces

The sound pressure level decreased with the increase in the degree of enclosure and coverage. On the one hand, the greenway was mostly combined with the urban space. The space with a high degree of openness was exposed to the urban environment on a larger scale and was thus subject to the more significant interference of the urban ambient noise [53]. On the other hand, it might be because plants had an absorbing effect on sound; plants mostly enclosed the greenway space, and the higher the degree of enclosure coverage of the space, the denser the plants, so the sound absorption effect was more apparent [54,55,56]. The sound pressure level changed at different times; the daytime sound pressure level was less than 55 dBA to meet the standard, and at night, it was more than 45 dBA, thus exceeding the standard. In comparison with the same sound level index of different spaces, the nighttime L90 background sound index of the open space was no longer the highest value. It was weaker than in the daytime, in line with a previous study [52]. Namely, there were differences in the acoustic landscape between daytime and nighttime. This might be because the greenway’s primary sound sources differed between daytime and nighttime. The direct sound source during daytime originated from the external urban space, which reduced the greenway’s sound pressure level through the plants’ shading effect [54]. In contrast, the sound source at nighttime mainly came from the users’ activities (inside the greenway).
There were differences in the effects of degree of enclosure and degree of cover on sound perception. The lower the degree of spatial enclosure, the more abundant the types of sound sources perceived, perhaps because plants in the horizontal enclosure had a more excellent masking and filtering effect on sound [57,58]. Previous studies have confirmed that increasing the thickness and density of vegetation is beneficial to enhancing noise reduction [59]. The higher the degree of spatial coverage, the more sound sources were perceived, and increasing the degree of coverage favors the degree of perception of sound sources associated with cicadas, birdsong, conversations, footsteps, sweeping, music, etc. On the one hand, this might be because the sound of cicadas and birdsongs was mainly emitted by cicadas and birds that were in the surrounding trees, which led to a more robust perception of the sound sources of cicadas and birdsongs under the coverage of shade; on the other hand, it might be because the weather was scorching in the summer in Fuzhou, and people preferred to move around in the space where there were trees with shades, which led to an increase in the artificial sounds in the space under the coverage, which was more intensely perceived [52]. In addition, sound sources were perceived differently at different times of the day, with diurnal differences evident for birdsong and children’s playful sounds. The dominance of birdsong was higher in the daytime than in the nighttime, which may be related to birds’ work and rest habits, and most of the birds chirped during the daytime [60]. Children’s playful sounds’ predominance was higher at night than during the day, probably because children were more active at night due to the higher daytime temperatures during the research period. At the same time, children’s activities also appeared to occur in the node plaza.
The degree of enclosure of the landscape space affected the harmony of artificial sounds. The highest harmonization of children’s playful sounds, sweeping sounds, and music sounds in open spaces might be due to the greater willingness to engage in human activities, including children’s play in open spaces dominated by nodal plazas that provide a larger space for more extensive activities, more forms of activities, and enriching visual factors compared to the predominantly linear spaces of the urban greenway [61], or because children’s activities in open spaces dominated by nodal plazas are in line with the users’ expectations of the soundscape [62,63]. This further justified the conclusion that the creation of landscapes within the space affects the perception of the sound source [30].

4.2. General Soundscape Perception Characteristics of Different Types of Landscape Spaces

In the principal component analysis of soundscape perception factors, soundscape pleasantness explained more than 50% of most of the variance, which was much larger than the soundscape richness of 17.623%, thus indicating that soundscape pleasantness significantly impacts soundscape perception in urban greenways. Therefore, the soundscape optimization process was more effective in improving soundscape pleasantness. In soundscape pleasantness, the factor coefficients of pleasant (F = 0.831) and harmonious (F = 0.843) were higher than comfortable (F = 0.820), which was different from the conclusion of the previous study that “comfortable” was the primary factor influencing soundscape preference [64]. Perhaps this is because the last object of research for the city park, the paper’s research subject of the urban greenway, attracts people who are different from the tourists in the city park, who may prefer static recreation, while urban greenway users look for sports and excursions, and thus the linear design of the greenway guides people to move forward, resulting in the tourists in the urban greenway being more focused on the pleasure and harmony of the feeling. Therefore, in the construction of urban greenways, the pleasure and harmony of soundscape perception could be improved to enhance the degree of soundscape pleasure, thus improving the soundscape perception experience. The factor coefficient of quietness was very low (F < 0.5), which might be due to the significant difference in the evaluation criteria of people’s quietness in urban greenways, resulting in a substantial difference in the evaluation of the quietness dimension in soundscape perception within different spatial types [65]. It was also possible that the significant differences in tourists’ audiovisual expectations of urban greenway excursions affected tourists’ judgments of the quiet dimension of soundscape perception [66], resulting in a poor analysis of the quiet dimension data, which were not included in the factor analysis. The soundscape pleasantness and richness scores showed significant differences (p < 0.05) in different enclosure-type landscape spaces, which was similar to the overall soundscape perception characteristics of soundscapes in event spaces of urban parks and so on [31]. Among them, the soundscape pleasantness scores between open and enclosed spaces showed significant differences (p < 0.05), which was the same as Jiang Liu et al.’s findings [52,67], namely, that different degrees of green enclosure in the landscape affect visitors’ soundscape perceptions.
The primary sound sources affecting the overall soundscape perception differed in all landscape spaces. In various types of spaces, artificial sounds, such as traffic and sweeping sounds, were prone to adverse effects, while natural sounds, such as birdsong and wind-blown leaf sounds, were conducive to enhancing soundscape pleasure and richness. The results indicated that natural sounds positively strengthened the touring experience during tourists’ visits [18] and further confirmed that natural sounds were beneficial to enhancing the perceptual experience of the soundscape. In contrast, artificial sounds hurt the soundscape experience [14,68]. Therefore, in the space created in the greenway, attention should be paid to the protection and creation of natural landscapes, increasing natural sounds, and taking measures to control the interference of traffic sounds. At the same time, vegetation should be actively protected, or natural landscapes should be constructed to attract insects and birds, thus increasing natural sound to mask traffic noise and reducing or avoiding traffic sound interference if necessary. In the covered space and semi-enclosed space, the harmony of the sweeping sound of sanitation workers affected the pleasantness and richness of the soundscape, respectively, which might be because artificial sounds, such as sweeping sound, in the semi-enclosed space would cover up the other sound sources in the space [52], thus affecting the richness. Therefore, in the work design of the semi-enclosed space of the greenway, the construction of public sanitation facilities should be strengthened to maintain the cleanliness of this space; meanwhile, the arrangement of cleaning work should be adjusted to reduce the frequency of sweeping in this space. Notably, the degree of birdsong sound dominance in a semi-enclosed space was not conducive to the perception of soundscape pleasantness. Still, birdsong harmony played a positive role in this space, which was probably because the inconsistency of the audiovisual environment in the urban greenway affected the pleasantness of soundscape perception and reduced the positive role of birdsong in soundscape perception when one only heard birdsong but did not see the bird [10]. It might also be because the presence of negative birdsong sounds like crows’ in semi-open spaces were not favorable to the perception of soundscape pleasantness [69], but it still played a positive role in soundscape perception in a birdsong soundscape with a high degree of harmony, which indicated that appropriate birdsong factors are still beneficial to soundscape perception [10]. Therefore, suitable bird habitats should be established to build a consistent natural soundscape in the urban greenway, adding comfortable or welcome birdsong to improve the perception of the soundscape in the urban greenway.

4.3. Characteristics of Soundscape Perception among Users with Different Demographic Sociological Characteristics

Emphasis on human characteristics is conducive to more targeted enhancement of the living environment for residents during rapid urbanization. This study showed that tourists’ age, type of residence, frequency of visit, education level, gender, stress level, and length of visit significantly affected the perception and evaluation of sound sources. Among them, age had a strong influence. The older the tourists were, the more they could feel the pleasure and quietness of the urban greenway and the less sensitive they were to the perception of sound sources. On the one hand, this might be because older people have richer life experiences and higher requirements for soundscape connotation [49]. On the other hand, it might be related to the fact that the elderly population does not often perceive the soundscape through audio–visual integration [8] or possibly due to a decrease in the ability to perceive high-frequency sound sources as they get older [70], which may lead to an insensitivity to the perception of some of them. However, urban greenways are conducive to creating a high-quality environment for activities close to nature, which is of great significance to the elderly population; therefore, the construction of urban greenways should emphasize the construction of age-friendly facilities, including infrastructure at resting points and barrier-free facilities. Neighboring residents perceived more vital natural sounds in the urban greenway, which probably had to do with the familiarity of neighboring residents with the surrounding environment, and increased familiarity and attachment to the place would be conducive to improving the touring experience [71,72]. First-time tourists rated the sense of harmony in the urban greenway higher. Still, sensitivity to the perception of some sound sources, such as birdsong and cicadas, was weaker, which might be related to the tourists’ freshness and unfamiliarity with the environment. The positive emotions brought by the sense of freshness could help improve the satisfaction of the journey [73]. Still, unfamiliarity with the scene may lead to the perception of some sound sources in the urban greenway needing to be addressed. Those with a higher educational background were less tolerant of machine sound, the more stressed and more prolonged playtime visitors were more sensitive to artificial sound, and the longer playtime visitors found more unacceptable the children’s playful sound, which might be because individuals with higher education, higher stress, or more extended playtime had higher expectations of the soundscape. The artificial sound was not in the range of expectations [63]. Therefore, further measures should be taken in urban greenway planning, such as rational zoning, improving children’s play infrastructure, and attenuating or shielding artificial sound to satisfy their needs. Male tourists were more sensitive to the perceived sound of wind blowing leaves, footsteps, and sweeping sounds. Females rated the perceived harmony of the urban greenway higher, which might be due to the different functions of using the urban greenway and the different paths taken between males and females [74] and may also be due to the different visiting mentality of males and females [8], thus leading to the difference in the perception of soundscape between males and females.

5. Limitations and Future Work

This study explored the characteristics of sound source perception and overall soundscape perception within different landscape spaces in an urban greenway and further explored the differences and influencing factors. However, there were still some limitations to the research process. In the sound source part, the study could not control the visitors to perceive the same soundscape, and therefore the perception of some sounds might be missing. In the connection between soundscape perception and other sensory characteristics, this study mainly focused on the soundscape part and combined part of the visual characteristics of the landscape space. Still, different sensory experiences also had a particular impact on the touring experience [33], and further research will combine multidimensional sensory perception and touring experience. In the division of spatial types, this study only investigated the degree of coverage and enclosure of urban greenways. However, the substrate material of the same urban greenway remained highly coherent and consistent, and there was still a distinction between the substrate materials of different greenways in Fuzhou. It needs to be further researched whether it affects the perception of the soundscape of urban greenways. In the analysis of the environment, this study focused on the summer season; whether there are new sound sources and new visual landscapes in other seasons that will affect the soundscape perception of urban greenways, and whether different environmental conditions, such as temperature and humidity, are closely related to the soundscape perception, need to be deeply studied in the future. In addition, the relationship between sound pressure level and soundscape perception will be the focus of future research.

6. Conclusions

Based on field surveys of three typical urban greenways in Fuzhou, China, this study analyzed the perceptual characteristics of the soundscape in six spatial types through objective acoustic data measurements and statistical analysis of questionnaire data. It explored the influence of demographic and social factors on soundscape evaluation. The results showed that the soundscape of urban greenways differed within two time and space dimensions. In the temporal dimension, the different primary sound sources at other times of the day in the urban greenway led to differences in the acoustic landscape between day and night; in the spatial dimension, the sound pressure level decreased with the increase in the degree of enclosure and the degree of coverage. The sound source and soundscape perception evaluation scores significantly differed in spatial enclosure and coverage degrees. The richness of the perceived sound source type increased with the decrease in the degree of spatial enclosure or the increase in the degree of coverage. The open and covered spaces were more sensitive to sound, and the open spaces were conducive to improving the harmony of artificial sound in urban greenways. Pleasure and richness were the main dimensions affecting the perception of soundscape in urban greenways, contributing 50% and 17%, respectively, and the difference was most significant between open and covered spaces. The natural sound was favorable for enhancing the evaluation of soundscape perception in urban greenways, while the artificial sound was unfavorable to the soundscape experience. Therefore, it is possible to improve the pleasantness and harmony of the soundscape of urban greenways by increasing the natural sound and reducing the interference of artificial sound, thus improving the soundscape perception score. Demographic and sociological characteristics, age, type of residence, and frequency of tourist visits were the main factors influencing the evaluation of the perception of the soundscape of urban greenways. Older people perceived pleasure and quietness in urban greenways more intensely and were less sensitive to some sound sources; neighboring residents were more capable of feeling the charm of natural sounds in urban greenways; and first-time visitors were more capable of handling the harmonious charm of urban greenways. Therefore, in the construction and improvement of urban greenways, certain measures, such as improving the construction of elderly and youth-friendly infrastructure, enhancing the sense of local attachment and freshness, adopting reasonable zoning, and dealing with artificial sound to a certain extent, can be considered to meet the needs of tourists and enhance the charm of urban greenways.
The above conclusions can provide a reference basis and data support for the optimization and future planning and construction of urban greenway soundscapes and help decision makers and designers to formulate corresponding construction strategies according to the public’s demand and expectations for the soundscape to continuously improve the charm of urban greenways and play a positive role in excellent soundscapes. Meanwhile, other influencing factors that cause differences in soundscape perception characteristics of urban greenways still need to be further explored, such as multidimensional sensory perception, particular sound source factors, etc. There are still many components to be studied in different environmental characteristics, including further division of space types to recognize the soundscape perception characteristics more comprehensively and so on. In future research, the above factors and soundscape perception characteristics and their differences and correlations will be investigated to further the comprehensive knowledge of soundscape perception of urban greenways and provide a construction reference basis for the soundscape perception characteristics of public spaces.

Supplementary Materials

The following supporting information can be downloaded at: https://www.mdpi.com/article/10.3390/f15040670/s1, File S1: The questionnaire and each question’s scale.

Author Contributions

Conceptualization, Y.Z. and J.Y.; methodology, J.Y., Y.Z., H.Z., M.Z. and Y.H.; validation, Y.Z. and H.Z.; formal analysis, Y.Z., J.Y., H.Z., M.Z., Y.H., Q.Z. and T.H.; investigation, M.Z., Y.H., Y.Z., H.Z., Q.Z. and T.H.; resources, J.Y., Y.Z., M.Z., Y.H. and H.Z.; writing—original draft preparation, Y.Z.; writing—review and editing, J.Y., Y.Z., M.Z., H.Z. and Y.H.; visualization, Y.H. and Y.Z.; supervision, J.Y. and Y.Z.; project administration, J.Y. and Y.Z.; funding acquisition, J.Y., M.Z. and Y.Z. All authors have read and agreed to the published version of the manuscript.

Funding

The research was funded by the Humanities and Social Sciences Fund of the Ministry of Education of China (23YJC850014): The process mechanism and practical path of agricultural cultural heritage tourism activation under the concept of innovation. The research was funded by the Social Science Foundation of Fujian Province (FJ2024BF080): Research on the Influence Mechanism and Optimization Strategy of Soundscape Perception of Historical and Cultural Neighborhoods from a Multidimensional Perspective. The research was funded by the Innovation and Entrepreneurship Training Program for Students of Fujian Agriculture and Forestry University (FAFUXMPC20230718001-00065): Evaluation of soundscape perception characteristics and restoration of urban greenways under biophilic perspective.

Informed Consent Statement

Informed consent was obtained from all subjects involved in the study.

Data Availability Statement

Dataset available upon request from the authors.

Acknowledgments

We especially thank the 264 visitors who participated in our survey and our teachers, family, and friends who have always supported us.

Conflicts of Interest

The authors declare no conflicts of interest.

Appendix A

Figure A1. Schematic diagram of measurement points and corresponding landscape space within the study area. Notes: The numbers in the lower left corner of the figure are the serial numbers of the measurement points.
Forests 15 00670 g0a1aForests 15 00670 g0a1b
Table A1. Overview of measurement points.
Point No.Located TrailCoverage TypeEnclosure TypeDegree of CoverageDegree of EnclosureCover MaterialEnclosure MaterialGround MaterialProximity to
Urban Roads
01FDUncoveredSemi-enclosed1/42/3GG&CSteel gratingNearer
02FDCoveredSemi-enclosed2/33/5GG&CSteel gratingNearer
03FDUncoveredOpen01/5NoneG&CSteel gratingNearer
04FDCoveredEnclosed3/44/5G&CG&CSteel gratingMore distant
05FDCoveredSemi-enclosed3/42/3CG&CSteel gratingMore distant
06FDCoveredEnclosed3/54/5GG&CSteel gratingMore distant
07FDUncoveredOpen00NonenoneBrickyardNear
08FDUncoveredSemi-open1/41/3GG&CSteel gratingNear
09FDUncoveredSemi-open01/3NoneG&CSteel gratingNearer
10FDCoveredSemi-open2/31/3GG&CSteel gratingNearer
11FDUncoveredSemi-open1/31/3GG&CSteel gratingMore distant
12FDUncoveredEnclosed1/34/5GGBrickyardDistant
13FDUncoveredSemi-enclosed0 3/5NoneG&CSteel gratingMore distant
14FDCoveredEnclosed2/34/5GG&CSteel gratingDistant
15FDUncoveredOpen0 1/5NoneG&CSteel gratingMore distant
16FFUncoveredOpen00NonenoneAsphaltNear
17FFUncoveredOpen00NonenonePlanksNearer
18FFUncoveredEnclosed1/34/5GGAsphaltMore distant
19FFUncoveredSemi-enclosed1/33/5GGAsphaltMore distant
20FFUncoveredOpen0 0NonenoneAsphaltMore distant
21FFCoveredSemi-open2/31/4GG&CAsphaltMore distant
22FFUncoveredSemi-enclosed03/4NoneGAsphaltDistant
23FFUncoveredSemi-open01/4NoneG&CAsphaltMore distant
24FFUncoveredSemi-enclosed02/3NoneGAsphaltDistant
25FFUncoveredEnclosed1/34/5GGAsphaltDistant
26FFUncoveredSemi-enclosed02/3NoneGAsphaltDistant
27FFUncoveredSemi-enclosed02/3NoneGAsphaltDistant
28FDUncoveredSemi-open01/4NoneCSteel gratingNearer
29FDUncoveredSemi-open01/4NoneCSteel gratingNearer
30FDCoveredEnclosed2/34/5GG&CSteel gratingDistant
31FDCoveredSemi-enclosed2/32/3GG&CSteel gratingDistant
32FDUncoveredSemi-enclosed1/32/3GG&CSteel gratingDistant
33FDUncoveredSemi-open01/3NoneG&CSteel gratingDistant
34FDUncoveredSemi-enclosed1/43/5GG&CSteel gratingDistant
35FDUncoveredSemi-open01/2NoneG&CSteel gratingMore distant
36FDUncoveredOpen01/5NoneG&CSteel gratingMore distant
37FDUncoveredSemi-open01/3NoneG&CSteel gratingMore distant
38JJUncoveredSemi-open01/3NoneCBrickyardMore distant
39JJCoveredSemi-enclosed2/32/3GG&CBrickyardMore distant
40JJUncoveredSemi-enclosed1/42/3GG&CBrickyardMore distant
41JJUncoveredSemi-open01/3NoneG&CBrickyardMore distant
42JJUncoveredSemi-open01/3NoneG&CBrickyardMore distant
43JJUncoveredSemi-open01/4NoneG&CBrickyardMore distant
44JJCoveredSemi-open2/31/3GG&CBrickyardMore distant
45JJUncoveredSemi-open01/4NoneG&CBrickyardMore distant
46JJCoveredEnclosed4/54/5CG&CBrickyardDistant
47JJCoveredSemi-enclosed4/53/5GG&CBrickyardDistant
48JJUncoveredSemi-enclosed1/33/5GG&CBrickyardDistant
49JJUncoveredEnclosed1/34/5GG&CBrickyardDistant
50JJCoveredSemi-enclosed2/33/5GG&CBrickyardDistant
Notes: The weather during the test was clear, with no wind and high visibility. Regarding the “located trail”, FD is Fudao, FF is Feifeng Mountain Park, and JJ is Jinji Mountain Park; regarding the “Cover Material” and “Enclosure Material”, G is green, C is construction, G&C is combined green and construction.

Appendix B

Figure A2. Photography of the instruments used in the study. Notes: (a) is the sound level meter (AWA6228); (b1,b2) are the photos of the sound level meter used in the research; (b3,b4) are the photos of the questionnaire used in the research.
Forests 15 00670 g0a2

References

  1. Xie, B.; Pang, Z.; He, D.; Lu, Y.; Chen, Y. Effects of neighborhood environment on different aspects of greenway use: Evidence from East Lake Greenway, China. J. Transp. Geogr. 2023, 106, 103488. [Google Scholar] [CrossRef]
  2. Zhang, L.; Wang, H. Planning an ecological network of Xiamen Island (China) using landscape metrics and network analysis. Landsc. Urban Plan. 2006, 78, 449–456. [Google Scholar] [CrossRef]
  3. Fan, S.; Chen, X.; Ren, H.; Shen, W.; Xiao, R.; Zhang, Q.; Wu, Z.; Su, Y. Landscape structure and network characteristics of the greenway system in Guangzhou City, South China. Landsc. Ecol. Eng. 2019, 15, 25–35. [Google Scholar] [CrossRef]
  4. Chen, Y.; Gu, W.; Liu, T.; Yuan, L.; Zeng, M. Increasing the Use of Urban Greenways in Developing Countries: A Case Study on Wutong Greenway in Shenzhen, China. Int. J. Environ. Res. Public Health 2017, 14, 554. [Google Scholar] [CrossRef] [PubMed]
  5. Teng, M.; Wu, C.; Zhou, Z.; Lord, E.; Zheng, Z. Multipurpose greenway planning for changing cities: A framework integrating priorities and a least-cost path model. Landsc. Urban Plan. 2011, 103, 1–14. [Google Scholar] [CrossRef]
  6. Lee, J.; Lee, H.; Jeong, D.; Shafer, C.S.; Chon, J. The Relationship between User Perception and Preference of Greenway Trail Characteristics in Urban Areas. Sustainability 2019, 11, 4438. [Google Scholar] [CrossRef]
  7. Jeon, J.Y.; Jo, H.I.; Lee, K. Psycho-physiological restoration with audio-visual interactions through virtual reality simulations of soundscape and landscape experiences in urban, waterfront, and green environments. Sustain. Cities Soc. 2023, 99, 104929. [Google Scholar] [CrossRef]
  8. Guo, X.; Liu, J.; Albert, C.; Hong, X. Audio-visual interaction and visitor characteristics affect perceived soundscape restorativeness: Case study in five parks in China. Urban For. Urban Green. 2022, 77, 127738. [Google Scholar] [CrossRef]
  9. Liu, F.; Liu, P.; Kang, J.; Meng, Q.; Wu, Y.; Yang, D. Relationships between landscape characteristics and the restorative quality of soundscapes in urban blue spaces. Appl. Acoust. 2022, 189, 108600. [Google Scholar] [CrossRef]
  10. Zhao, W.; Li, H.; Zhu, X.; Ge, T. Effect of Birdsong Soundscape on Perceived Restorativeness in an Urban Park. Int. J. Environ. Res. Public Health 2020, 17, 5659. [Google Scholar] [CrossRef]
  11. Wang, P.; Zhang, C.; Xie, H.; Yang, W.; He, Y. Perception of National Park Soundscape and Its Effects on Visual Aesthetics. Int. J. Environ. Res. Public Health 2022, 19, 5721. [Google Scholar] [CrossRef] [PubMed]
  12. Engel, M.S.; Paas, B.; Schneider, C.; Pfaffenbach, C.; Fels, J. Perceptual studies on air quality and sound through urban walks. Cities 2018, 83, 173–185. [Google Scholar] [CrossRef]
  13. Ye, J.; Chen, L.; Zheng, Y. Effect of an Artificial Sound-Based Index on the Perception of Historical Block Environments. Buildings 2023, 13, 2372. [Google Scholar] [CrossRef]
  14. Liu, J.; Wang, Y.; Zimmer, C.; Kang, J.; Yu, T. Factors associated with soundscape experiences in urban green spaces: A case study in Rostock, Germany. Urban For. Urban Green. 2019, 37, 135–146. [Google Scholar] [CrossRef]
  15. Jing, Y.; Junming, Z.; Hongda, W.; Yushan, Z. Evaluation of soundscape preference in wetland park. Tech. Acoust. 2022, 41, 734–741. [Google Scholar]
  16. Zhang, X.; Ba, M.; Kang, J.; Meng, Q. Effect of soundscape dimensions on acoustic comfort in urban open public spaces. Appl. Acoust. 2018, 133, 73–81. [Google Scholar] [CrossRef]
  17. Xie, H.; He, Y.; Wu, X.; Lu, Y. Interplay between auditory and visual environments in historic districts: A big data approach based on social media. Environ. Plan. B Urban Anal. City Sci. 2022, 49, 1245–1265. [Google Scholar] [CrossRef]
  18. Liu, J.; Yang, L.; Xiong, Y.; Yang, Y. Effects of soundscape perception on visiting experience in a renovated historical block. Build. Environ. 2019, 165, 106375. [Google Scholar] [CrossRef]
  19. Ruotolo, F.; Rapuano, M.; Masullo, M.; Maffei, L.; Ruggiero, G.; Iachini, T. Well-being and multisensory urban parks at different ages: The role of interoception and audiovisual perception. J. Environ. Psychol. 2024, 93, 102219. [Google Scholar] [CrossRef]
  20. Bhandari, N.; Tadepalli, S.; Gopalakrishnan, P. Investigation of acoustic comfort, productivity, and engagement in naturally ventilated university classrooms: Role of background noise and students’ noise sensitivity. Build. Environ. 2024, 249, 111131. [Google Scholar] [CrossRef]
  21. Liu, L.; Cai, Y.; Jin, L.; Zhu, Y.; Gao, Y.; Ding, Y.; Xia, J.; Zhang, K. Landscape pattern optimization strategy of coastal mountainside greenway from a microclimatic comfort view in hot and humid areas. Urban Clim. 2022, 46, 101297. [Google Scholar] [CrossRef]
  22. Cong, Y.; Zhu, R.; Yang, L.; Zhang, X.; Liu, Y.; Meng, X.; Gao, W. Correlation Analysis of Thermal Comfort and Landscape Characteristics: A Case Study of the Coastal Greenway in Qingdao, China. Buildings 2022, 12, 541. [Google Scholar] [CrossRef]
  23. Hu, X.; Zou, X.; Fan, H. Analysis of landscape influencing factors of urban waterfront greenways based on the scenic beauty estimation method, taking Tongjian Lake in Hangzhou as an example. Front. Earth Sci. 2023, 11, 1211775. [Google Scholar] [CrossRef]
  24. Jang, M.; Kang, C. Urban greenway and compact land use development: A multilevel assessment in Seoul, South Korea. Landsc. Urban Plan. 2015, 143, 160–172. [Google Scholar] [CrossRef]
  25. Asakawa, S.; Yoshida, K.; Yabe, K. Perceptions of urban stream corridors within the greenway system of Sapporo, Japan. Landsc. Urban Plan. 2004, 68, 167–182. [Google Scholar] [CrossRef]
  26. Keith, S.J.; Larson, L.R.; Shafer, C.S.; Hallo, J.C.; Fernandez, M. Greenway use and preferences in diverse urban communities: Implications for trail design and management. Landsc. Urban Plan. 2018, 172, 47–59. [Google Scholar] [CrossRef]
  27. Hunter, R.F.; Cleland, C.; Cleary, A.; Droomers, M.; Wheeler, B.W.; Sinnett, D.; Nieuwenhuijsen, M.J.; Braubach, M. Environmental, health, wellbeing, social and equity effects of urban green space interventions: A meta-narrative evidence synthesis. Environ. Int. 2019, 130, 104923. [Google Scholar] [CrossRef] [PubMed]
  28. Lopes, I.J.C.; Biondi, D.; Corte, A.P.D.; Reis, A.R.N.; Oliveira, T.G.S. A methodological framework to create an urban greenway network promoting avian connectivity: A case study of Curitiba City. Urban For. Urban Green. 2023, 87, 128050. [Google Scholar] [CrossRef]
  29. Zhao, X.; Mao, Y.; Hu, A. The characteristics of acoustic landscape in different landscape spaces of Huanhuaxi Park. J. Appl. Acoust. 2022, 41, 359–372. [Google Scholar]
  30. Lian, Y.Q.; Ou, D.Y.; Pan, S.S.; Ren, L.Y. An Evaluation Study on Soundscape of Different Landscape Space Types. Build. Sci. 2020, 36, 57–63. [Google Scholar]
  31. Li, J.; Liu, F.; Tong, H.; Wang, X. Soundscape Perception Characteristics and Influence Factors of Plant Landscape. Chin. Landsc. Archit. 2023, 39, 43–49. [Google Scholar]
  32. Fang, X.; Qi, Y.; Hedblom, M.; Gao, T.; Qiu, L. Do soundscape perceptions vary over length of stay within urban parks? J. Outdoor Recreat. Tour. 2024, 45, 100728. [Google Scholar] [CrossRef]
  33. Li, K.; Liu, M. Combined influence of multi-sensory comfort in winter open spaces and its association with environmental factors: Wuhan as a case study. Build. Environ. 2024, 248, 111037. [Google Scholar] [CrossRef]
  34. Rey Gozalo, G.; Barrigón Morillas, J.M.; Montes González, D.; Atanasio Moraga, P. Relationships among satisfaction, noise perception, and use of urban green spaces. Sci. Total Environ. 2018, 624, 438–450. [Google Scholar] [CrossRef] [PubMed]
  35. Pijanowski, B.C.; Farina, A.; Gage, S.H.; Dumyahn, S.L.; Krause, B.L. What is soundscape ecology? An introduction and overview of an emerging new science. Landsc. Ecol. 2011, 26, 1213–1232. [Google Scholar] [CrossRef]
  36. Liu, J.; Kang, J.; Luo, T.; Behm, H. Landscape effects on soundscape experience in city parks. Sci. Total Environ. 2013, 454–455, 474–481. [Google Scholar] [CrossRef] [PubMed]
  37. Kang, J.; Zhang, M. Semantic differential analysis of the soundscape in urban open public spaces. Build. Environ. 2010, 45, 150–157. [Google Scholar] [CrossRef]
  38. Aletta, F.; Kang, J.; Axelsson, Ö. Soundscape descriptors and a conceptual framework for developing predictive soundscape models. Landsc. Urban Plan. 2016, 149, 65–74. [Google Scholar] [CrossRef]
  39. Axelsson, Ö.; Nilsson, M.E.; Berglund, B. A principal components model of soundscape perception. J. Acoust. Soc. Am. 2010, 128, 2836–2846. [Google Scholar] [CrossRef]
  40. Hong, J.Y.; Jeon, J.Y. Influence of urban contexts on soundscape perceptions: A structural equation modeling approach. Landsc. Urban Plan. 2015, 141, 78–87. [Google Scholar] [CrossRef]
  41. Hume, K.; Ahtamad, M. Physiological responses to and subjective estimates of soundscape elements. Appl. Acoust. 2013, 74, 275–281. [Google Scholar] [CrossRef]
  42. Liu, J.; Xiong, Y.; Wang, Y.; Luo, T. Soundscape effects on visiting experience in city park: A case study in Fuzhou, China. Urban For. Urban Green. 2018, 31, 38–47. [Google Scholar] [CrossRef]
  43. GB 3096-2008; Environmental Quality Standard for Noise. China Environment Publishing Group: Beijing, China, 2008.
  44. Zhang, X.; Chen, J.; Lin, Q.; Yao, Y.; Liu, J. Research on Soundscape Evaluation of Urban Leisure Trail Based on Grounded Theory—Take Fuzhou Fu Road as an Example. Archit. Cult. 2019, 11, 88–90. [Google Scholar]
  45. Zhu, T.; Hong, X.; Guo, X.; Liu, J. Spatio-Temporal Dynamic Characteristics and Planning Strategies of Soundscape in Forest Park. Landsc. Archit. 2022, 29, 90–95. [Google Scholar]
  46. Szeremeta, B.; Zannin, P.H.T. Analysis and evaluation of soundscapes in public parks through interviews and measurement of noise. Sci. Total Environ. 2009, 407, 6143–6149. [Google Scholar] [CrossRef] [PubMed]
  47. Song, C.; Ikei, H.; Miyazaki, Y. Physiological effects of forest-related visual, olfactory, and combined stimuli on humans: An additive combined effect. Urban For. Urban Green. 2019, 44, 126437. [Google Scholar] [CrossRef]
  48. Ba, M.; Kang, J. Perception and Behaviour under the Audio-olfactory Interaction in Urban Public Open Spaces. South Archit. 2022, 10, 19–29. [Google Scholar]
  49. Yu, L.; Kang, J. Factors influencing the sound preference in urban open spaces. Appl. Acoust. 2010, 71, 622–633. [Google Scholar] [CrossRef]
  50. Yu, L.; Kang, J. Effects of social, demographical and behavioral factors on the sound level evaluation in urban open spaces. J. Acoust. Soc. Am. 2008, 123, 772–783. [Google Scholar] [CrossRef]
  51. Patón, D.; Delgado, P.; Galet, C.; Muriel, J.; Méndez-Suárez, M.; Hidalgo-Sánchez, M. Using acoustic perception to water sounds in the planning of urban gardens. Build. Environ. 2020, 168, 106510. [Google Scholar] [CrossRef]
  52. Liu, J.; Kang, J.; Behm, H.; Luo, T. Effects of landscape on soundscape perception: Soundwalks in city parks. Landsc. Urban Plan. 2014, 123, 30–40. [Google Scholar] [CrossRef]
  53. Vladimir, M.; Madalina, C. Optimizing urban landscapes in regard to noise pollution. Procedia Manuf. 2019, 32, 161–166. [Google Scholar] [CrossRef]
  54. Wong, N.H.; Kwang Tan, A.Y.; Tan, P.Y.; Chiang, K.; Wong, N.C. Acoustics evaluation of vertical greenery systems for building walls. Build. Environ. 2010, 45, 411–420. [Google Scholar] [CrossRef]
  55. Kim, M.; Yang, H.; Kang, J. A case study on controlling sound fields in a courtyard by landscape designs. Landsc. Urban Plan. 2014, 123, 10–20. [Google Scholar] [CrossRef]
  56. Tian, L.; Winterbottom, D.; Liu, J. Soundscape Optimization Strategies Based on Landscape Elements in Urban Parks: A Case Study of Greenlake Park in Kunming. Sustainability 2023, 15, 10155. [Google Scholar] [CrossRef]
  57. Shi, L.; Du, M.; Liu, L. A review of ecological benefits of vertical greenery system. Acta Ecol. Sin. 2023, 43, 5200–5210. [Google Scholar]
  58. Li, G.; Xiong, J.; Xu, M.; Dong, L. Comprehensive study on the noise reduction ability and the visual effect on the edge of green space of Beijing urban park. J. Beijing For. Univ. 2017, 39, 93–104. [Google Scholar]
  59. Davis, M.J.M.; Tenpierik, M.J.; Ramírez, F.R.; Pérez, M.E. More than just a Green Facade: The sound absorption properties of a vertical garden with and without plants. Build. Environ. 2017, 116, 64–72. [Google Scholar] [CrossRef]
  60. Kułaga, K.; Budka, M. Nocturnal singing by diurnal birds in a temperate region of central Europe. J. Ornithol. 2020, 161, 1143–1152. [Google Scholar] [CrossRef]
  61. Jeon, J.Y.; Hong, J.Y. Classification of urban park soundscapes through perceptions of the acoustical environments. Landsc. Urban Plan. 2015, 141, 100–111. [Google Scholar] [CrossRef]
  62. Su, H.; Ma, H.; Wang, C. Effects of soundscape on Chinese children’s social interaction measured by self-reported behavioral expectations. Appl. Acoust. 2023, 207, 109350. [Google Scholar] [CrossRef]
  63. Bruce, N.S.; Davies, W.J. The effects of expectation on the perception of soundscapes. Appl. Acoust. 2014, 85, 1–11. [Google Scholar] [CrossRef]
  64. Gan, Y.; Zheng, Y.; Zhang, L. Audio-Visual Analysis of Visitors’ Landscape Preference for City Parks: A Case Study from Zhangzhou, China. Forests 2022, 13, 1376. [Google Scholar] [CrossRef]
  65. Lu, X.; Tang, J.; Zhu, P.; Guo, F.; Cai, J.; Zhang, H. Spatial variations in pedestrian soundscape evaluation of traffic noise. Environ. Impact Assess. Rev. 2020, 83, 106399. [Google Scholar] [CrossRef]
  66. Aletta, F.; Kang, J. Soundscape approach integrating noise mapping techniques: A case study in Brighton, UK. Noise Mapp. 2015, 2, 1–12. [Google Scholar] [CrossRef]
  67. Liu, J.; Kang, J.; Luo, T.; Behm, H.; Coppack, T. Spatiotemporal variability of soundscapes in a multiple functional urban area. Landsc. Urban Plan. 2013, 115, 1–9. [Google Scholar] [CrossRef]
  68. Jeon, J.Y.; Jo, H.I. Effects of audio-visual interactions on soundscape and landscape perception and their influence on satisfaction with the urban environment. Build. Environ. 2020, 169, 106544. [Google Scholar] [CrossRef]
  69. Ratcliffe, E.; Gatersleben, B.; Sowden, P.T. Bird sounds and their contributions to perceived attention restoration and stress recovery. J. Environ. Psychol. 2013, 36, 221–228. [Google Scholar] [CrossRef]
  70. Koole, A.; Nagtegaal, A.P.; Homans, N.C.; Hofman, A.; Baatenburg De Jong, R.J.; Goedegebure, A. Using the Digits-In-Noise Test to Estimate Age-Related Hearing Loss. Ear Hear. 2016, 37, 508–513. [Google Scholar] [CrossRef]
  71. Kastenholz, E.; Marques, C.P.; Carneiro, M.J. Place attachment through sensory-rich, emotion-generating place experiences in rural tourism. J. Destin. Mark. Manag. 2020, 17, 100455. [Google Scholar] [CrossRef]
  72. Chubchuwong, M.; Beise-Zee, R.; Speece, M.W. The Effect of Nature-based Tourism, Destination Attachment and Property Ownership on Environmental-friendliness of Visitors: A Study in Thailand. Asia Pac. J. Tour. Res. 2015, 20, 656–679. [Google Scholar] [CrossRef]
  73. De Vos, J. Satisfaction-induced travel behaviour. Transp. Res. Part F Traffic Psychol. Behav. 2019, 63, 12–21. [Google Scholar] [CrossRef]
  74. Ode Sang, Å.; Sang, N.; Hedblom, M.; Sevelin, G.; Knez, I.; Gunnarsson, B. Are path choices of people moving through urban green spaces explained by gender and age? Implications for planning and management. Urban For. Urban Green. 2020, 49, 126628. [Google Scholar] [CrossRef]
Figure 1. A geographic location map of the three urban greenways in Fuzhou City selected for this study. Notes: the number in the circle is the serial number of the measurement point.
Forests 15 00670 g001
Figure 2. Statistical information of questionnaire respondents’ sample demographic, social, and behavioral characteristics (n = 264).
Forests 15 00670 g002
Figure 3. Analysis of acoustic indicators of different types of landscape spaces in urban greenways. Notes: (a) indicates the analysis of acoustic indicators for the whole day without day and night; (b) indicates the analysis of acoustic indicators by day and night.
Forests 15 00670 g003
Figure 4. Characterization of perceived sound source dominance in urban greenway landscape space. Notes: (a) is the spatial analysis of the enclosure type; (b) is the spatial analysis of the coverage type; (c) is the analysis of different times.
Forests 15 00670 g004
Figure 5. Characterization of sound source harmony perception in urban greenway landscape space.
Forests 15 00670 g005
Table 1. Typical sound source composition in the case of city greenways.
Sound CategorySound SourceAbbreviations
Natural soundSound of frogsSF
Cicadas singingCS
Birds singingBS
The sound of wind blowing leavesTR
Artificial soundThe sound of talkingAT
FootstepsFS
Children playingPC
Sweeping soundsSS
MusicMN
Mechanical soundSounds of trafficST
Sound of machinesMS
Table 2. Sound source dominance and sound source harmony derivation model.
Model Equation
S D D ( j i ) = P O S ( j i ) × P L S ( j i )
S H D ( j i ) = 1 / e j = 1 n P F S ( j ) / n P F S ( j i ) + 1 0.5 × P O S ( j i ) × P L S ( j i )
Notes: SDD is a sound dominant degree; SHD is a sound harmonious degree; POS is perceived occurrences of sound; PLS is perceived loudness of sound; j is the jth sample; i is the ith source; and n is the sample size.
Table 3. Spatial types of urban greenway landscapes.
Type of SpaceCombinatorial ApproachNumber of Collection PointsSchematic Representation of Collection Points
Type of CoverageUncovered0 ≤ d/L ≤ 1/2191Forests 15 00670 i001
Covered1/2 < d/L ≤ 173Forests 15 00670 i002
Type of enclosureOpen0 ≤ i/L < 1/444Forests 15 00670 i003
Semi-open1/4 ≤ i/L ≤ 1/279Forests 15 00670 i004
Semi-enclosed1/2 < i/L ≤ 3/497Forests 15 00670 i005
Enclosed3/4 < i/L ≤ 144Forests 15 00670 i006
Notes: L = length of the site boundary, i = length of the enclosing boundary, d = length of covering boundary; Material of enclosure and coverage: Green or Construction.
Table 4. Differential analysis of sound source perception in different landscape spaces of urban greenways.
Sound SourceCovered-Type SpaceEnclosed-Type Space
SDDSHDSDDSHD
SF1.2520.3426.5411.533
CS0.4990.28519.577 ***1.385
BS2.4664.799 *12.890 *4.086
TR12.156 ***1.6352.9185.820
AT6.315 *1.06521.175 ***2.955
FS0.9070.38814.297 *5.013
PC0.1830.28121.053 ***8.667 *
SS0.1681.7343.7145.154
MN6.844 *0.0866.5713.858
ST0.5791.41317.371 ***3.228
MS1.0600.00015.719 *5.559
Notes: * indicates p < 0.05, and *** indicates p < 0.001.
Table 5. Pairwise comparative analysis of perceived variability of sound sources in landscape spaces with different enclosure types of urban greenways.
NormSound SourceK1–K2K1–K3K1–K4K2–K3K2–K4K3–K4
SDDCS2.4711.0730.0134.354 ***2.486−1.058
BS2.7261.610−0.329−1.452−3.099 *−1.996
AT4.372 ***−3.698 **−3.524 **0.9910.378−0.435
FS−2.525−0.3490.090−3.553 **−2.4230.454
PC4.495 ***−3.612 **−2.4781.2471.6860.706
ST1.947−2.876 *−4.037 ***−1.032−2.628−1.859
MS−2.150−0.281−1.299−3.006 *−3.622 **−1.243
SHDPC2.672 *−2.099−0.7390.7991.8341.232
Notes: * indicates p < 0.05, ** indicates p < 0.01, *** indicates p < 0.001; K1 is open space, K2 is semi-open space, K3 is semi-enclosed space, and K4 is enclosed space.
Table 6. Results of the principal component analysis of soundscape perception factors of the urban greenway landscape space.
Common DivisorFactorIngredientVariance Contribution/%
12
F1
(Soundscape pleasure)
Pleasant0.83150.329
Harmonious0.843
Comfortable0.820
F2
(Soundscape richness)
Rich0.81117.623
Varied0.900
Quiet
Table 7. Difference analysis of overall soundscape perception in different landscape spaces of urban greenways.
NormCovered-Type SpaceEnclosed-Type Space
Soundscape pleasantness2.9868.459 *
Soundscape richness2.5368.493 *
Notes: * indicates p < 0.05.
Table 8. Pairwise comparative analysis of the variability of soundscape perception in different landscape spaces in urban greenways.
NormK1–K2K1–K3K1–K4K2–K3K2–K4K3–K4
Soundscape pleasantness−2.3342.4192.648 *0.0040.6670.687
Soundscape richness−2.693 *1.4662.199−1.585−0.2001.114
Notes: * indicates p < 0.05; K1 is open space, K2 is semi-open space, K3 is semi-enclosed space, and K4 is enclosed space.
Table 9. Spearman’s correlation analysis of soundscape perception and sound source perception in different landscape spaces of urban greenways.
Type of Sound Source SenseSpatial TypeDependent Variable
Pleasure F1Richness F2
Degree of SuperiorityNo coverageSF (−0.125 *)
AT (−0.180 **)
FS (−0.126 *)
PC (−0.154 *)
MN (−0.132 *)
ST (−0.200 **)
MS (−0.169 **)
AT (−0.142 *)
PC (−0.124 *)
ST (−0.144 *)
CoveredBS (0.136 *)
FS (0.123 *)
BS (0.123 *)
FS (0.126 *)
Enclosed
Semi-enclosed
Semi-openBS (0.130 *)
AT (0.123 *)
FS (0.128 *)
MN (0.121 *)
OpenSF (−0.171 **)
CS (−0.163 **)
BS (−0.173 **)
TR (−0.164 **)
AT (−0.186 **)
FS (−0.183 **)
PC (−0.180 **)
SS (−0.172 **)
MN (−0.177 **)
ST (−0.188 **)
MS (−0.184 **)
SF (−0.144 *)
CS (−0.137 *)
BS (−0.141 *)
TR (−0.138 *)
AT (−0.150 *)
FS (−0.135 *)
PC (−0.148 *)
SS (−0.133 *)
MN (−0.148 *)
ST (−0.156 *)
MS (−0.150 *)
Degree of HarmonyNo coverage
CoveredSF (0.141 *)
BS (0.137 *)
TR (0.145 *)
SS (−0.203 **)
ST (−0.206 **)
MS (−0.126 *)
SS (−0.217 **)
ST (−0.190 **)
EnclosedST (−0.137 *)PC (−0.124 *)
ST (−0.137 *)
Semi-enclosedCS (−0.138 *)
SS (−0.235 **)
Semi-openCS (0.138 *)
TR (0.156 *)
MS (−0.126 *)
BS (0.158 *)
TR (0.173 **)
MS (−0.169 **)
OpenSF (−0.145 *)
CS (−0.139 *)
BS (−0.162 **)
TR (−0.143 *)
MN (−0.151 *)
ST (0.135 *)
BS (−0.139 *)
TR (−0.136 *)
ST (0.135 *)
Notes: * p < 0.05, ** indicates p < 0.01.
Table 10. Stepwise linear regression analysis of sound source perception indicators and overall soundscape perception for different landscape spaces in urban greenways.
Spatial TypeDependent VariableIndependent VariableBetatVIFR2F-Value
Type of coverageNo coveragePleasureST a−0.278−4.692 ***1.0000.07822.012 ***
RichnessST a−0.187−3.086 **1.0000.0359.522 **
CoveredPleasureBS b0.2203.691 ***1.0160.0888.339 ***
TR b0.1732.881 **1.032
SS b−0.125−2.065 *1.040
RichnessBS b0.1762.894 **1.0000.0318.378 **
Type of enclosureEnclosedPleasure
Richness
Semi-enclosedPleasure
RichnessSS b−0.219−3.627 ***1.0000.04813.152 ***
Semi-openPleasureBS b0.4793.662 ***4.7210.0547.463 ***
BS a−0.351−2.685 **4.721
PleasureBS b0.1843.023 **1.0000.0349.136 **
OpenPleasureST a−0.271−4.549 ***1.0000.07320.691 ***
RichnessST a−0.173−2.840 **1.0000.0308.068 **
Notes: a indicates source dominance, b indicates source harmony, * indicates p < 0.05, ** indicates p < 0.01, and *** indicates p < 0.001.
Table 11. Spearman’s rho correlation analysis between demographic attributes and overall soundscape perception of urban greenways.
User CharacteristicsSound Source DominanceHarmony of Sound SourcesSoundscape Perception Evaluation Dimensions
SexTR (0.125 *)
FS (0.151 *)
SS (0.165 **)
Harmonious (−0.143 *)
AgeSF (−0.147 *)
TR (−0.205 **)
FS (−0.172 **)
MS (−0.135 *)
CS (0.163 **)
BS (0.131 *)
PC (0.140 *)
ST (−0.257 **)
Pleasure (0.142 *)
Quiet (0.168 **)
EducationMS (0.170 **)SF (0.134 *)
TR (0.161 **)
ST (0.140 *)
Quiet (0.131 *)
Occupation
Stress levelFS (0.146 *)
MN (0.161 **)
FS (0.164 **)
MN (0.159 **)
Type of residenceCS (0.233 **)
BS (0.141 *)
TR (−0.158 *)
MS (−0.160 **)
CS (0.171 **)
BS (0.162 **)
FS (0.132 *)
ST (−0.173 **)
Frequency of visitCS (−0.167 **)
BS (−0.246 **)
SS (−0.144 *)
BS (−0.236 **)
FS (−0.128 *)
Harmonious (0.166 **)
Duration of visitFS (0.183 **)
SS (0.133 *)
MN (0.210 **)
PC (−0.144 *)
Notes: * indicates p < 0.05, ** indicates p < 0.01.
Disclaimer/Publisher’s Note: The statements, opinions and data contained in all publications are solely those of the individual author(s) and contributor(s) and not of MDPI and/or the editor(s). MDPI and/or the editor(s) disclaim responsibility for any injury to people or property resulting from any ideas, methods, instructions or products referred to in the content.

