Abstract
The habitat of the lichen Scots pine forest is currently one of the communities that requires attention and active protection due to its rapid disappearance. In our study, we identified factors that can be modified to preserve this habitat. The primary focus of our research was on the significance of tree height and sunlight in fostering the development of a lichen-rich layer within the lichen Scots pine forest. Additionally, we investigated the environmental factors influencing the presence of specific species of lichens and bryophytes, including those that form communities and those that displace species characteristic of the lichen Scots pine forest community. Our study was conducted in Bory Tucholskie National Park (N-W Poland) using 20 experimental sites and 248 point-frame plots from spring 2021 to winter 2022. Fieldwork involved species surveys, measurements of photosynthetic activity in lichens and bryophytes, and collection of environmental data. Through parametric testing, modeling, and mapping, our main findings confirmed that light availability, influenced by tree height, is a critical factor in maintaining a well-preserved lichen-rich layer and facilitating habitat reintroduction.
1. Introduction
Photosynthesis is regulated by numerous environmental factors that not only limit steady-state photosynthesis but also constrain the speed of response to environmental fluctuations [1,2,3]. Under natural conditions, photosynthesis occurs in fluctuating irradiance. We define this process as dynamic photosynthesis, regulated by the kinetics of underlying processes and interspecific variation in response to fluctuating irradiance [2,4].
The effect of light on photoautotrophic species can be assessed in direct terms (i.e., how light directly affects the photosynthetic system of the plant) and indirectly (i.e., how this solar energy also in the form of thermal energy shapes the ecosystem conditions, including water conditions). The amount of energy that reaches the ecological niche in a community is largely shaped by the structure of the plant community itself. In the case of the community of the lichen Scots pine forest, it is a specifically developed strongly deformed Scots pine stand on a poor, sandy base with a lichen-rich undergrowth layer. The lichens that occur there are light-requiring organisms, adapted to high values of sunlight intensity, as evidenced by the presence of the same species of lichens in open habitats, for example, alpine or tundra communities [5,6]. Previous studies have shown that an important environmental factor limiting the occurrence of undergrowth is the thickness of organic matter on the forest substrate [7]. However, an equally important factor is the height of the pine stand, which changes a lichen-rich undergrowth layer into a bryophyte-rich undergrowth layer. This relationship was believed to be related to the limiting impact of the pine stand on the availability of solar energy in the forest undergrowth layer [7]; however, this has not been empirically proven in research to date.
Since 2015, studies have been carried out in Bory Tucholskie National Park on 13 hectares of lichen Scots pine forest habitat belonging to the Cladonio-Pinetum Juraszek 1927 community [7,8,9]. In 2020, a pilot study was conducted focusing on the determination of the degree of viability of selected species of lichens and bryophytes with respect to environmental conditions, using the method of assessing photosynthetic activity [9].
The region where the research took place is marked by severely impoverished and arid conditions, linked to a particular substrate created during the last ice age (consisting of sandy soils in the valleys of major rivers and post-glacial outwash sands). Over time, this environment has been influenced by various human activities, including cattle grazing, the collection of litter (such as pine needles, pinecones, and small branches), deforestation, and clear-cutting [7,8].
On the one hand, previous studies [9] have observed a certain repeatability of photosynthetic activity of the studied species in relation to the seasons and time of day; on the other hand, clearly the conservation status of the lichen undergrowth was correlated with the height of the trees. So, in the current study, which has been conducted through the use of automatic measuring devices (loggers) distributed in dozens of sites, an attempt was made to clarify the mechanisms of the effect of the sun per year in relation to the height of the trees on the photosynthetic activity of lichens and bryophytes in the undergrowth of the brushwood forest.
The aim of the presented research was to study how sunlight identified as a source of PAR (Photosynthetic Active Radiation) and thermal energy shape the lichen-rich undergrowth layer in the lichen Scots pine forest community. Due to the structure of this community with pine stands of different age and height, the amount of light reaching the undergrowth differs. Therefore, we assume that both the height of the stand and the amount of sunlight reaching the forest floor influence the development of the lichen-rich undergrowth layer. Apart from environmental conditions, lichen photosynthesis is closely related to the photosynthetic abilities of the photobiont, i.e., an autotrophic prokaryotic or eukaryotic alga [10,11,12,13]. On the other hand, in bryophytes, it occurs in the gametophyte, which is the dominant generation, additionally nourishing the sporophyte [14]. Furthermore, we studied the influence of environmental variables on certain species of lichens and bryophytes present in the study area. We set the following hypotheses: (1) an increase in the percentage cover of the lichen-rich undergrowth layer is directly proportional to the increased amount of light reaching the substrate, which is dependent on the tree height; (2) an increase in the amount of light decreases the percentage cover of the bryophyte-rich undergrowth layer.
2. Material and Methods
2.1. Study Area
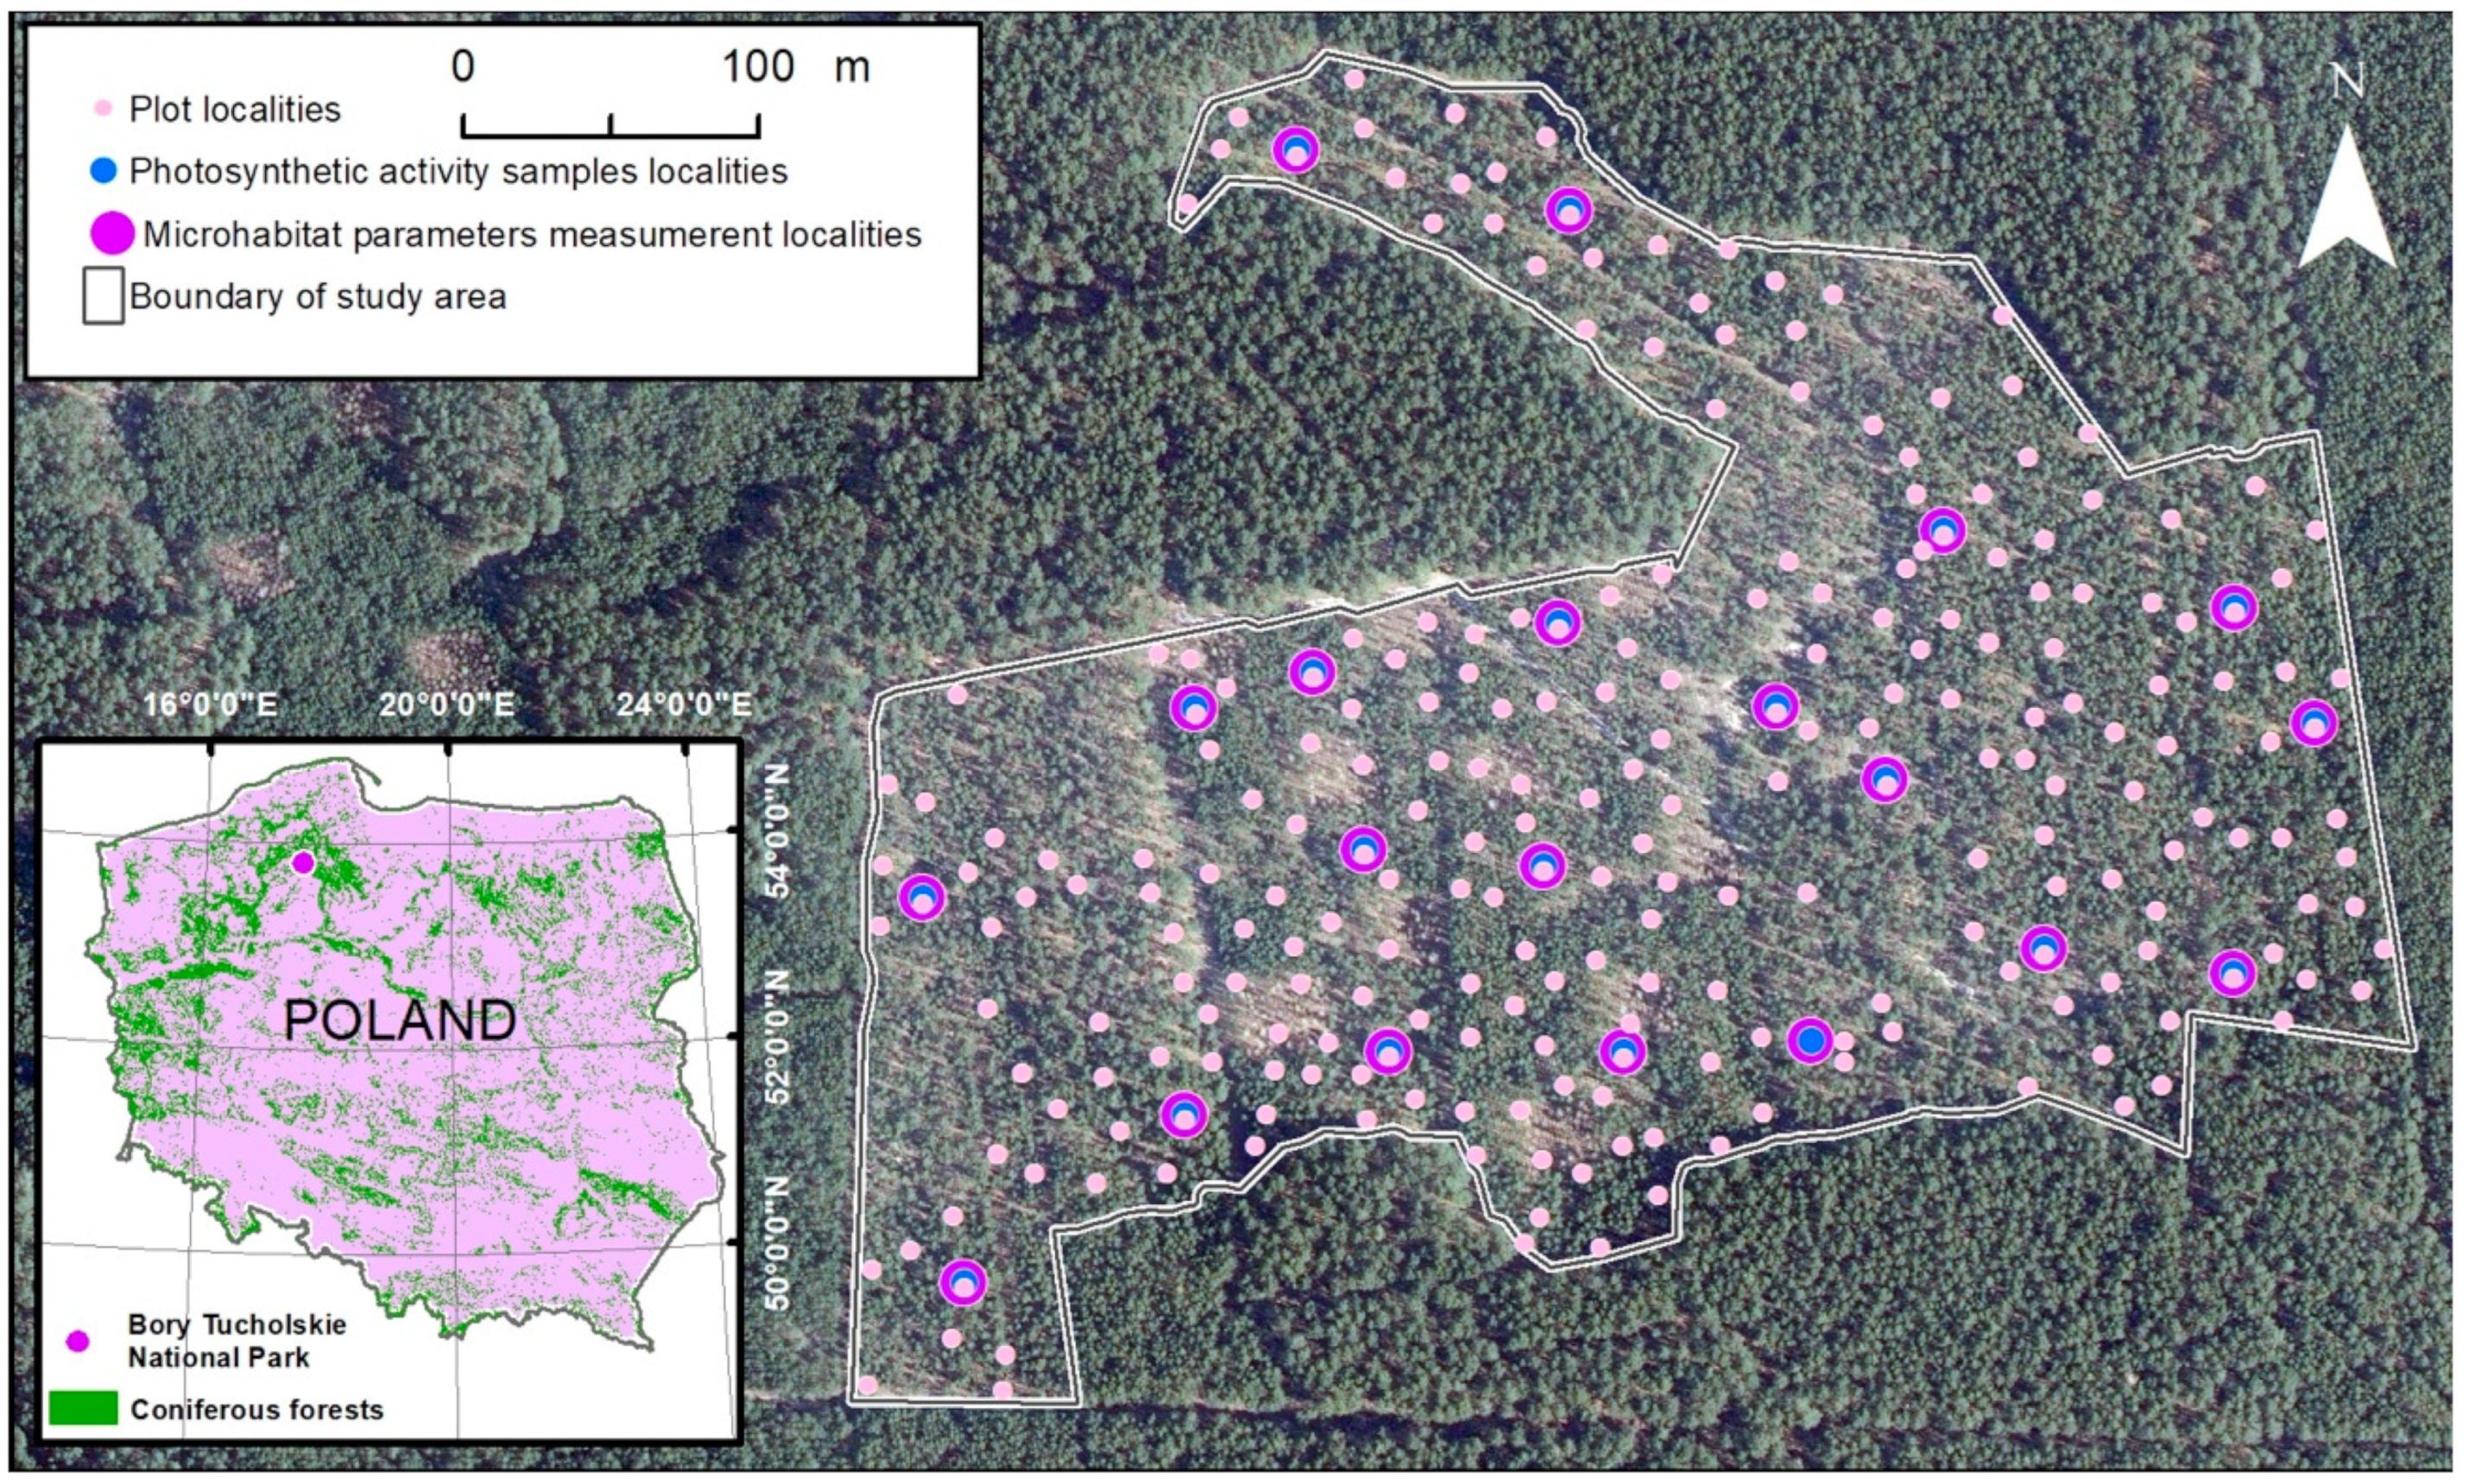
Fieldwork was carried out for one year from spring 2021 to winter 2022 in the ‘Bory Tucholskie’ National Park (Tuchola Forest region, Nort-West Poland) (Figure 1). In 2017 in the north part of the National Park, a study area (13 ha) of the lichen Scots pine forest was designated that included 20 experimental localities designated in 2017 and an additional 248 point-frame plots analyzed in 2021 (Figure 1).
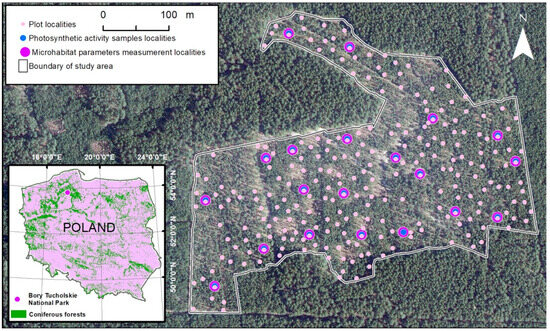
Figure 1.
Study area in the north part of Bory Tucholskie National Park in Poland (white line) of the lichen Scots pine forest community with 20 experimental localities (violet dots) having automatic substrate temperature and light intensity loggers; among them, 20 localities carried out the measurement of the chosen cryptogams species’ photosynthetic activity [Fv/Fm] (the maximal quantum yields of photosystem II) (blue dots) and 248 new localities were point-framing plots (pink dots). Orthophotomap layer by © The Head Office of Geodesy and Cartography (www.geoportal.gov.pl 2022).
2.2. Lichen Undergrowth Layer and Trees Height Mapping
In 2018, an aerial LIDAR scan of the stand was performed, which was used to make a tree crown model [7,15]. Based on the model, tree heights (THs) were calculated, which were grouped into three height ranges (1–9 m, 10–13 m, and 14–18 m) and presented on the map (Figure 2A). Data for crown areas (CAs) and tree cover (TC-2017) were obtained from the same tree crown model. These data were used to perform later statistical analysis.
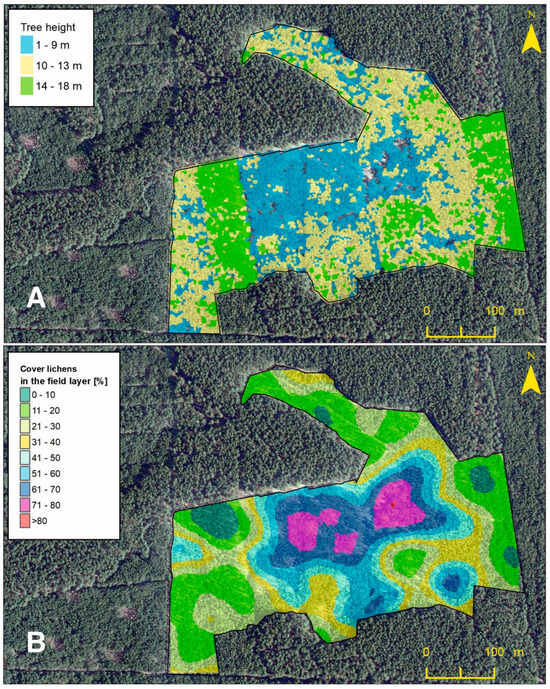
Figure 2.
Map of the tree height model (A) and map of the percentage cover lichens in the Scots pine forest undergrowth layer model (B).
Utilizing the random points tool within the ArcGIS software 10.8.2 (ESRI, Redlands, CA, USA, 2020) across the study area, with the exclusion of zones where all undergrowth cover was cleared in 2018 as part of a prior project, a total of 248 sites were delineated, forming the shapefile layer of the point-frame (Figure 1). In the field, randomly determined positions were located with a precision of 1 m using an iPad device equipped with the MapPlus 2.8.20 application (Miocool Inc., 2021). For this purpose, an aluminum frame was used, divided by lines into 100 squares with dimensions of 5 by 5 cm. The frame was placed at the designated site and then each species that was at the intersection of the lines was noted as one percent. The records for each species were summed, and thus the percentage cover of each species in each plot was calculated. In the case that there were no species at the intersection, the zero value was observed. Then, for each plot, the percentage cover for all lichen and bryophyte species was summed. Based on the obtained results, a geodatabase of the point-frame shapefile layer was created. This layer was used to create the percentage cover of lichens in the Scots pine forest undergrowth layer model (Figure 2B). Both models are presented as maps (Figure 2) for visual comparison.
2.3. Measurement Microhabitat Variables
Each of the 20 experimental localities had automatic loggers (HOBO MX2202 Underwater Temp/Light, Version Number: 140.59) measuring the temperature of the substrate [°C] and the intensity of sunlight [lux] at 6:00 a.m., 9:00 a.m., 12:00 a.m., 3:00 p.m., and 6:00 p.m. from 1 June 2021 to 31 February 2022. For presenting the results of statistical analyses, measurements taken on the days of measuring the photosynthetic activity of selected species of lichens and bryophytes were used. For selected microhabitat variables that had a statistically significant effect, we carried out an interpolation modeling process using the Kriging Tool in the ArcGIS ArcMap application.
2.4. Measurement of Photosynthetic Activity
All 20 experimental localities contained 4 selected species of lichens (Cladonia mitis Sandst; Cladonia uncialis (L.) Weber ex F.H. Wigg.) and bryophytes (Pleurozium schreberi (Willd. ex Brid.) Mitt.; Dicranum scoparium (L.) Hedw.) (Figure 1). We chose 3 days each in the months representing the four seasons found in this part of Europe. The choice of days was based on weather conditions, so that the days of conducting field work were preceded by stabilized weather characteristic of the season. In these places in the outlined seasons (spring (23–25 April 2021); summer (25–27 June 2021); autumn (1–3 October 2021); and winter (4–6 February 2022), we randomly selected individuals from species within the plot and carried out measurements of photosynthetic activity [Fv/Fm] (the maximal quantum yields of photosystem II) at designated times of the day (6:00 a.m.; 9:00 a.m.; 12:00 a.m.; 3:00 p.m.; and 6:00 p.m.). Twenty samples of each species were simultaneously collected on a designated day and at a specified time. Each sample, approximately 2 g in weight, was carefully deposited into conical tubes containing 5 milliliters of rainwater. Subsequently, the samples were subjected to a hydration period lasting 2 h. The objective of this thallus watering procedure was to ensure a uniform hydration level across all samples, thus standardizing the experimental conditions.
Measurements were conducted utilizing a Handy PEA+ fluorometer manufactured by Hansatech Instrument Ltd., located in King’s Lynn, Norfolk, UK. The prompt fluorescence (PF) method [16] was employed for data acquisition. Prior to measurements, each sample underwent a dark adaptation phase lasting approximately 15 min [17], facilitating the quenching of the light phase of photosynthesis reactions. Upon completion of the adaptation phase, samples were subjected to continuous light exposure with wavelengths shorter than 670 nm. Chlorophyll fluorescence emitted within the range of 680 to 760 nm was then recorded by the photodetector. Post-measurement, the Fv/Fm ratio was determined, representing the maximum photochemical efficiency of photosystem II. This ratio is widely acknowledged as a robust indicator of the photochemical activity within the photosynthetic apparatus [18].
2.5. Statistical Analysis
The following variables were selected to determine the relationship between tree height and lichens: (a) percentage cover of lichen (N = 248); (b) percentage cover of Cladonia mitis (N = 248); (c) percentage cover of C. gracilis (L.) Willd. (N = 248) (both lichen species characteristic of the Cladonio-Pinetum complex); (d) percentage cover of P. schreberi (N = 248) (bryophyte species were additionally taken into account due to their expansive nature causing it to occupy areas after retreating lichens). Pearson’s r correlation analysis was performed for an equal sample size (p < 0.05). Scatterplots were presented to show the relationship between the various variables (Figure 3).
To investigate the relationship between lichen cover and microhabitat variables (N = 248), i.e., substrate temperature (Table 1a) and light intensity (Table 1b) in a seasonal approach (summer, autumn, and winter), multiple regression analysis was performed for an equal sample size (p < 0.05). The results obtained are presented in Table 1.

Table 1.
Results of stepwise multiple regression analysis for the effect of two microhabitat parameters: (a) substrate temperature (r = 0.61039, r2 = 0.37258371, F = 48.2988, p < 0.001) and (b) light intensity (r = 0.599672, r2 = 0.359607, F = 68.79, p < 0.001) in a seasonal approach (summer, autumn, and winter) on lichen cover. The constant tree height parameter was also included in both analyses. Variables with significant effect (p < 0.05) are provided in bold. Variables are listed according to p-value.
To investigate the relationship between the photosynthetic activity of selected species (C. mitis, C. uncialis, D. scoparium, and P. schreberi) in a seasonal approach (summer, autumn, and winter) at different times (9:00 a.m., 12:00 a.m., and 15:00 p.m.); the temperature in a seasonal approach (summer, autumn, and winter) at different times (9:00 a.m., 12:00 a.m., and 15:00 p.m.); light intensity in a seasonal approach (summer, autumn, and winter) at different times (9:00 a.m., 12:00 a.m., and 15:00 p.m.); and the height of trees, multiple regression analysis was performed for an equal sample size (p < 0.05). Modeling was not performed for the spring period due to the lack of measurements of microhabitat parameters. A total of 36 models were used (for the photosynthetic activity value of four species and three variables) where one data series counted N = 248 (total N = 11,904). The results obtained are presented in Supplementary Table S1.
As a result of photosynthetic activity measurements, the collected results (N = 2880) were statistically analyzed by a two-way analysis of variance (ANOVA) test followed by Tukey’s HSD (Honestly Significant Difference) test for an equal sample size (p < 0.05). The test was performed to reveal Fv/Fm differences between the following pairs of variables: (a) species (C. mitis, C. uncialis, D. scoparium, and P. schreberi) and season (spring, summer, autumn, and winter), and (b) species and time of day depending on the season (9:00, 12:00, and 15:00) (Table 2). Before the analysis, the normality of the distribution was verified using the Kolmogorov–Smirnov test (p > 0.05) and the Levene test (p > 0.05) to assess equality of variance. Box-and-whisker plot charts were presented to illustrate the differences (Figure 4).
Table 2.
Results of the two-way ANOVA assessing the effects of the following variables on cryptogams’ Fv/Fm: (a) species (Cladonia mitis Sandst; Cladonia uncialis (L.) Weber ex F.H. Wigg., Dicranum scoparium (L.) Hedw., Pleurozium schreberi (Willd. ex Brid.) Mitt.) and seasons (spring, summer, autumn, and winter); (b) species and daytime (8:00 a.m., 12:00 p.m., and 3:00 p.m.) during spring, (c) summer, (d) autumn, and (e) winter. Significant effects (p < 0.05) are denoted in bold.
To investigate the relationship between species of lichens and bryophytes, forest variables, and microhabitat variables, a canonical correspondence analysis (CCA), preceded by random Monte Carlo permutation tests, was performed using Canoco for Windows Version 4.51 (C) 1997–2003 Biometric—Plant Research International Wageningen, The Netherlands, and CANOCO CanocoDraw for Windows 4.1 (C) 1999–2003 Petr Smilauer. Statistical tests were performed using the StatSoft STATISTICA program (data analysis software system), version 13.3. The abbreviations of variables are explained in Table 3.
3. Results
3.1. Influence of Microhabitat Parameters on Photosynthetic Activity and Cover of Lichens and Bryophytes
By comparing the graphic interpretation of the lichen/bryophyte undergrowth layer model based on the quantitative data of the species of lichens and bryophytes and the tree height model, some relationships were found visually showing the presence of a large percentage cover of lichens in the undergrowth layer in low (1–9 m) and medium (10–13 m) places of the pine stand (Figure 2). On the other hand, the bryophyte-rich undergrowth layer was dominant in places where the pine stand reached the highest values (14–18 m) (Figure 2).
The linear relationship between tree height value, lichen cover value, and selected species of lichen and bryophyte cover value showed a strong linear correlation (Figure 3). The strongest relationship was shown between tree height and lichen cover in the undergrowth layer (Figure 3A). The cover of lichens in the forest undergrowth layer decreases with increasing tree height (r = −0.59). Slightly lower, the same as the previous, inverse correlations also occurred between tree height and percentage cover of C. mitis (r = −0.41) and C. gracilis (r = −0.4), the two most important habitat-forming species. In the case of P. schreberi, which competes strongly with lichens, a positive correlation with tree height occurred (r = 0.43).
Since strong relationships between tree height and percentage cover of lichens in the forest undergrowth layer were found, additionally, multiple regression analysis was performed that included data from three seasons (summer, autumn, and winter) on microhabitat parameters: average substrate temperature and average light intensity on the undergrowth surface and tree height (Table 1). Based on the multiple regression analysis performed, it was observed that the variables TH, ASTA, and ASTW (Table 1a) and TH and ALIA (Table 1b) had a large influence on the shaping of the lichen-rich undergrowth layer. The results of the next multiple regression analysis showed the relationship between the Fv/Fm of selected species (C. mitis, C. uncialis, D. scoparium, and P. schreberi) and the substrate temperature and light intensity microhabitat parameters in the aspects of daytime and seasons (Supplementary Table S1). In total, 36 models of the activity relationship of four species were made in each case for three variables, 13 of which showed statistical significance (Supplementary Table S1). For nine statistically significant models, a very high value of r > 0.5 of the regression coefficients was found, and for four, it was moderately strong 0.0 < r > 0.3 (Supplementary Table S1).
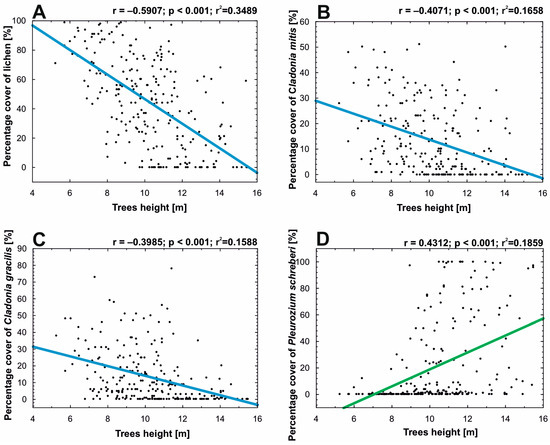
Figure 3.
Linear relationship between the Scots pine trees’ height in each point-framing plot and (A)—the percentage cover of lichens in the plots; (B)—the percentage cover of Cladonia mitis Sandst in the plots; (C)—the percentage cover of Cladonia gracilis (L.) Willd. in the plots; and (D)—the percentage cover of Pleurozium schreberi (Willd. ex Brid.) Mitt. in the plots.

In terms of species, relationships between the Fv/Fm of these species and the microhabitat parameters in terms of seasons and daytime were found to be statistically significant for the following: C. mitis—two out of nine results (autumn 9:00 a.m. and 12:00 a.m.); C. uncialis—five out of nine results (summer 9:00 a.m. and 12:00 a.m., autumn 9:00 a.m. and 3:00 p.m., and winter 9:00 a.m. and 3:00 p.m.); D. scoparium—two out of nine results (autumn 12:00 a.m. and winter 3:00 p.m.); and P. schreberi—three out of nine results (summer 9:00 a.m. and 12:00 a.m., and autumn 9:00 a.m.) (Supplementary Table S1).
3.2. Seasonal Variations in Photosynthetic Activity of Selected Lichen and Bryophyte Species
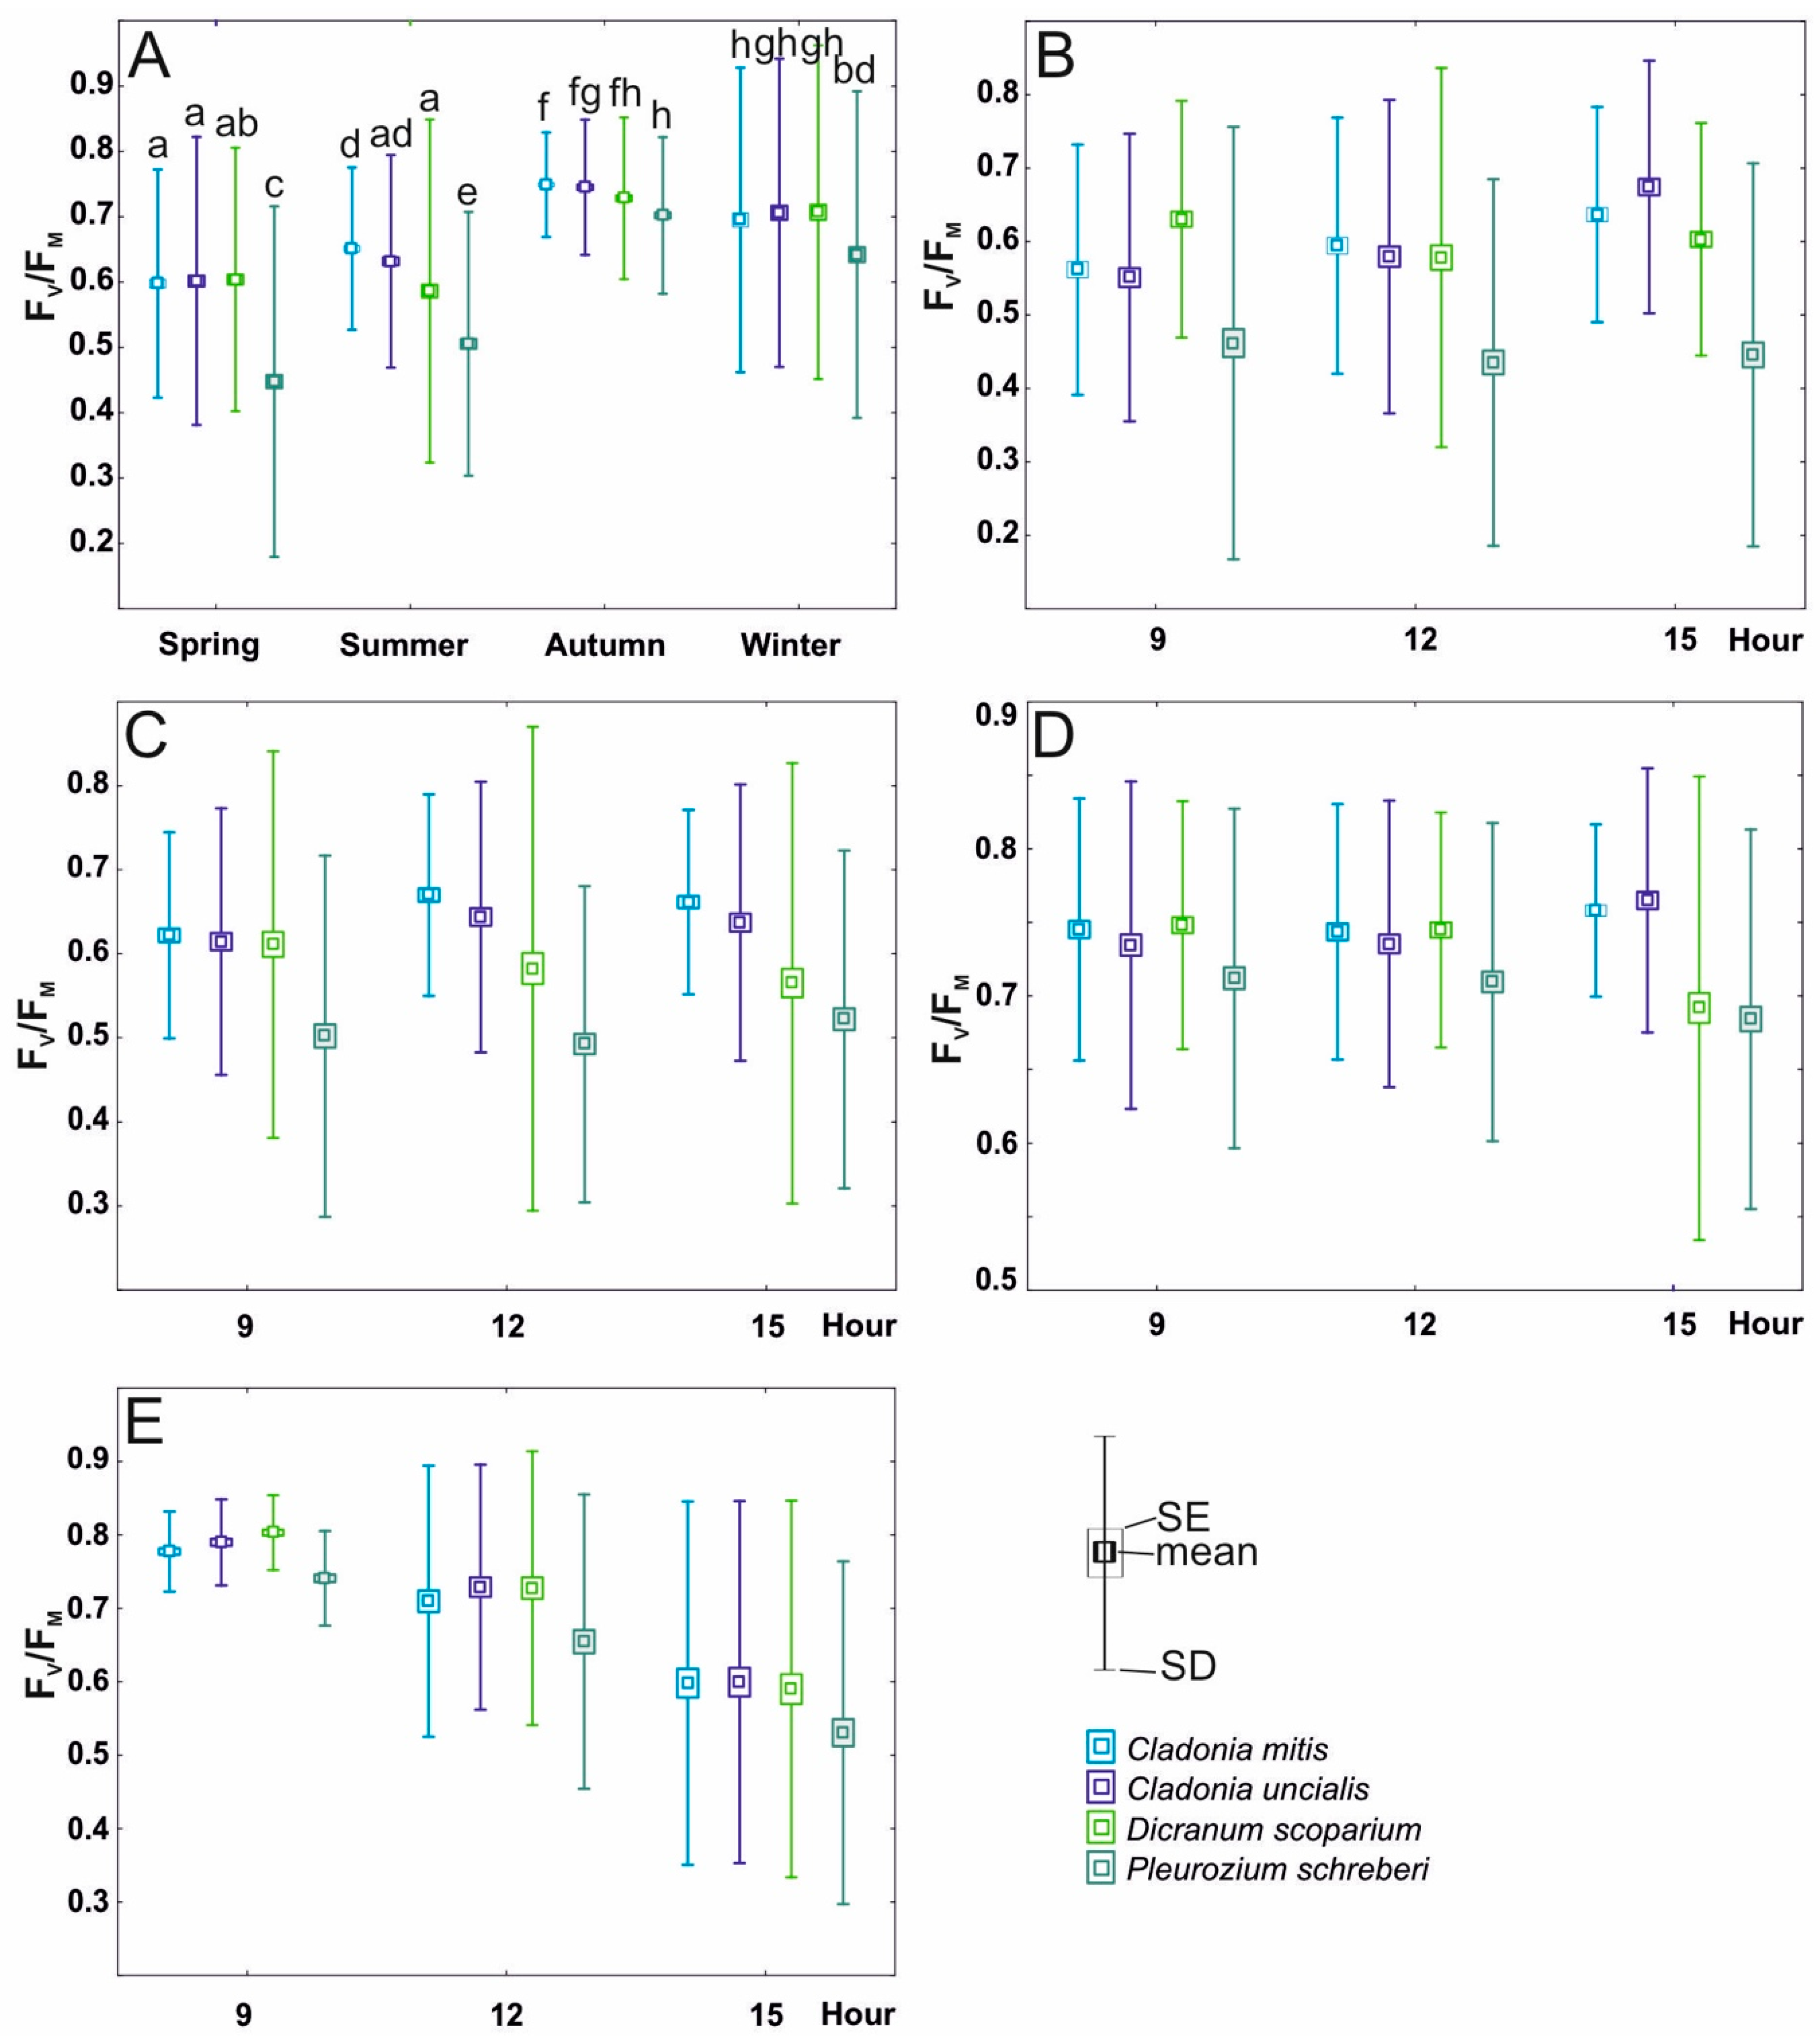
The outcomes of the two-way analysis of variance (ANOVA) demonstrated significant impacts of species, season, and their interaction on Fv/Fm values (see Table 2; depicted in Figure 4A). Across all examined species, Fv/Fm values reached their lowest during the spring and summer seasons, exhibiting an upward trend during autumn and winter (Figure 4A). Notably, during both spring and autumn, the Fv/Fm values of both lichens and D. scoparium demonstrated similarity and were significantly divergent from those of P. schreberi (Figure 4A). Moreover, during autumn, the Fv/Fm values for all species under investigation approached stabilization, resembling the levels observed during winter (Figure 4A).
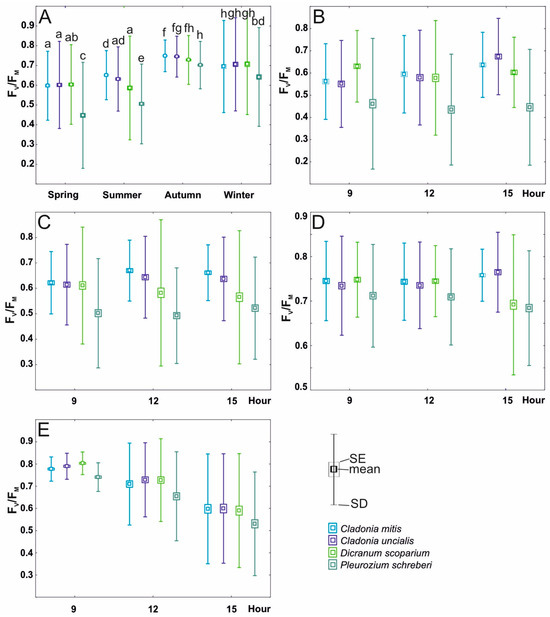
Figure 4.
Variability of Fv/Fm (mean ± SE and SD) including division into species (C. mitis Sandst, C. uncialis Weber ex F.H. Wigg., D. scoparium (L.) Hedw., and P. schreberi (Willd. ex Brid.) Mitt.) in relation to the following: (A)—season (spring, summer, and autumn); (B)—daytime in spring; (C)—daytime in summer; (D)—daytime in autumn; (E)—daytime in winter. The lowercase letters in section A denote the statistically significant interaction among species, season, and daytime.
In terms of the impact of species and daytime, both variables exerted influence on Fv/Fm; nonetheless, their interaction was not statistically significant during the winter daytime (refer to Table 2 and Figure 4E). The values of Fv/Fm in the daytime of each season differed; however, the results of daytime in summer and autumn were not significant (Table 2, Figure 4C,D). The values of Fv/Fm for daytime in summer show a slight upward trend during the day, reaching the highest values in the afternoon (Figure 4B), while in the case of the winter, the situation was the opposite, with Fv/Fm reaching the highest values in the morning (Figure 4E). For P. schreberi, the Fv/Fm was significantly lower compared to that of C. mitis, C. uncialis, and D. scoparium (see Figure 4B,C,E).
3.3. The Relationship between Species of Lichens and Bryophytes, Forest Variables, and Microhabitat Variables
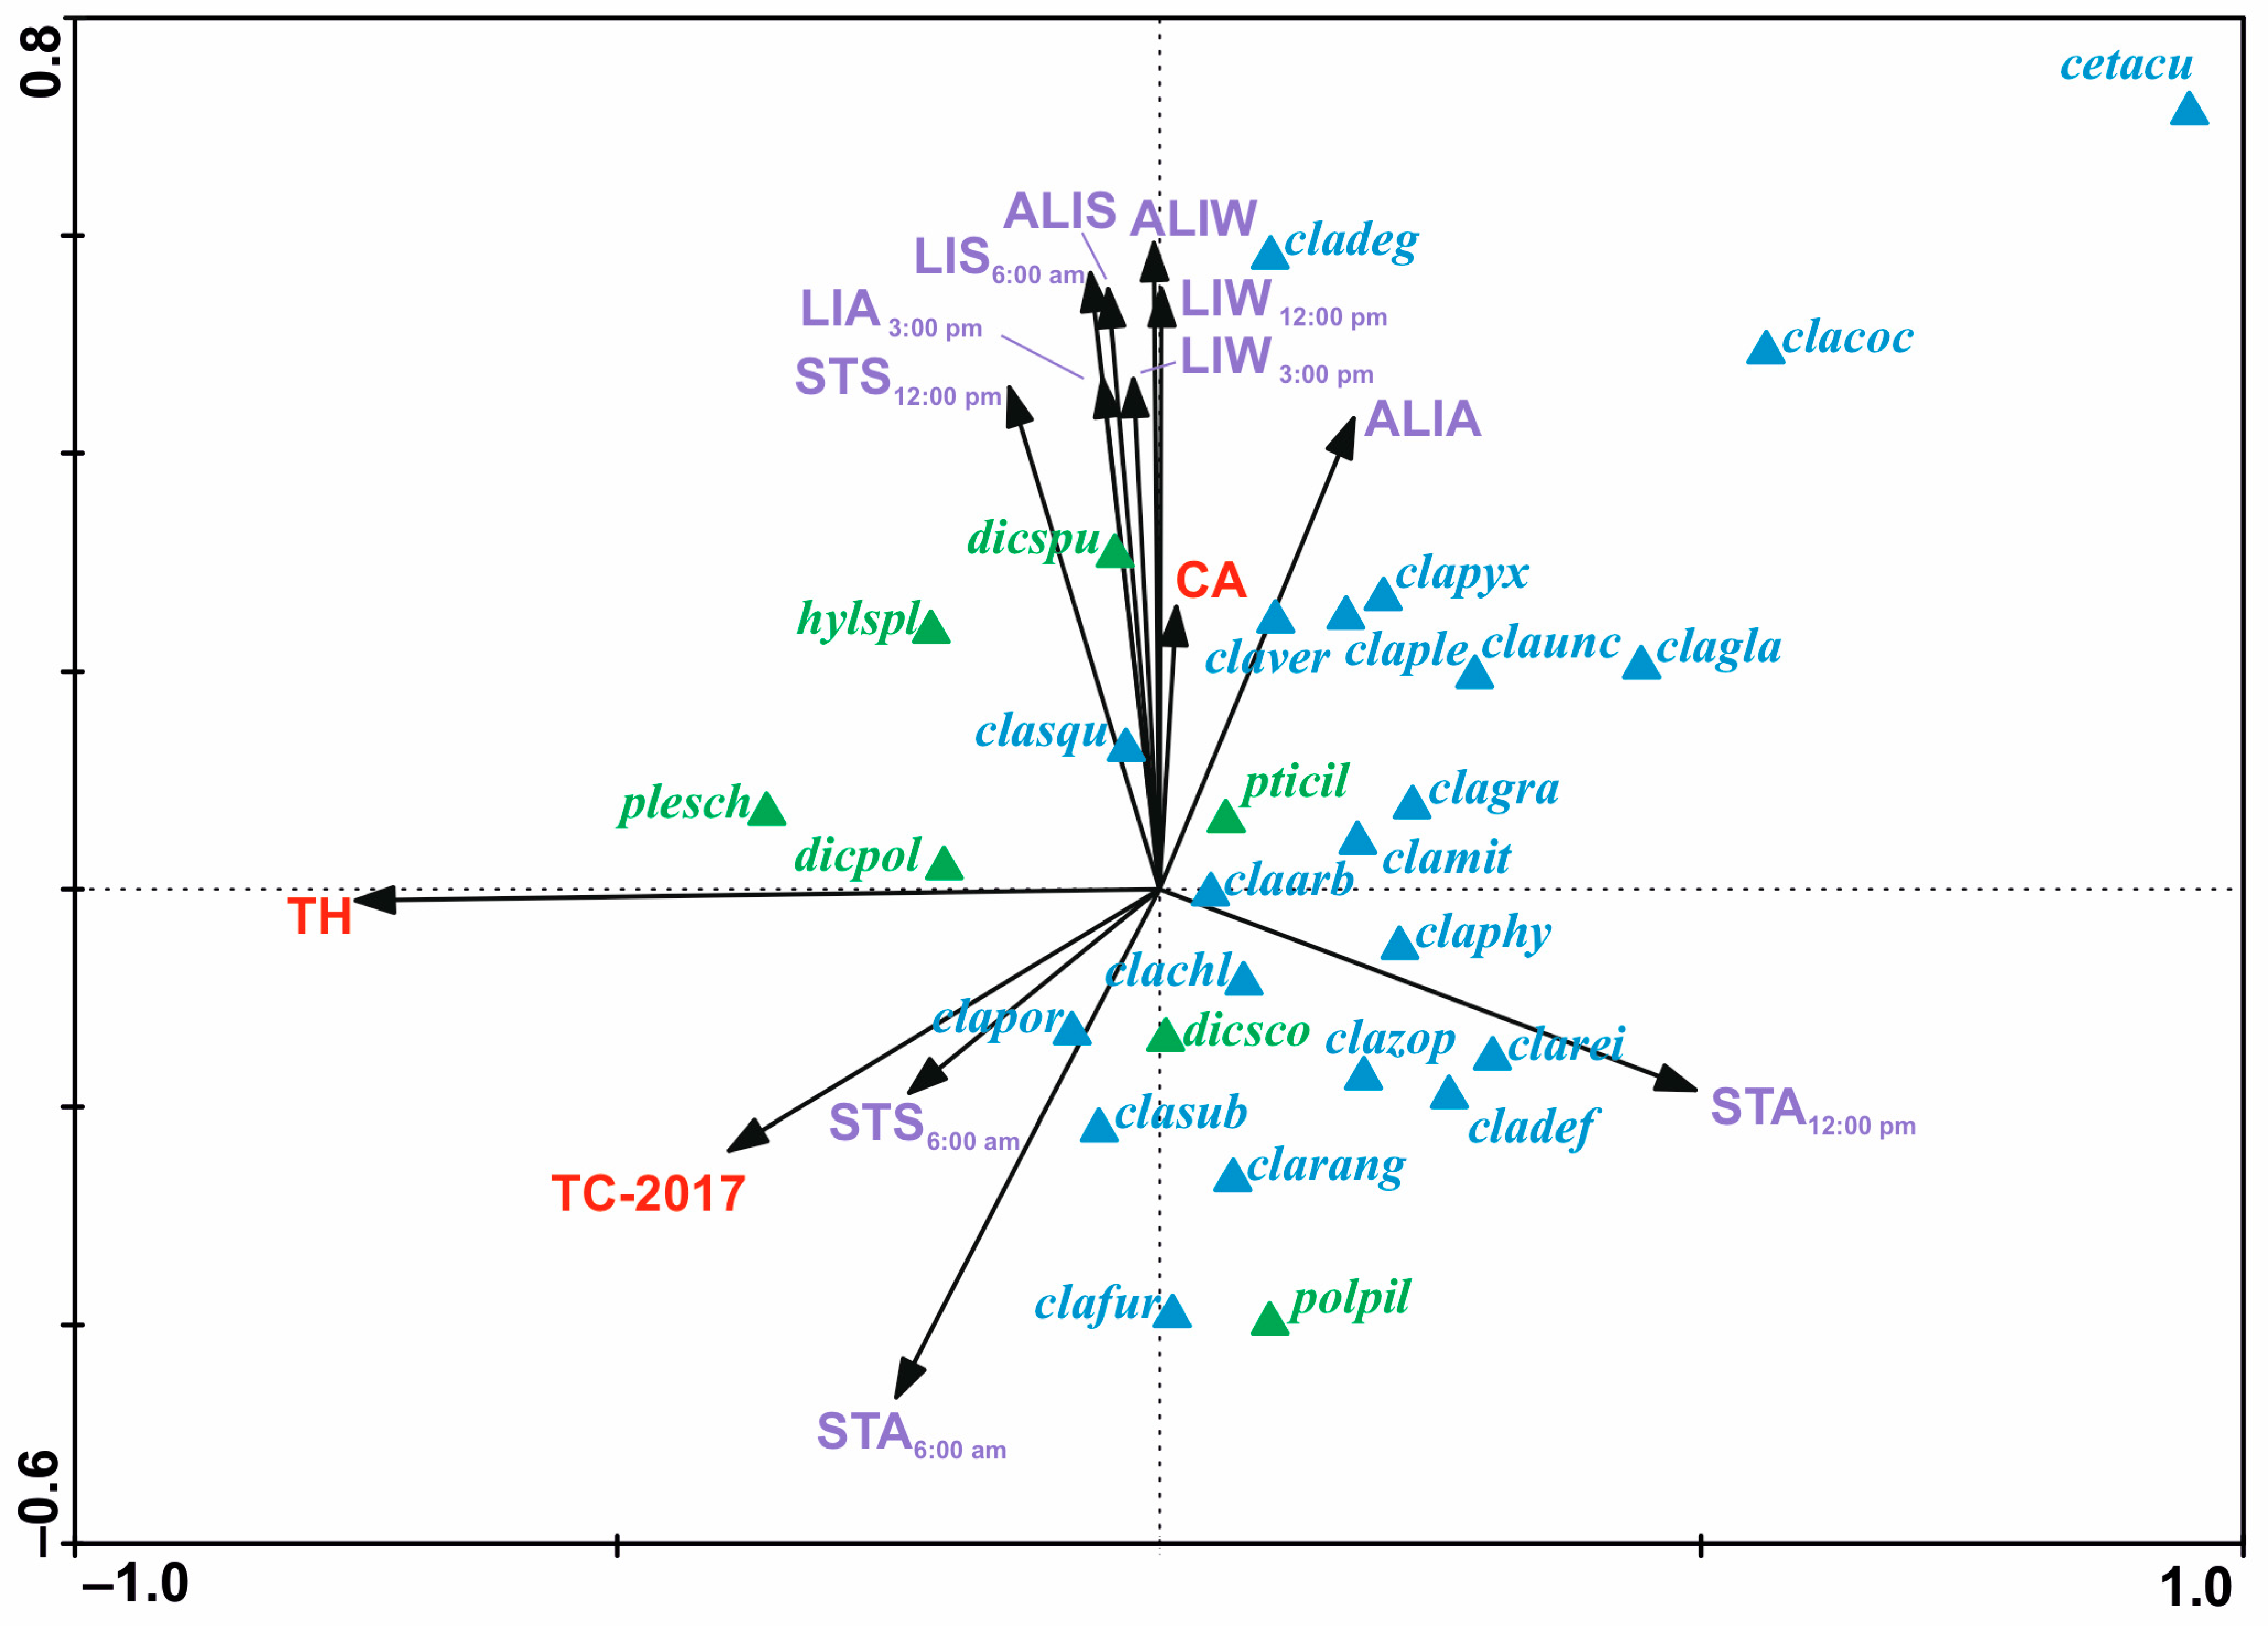
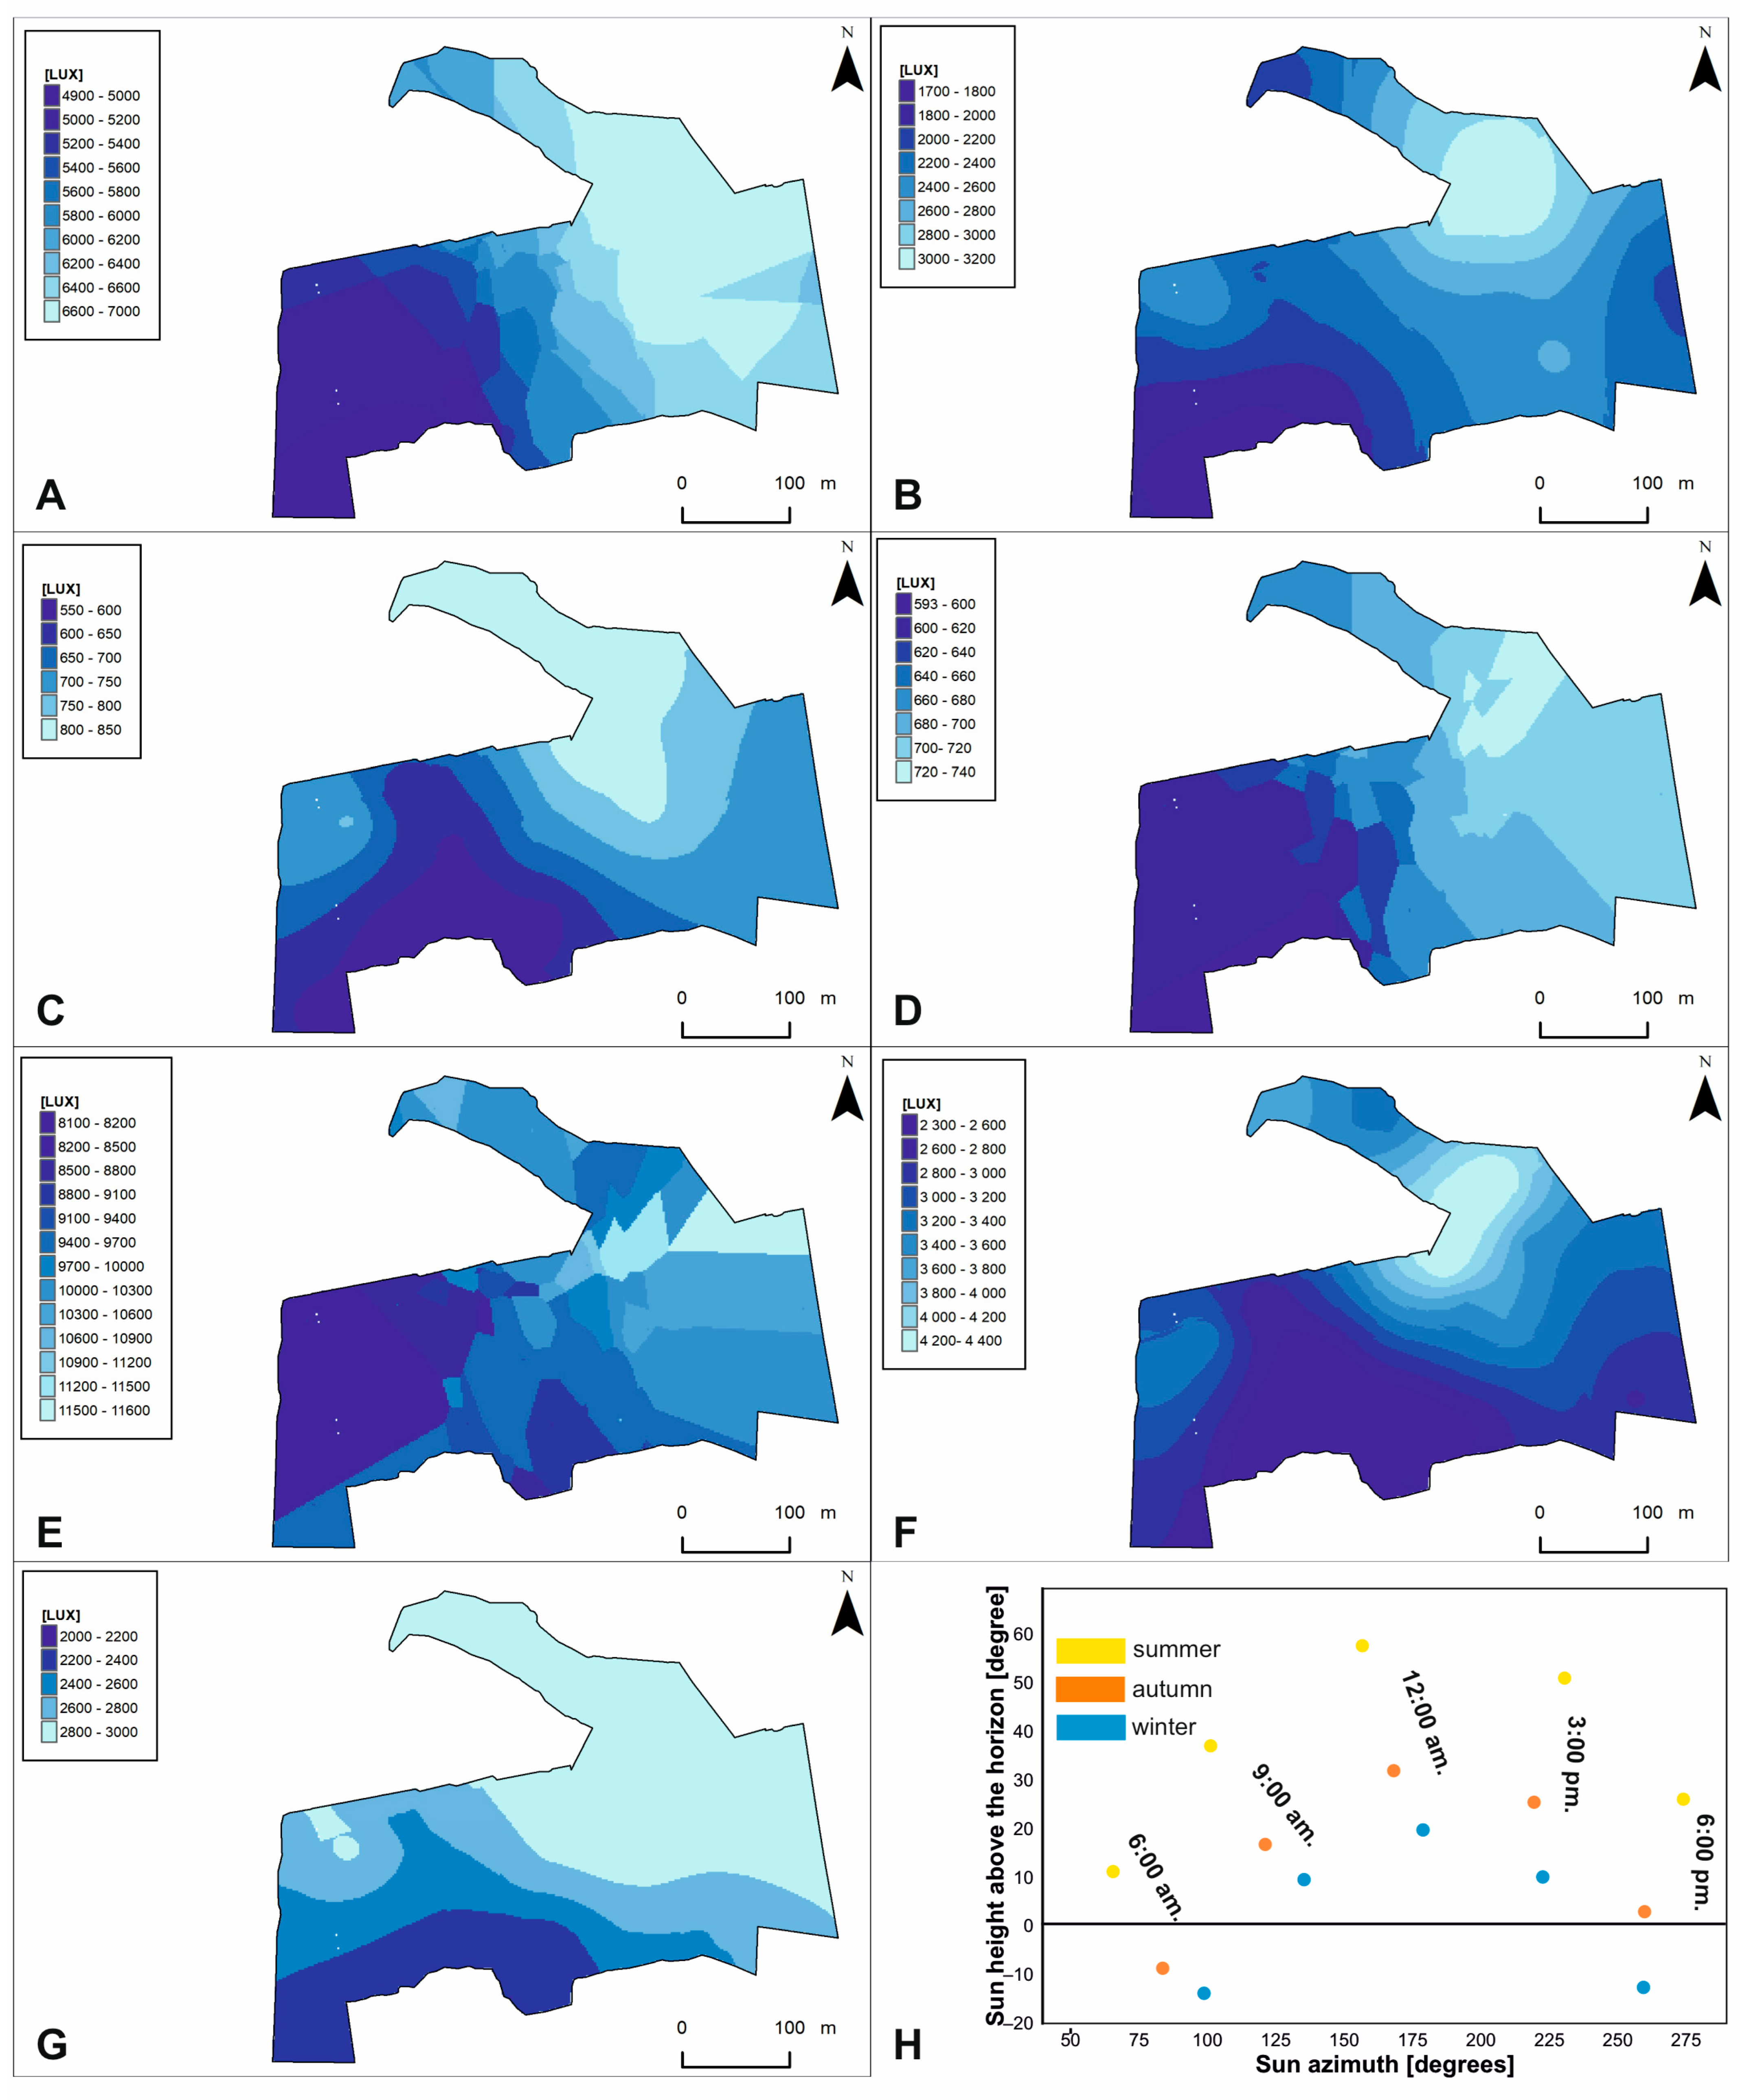
The results of the forward selection and Monte Carlo permutation tests showed that 14 of the 37 variables analyzed are statistically significant (Figure 5, Table 3). Variables were ordered according to their decreasing importance to the presence of lichen species in the study area, as shown by lambda statistics (Table 3). The CCA diagram showed the relationship between species of lichens and bryophytes, forest variables (TH, TC-2017, and CA) and microhabitat variables (ALIS, ALIA, ALIW, LIS6, LIA15, LIW12, LIW15, STS6, STA6, STS12, and STA12). Most of the microhabitat variables in the diagram were parallel to the second axis. This means that this axis reflects the gradient of variable microhabitat parameters on the percentage cover of lichens and bryophytes in the forest undergrowth layer. Additionally, the microhabitat variables were mostly grouped in one area, especially characterized by light intensity (Figure 5). Their ranges of individual values are shown on additional maps (Figure 6). These variables, by increasing their values, increase the percentage cover of lichen species of minor habitat formation in the forest undergrowth layer, such as the following: C. pleurota Hoffm., C. pyxidata (L.) Hoffm., C. squamosa Hoffm., and C. verticillata (Hoffm.) Ach. Two species of bryophytes, H. splendens (Hedw.) Schimp. and D. spurium Hedw., were also found in this influence area. The microhabitat variables above are also accompanied by the CA forest variable. The remaining microhabitat variables STS6, STA6, and STA12 (Figure 5) are located almost parallel to axis 2, but in the opposite direction, and range values were also presented on additional maps (Figure 7). In this case, the increase in their values influenced the habitat-forming lichens C. portentosa (Dufour) Coem., C. uncialis, C. subulata (L.) F.H. Wigg., C. furcata (Huds.) Baumg., and C. rangiferina (L.) Weber, and those that are insignificant to the community, C. rei Schaer., C. deformis (L.) Hoffm., C. zopfii Vain., and C. phyllophora Hoffm., as well as that of two bryophytes, D. scoparium and P. piliferum Hedw. The primary axis appears to be primarily determined by Tree Height (TH), with a significant influence from the outlier Cetraria aculeata exhibiting low TH values. This observation aligns with the ecological preferences of Cetraria aculeata (Schreb.) Fr., which thrives in open habitats. The increase in their value clearly affects the two main species of the bryophyte-rich undergrowth layer, P. schreberi and D. polysetum Sw., while their decrease affects the main species of the lichen-rich undergrowth layer, C. mitis, C. arbuscula (Wallr.) Flot., and C. gracilis (Figure 5).
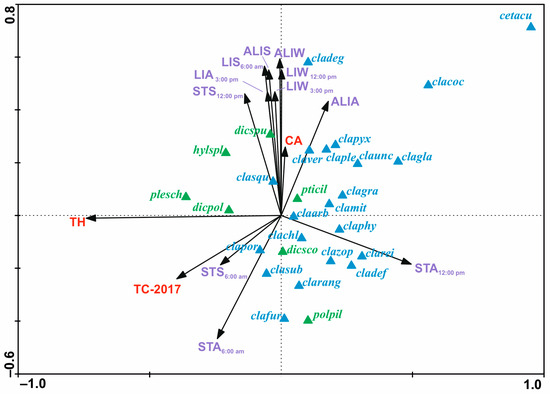
Figure 5.
Canonical correspondence analysis ordination diagram showing relationship between species of lichens—blue color—and bryophyte—green color; forest variables (TH, TC-2017, and CA)—red color; and microhabitat variables (ALIS, ALIA, ALIW, LIS6, LIA15, LIW12, LIW15, STS6, STA6, STS12, and STA12)—violet color. Variables’ abbreviations are explained in Table 3. The variance explained by the first canonical axis reaches 29% whereas by all canonical axes 12%. Abbreviations of lichens and bryophyte species names which were noted in all areas: cetacu—Cetraria aculeata (Schreb.) Fr.; claarb—Cladonia arbuscula (Wallr.) Flot.; clachl—C. chlorophaea (Flörke ex Sommerf.) Spreng.; clacoc—C. coccifera (L.) Willd.; cladef—C. deformis (L.) Hoffm.; clafur—C. furcata (Huds.) Baumg.; clagla—C. glauca Flörke; clagra—C. gracilis (L.) Willd.; clamit—C. mitis Sandst.; claphy—C. phyllophora Hoffm.; claple—C. pleurota Hoffm.; clapor—C. portentosa (Dufour) Coem.; clapyx—C. pyxidata (L.) Hoffm.; clarang—C. rangiferina (L.) Weber; clarei—C. rei Schaer.; clasqu—C. squamosa Hoffm.; clasub—C. subulata (L.) F.H. Wigg.; claunc—C. uncialis (L.) F.H. Wigg.; claver—C. verticillata (Hoffm.) Ach.; clazop—C. zopfii Vain.; dicpol—Dicranum polysetum Sw.; dicsco—D. scoparium Hedw.; dicspu—D. spurium Hedw.; hylspl—Hylocomium splendens (Hedw.) Schimp.; plesch—Pleurozium schreberi (Willd. ex Brid.) Mitt.; polpil—Politrichum piliferum Hedw.; pticil—Ptilidium ciliare (L.) Hampe.
Table 3.
Results of forward selection and Monte Carlo permutation tests derived from CCA (refer to Figure 5). Environmental variables are arranged according to their model order (Lambda A). Significant variables are indicated in bold (p < 0.05). Abbreviations for variables were utilized in multiple regression analyses (refer to Table 1), CCA (refer to Figure 5), light intensity models (refer to Figure 6), and substrate temperature models (refer to Figure 7).

Figure 6.
Light intensity models on the study area. Microhabitat variables: (A)—ALIS; (B)—ALIA; (C)—ALIW; (D)—LIS6; (E)—LIA15; (F)—LIW12; (G)—LIW15. Abbreviations are explained in Table 3. Relation between Sun azimuth and height above the horizon presented in part—(H).
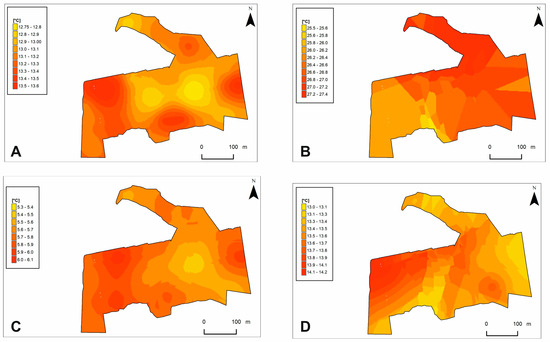
Figure 7.
Substrate temperature models on the study area. Microhabitat variables: (A)—STS6; (B)—STA6; (C)—STS12; (D)—STA12. Abbreviations are explained in Table 3.
4. Discussion
4.1. Influence of Microhabitat Parameters on Photosynthetic Activity and Cover of Lichens and Bryophytes
We have already indicated in previous studies that there is a clear relationship between the height of trees and the percentage cover of lichens and bryophytes in the undergrowth layer [7]. However, those studies also considered the parameters of the undergrowth properties and were carried out on a small sample of data from several sites. The distribution of the lichen–bryophyte flaps was made based on manual mapping of the area, and the data on the energy reaching the undergrowth were calculated based on the total values of solar energy reaching the Earth’s surface in that region, minus the amount of energy retained by the stand [7]. There was a great need for more detailed studies based on a wider range of data, to be completely sure of previous reports. Comparison of the model of the percentage cover of lichens in the undergrowth layer and the model of tree height in the study area (Figure 2) confirmed the previous results [7]; however, the current data allowed for more detailed insight. In a relatively low stand, up to 9 m high, the lichen undergrowth layer is very well preserved. In a tree stand of up to 13 m, the increasing share of P. schreberi and D. scoparium can be seen. Above 14 m in height, most of the undergrowth layer is completely bryophytes. These results provide a good justification as to why the lichen forest community was described as periodic and gradually disappearing as the stand ages [19,20,21,22].
Fałtynowicz [23] found in his study, which also conducted in the Tuchola Forest but in the 1980s, that there is a high correlation between the age of pine trees and the abundance of lichens and mosses, which is related to the amount of light reaching the undergrowth, as well as the amount of water available. In younger and older stands, lichens dominate [23]. The results of our research to date clearly indicate that it is not the age of the stand but the height of the trees that is of major importance in the processes of the decline of the lichen-rich undergrowth, since in the low site index V, stands have 50-year-old trees that reach a height of 9 m, and in such a habitat, the lichen undergrowth persists much longer than in the high site index I, where 50-year-old trees are 14 m high, and the lichen undergrowth begins to degenerate as they reach an age of about 20–25 years when trees exceed 9 m in height.
Numerous statistical analyses are presented in this work, including linear correlations with high correlation coefficients (Figure 3), and a more complex multiple regression analysis was performed (Table 1; Supplementary Table S1), which attempted to explain this phenomenon of the decrease in the percentage cover of lichens in the pine forest undergrowth with the increase in tree height based on the photosynthetic activity of chosen species of lichens and bryophytes. This is in line with the results of studies explaining this phenomenon of the limited availability of sunlight in increasingly mature forests [21,22] and what follows directly from the fact that lichens are photophilic [24,25,26] and bryophytes are photophobic organisms [27,28].
The results obtained indicate a large impact on undergrowth formation due to the relationship between forest variables: tree height and microhabitat variables; substrate temperature in autumn and winter (Table 1a); and tree height and light intensity in autumn (Table 1b). Already in previous studies [7], it was observed that substrate temperature is very variable throughout the year and that organic matter is a natural thermal insulation of the mineral layer against high temperatures in summer and low temperatures in winter [29,30]. The faster heating of the substrate in the summer months causes very rapid water loss. Furthermore, organic matter is a large reservoir of accumulated water [7].
4.2. Seasonal Variations in Photosynthetic Activity of Selected Lichen and Bryophyte Species
Current research confirms these earlier observations and shows even more clearly that the cold seasons of the year have a decisive influence on the formation of the lichen undergrowth layer. This is also confirmed by the obtained results of the seasonal variability of Fv/Fm (Figure 4). Fv/Fm was lowest in spring and summer, and it increased in, autumn, and winter when it had higher values (Figure 4A). Although lichens are pioneering organisms that occur in very extreme conditions, they prefer wetter and less sunny locations for optimal growth, as evidenced by the fact that they are called cryophilic species [31,32]. Both the results of these studies and the work of other authors confirm that the autumn and winter period is a favorable environment for lichen metabolism, due to the presence of lower temperatures, higher and constant humidity, and optimal light intensity [33]. On the other hand, other studies on bryophytes confirmed that CO2 gas exchange takes place even at a temperature of −5 °C [34], and they contrast with the assumption that the photosynthesis process stops when cellular fluids freeze in bryophytes [35]. It is not surprising that lichens and bryophytes photosynthesize under such unfavorable conditions as autumn and winter, because it is related to their temperature preferences [10]. The temperature between 5 °C and 15 °C is the normal range of maximum apparent photosynthesis in most northern bryophytes, but activity continues at temperatures below 0° C [36]. The tolerance of lichens to freezing temperatures might be attributed to the effects of sugar alcohols [37] and antifreezing- and ice nucleation-promoting proteins [38], which occurred in lichens [39]. The ability to perform photosynthesis at low and even temperatures below 0 °C means that it does not stop even in winter. However, it is quite surprising that in the cold period, photosynthesis is at such a high level. Scientists explain this phenomenon with high tolerance to desiccation, thanks to which species of bryophytes and lichens, unlike other plants, can maintain the efficient process of photosynthesis under winter stress.
There is another important aspect to the variability of seasonal photosynthetic activity. Lichens and bryophytes can rebuild photosynthetic systems. So far, it has been found to occur faster in bryophytes that grow in light-exposed habitats and experience frequent alterations between wet and dry conditions than in woodland species subject to less frequent changes [40].
Previous pilot studies on Fv/Fm [7] showed the highest photosynthetic activity of examined lichens and bryophytes in the autumn period. The research was not carried out in winter because then the authors thought that the studied species would be in a phase of complete dormancy, and the reason for the low values of Fv/Fm [7] during spring and summer are the weather conditions, e.g., higher temperature, light intensity, and sudden and drastic fluctuations in air humidity [33,41].
Microhabitat conditions have a significant influence on water relations in the lichen thicket because they are poikilohydric species [42]. On hot and rainless days (which characterize the summer period), the lichen thallus can lose up to 97% of its water and thus enter the state of anabiosis. On the one hand, it causes the suppression of photosynthesis in them; on the other hand, it becomes a defense mechanism against solar radiation [32]. Long-term stress periods in lichens activate the production of reactive oxygen species, which negatively affect the PS II system and thus lead to cell death [43]. This mechanism is confirmed by studies conducted in warm desert areas, which have shown that high temperature causes very low or negative net photosynthesis, and in combination with water deficit, it can lead to the disappearance of the biological soil crust made of bryophytes and lichens [44]. These authors emphasize the significant role of water availability on photosynthetic activity, while bryophyte dehydration and excessive hydration inhibit the photosynthesis process [45]. A similar situation occurs for lichens, which during the natural state of physiological drought show much lower activity than after their two-hour hydration in Eppendorf [9].
Tobias and Niinemets [46] showed that with a decrease in the amount of light delivered, the level of chlorophyll concentration in P. schreberi increased, which resulted in better absorption of solar radiation with its lower availability. In conditions of strong sunlight, our results for P. schreberi showed the lowest Fv/Fm values of all the species tested. The lichen species C. mitis and C. uncialis showed similar photosynthetic efficiency throughout the seasons, which is related to their great similarity; C. mitis has a more intense photosynthetic process, while C. uncialis photosynthesizes longer under conditions of water shortage, which ultimately balances their photosynthetic activity [47]. The large values of standard deviations in the tests are the result of different atmospheric conditions during the conducted measurements. On sunny and dry days, both lichens and bryophytes reached the critical values of Fv/Fm = 0.200, while in the morning, during the presence of dew or after intense rain, these values reached the limit of Fv/Fm = 0.8. This proves that the process of photosynthesis is very quickly regenerated, and that the photosynthesis process is resumed to a maximum extent (up to an hour), with little water availability [48].
The daily cycle of Fv/Fm in lichens and bryophytes is comparable within each species in the spring, summer, and autumn seasons, and the differences are noted only in winter (Figure 4B–E). All species studied show the highest photosynthetic activity in the morning and then significantly reduce it. The explanation for this is probably a short day and an early sunset. Furthermore, the studied species form bryophyte undergrowth in tall pine forests with spreading tree crowns, which limit light and cause shading [8]. However, these are merely assumptions that require further investigation.
The results of the relationship between the photosynthetic activity of selected species (C. mitis, C. uncialis, D. scoparium, and P. schreberi) and the substrate temperature and light intensity microhabitat parameters in the aspects of daytime and seasons (Supplementary Table S1) show even more clearly how the process of photosynthesis is highly dependent on environmental factors and is specific for each species.
The results presented confirm that the TH has a large impact on the values of the substrate temperature and the intensity of light reaching the undergrowth, which in turn determines the photosynthetic activity and photosynthesis efficiency. The presented regressions state that the joint influence of temperature and light intensity determines the Fv/Fm values, which is confirmed in studies on lichens and bryophytes and in studies on vascular plants [8,49]. The differences in Fv/Fm lichens in relation to the season and daytime can be explained by the fact that these organisms are extremely resistant to unfavorable microhabitat conditions, as they have wide optimal temperature and light requirements met [50]. The results confirm the tendency that in summer and autumn, photosynthetic activity decreases with a large increase in temperature and light intensity. This phenomenon is related to dehydration of the thallus and puts it into anabiosis [51]. However, studies are known to determine the optimal temperature for the photosynthesis process that occurs in lichens in the range of 15–25 °C [52]. In the autumn period, the average temperatures in the studied area fluctuate around 14 °C, which is below the optimal values.
However, there are studies with results that differ from ours. For example, samples of Cladonia foliacea, C. furcata, C. pyxidata, Diploschistes muscorum, and Thalloidima physaroides had higher Fv/Fm values in spring and autumn samples compared to summer and winter [41]. The authors explain their results by stating that the environmental conditions during spring and autumn were more favorable for photosynthetic efficiency than in the other two seasons [41]. The conditions of spring and autumn, i.e., high humidity and increasing intensity of incident light, contributed to the high photosynthetic activity of the lichens. During winter and summer, the investigated species had been exposed to stress [53]. In summer, it could be explained by heat and light stress, which had a photoinhibition effect on lichen thalli [54].
Contrary to lichens, bryophytes do not like high temperatures; therefore, significant relationships in our results were only confirmed in the morning and noon hours in summer and autumn for P. schreberi and in autumn at noon and in winter in the afternoon for D. scoparium. P. schreberi prefers light shading, lower temperatures, and optimal light availability [55]. It is a species characteristic of wetter and shaded areas; therefore, its retreat related to the thinning of the stand, which took place in 2017 [8], is visible in the experimental plot studied.
4.3. The Relationship between Species of Lichens and Bryophytes, Forest, and Microhabitat Variables
The CCA analysis showed a clear separation of the impact of forest variables which, according to previous studies, are mainly responsible for the occurrence of lichen species characteristic of lichen Scots pine forest communities, from microhabitat variables responsible for the occurrence of less important and habitat-forming lichens and bryophytes. Some of them, STS6, STA6, and STA12, are located between the axes, which may suggest their influence on both important and less significant species for this community. Thus, CCA indicates that substrate temperature has a significant influence on the formation of the forest undergrowth layer of lichen and bryophytes. Other studies analyzing the effects of microhabitat variables for terricolous lichens showed similar results [41]. The results clearly indicate that Fv/Fm is usually higher in less arid than in arid microhabitats, which results directly from solar exposure, along with the different shading created by vascular plants, including shrubs and trees [56]. The higher soil water content provided a higher amount of humidity for rehydration/activation of terricolous lichens. Their results [41] indicate the important process of nonphotochemical quenching (NPQ), which is a mechanism employed by plants and algae to protect themselves from the adverse effects of high light intensity [57] and is usually more intensive in shaded than in exposed microhabitats of the lichen species. These observations are explained by the fact that the shaded microhabitat is usually wetter, causing more frequent irrigation of the lichen thallus, which makes them transparent and more exposed to greater amounts of solar energy supplied [58,59]. Dry lichen thalli reflect most of the sun’s energy [60].
5. Conclusions
The study delves into the intricate dynamics between tree height, microhabitat factors, and the prevalence of lichens and bryophytes in the lichen Scots pine forest ecosystems. Contrary to previous notions linking stand age to undergrowth decline, our findings emphasize the pivotal role of tree height in shaping the forest undergrowth composition. Lichens exhibit photophilic tendencies, thriving under optimal humidity conditions during autumn and winter, while bryophytes’ responses to environmental stress vary. Substrate temperature and light intensity emerge as key determinants of photosynthetic activity, influencing undergrowth formation. The research underscores the need for comprehensive studies to unravel the complexities of forest microhabitats and their impact on undergrowth dynamics, offering valuable insights into the resilience and adaptability of these organisms in changing environmental conditions.
Supplementary Materials
The following supporting information can be downloaded at: https://www.mdpi.com/article/10.3390/f15040675/s1, Supplementary Table S1: Result of stepwise multiple regression analysis for the effect of microhabitat parameters on the measurement of the photosynthetic activity (the maximal quantum yields of photosystem II—FV/FM) of the study cryptogams species in aspect of daytime and seasons. Variables with significant effect (p < 0.05) are provided in bold.
Author Contributions
Conceptualization, M.H.W. and P.F.; methodology, M.H.W. and P.F.; formal analysis, M.H.W., P.D. and P.F.; writing—original draft, M.H.W., P.D., K.W., P.W.-P. and P.F.; writing—review and editing, M.H.W., project administration, M.H.W.; investigation, M.H.W., P.D., K.W. and P.F. All authors have read and agreed to the published version of the manuscript.
Funding
The fieldwork and laboratory research leading to these results has received funding from the Forest Fund of the State Forests in Poland (no. EZ.0290.1.12.2021 and no. MZ.0290.1.12.2023).
Data Availability Statement
Data sharing is not applicable to this article.
Acknowledgments
We humbly dedicate this publication to the esteemed memory of Ludwik Lipnicki, whose guidance led us into the realm of Bory Tucholskie National Park. The authors extend heartfelt gratitude to Janusz Kochanowski of the Bory Tucholskie’ National Park, for graciously permitting research within its boundaries. Special appreciation is also extended to Agnieszka Turowska of the ‘Bory Tucholskie’ National Park for invaluable assistance throughout project implementation and fieldwork endeavors. Our sincere thanks are owed to Piotr Wężyk for his adept execution of Li-DAR—Airborne Laser Scanning of forest stands in 2017 and 2018. Additionally, we express gratitude to the anonymous reviewers whose insightful suggestions and remarks greatly enriched the manuscript.
Conflicts of Interest
The authors declare no conflicts of interest.
References
- Naumburg, E.; Ellsworth, D.S. Short-term light and leaf photosynthetic dynamics affect estimates of daily understory photosynthesis in four tree species. Tree Physiol. 2002, 22, 393–401. [Google Scholar] [CrossRef] [PubMed]
- Way, D.A.; Pearcy, R.W. Sunflecks in trees and forests: From photosynthetic physiology to global change biology. Tree Physio. 2022, 32, 1066–1081. [Google Scholar] [CrossRef] [PubMed]
- Kaiser, E.; Morales, A.; Harbinson, J.; Kromdijk, J.; Heuvelink, E.; Marcelis, L.F. Dynamic photosynthesis in different environmental conditions. J. Exp. Bot. 2015, 66, 2415–2426. [Google Scholar] [CrossRef] [PubMed]
- Pearcy, R.W.; Way, D.A. Two decades of sunfleck research: Looking back to move forward. Tree Physiol. 2012, 32, 1059–1061. [Google Scholar] [CrossRef] [PubMed]
- Węgrzyn, M.; Wietrzyk, P. Phytosociology of snowbed and exposed ridge vegetation of Svalbard. Polar Bio. 2015, 38, 1905–1917. [Google Scholar] [CrossRef]
- Węgrzyn, M. New records of lichens and lichenicolous fungi from the Polish Tatra Mountains. Pol. Bot. J. 2008, 53, 163–168. [Google Scholar]
- Węgrzyn, M.H.; Fałowska, P.; Kołodziejczyk, J.; Alzayany, K.; Wężyk, P.; Zięba-Kulawik, K.; Hawryło, P.; Turowska, A.; Grzesiak, B.; Lipnicki, L.; et al. Tree height as the main factor causing disappearance of the terricolous lichens in the lichen Scots pine forests. Sci. Total Environ. 2021, 771, 144834. [Google Scholar] [CrossRef]
- Węgrzyn, M.H.; Kołodziejczyk, J.; Fałowska, P.; Wężyk, P.; Zięba-Kulawik, K.; Szostak, M.; Turowska, A.; Grzesiak, B.; Wietrzyk-Pełka, P. Influence of the environmental factors on the species composition of lichen Scots pine forests as a guide to maintain the community (Bory Tucholskie National Park, Poland). Glob. Ecol. Conserv. 2020, 22C, e01017. [Google Scholar] [CrossRef]
- Węgrzyn, M.H.; Fałowska, P.; Alzayany, K.; Waszkiewicz, K.; Dziurowicz, P.; Wietrzyk-Pełka, P. Seasonal Changes in the Photosynthetic Activity of Terrestrial Lichens and Mosses in the Lichen Scots Pine Forest Habitat. Diversity 2021, 13, 642. [Google Scholar] [CrossRef]
- Barták, M. Lichen photosynthesis. Scaling from the cellular to the organism level. In The Structural Basis of Biological Energy Generation; Hohmann-Marriott, M.F., Ed.; Advances in Photosynthesis and Respiration (AIPH, volume 39); Springer Dordrecht: Berlin/Heidelberg, Germany, 2014; pp. 379–400. [Google Scholar] [CrossRef]
- Chowaniec, K.; Latkowska, E.; Rola, K. Does long-term salt stress of environmentally relevant concentrations affect the physiology of inland lichens? The importance of rainfall to restore thallus vitality. Environ. Exp. Bot. 2022, 200, 104937. [Google Scholar] [CrossRef]
- Lange, O.L.; Büdel, B.; Heber, U.; Meyer, A.; Zellner, H.; Green, T.G.A. Temperate rainforest lichens in New Zealand: High thallus water content can severely limit photosynthetic CO2 exchange. Oecologia 1993, 95, 303–313. [Google Scholar] [CrossRef] [PubMed]
- Veldhuis, M.C.T.; Ananyev, G.; Dismukes, G.C. Symbiosis extended: Exchange of photosynthetic O2 and fungal-respired CO2 mutually power metabolism of lichen symbionts. Photosynth. Res. 2020, 143, 287–299. [Google Scholar] [CrossRef]
- Pokorny, L.; Ho, B.C.; Frahm, J.P.; Quandt, D.; Shaw, A.J. Phylogenetic analyses of morphological evolution in the gametophyte and sporophyte generations of the bryophyte order Hookeriales (Bryopsida). Mol. Phylogenet. Evol. 2012, 63, 351–364. [Google Scholar] [CrossRef] [PubMed]
- Wężyk, P.; Hawryło, P.; Zięba-Kulawik, K.; Szostak, M.; Kuzera, J.; Turowska, A.; Bura, M.; Wietrzyk, P.; Kołodziejczyk, J.; Fałowska, P.; et al. Using LiDAR point clouds in active protection of forest lichen communities in “Bory Tucholskie” National Park. Arch. Fotogram. Kartogra. Rem. Sens. 2018, 30, 27–41. [Google Scholar] [CrossRef]
- Kalaji, H.M.; Rastogi, A.; Živčák, M.; Brestic, M.; Daszkowska-Golec, A.; Sitko, K.; Alsharafa, K.Y.; Lotfi, R.; Stypiński, P.; Samborska, I.A. Prompt chlorophyll fluorescence as a tool for crop phenotyping: An example of barley landraces exposed to various abiotic stress factors. Photosynthetica 2018, 56, 953–961. [Google Scholar] [CrossRef]
- Schansker, G.; Tóth, S.Z.; Strasser, R.J. Dark-recovery of the Chl a fluorescence transient (OJIP) after light adaptation: The qT- component of non-photochemical quenching is related to an activated photosystem I acceptor side. Biochim. Biophys. Acta 2006, 1757, 787–797. [Google Scholar] [CrossRef]
- Coe, R.A.; Lin, H.C. Light-Response Curves in Land Plants. Photosynthesis 2018, 1770, 83–94. [Google Scholar] [CrossRef]
- Foster, D.R. Vegetation development following fire in Picea mariana (black spruce)—Pleurozium forests of south-eastern Labrador, Canada. J. Ecol. 1985, 73, 517–534. [Google Scholar] [CrossRef]
- Ahti, T.; Oksanen, J. Epigeic lichen communities of taiga and tundra regions. Vegetatio 1990, 86, 39.e70. [Google Scholar] [CrossRef]
- Reinecke, J.; Klemm, G.; Heinken, T. Veränderung der Vegetation nährstoffarmer Kiefernwälder im nördlichen Spreewald-Randge-biet zwischen 1965 und 2010. Verh. Bot. Ver. Berl. Brandenbg. 2011, 144, 63–97. [Google Scholar]
- Boudreault, C.; Drapeau, P.; Bouchard, M.; St-Laurent, M.H.; Imbeau, L.; Bergeron, Y. Contrasting responses of epiphytic and terricolous lichens to variations in forest char- acteristics in northern boreal ecosystems. Canad. J. For. Res. 2015, 45, 595–606. [Google Scholar] [CrossRef]
- Fałtynowicz, W. The dynamics and role of lichens in a managed Cladonia-Scotch pine forest (Cladonio-Pinetum). Monogr. Bot. 1986, 69, 1. [Google Scholar] [CrossRef]
- Friedmann, E.I.; Gabun, M. Desert Algae, Lichens, and Fungi. In Desert Biology; Brown, G.W., Ed.; College of Fisheries Volume 2.; University of Washington Seatle: Seatle, WA, USA, 1967; pp. 165–212. [Google Scholar]
- Bültmann, H.; Daniëls, F.J. Lichens and vegetationea case study of Thamnolietum vermicularis. Bibl. Lichenol. 2009, 100, 31–47. [Google Scholar]
- Boudreault, C.; Zouaoui, S.; Drapeau, P.; Bergeron, Y.; Stevenson, S. Canopy openings created by partial cutting increase growth rates and maintain the cover of three Cladonia species in the Canadian boreal forest. For. Ecol. Manag. 2014, 304, 473–481. [Google Scholar] [CrossRef]
- Valanne, N. Photosynthesis and photosynthetic products in bryophyte. In The Experimental Biology of Bryophytes; Dyer, A.F., Duckett, J.G., Cronshaw, J., Eds.; Academic Press: San Diego, CA, USA, 1984; pp. 257–273. [Google Scholar]
- Marschall, M.; Proctor, M.C.F. Are bryophytes shade plants? Photosynthetic light responses and proportions of chlorophyll a, chlorophyll b and total carotenoids. Ann. Bot. 2004, 94, 593–603. [Google Scholar] [CrossRef] [PubMed]
- Kodešová, R.; Vlasakova, M.; Fer, M.; Tepla, D.; Jakšík, O.; Neuberger, P.; Adamovský, R. Thermal properties of representative soils of the Czech Republic. Soil Water Res. 2013, 8, 141–150. [Google Scholar] [CrossRef]
- Onwuka, B.; Mang, B. Effects of soil temperature on some soil properties and plant growth. Adv. Plants Agric. Res. 2018, 8, 34–37. [Google Scholar] [CrossRef]
- Armstrong, R.A. The lichen symbiosis: Lichen “extremophiles” and survival on Mars. J. Astrobiol. Space Sci. Rev. 2019, 1, 378–397. [Google Scholar]
- Kappen, L.; Schroeter, B.; Scheidegger, C.; Sommerkorn, M.; Hestmark, G. Cold resistance and metabolic activity of lichens below 0 °C. Adv. Space Res. 1996, 18, 119–128. [Google Scholar] [CrossRef]
- Veres, K.; Csintalan, Z.; Laufer, Z.; Engel, R.; Szabó, K.; Farkas, E. Photoprotection and high-light acclimation in semi-arid grassland lichens—A cooperation between algal and fungal partners. Symbiosis 2022, 86, 33–48. [Google Scholar] [CrossRef]
- Pannewitz, S.; Green, T.A.; Maysek, K.; Schlensog, M.; Seppelt, R.; Sancho, L.G.; Turk, R.; Schroeter, B. Photosynthetic responses of three common bryophyte from continental Antarctica. Antarct. Sci. 2005, 17, 341–352. [Google Scholar] [CrossRef]
- Kappen, L.; Schroeter, B. Plants and Lichens in the Antarctic, Their Way of Life and Their Relevance to Soil Formation. In Geoecology of Antarctic Ice-Free Coastal Landscapes. Ecological Studies; Beyer, L., Bölter, M., Eds.; Springer: Berlin/Heidelberg, Germany, 2002; Volume 154. [Google Scholar] [CrossRef]
- Kallio, P.; Valanne, N. On the Effect of Continuous Light on Photosynthesis in Mosses. In Fennoscandian Tundra Ecosystems. Ecological Studies; Wielgolaski, F.E., Ed.; Springer: Berlin/Heidelberg, Germany, 1975; Volume 16. [Google Scholar] [CrossRef]
- Fontaniella, B.; Vicente, C.; Legaz, M.E. The cryoprotective role of polyols in lichens: Effects on the redistribution of RNase in Evernia prunastri thallus during freezing. Plant Physiol. 2000, 38, 621–627. [Google Scholar] [CrossRef]
- Kieft, T.L.; Ruscetti, T. Molecular sizes of lichen ice nucleation sites determined by gamma radiation inactivation analysis. Cryobiology 1992, 29, 407–413. [Google Scholar] [CrossRef]
- Doucet, C.J.; Byass, L.; Elias, L.; Worrall, D.; Smallwood, M.; Bowles, D.J. Distribution and characterization of recrystallization inhibitor activity in plant and lichen species from the UK and maritime Antarctic. Cryobiology 2000, 40, 218–227. [Google Scholar] [CrossRef] [PubMed]
- Proctor, M.C.; Smirnoff, N. Rapid recovery of photosystems on rewetting desiccation-tolerant bryophyte: Chlorophyll fluorescence and inhibitor experiments. J. Exp. Bot. 2000, 51, 1695–1704. [Google Scholar] [CrossRef] [PubMed]
- Veres, K.; Farkas, E.; Csintalan, Z. The bright and shaded side of duneland life: The photosynthetic response of lichens to seasonal changes is species-specific. Mycol. Prog. 2020, 19, 629–641. [Google Scholar] [CrossRef]
- Green, T.G.A.; Lange, O.L. Photosynthesis in Poikilohydric Plants: A Comparison of Lichens and Bryophytes. In Ecophysiology of Photosynthesis; Schulze, E.D., Caldwell, M.M., Eds.; Springer: Berlin/Heidelberg, Germany, 1995; 1995′ Springer Study Edition; Volume 100. [Google Scholar] [CrossRef]
- Hájek, J.; Barták, M.; Dubová, J. Inhibition of photosynthetic processes in foliose lichens induced by temperature and osmotic stress. Biol. Plant 2006, 50, 624–634. [Google Scholar] [CrossRef]
- Grote, E.E.; Belnap, J.; Housman, D.C.; Sparks, J.P. Carbon exchange in biological soil crust communities under differential temperatures and soil water contents: Implications for global change. Glob. Chang. Biol. 2010, 16, 2763–2774. [Google Scholar] [CrossRef]
- Perera-Castro, A.V.; Waterman, M.J.; Turnbull, J.D.; Ashcroft, M.B.; McKinley, E.; Watling, J.R.; Bramley-Alves, J.; Casanova-Katny, A.; Zunig, G.; Flexas, J.; et al. It is hot in the sun: Antarctic bryophyte have high temperature optima for photosynthesis despite cold climate. Front. Plant Sci. 2020, 11, 1178. [Google Scholar] [CrossRef]
- Tobias, M.; Niinemets, Ü. Acclimation of photosynthetic characteristics of the bryophyte Pleurozium schreberi to among-habitat and within-canopy light gradients. Plant Biol. 2010, 12, 743–754. [Google Scholar] [CrossRef]
- Lechowicz, M.J.; Adams, M.S. Ecology of Cladonia lichens. II. Comparative physiological ecology of C. mitis, C. rangiferina, and C. uncialis. Can. J. Bot. 1974, 52, 411–422. [Google Scholar] [CrossRef]
- Tuba, Z.; Csintalan, Z.; Proctor, M.C. Photosynthetic responses of a bryophyte, Tortula ruralis, ssp. ruralis, and the lichens Cladonia convoluta and C. furcata to water deficit and short periods of desiccation, and their ecophysiological significance: A baseline study at present-day CO2 concentration. New Phytol. 1996, 133, 353–361. [Google Scholar] [CrossRef] [PubMed]
- Harley, P.; Guenther, A.; Zimmerman, P. 1996. Effects of light, temperature and canopy position on net photosynthesis and isoprene emission from sweetgum (Liquidambar styraciflua) leaves. Tree Physiol. 2006, 16, 25–32. [Google Scholar] [CrossRef] [PubMed]
- Kershaw, K.A. Studies on lichen-dominated systems. XX. An examination of some aspects of the northern boreal lichen woodlands in Canada. Can. J. Bot. 1977, 55, 393–410. [Google Scholar] [CrossRef]
- Sadowsky, A.; Ott, S. Symbiosis as a successful strategy in continental Antarctica: Performance and protection of Trebouxia photosystem II in relation to lichen pigmentation. Polar Biol. 2016, 39, 139–151. [Google Scholar] [CrossRef]
- Tegler, B.; Kershaw, K.A. Studies on lichen-dominated systems. XXIII. The control of seasonal rates of net photosynthesis by moisture, light, and temperature in Cladonia rangiferina. Can. J. Bot. 1980, 58, 1851–1858. [Google Scholar] [CrossRef]
- Maxwell, K.; Johnson, G.N. Chlorophyll fluorescence—A practical guide. J. Exp. Bot. 2000, 51, 659–668. [Google Scholar] [CrossRef] [PubMed]
- Gauslaa, Y.; Solhaug, K.A. High-light damage in air-dry thalli of the old forest lichen Lobaria pulmonaria–interactions of irradiance, exposure duration and high temperature. J. Exp. Bot. 1999, 50, 697–705. [Google Scholar] [CrossRef]
- Popov, S.Y. On the Distribution of Pleurozium schreberi (Bryophyta, Hylocomiaceae) in the East European Plain and Eastern Fennoscandia. Mosc. Univ. Biol. Sci. Bull. 2018, 73, 178–184. [Google Scholar] [CrossRef]
- Kalapos, T.; Mázsa, K. Juniper shade enables terricolous lichens and bryophyte to maintain high photochemical efficiency in a semiarid temperate sand grassland. Photosynthetica 2001, 39, 263–268. [Google Scholar] [CrossRef]
- Horton, P.; Ruban, A. Regulation of Photosynthesis under Stress: Molecular design of the photosystem II light-harvesting antenna: Photosynthesis and photoprotection. J. Exp. Bot. 2005, 56, 365–373. [Google Scholar] [CrossRef] [PubMed]
- Heber, U.; Bukhov, N.G.; Shuvalov, V.A.; Kobayashi, Y.; Lange, O.L. Protection of the photosynthetic apparatus against damage by excessive illumination in homoiohydric leaves and poikilohydric bryophyte and lichens. J. Exp. Bot. 2001, 52, 1999–2006. [Google Scholar] [CrossRef] [PubMed]
- Heber, U.; Lange, O.L.; Shuvalov, V.A. Conservation and dissipation of light energy as complementary processes: Homoiohydric and poikilohydric autotrophs. J. Exp. Bot. 2006, 57, 1211–1223. [Google Scholar] [CrossRef]
- Ertl, L. Über die Lichtverhältnisse in Laubflechten. Planta 1951, 39, 245–270. [Google Scholar] [CrossRef]


Disclaimer/Publisher’s Note: The statements, opinions and data contained in all publications are solely those of the individual author(s) and contributor(s) and not of MDPI and/or the editor(s). MDPI and/or the editor(s) disclaim responsibility for any injury to people or property resulting from any ideas, methods, instructions or products referred to in the content. |
© 2024 by the authors. Licensee MDPI, Basel, Switzerland. This article is an open access article distributed under the terms and conditions of the Creative Commons Attribution (CC BY) license (https://creativecommons.org/licenses/by/4.0/).