Article

Delineating Non-Susceptible Landslide Areas in China Based on Topographic Index and Quantile Non-Linear Model

1
Institute of Geology, China Earthquake Administration, Beijing 100029, China
2
Key Laboratory of Seismic and Volcanic Hazards, Institute of Geology, China Earthquake Administration, Beijing 100029, China
3
National Institute of Natural Hazards, Ministry of Emergency Management of China, Beijing 100085, China
4
Key Laboratory of Compound and Chained Natural Hazards Dynamics, Ministry of Emergency Management of China, Beijing 100085, China
*
Author to whom correspondence should be addressed.
Forests 2024, 15(4), 678; https://doi.org/10.3390/f15040678
Submission received: 29 February 2024 / Revised: 1 April 2024 / Accepted: 4 April 2024 / Published: 9 April 2024
(This article belongs to the Section Natural Hazards and Risk Management)

Abstract

:
Efficient analysis of non-susceptibility to landslides targets regions with minimal or zero landslide probability, thereby obviating the need to estimate the likelihood for low-susceptibility zones. This study assesses the effectiveness of the quantile non-linear (QNL) model in delineating the non-susceptibility of landslides in China through a topographic index. The topographic index encompassed slope angle and topographic relief, which are calculated using a 3 × 3 and 15 × 15 square cell moving window, respectively. Additionally, a global landslide susceptibility model established using a comprehensive global landslide database and fuzzy algorithm was employed for comparative analysis, providing a holistic evaluation of the QNL model’s accuracy. The results show that while the overall distribution of the two QNL models for non-susceptible landslide areas was roughly consistent, notable discrepancies were observed in localized regions, especially in the Southwest and Qinghai-Tibet geological environment areas where landslides are prone to occur. The applicability of the QNL model is significantly limited in these areas. In addition, the predicted results of the QNL_CHN model are closer to those based on the global landslide susceptibility model of the fuzzy algorithm. This study provides valuable insights to enhance the QNL model’s applicability, thereby strengthening forest ecosystem management and mitigating ecological disaster risks.

1. Introduction

Landslides are globally significant and sudden geological disasters characterized by high frequency, widespread occurrence, and substantial destructiveness, with their most prominent feature being their potential to cause disaster. China stands out as one of the countries most severely affected by casualties resulting from landslide disasters [1,2,3,4,5]. According to the China Statistical Yearbook data, an average of 22,000 landslides occurred annually between 2000 and 2017, resulting in an average of 649 deaths per year. Specifically, from 2010 to 2017, landslides accounted for 27% of the total deaths caused by natural disasters [6]. Moreover, landslides pose significant threats to forest ecosystems worldwide, leading to widespread destruction and alteration of natural landscapes. The damage inflicted by landslides on forests can have enduring effects on ecosystem health and resilience. Loss of vegetation cover diminishes the ability of forests to intercept rainfall, regulate water flow, and prevent soil erosion, thereby heightening the risk of subsequent landslides and ecological degradation. Consequently, accurate estimation of landslide locations and spatial distribution is essential for reducing the risk of landslides and averting potential hazards. Developing susceptibility maps for landslides has proven to be an effective strategy for identifying high-risk areas and mitigating the risks associated with landslide disasters.
Landslide susceptibility assessment refers to the spatial likelihood or probability of landslide occurrence in a given study area under specific geological and environmental conditions [7,8]. Therefore, landslide susceptibility assessment involves numerous possible influencing factors and employs qualitative or quantitative methods to evaluate the spatial probability of landslides at the level of individual landslides or different spatial scales [9,10,11]. For example, Huang et al. [12] employed a machine learning model integrating various factors, including topography, hydrology, lithology, geological structure, and land cover, to develop a landslide susceptibility assessment model for the Ruijin region in Jiangxi, China. This model categorizes landslide susceptibility into five levels representing relative probabilities of landslide occurrence within the study area. Dai et al. [13] incorporated factors such as topography, lithology, land cover, and soil moisture in their landslide susceptibility modeling for Hong Kong. The resulting susceptibility distribution was classified into four categories representing varying levels of susceptibility, namely low, moderately low, moderately high, and high susceptibility to landslides. While the relevant studies on landslide susceptibility models have reached a level of maturity, resulting in relatively high accuracy, they nonetheless encounter notable challenges. The primary issue is the applicability of the models to specific regions since they are mostly trained based on regional landslide data, limiting their suitability due to regional characteristics [14]. Therefore, recent studies have increasingly focused on developing landslide susceptibility models for larger regional scales [15,16,17], continental scales [18], and even global scales [19,20,21]. These studies collect landslide data and topographical, geomorphic, and geological data on a large regional scale to train models, ultimately obtaining landslide susceptibility assessment models theoretically applicable to extensive regions.
The current landslide susceptibility assessment models can be categorized into qualitative and quantitative models [22]. Qualitative models assess landslide susceptibility based on factors defined by experts, while quantitative models rely on statistical and machine learning techniques such as logistic regression [23,24], random forests [25], artificial neural networks [22], convolutional neural networks [26], support vector machines [27], and decision trees [28]. In recent years, with the advancement of machine learning technologies, these algorithms have been widely applied in landslide susceptibility assessment. Leveraging their robust data-driven capabilities, these algorithms learn the relationships between landslide occurrences and related predictors to construct predictive models [29,30,31], ultimately providing landslide susceptibility assessment results for the region. Due to the generalized lack of accurate and complete landslide information [32], these synoptic-scale attempts have either omitted information on the location and extent of landslides or used unsystematic point landslide information to determine landslide susceptibility.
In contrast to traditional landslide susceptibility assessment methods, non-susceptibility analysis focuses on identifying areas where the probability of landslide occurrence is either zero or minimal. This approach offers the benefit of avoiding the need to estimate varying degrees of likelihood for areas deemed to have negligible susceptibility. Some studies emphasize the dominant role of terrain slope and relief in the spatial distribution characteristics of non-landslides. Godt et al. [33] initially proposed a threshold-based method to define areas where the probability of landslide occurrence is negligible. Non-susceptibility analyses are grounded on the assumption that flat, low-relief areas are less susceptible to landslides, a premise supported by the dominant role of topography in landslide susceptibility assessment. In a comparative analysis, Marchesini et al. [34] evaluated the fitting performance using different landslide inventories and linear regression, quantile regression, and QNL for terrain threshold-based models, with the QNL exhibiting the best simulation results. Differing from Godt et al. [33]’s approach of selecting only five representative points, Marchesini et al. [34] extracted terrain conditions corresponding to all landslide point data, thereby enhancing the model’s applicability. Building upon these methods, Jia et al. [35] extended the model using the Global Landslide Catalog (GLC) dataset, presenting a comprehensive global landslide non-susceptibility map.
At present, non-susceptibility analysis predominantly focuses on regional scales, with only a limited number of researchers addressing global landslide non-susceptibility [36,37]. Reichenbach et al. [
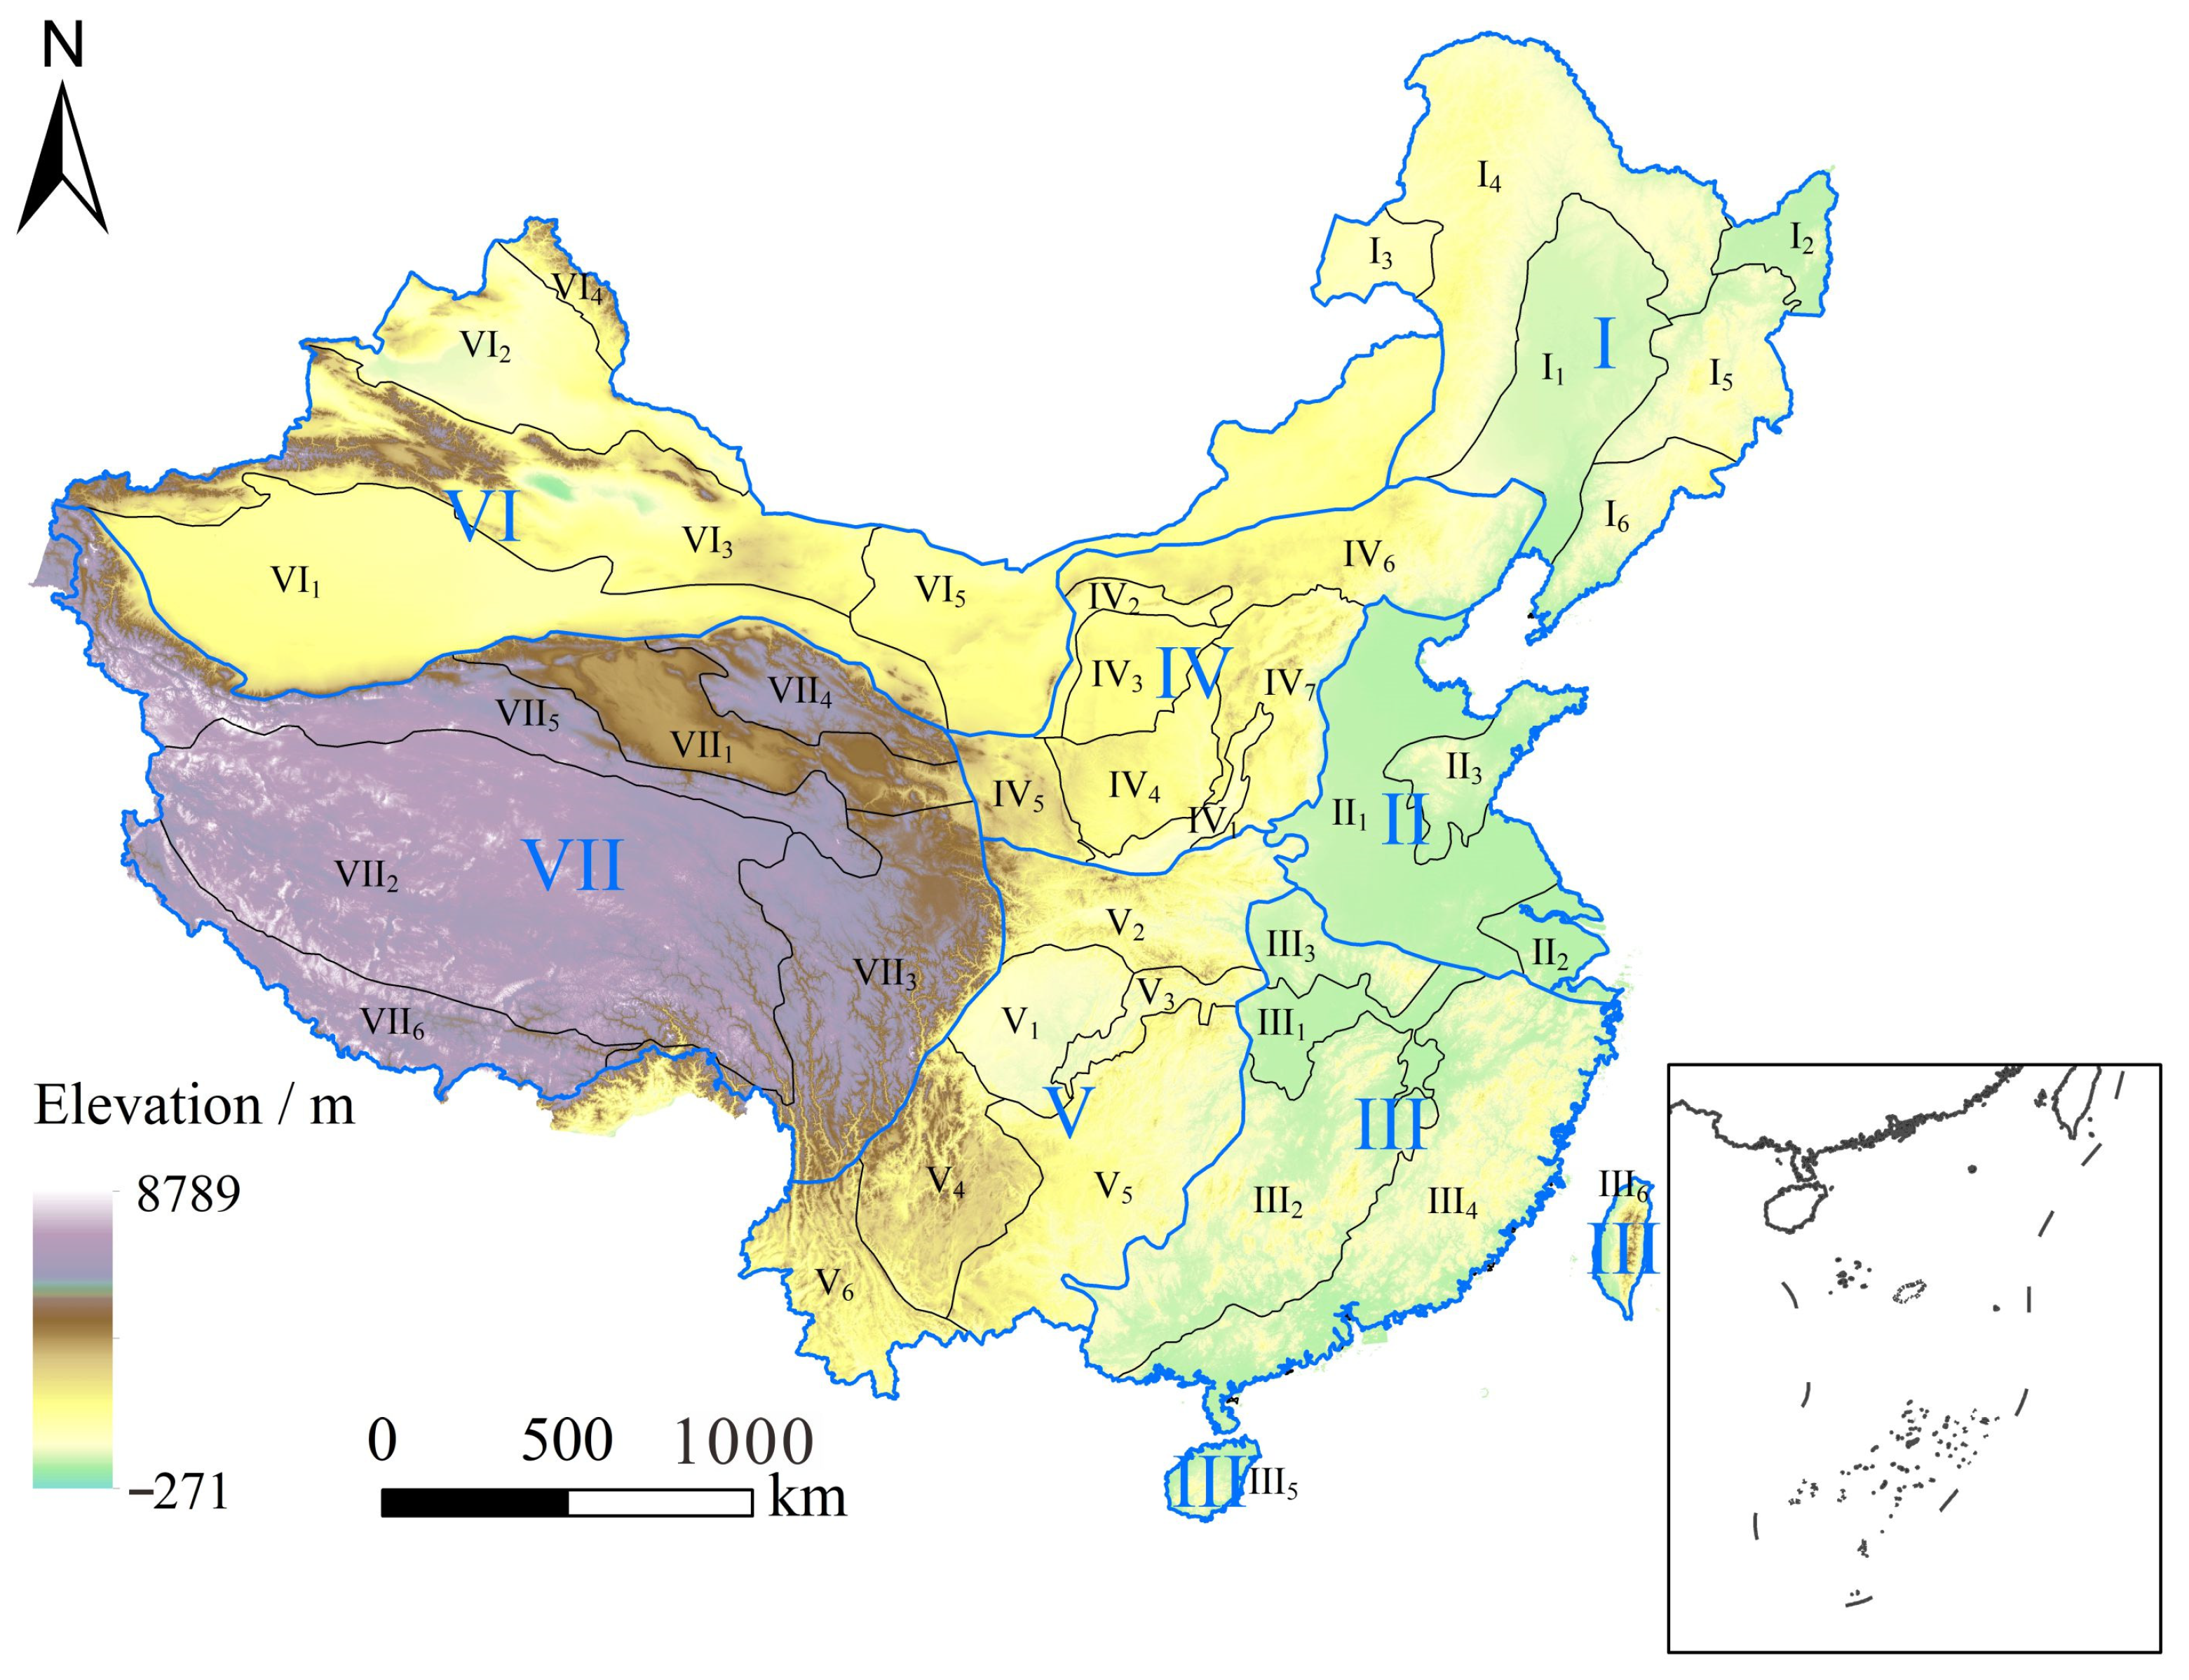
31] advocated for the extension and rigorous testing of “non-susceptible” terrain zoning across diverse geographical regions to ensure its reliability. The geological and geomorphological features of China exhibit remarkable diversity and complexity, contributing to the intricate spatial distribution of landslide risks across the country. From the towering peaks of the Himalayas to the expansive plateaus of the Tibetan Plateau and the rugged terrain of the karst landscapes in the south, China’s geological terrain is characterized by a myriad of formations and processes. Moreover, the densely populated nature of many regions further amplifies the potential consequences of landslides. It is imperative to recognize the unique challenges and geological complexities inherent in China’s vast and diverse landscapes, necessitating robust risk assessment methodologies tailored to China’s unique geological and environmental contexts.
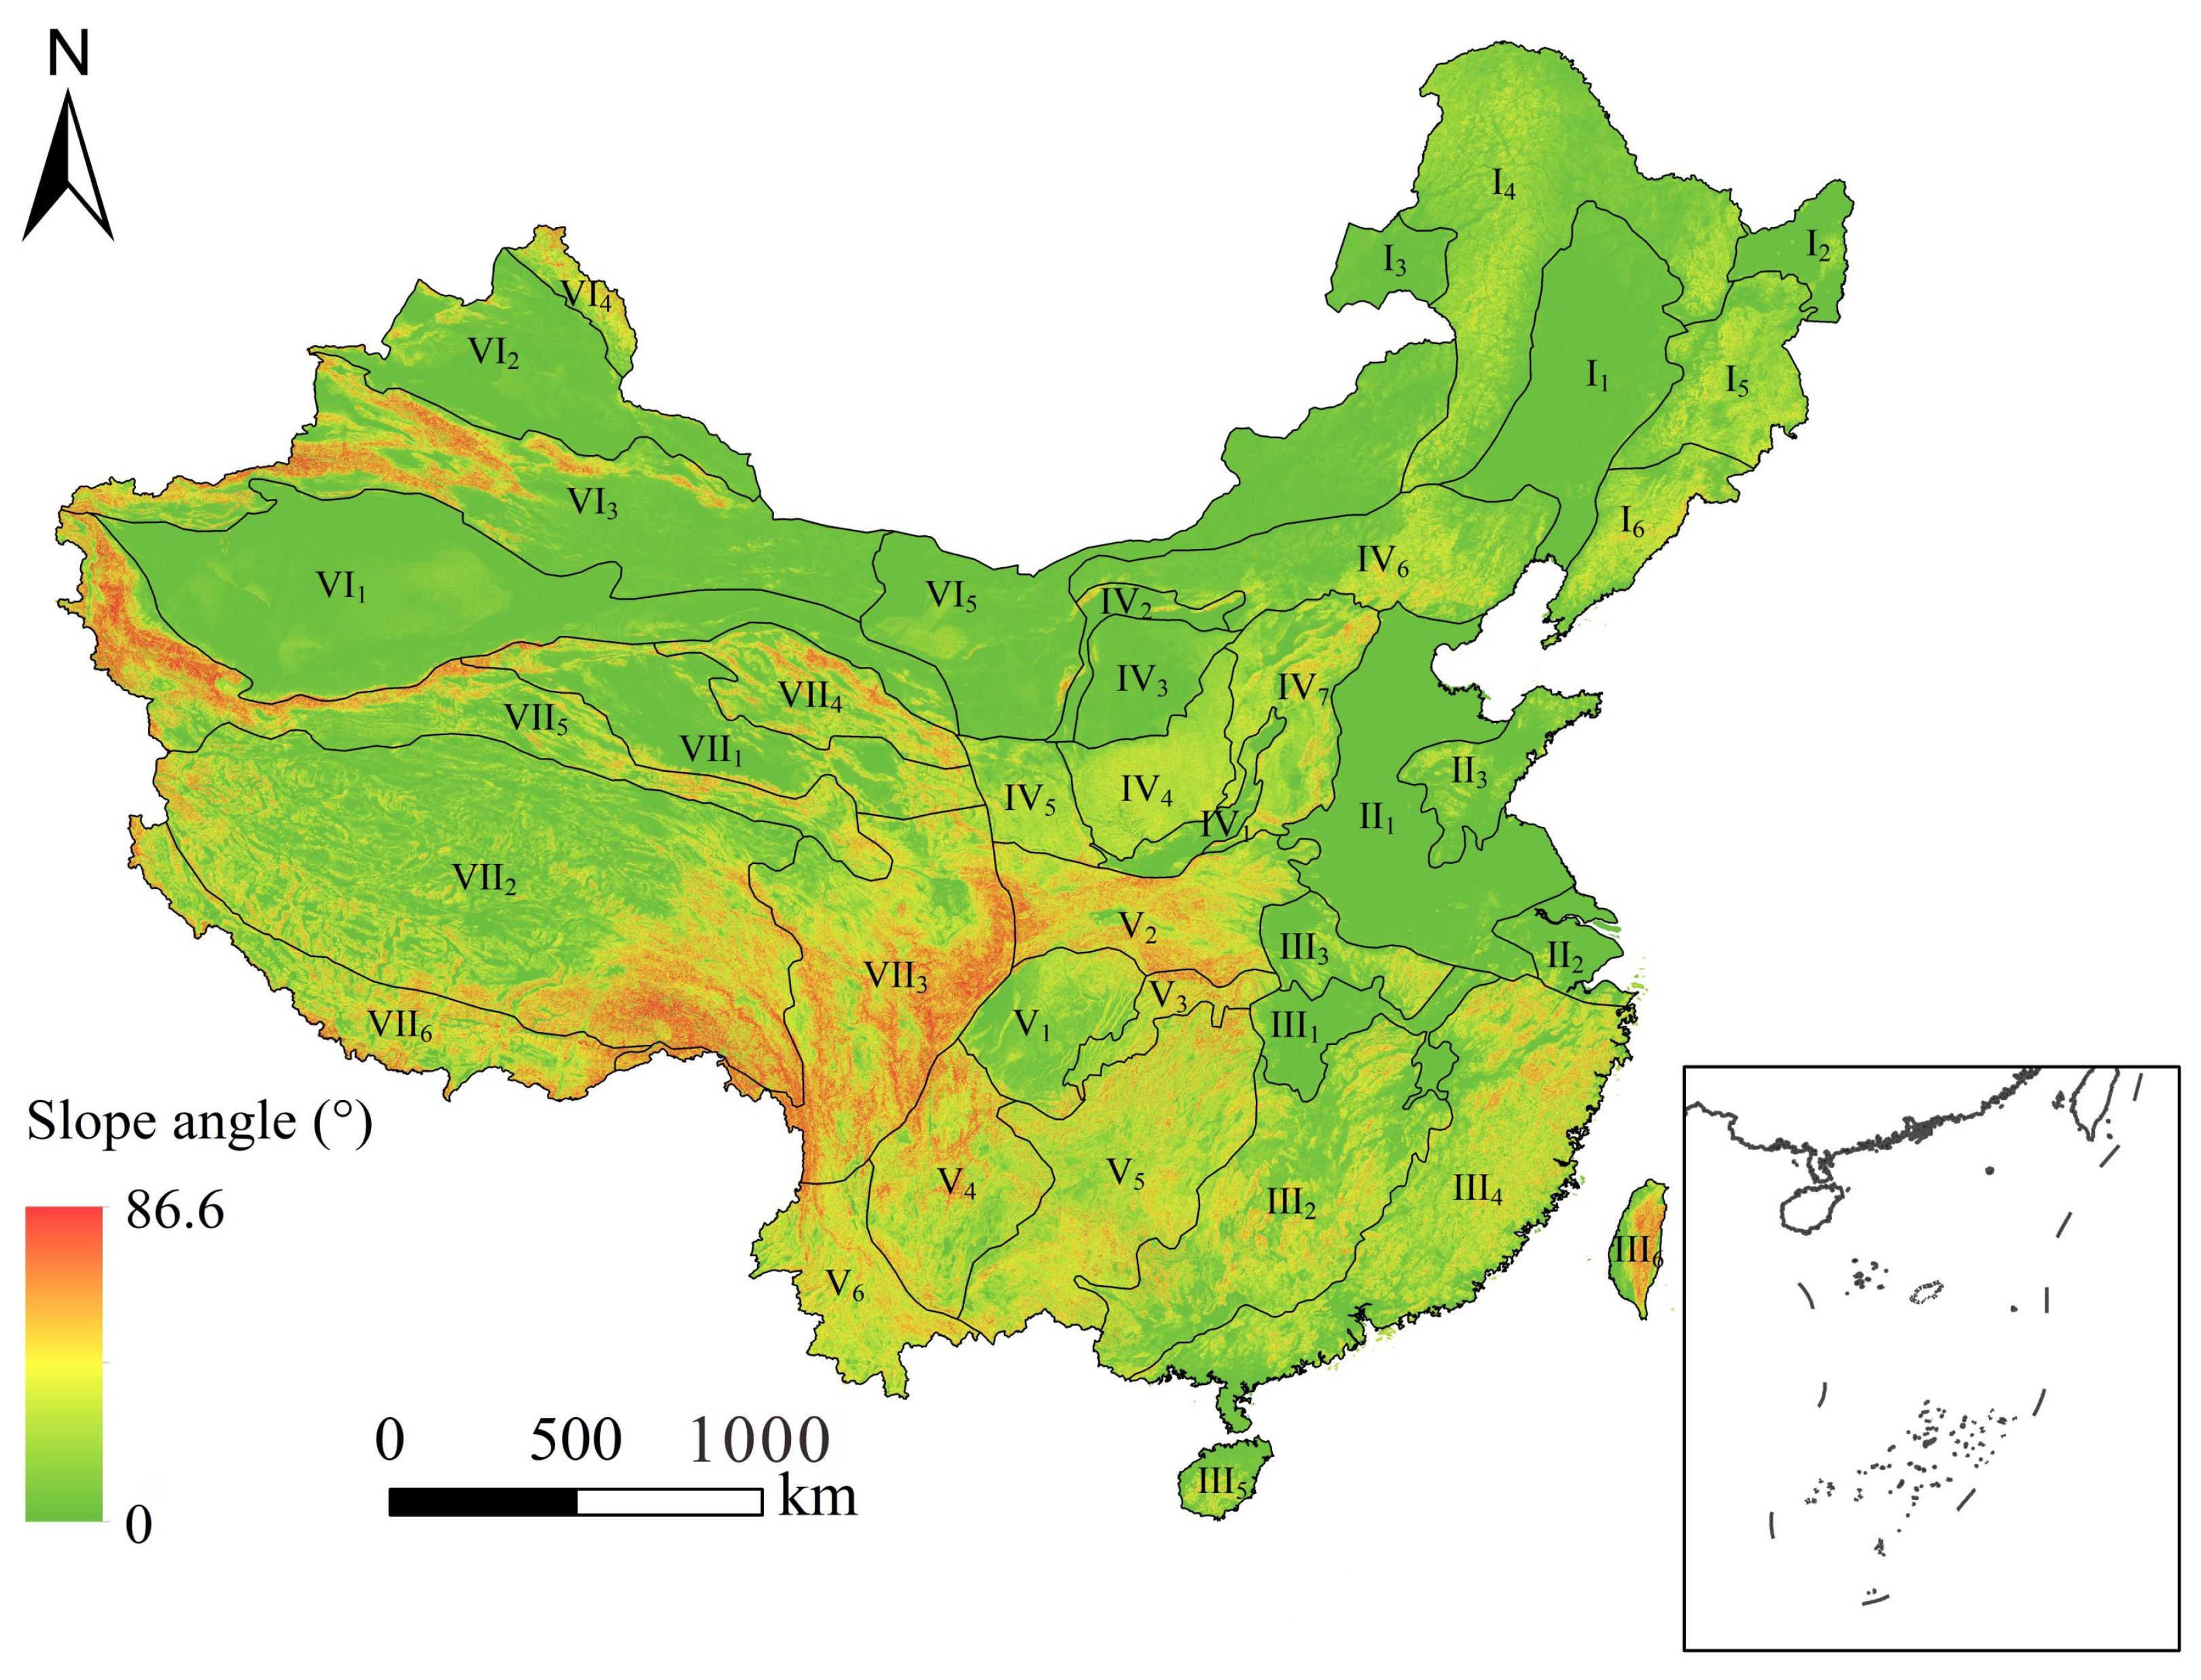
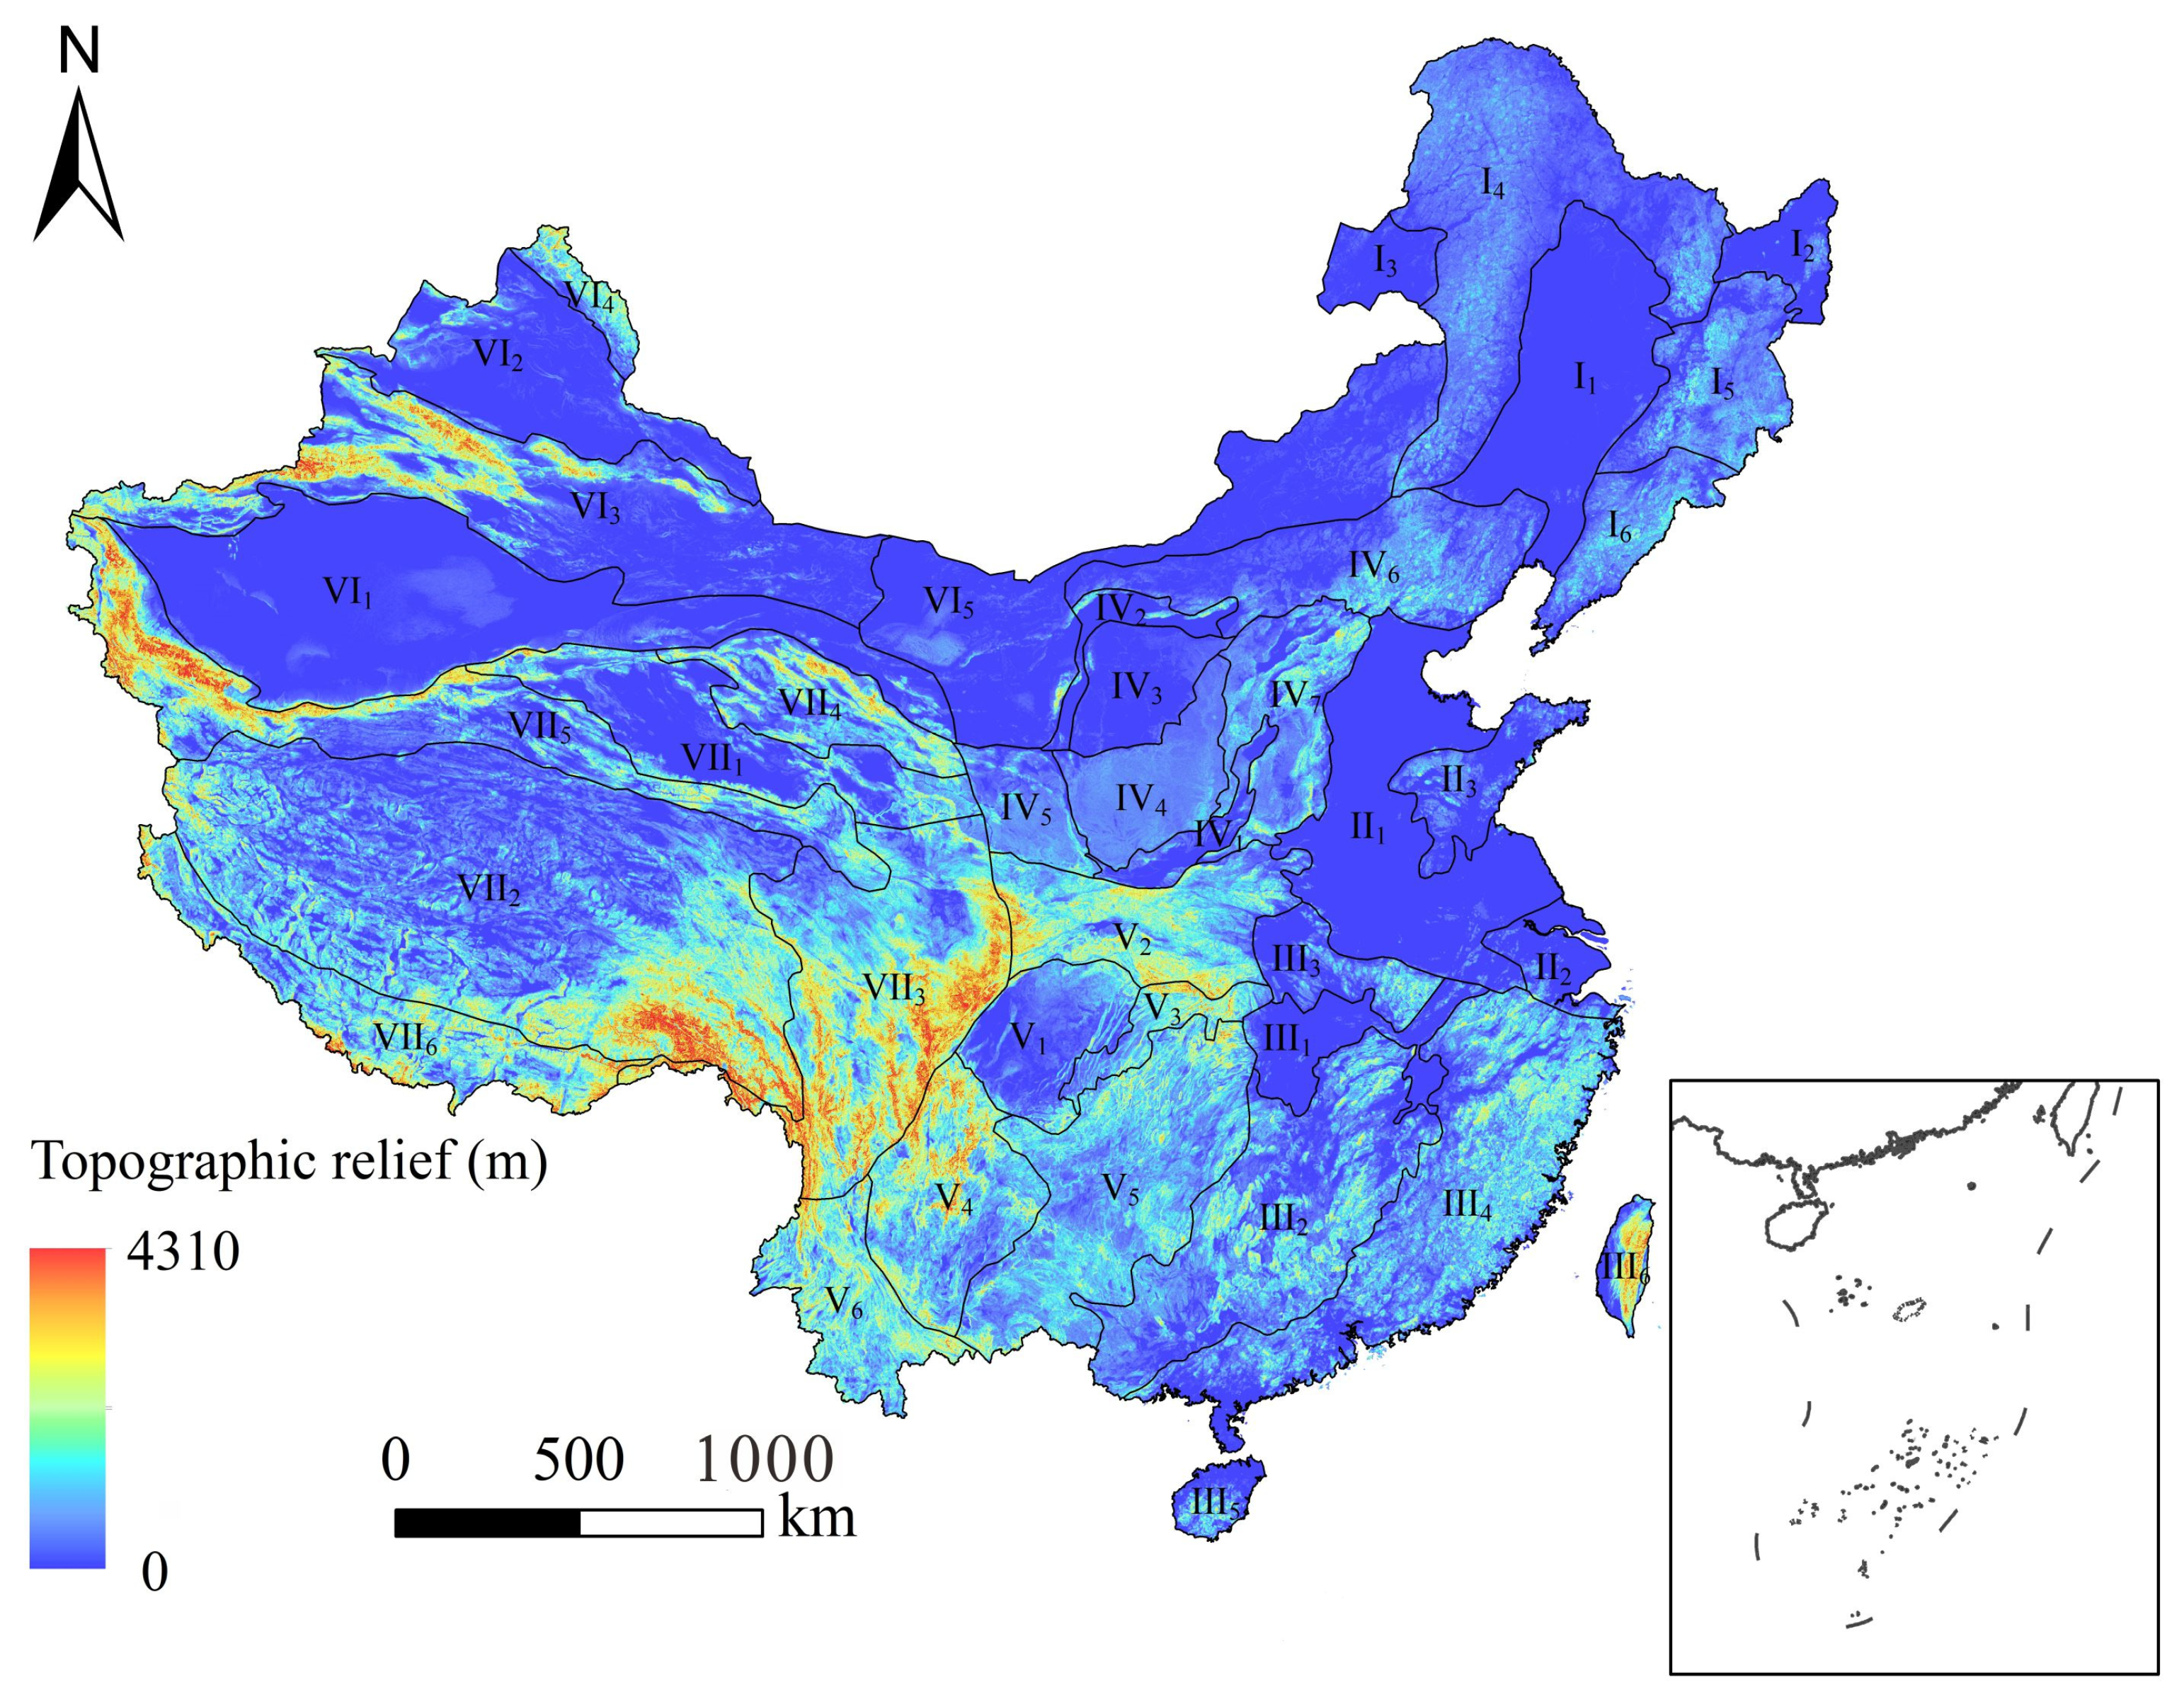
Therefore, this study aims to delve into the potential effectiveness of QNL models in non-landslide susceptibility research specifically adapted to the intricacies of China’s geological and geomorphological landscapes. We used two regional datasets and obtained two topographic indexes, including topographic relief and slope angle data, from the Shuttle Radar Topography Mission (SRTM) Digital Elevation Model (DEM). We proposed a China landslide non-susceptibility map (CLNSM) based on the existing QNL model proposed by Marchesini et al. [34] and compared our CLNSM with the global landslide susceptibility model proposed by Stanley et al. [37], which is based on a fuzzy algorithm. Our study contributes valuable insights into landslide susceptibility modeling, emphasizing the intricate relationship between geological factors and model outcomes. This study provides an effective reference for identifying non-susceptible landslide areas and predicting regional landslide risks, thereby improving forest protection strategies and promoting ecosystem protection and management.

2. Study Area

China’s landscape comprises mountainous, plateau, and hilly terrains, encompassing approximately 67% of its total land area, with basins and plains constituting the remaining 33%. This diverse and intricate topography features a variety of landforms, including plains, plateaus, mountains, hills, and basins. The mountainous regions, which occupy around two-thirds of the country’s landmass, primarily follow east–west and northeast–southwest orientations. The terrain typically slopes from west to east, creating a three-tiered distribution. The first tier encompasses the southwestern Qinghai-Tibet Plateau, boasting an average elevation exceeding 4000 m. The second tier, extending eastward from the Daxing’anling Mountains, Taihang Mountains, and Wushan Mountains to the Yungui Plateau, ranges in elevation between 1000 and 2000 m and is characterized mainly by plateaus and basins. The third tier, situated to the east of the second tier, features landscapes below 500 m above sea level, comprising hills and plains (Figure 1).
Significantly, the majority of catastrophic landslide events occur at the junction between the first and second tiers, particularly along the eastern edge of the Qinghai-Tibet Plateau, and the transition between the second and third tiers, encompassing the Loess Plateau and the middle reaches of the Yangtze River. Other high-incidence areas include the Sichuan Basin and surrounding mountainous regions, the Yungui Plateau, and the mountainous and hilly areas in the southeast. A smaller number of landslide disasters are observed in the northwestern Tianshan region, the western section of the Kunlun Mountains, and the northeastern Changbai Mountains region [38,39,40].

3. Materials and Methods

3.1. QNL Model

The QNL model represents the critical topographical conditions required for landslide occurrence. In this study, we employ the model proposed by Marchesini et al. [34], which is generally expressed as follows:
S = α × e x p ( β × R ) ,
where S is the local terrain slope in degrees; R is the regional relative relief in meters; α and β are regression parameters. Specifically, the numerical value of α aligns with the minimum slope threshold (R = 0), while β signifies the shape parameter, delineating the rate of change of the threshold curve.
The compilation of the 13 regional geomorphological, event, and multi-temporal inventory maps constitutes a robust and consistent dataset of high quality [41] for investigating terrain characteristics predisposed (or not) to landslides in Italy. These 13 inventories offer a comprehensive representation of the physiographical provinces across Italy where landslides are abundant. The Italian national landslide inventory encompassed a wide range of landslide types distributed across various physiographical regions and was utilized to validate the QNL model in Italy (QNL_ITA) [42]. The QNL_ITA model is
S = 3.539 × e x p ( 0.0028 × R )   ( 0 < R < 1000   m ) .
The Global Landslide Catalog (GLC) offers landslide records with occurrence dates, locations, types, triggers, and location accuracy estimates [43,44]. Additionally, NASA launched the Cooperative Open Online Landslide Repository (COOLR) to enhance dataset completeness through citizen science and original research contributions, with accuracy ensured via location accuracy measurements from multiple sources (https://gpm.nasa.gov/landslides/; accessed on 20 December 2023). Utilizing this dataset, Jia et al. [35] analyzed the spatial distribution characteristics of landslides, partitioning it into four major regions (North America, East Asia, Eurasia, and Oceania). The parameters of the QNL models for the China region (QNL_CHN) are outlined as follows:
S = 1.246 × exp 0.0036 × R   ( 0 < R < 1000   m ) .

3.2. Data Sources

The data employed in this study includes elevation data obtained from the Shuttle Radar Topography Mission (SRTM) Digital Elevation Model (DEM) at a resolution of 3 arc-seconds (https://srtm.csi.cgiar.org/srtmdata/; accessed on 20 December 2022), which was projected and resampled to a 100 m resolution DEM data to depict the elevation distribution across the entire Chinese region. The construction of the QLN model relies on the calculation of relative relief and terrain slope data. To ensure the independence of the two terrain data indicators, distinct grid sizes for adjacent sliding calculation windows were applied in the computation of topographic relief and slope angle; the calculation window for relative relief utilized a 15 × 15 grid size, representing the relative variation in elevation within the window, equal to the difference between the maximum and minimum elevations. Slope calculations were performed using the Surface Analysis tool in ArcGIS software, extracting slope values from the DEM data with a 3 × 3-pixel window. Here, the slope was calculated as the surface change rate (increment) from the central pixel to each neighboring pixel in both the horizontal (dz/dx) and vertical (dz/dy) directions. Figure 2 and Figure 3 show the distribution of slope angle and topographic relief, respectably.
Through an integrated analysis of foundational background conditions using a dominant factor analysis approach, the China Geological Survey systematically partitioned the Chinese area into seven geological environment regions [45]. Initially, the primary geological environment regions were delineated based on topographic features (elevation and relief), primary tectonics structures, and climate factors. Subsequently, specific characteristics of each primary geological environment region were considered, and key indicators influencing the primary geological environment were selected from criteria such as landform units, surface lithology, secondary active structures, hydrogeological engineering geological conditions, susceptibility to geological hazards, and human activities. These indicators facilitated further subdivision into seven primary regions and 39 secondary regions (Figure 1 and Figure 4).
The primary regions encompass the following: (I) Northeast Plain and Mountain Geological Environment Region (Northeast region); (II) Huang-Huai-Hai and Yangtze River Delta Plain Geological Environment Region (Huanghuaihai Yangtze River Delta region); (III) South China Low Mountain and Hill Geological Environment Region (South China region); (IV) Northwest Loess Plateau Geological Environment Region (Loess region); (V) Southwest Karst and Rocky Mountain Geological Environment Region (Southwest region); (VI) Northwest Arid Desert Geological Environment Region (Northwest region); (VII) Qinghai-Tibet Plateau Cold Frozen Soil Geological Environment Region (Qinghai Tibet region).
The topographic relief and slope angle of the 39 geological environment subregions were computed, providing regional area, average relief, and average slope angle for each. Figure 4 illustrates the area, average topographic relief, and average slope across different geological environment subregions. The results reveal a consistent pattern, with regions exhibiting higher average relief corresponding to larger average slopes. Based on the geological environment subregions table, the 39 subregions were categorized according to geological hazard susceptibility. Among them, eight regions were identified as highly susceptible, primarily concentrated in the Northwest Loess Plateau, Southwest Mountainous Region, Himalayan Region, and Taiwan Region. These regions include the Taiwan Plain and Mountain Geological Environment Subregion, Longdong-Shaanbei Loess Plateau Geological Environment Subregion, Shaanxi Loess Plateau Geological Environment Subregion, Qinba Mountain Geological Environment Subregion, Three Gorges of the Yangtze River Geological Environment Subregion, Dianzhong-Chuanxinin Southwest Plateau Mountain Geological Environment Subregion, Western Yunnan Geological Environment Subregion, Western Sichuan-Eastern Tibet Plateau Geological Environment Subregion, and the Himalayan Extremely High Mountain Geological Environment Subregion. These areas exhibit distinct topographic features characterized by higher relief and steeper slopes, with the geological environment subregions in the loess region displaying relatively lower relief and slope compared to other regions.

4. Result and Analysis

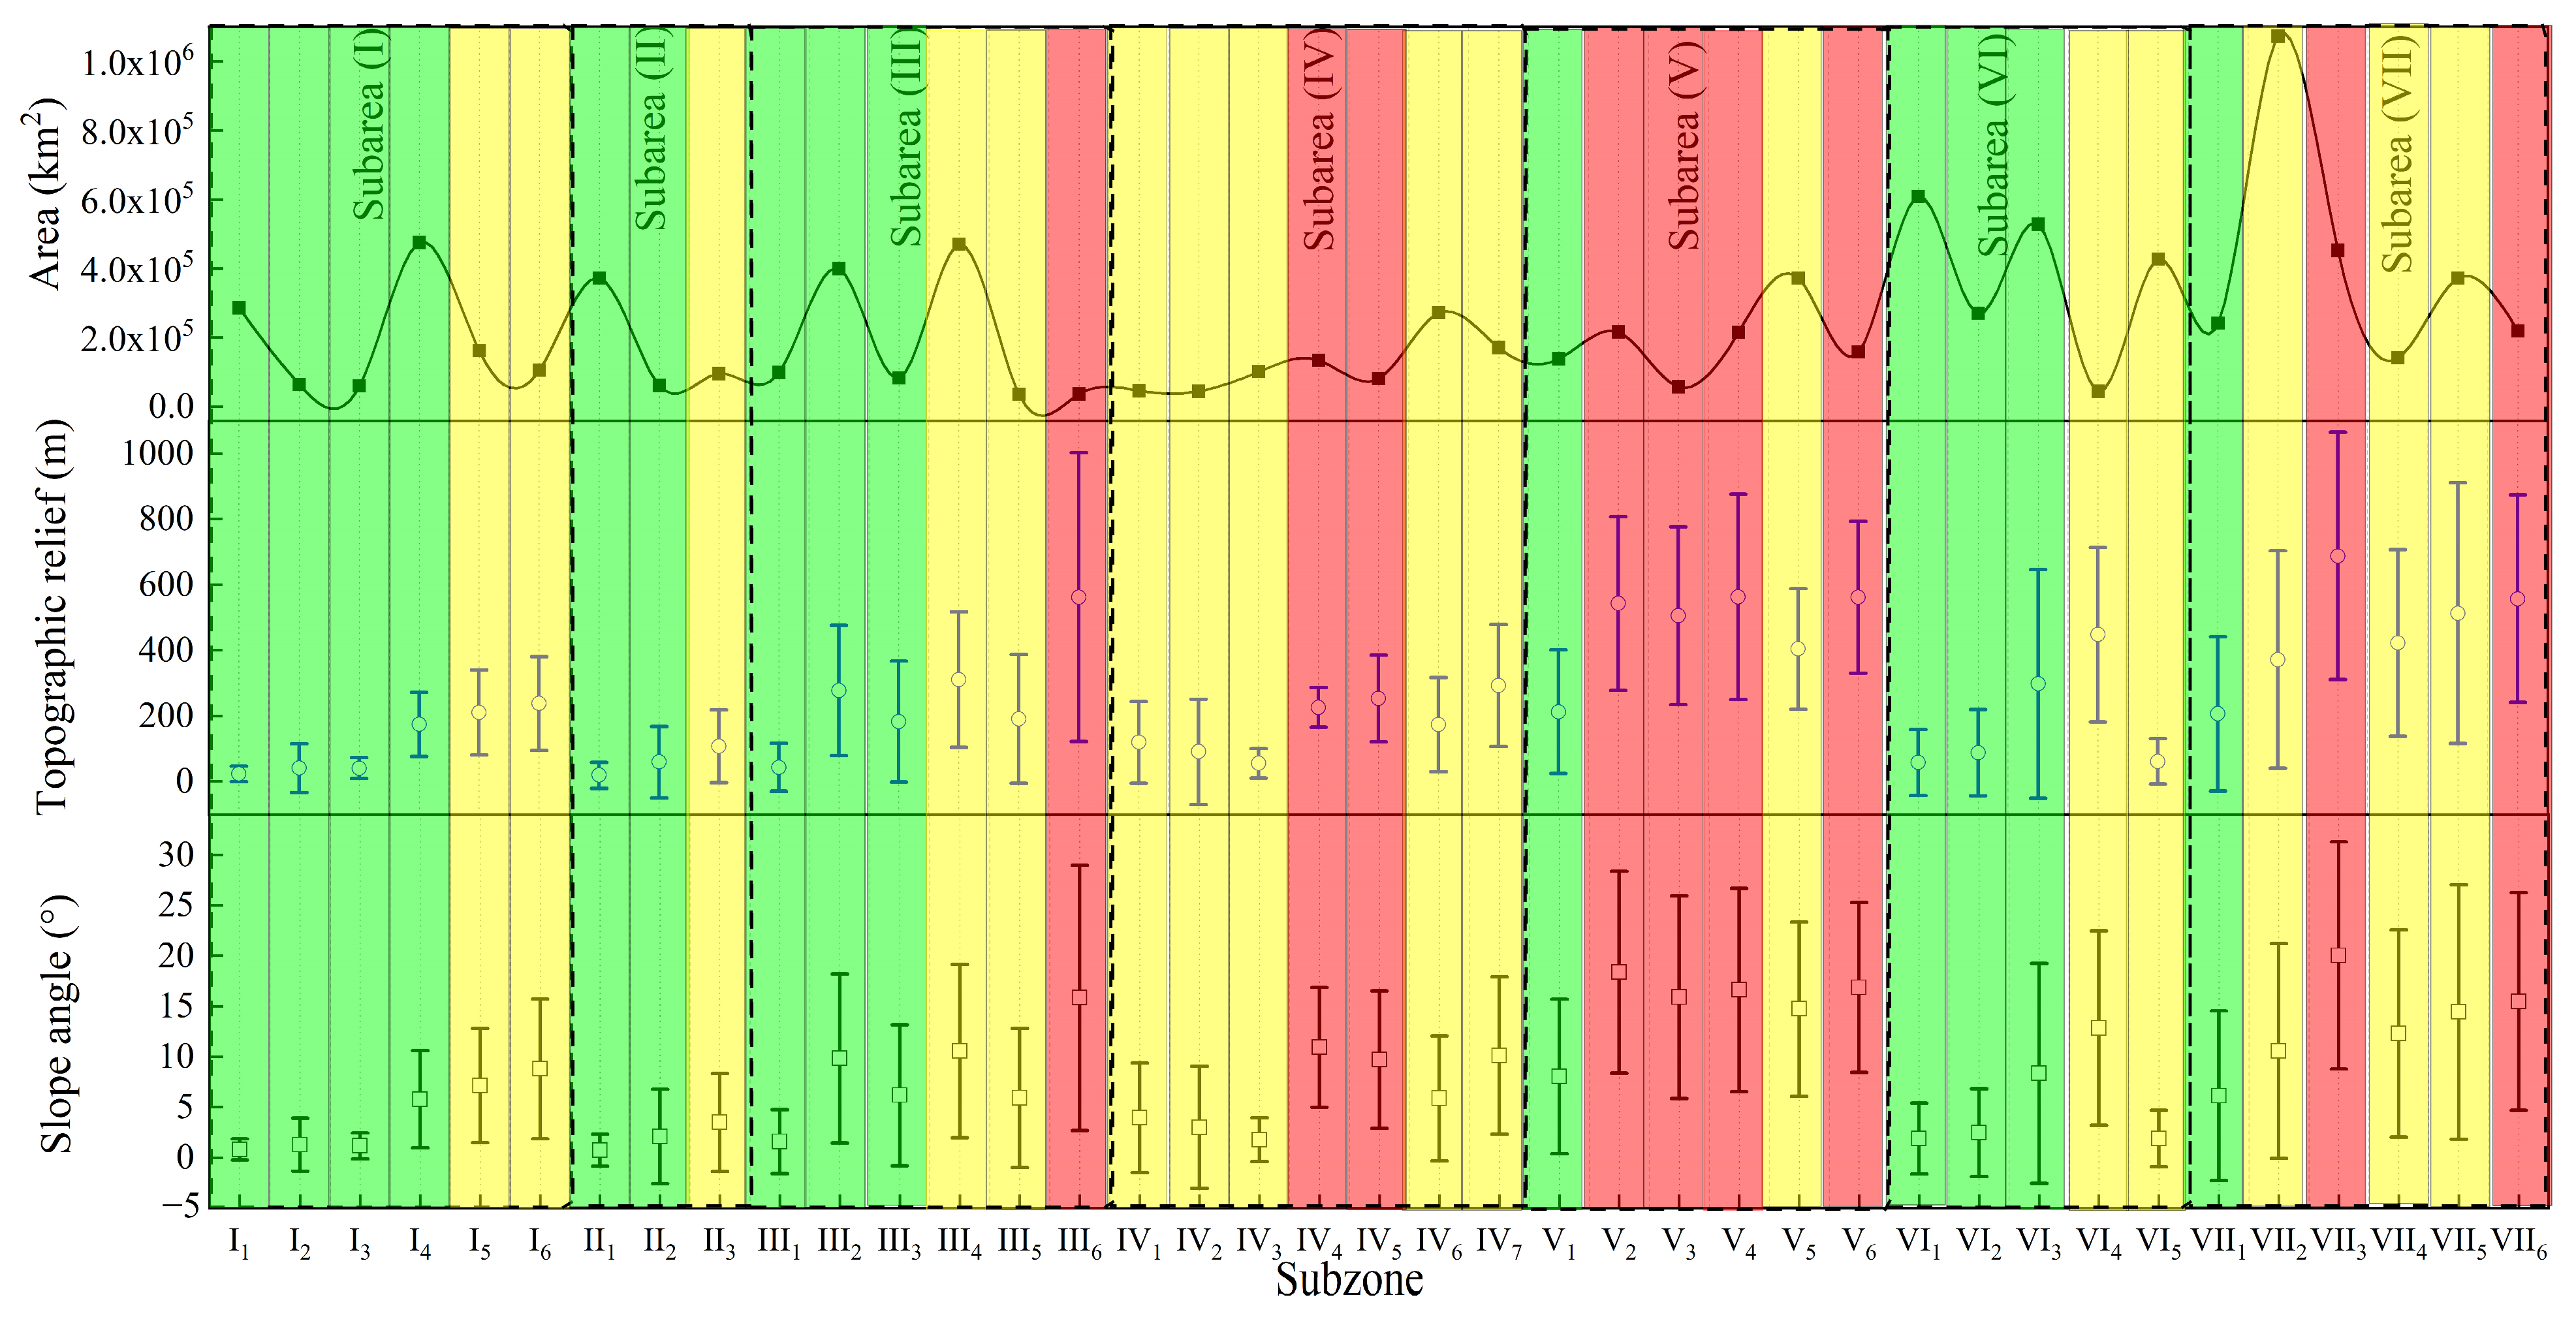
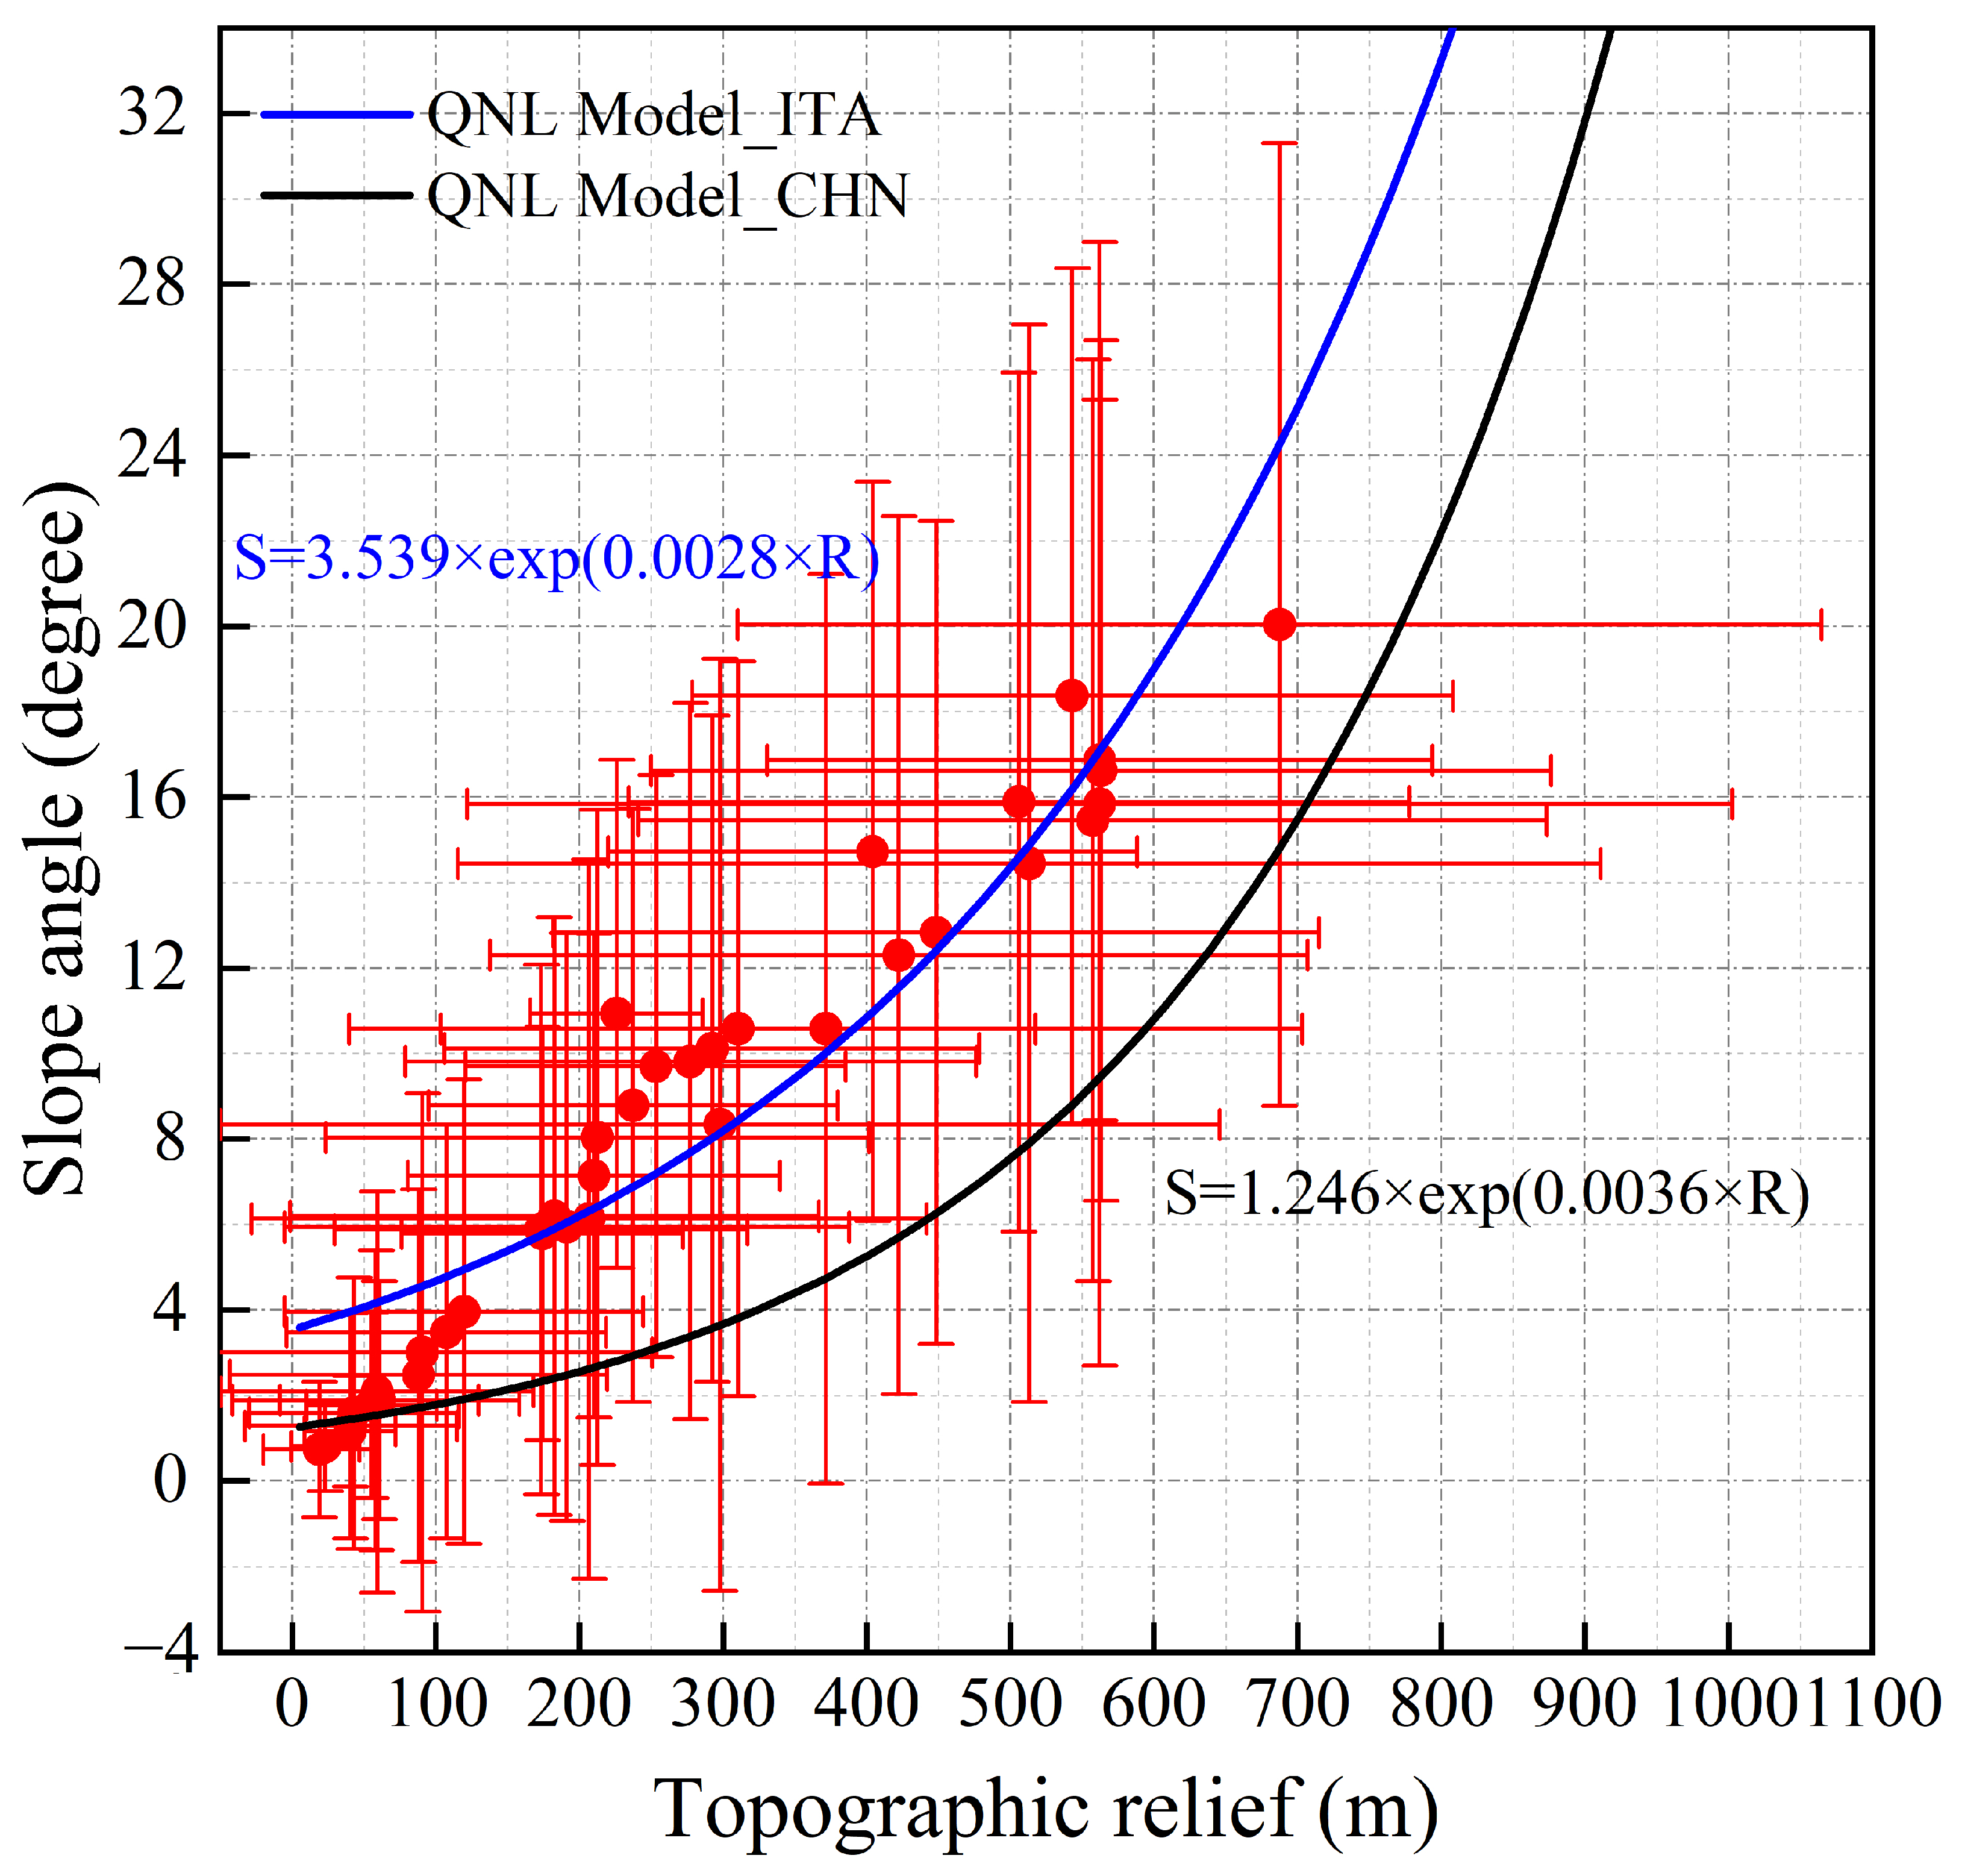
Based on the average relief and slope angle of the 39 secondary geological environment subregions, we observed a strong correlation between the two variables (Figure 5). Simultaneously, the QNL model fitted curve based on landslide data in the East Asia region reveals that, excluding regions with small relief (less than 50 m) and low slope (less than 3°), all data points from the geological environment subregions lie above this curve. Compared to the expected slope obtained from the QNL model based on Italian landslide data, this curve exhibits relatively lower slopes, indicating that, under similar relief conditions, the evaluated slope of landslide-prone areas is relatively lower. This is one of the reasons why this curve predicts a higher number of non-prone areas. The QNL model based on Italian landslide data predicts relatively larger slopes, with corresponding slopes of 4.7°, 14.4°, and 33.2° for relief of 100 m, 500 m, and 800 m, respectively. In contrast, the QNL model based on East Asian landslide data predicts relatively smaller slopes, with corresponding slopes of 1.8°, 7.5°, and 22.2° for relief of 100 m, 500 m, and 800 m, respectively. In summary, the fitted curve based on Italian landslide data closely aligns with geological environment subregion points. For relief values below 150 m and above 500 m, different geological environment subregion points are consistently below the blue fitted curve. However, when relief is in the range of 200 to 500 m, various geological environment subregion points are consistently above the blue-fitted curve. In contrast, the fitted curve based on East Asian landslide data generally lies below the geological environment subregion points.
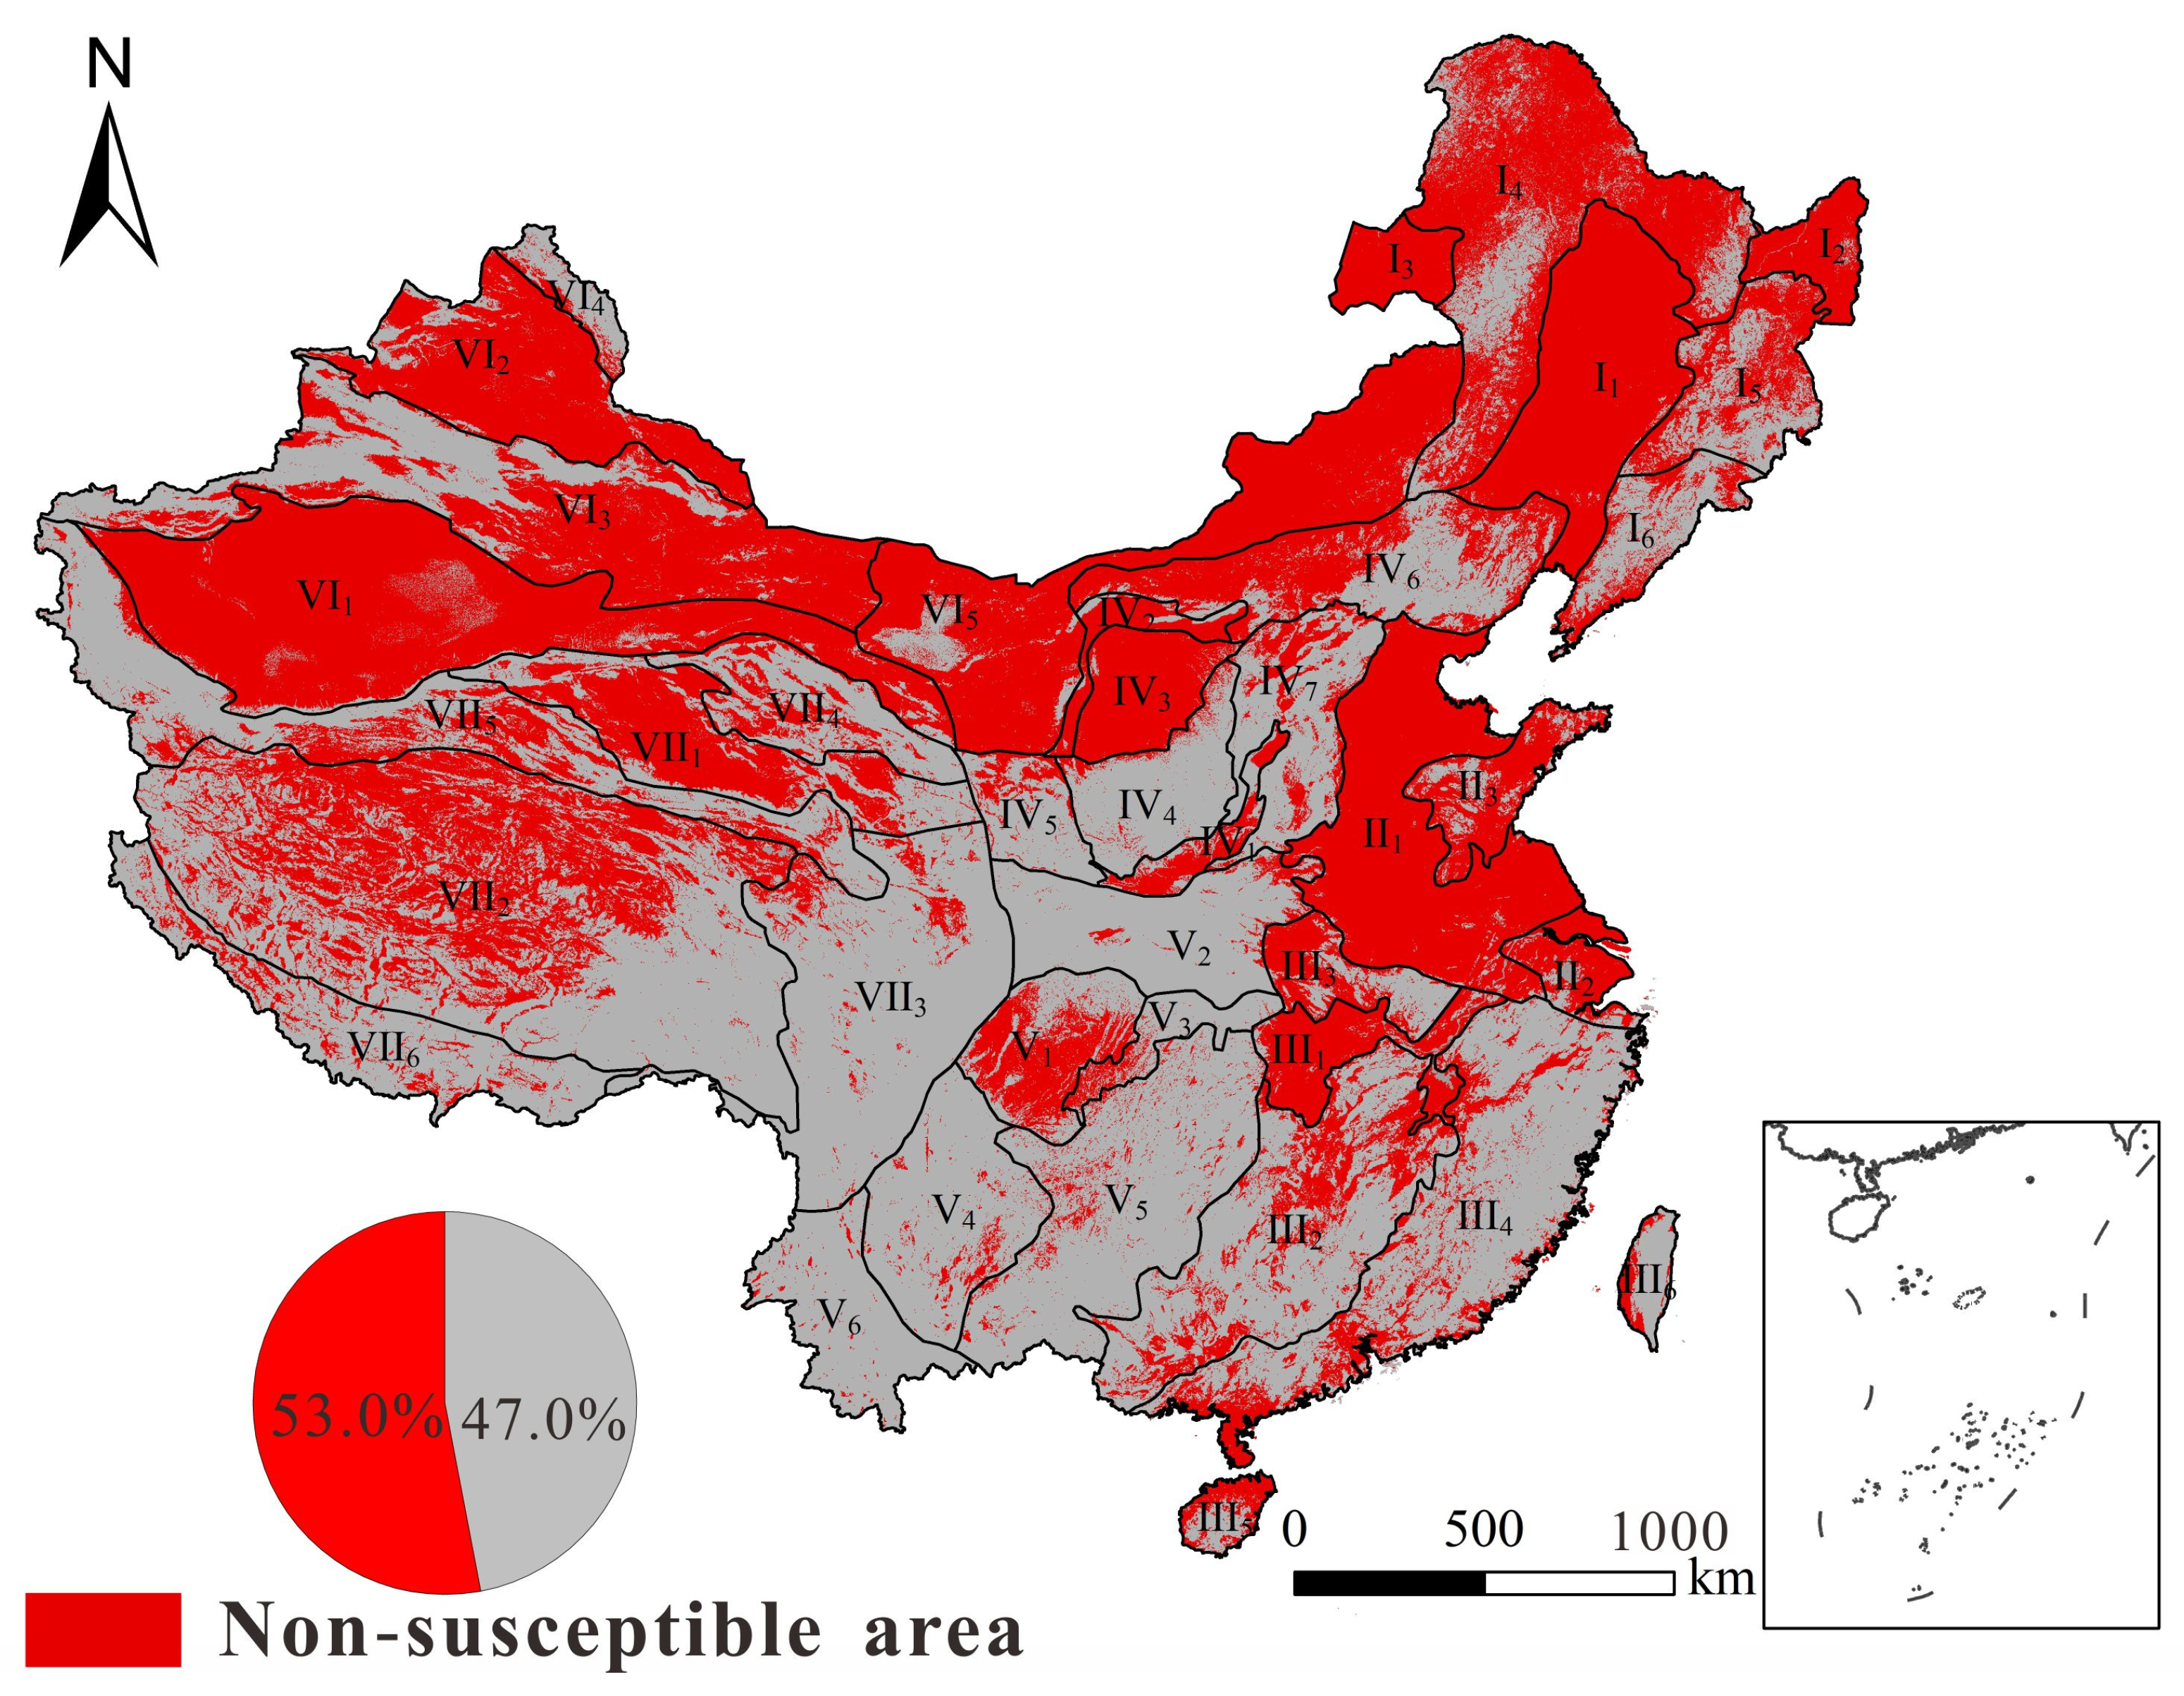
To assess the effectiveness of the two models in the Chinese region, we employed terrain data for QNL model computations. 
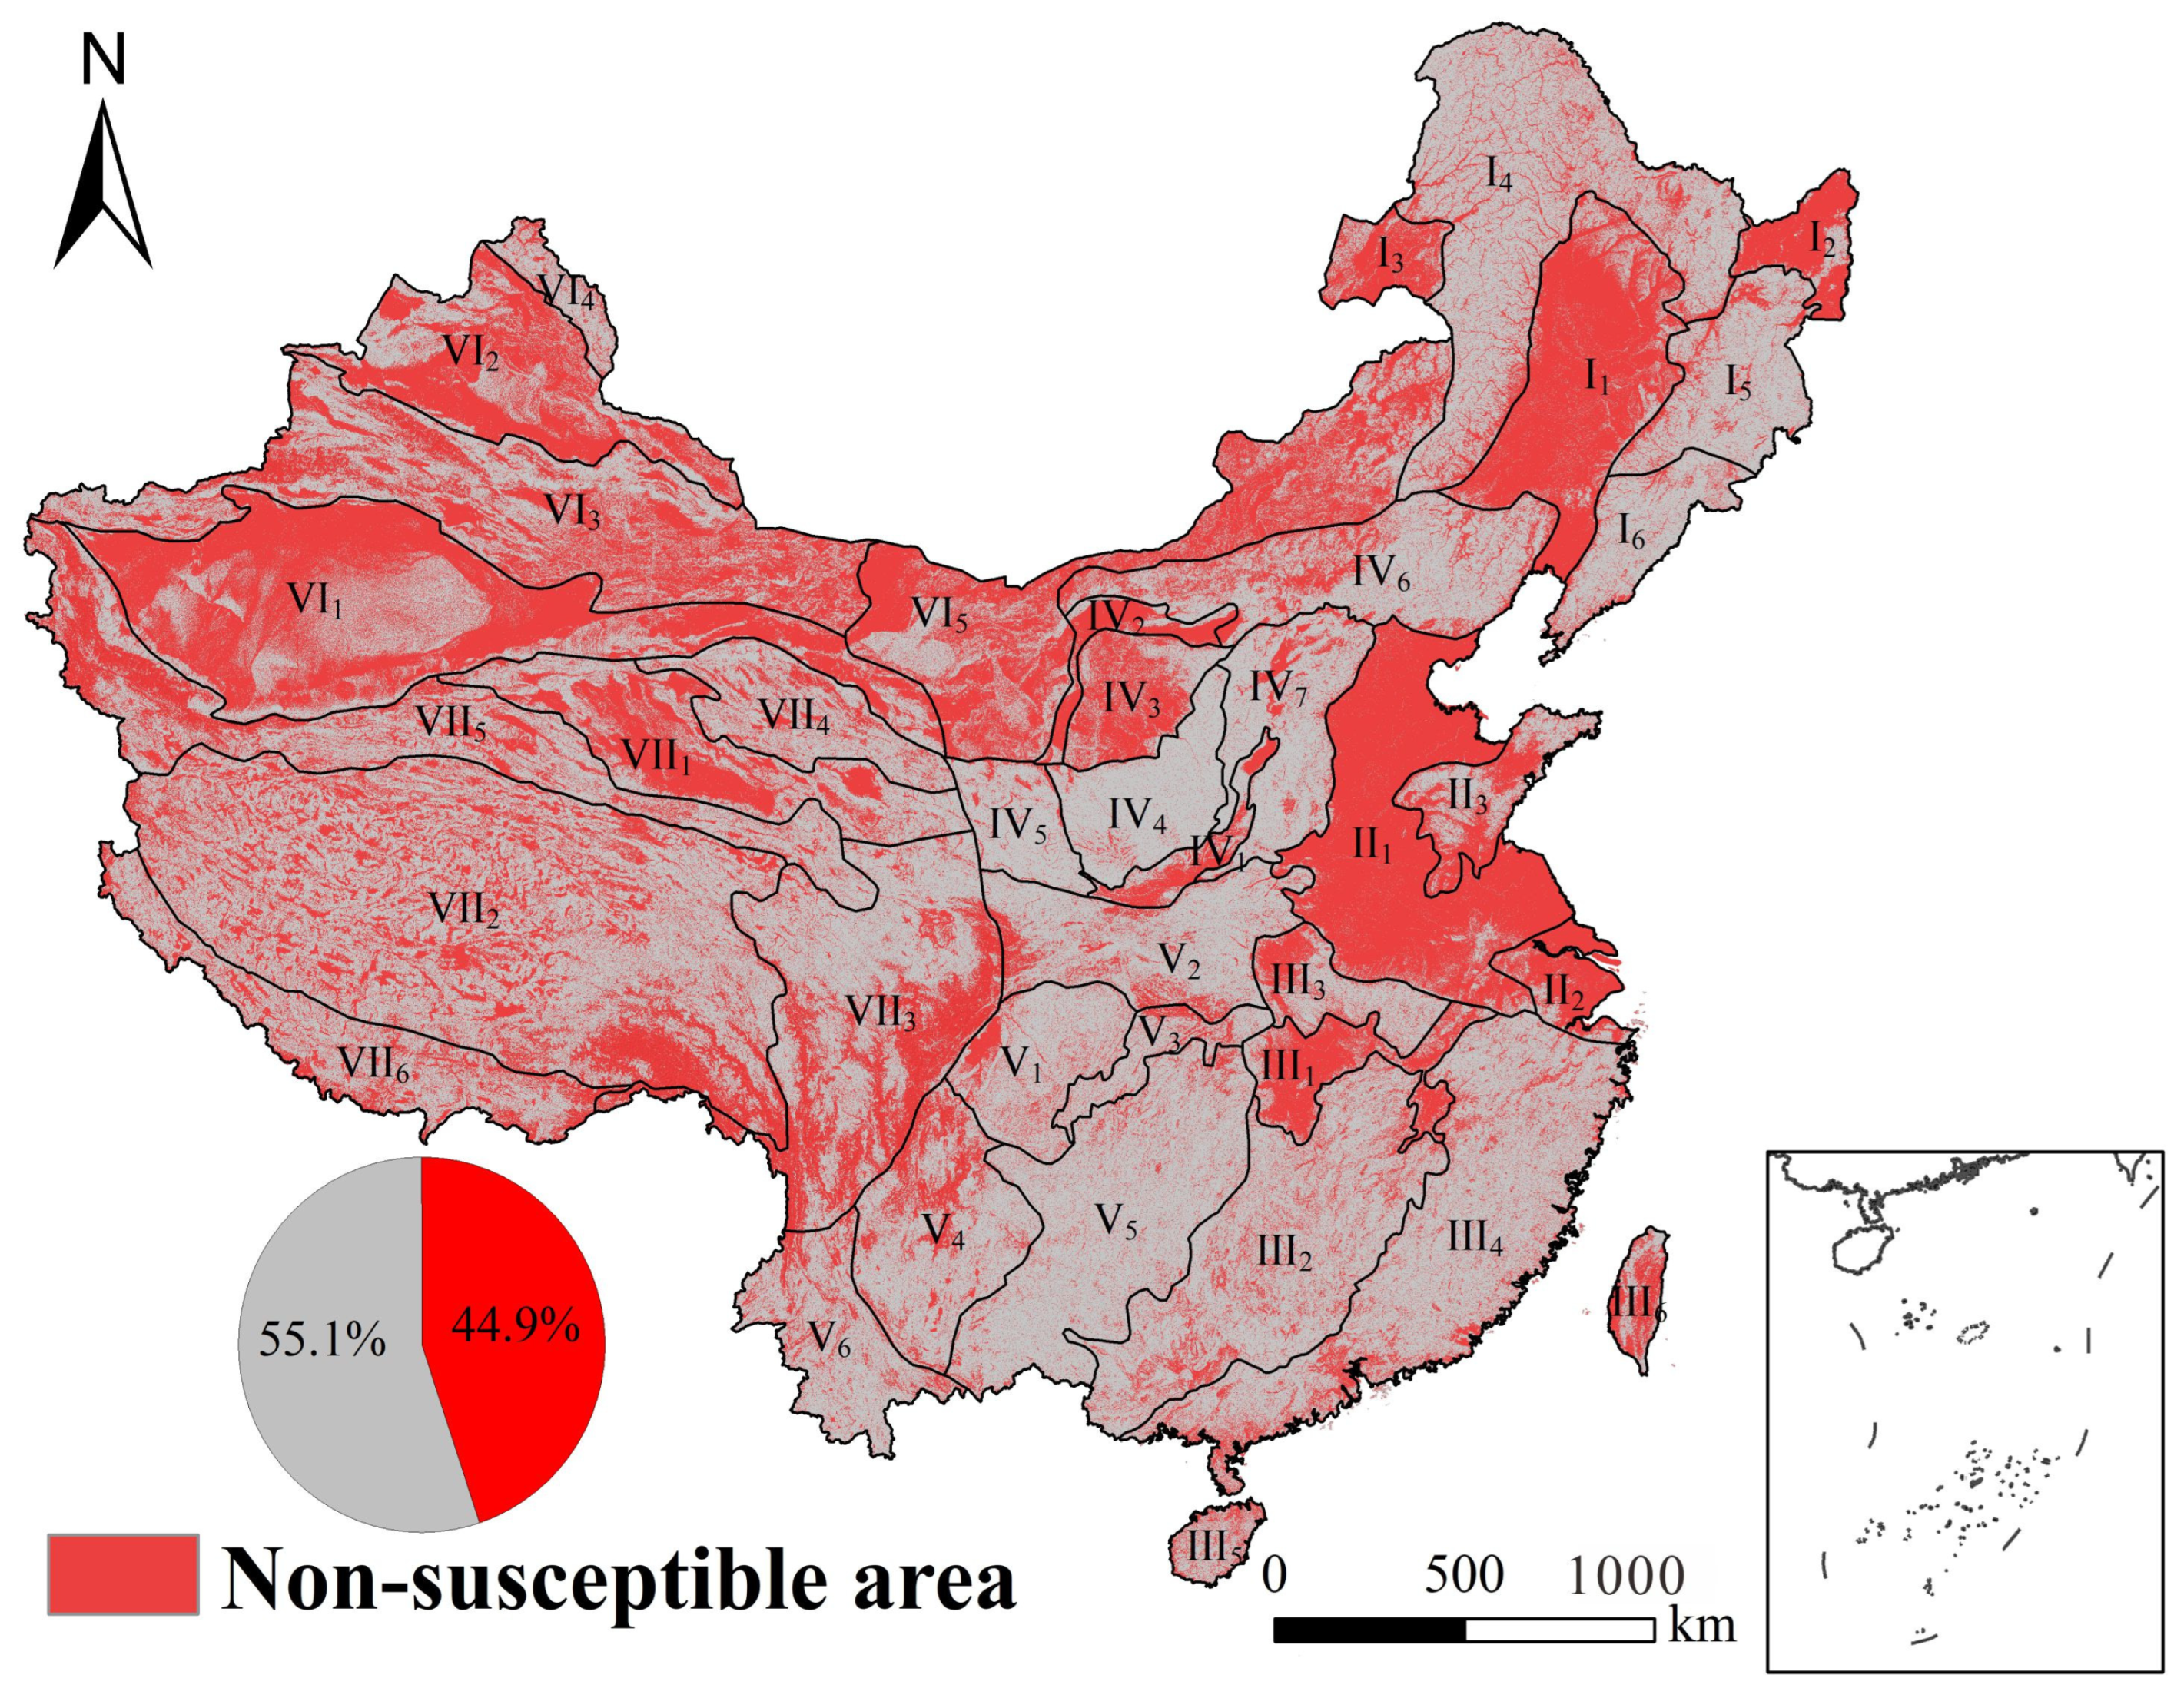
Figure 6 illustrates the map of non-landslide-prone areas calculated using the QNL model based on local Chinese landslide data, while 
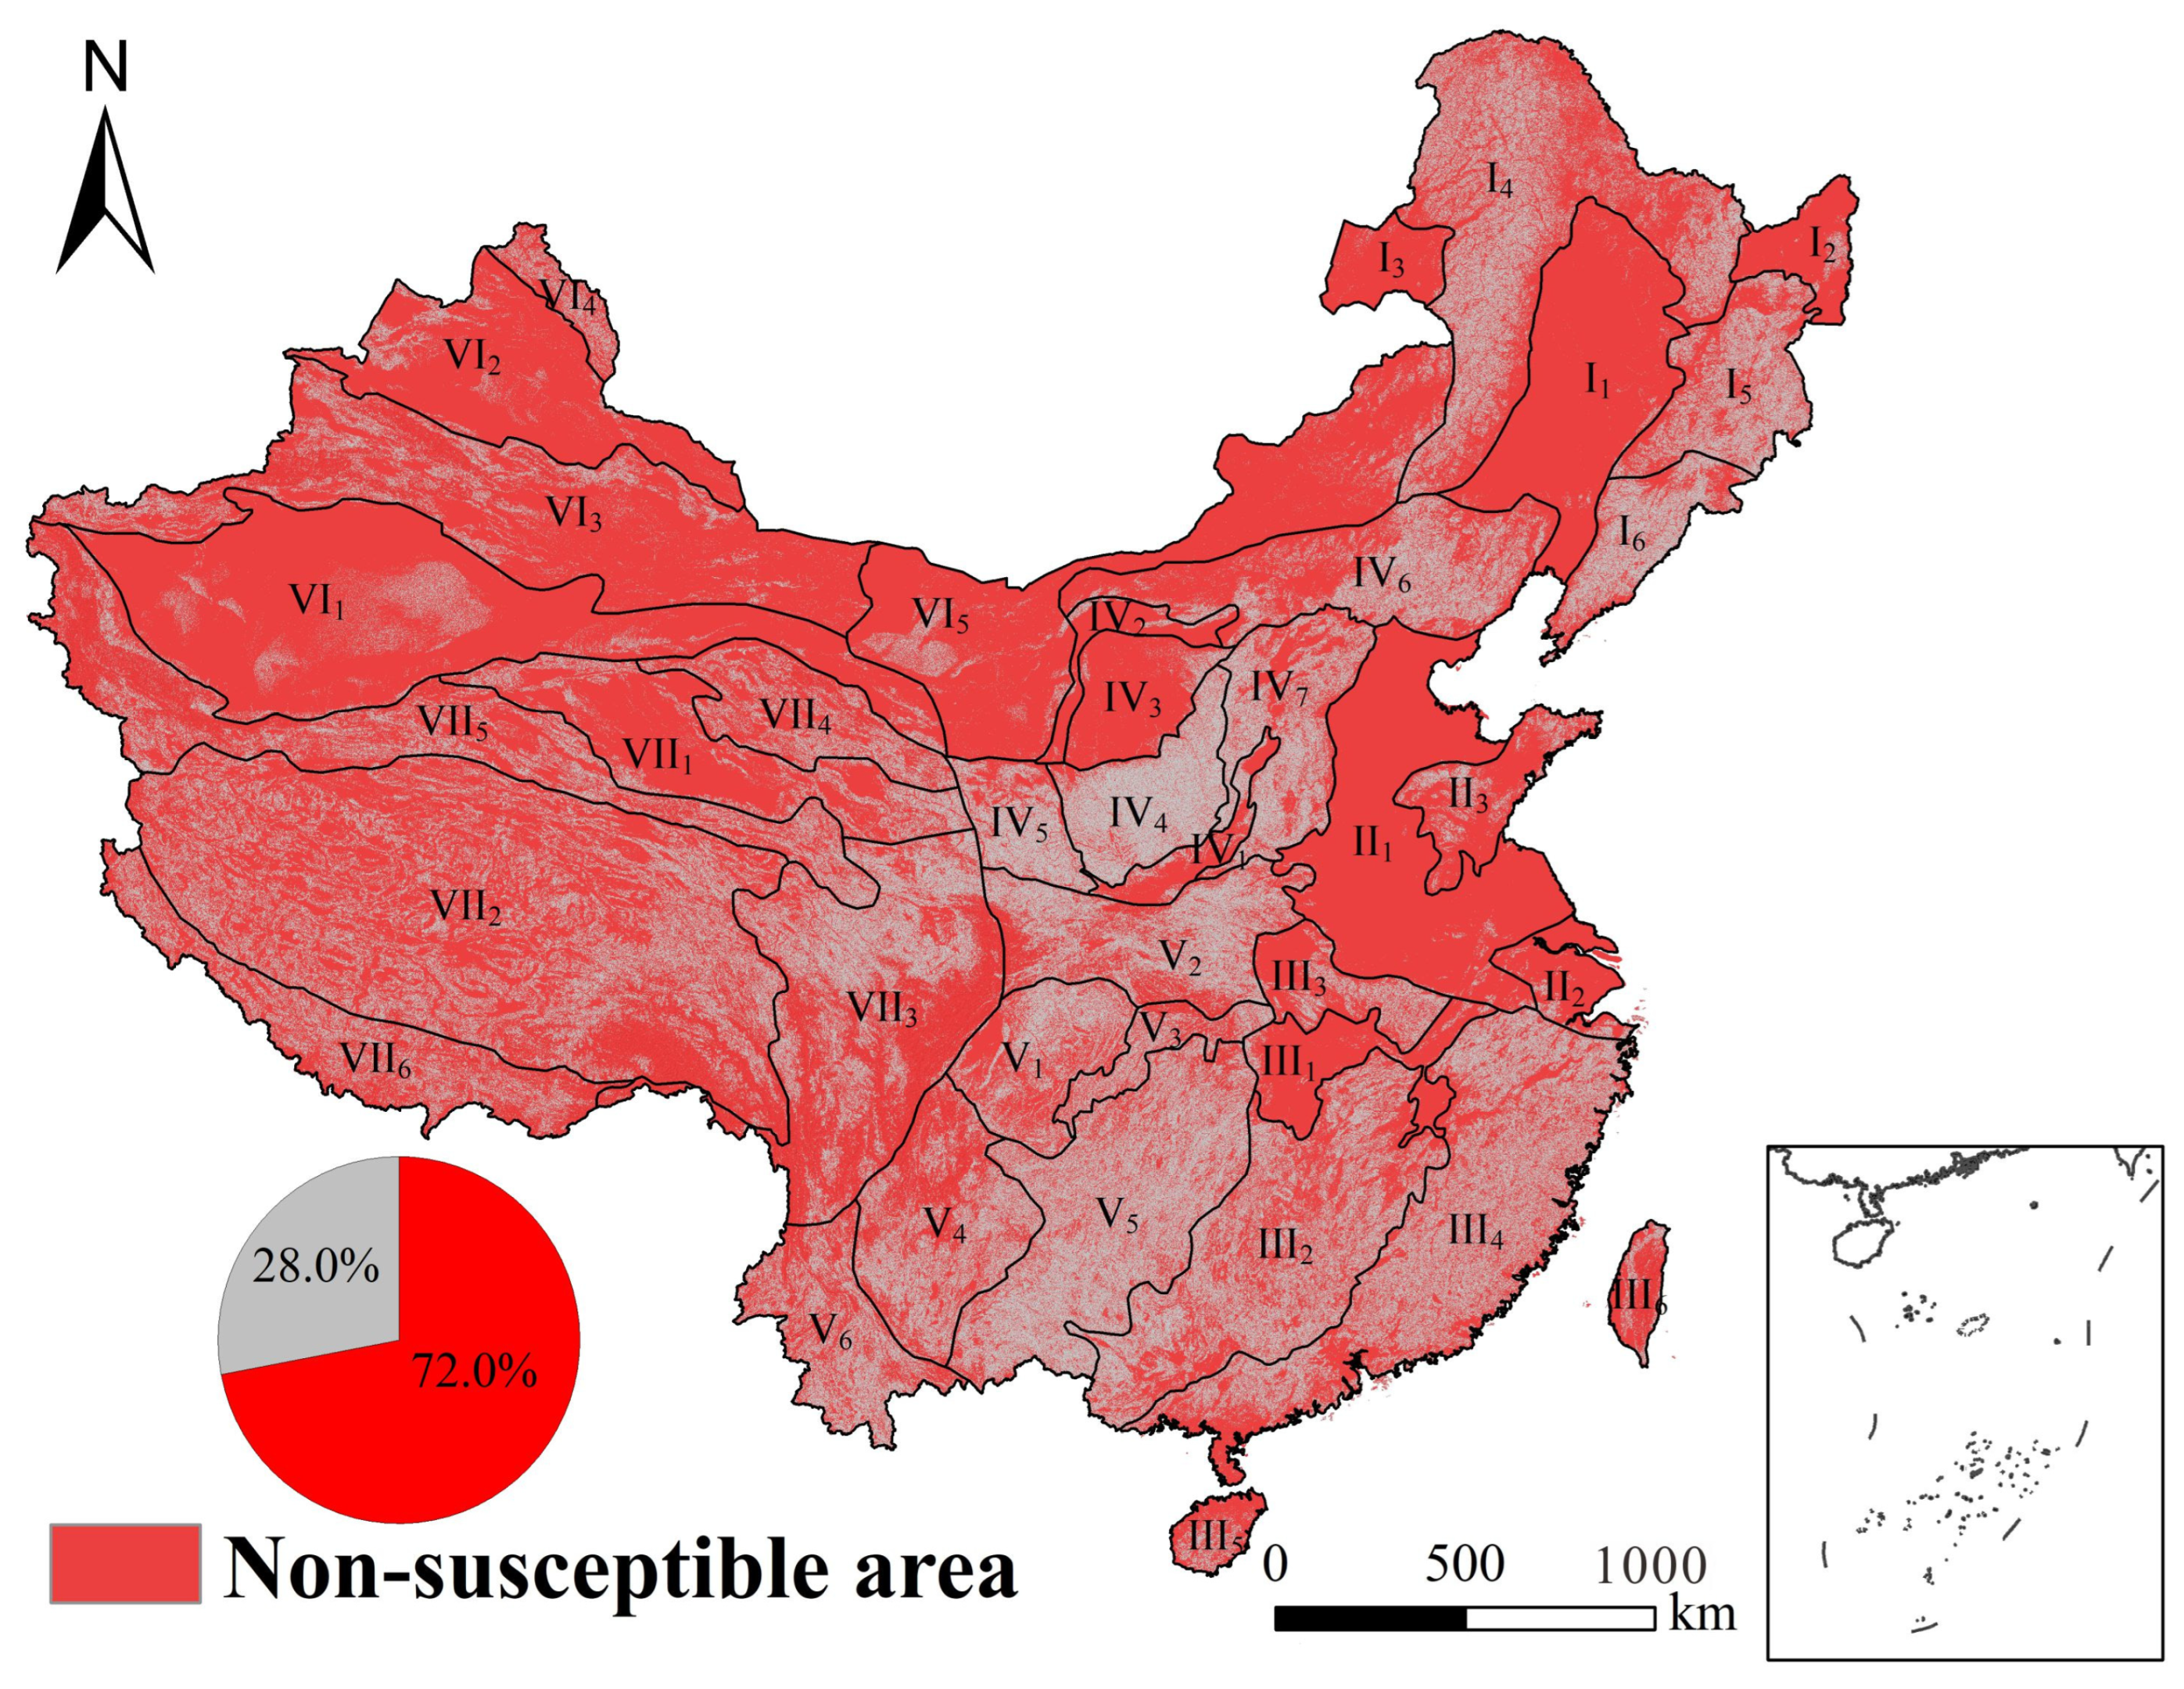
Figure 7 presents the map derived from Italian landslide data. It is noteworthy that the non-landslide-prone areas predicted through the QNL model using Chinese local landslide data are relatively smaller, with landslide-prone areas being comparatively larger. The proportions of these two areas are 44.9% and 55.1%, respectively, relative to the total national land area. In contrast, the QNL model based on Italian landslide data predicts a larger non-landslide-prone area, constituting 72% of the total national land area.
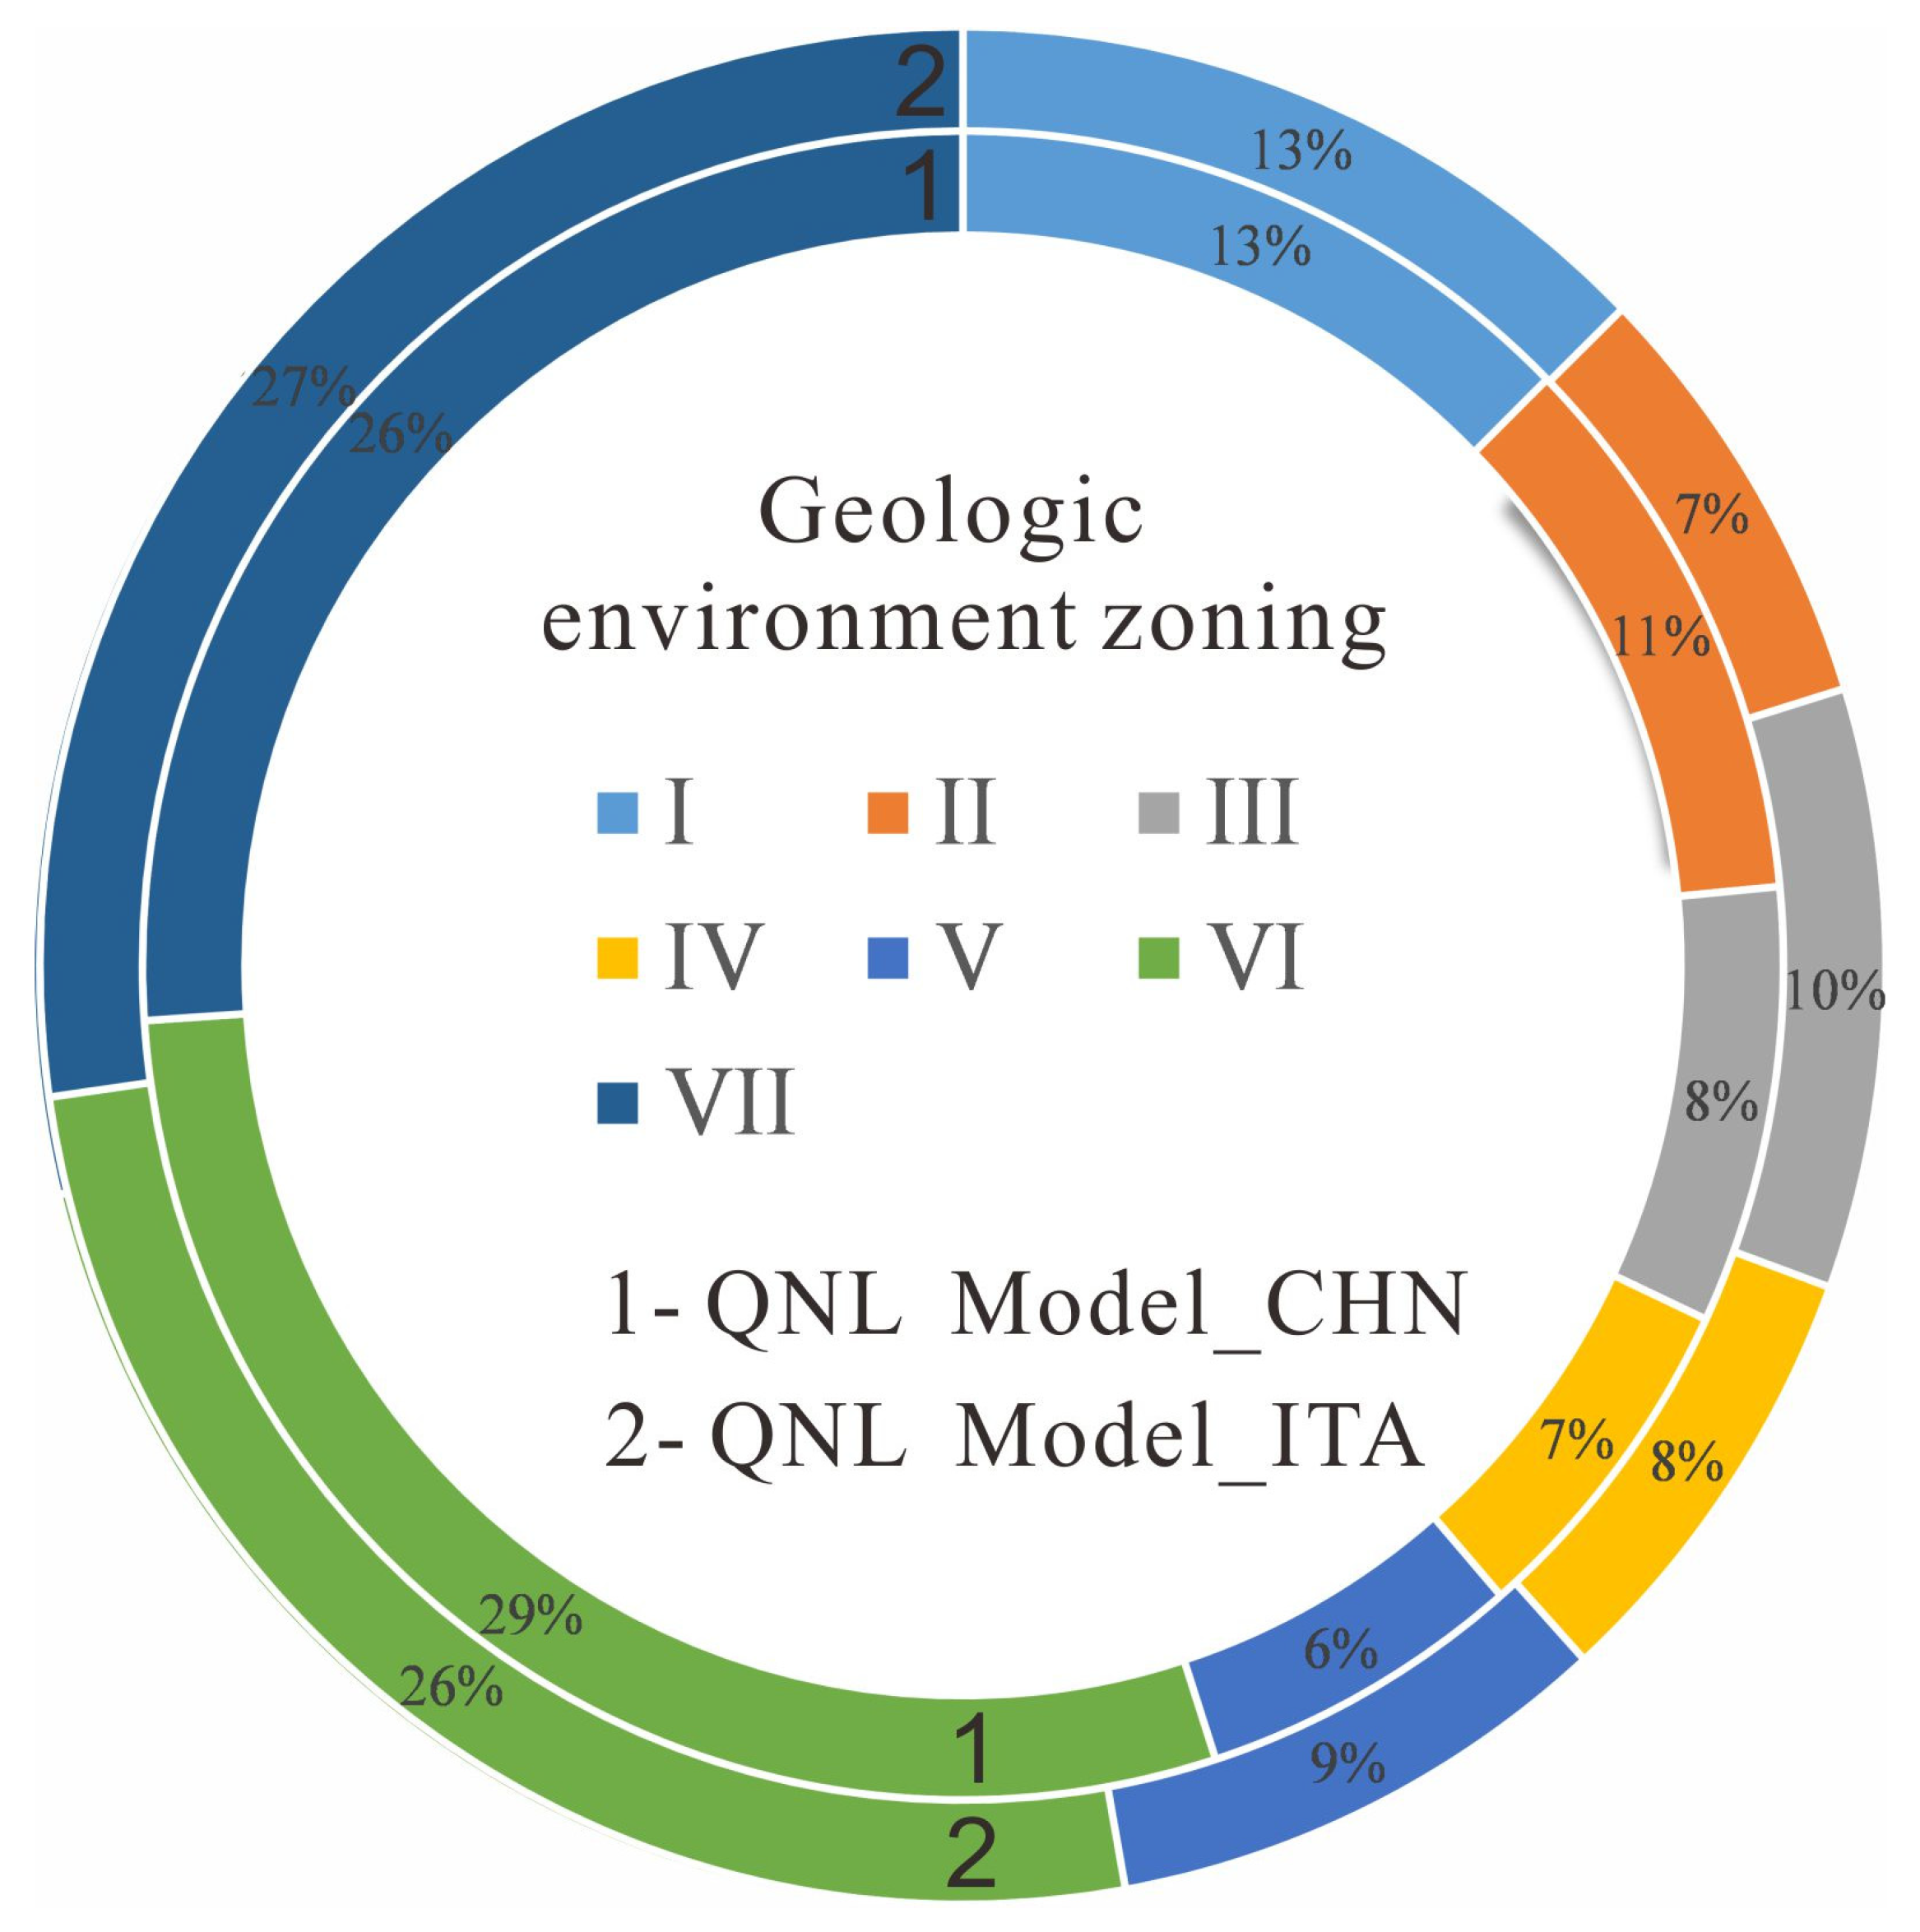
To quantitatively compare the non-landslide-prone areas predicted via the two models in the Chinese region, we calculated the percentage of non-landslide areas under seven primary geological environmental zones relative to the total area. Figure 8 depicts the percentage of non-landslide-prone areas in different geological environmental zones. Overall, the predictive results of the two QNL models exhibit a consistent trend across the seven geological environmental zones. Specifically, in the Northeast Plain and Mountainous Geological Environment Zone (I), the Yangtze River Delta Region (II), the Northwest Arid Desert Geological Environment Zone (VI), and the Qinghai-Tibet Plateau Region (VII), non-landslide-prone areas account for over 70% of the entire region, indicating that the majority of these areas are characterized as non-landslide-prone. In contrast, the South China Region (III), Loess Plateau Region (IV), and Southwest Region (V) have non-landslide-prone areas constituting approximately 30% of the total area, representing high landslide-prone regions such as Yunnan, Sichuan, Gansu, Shaanxi, and Taiwan in China.
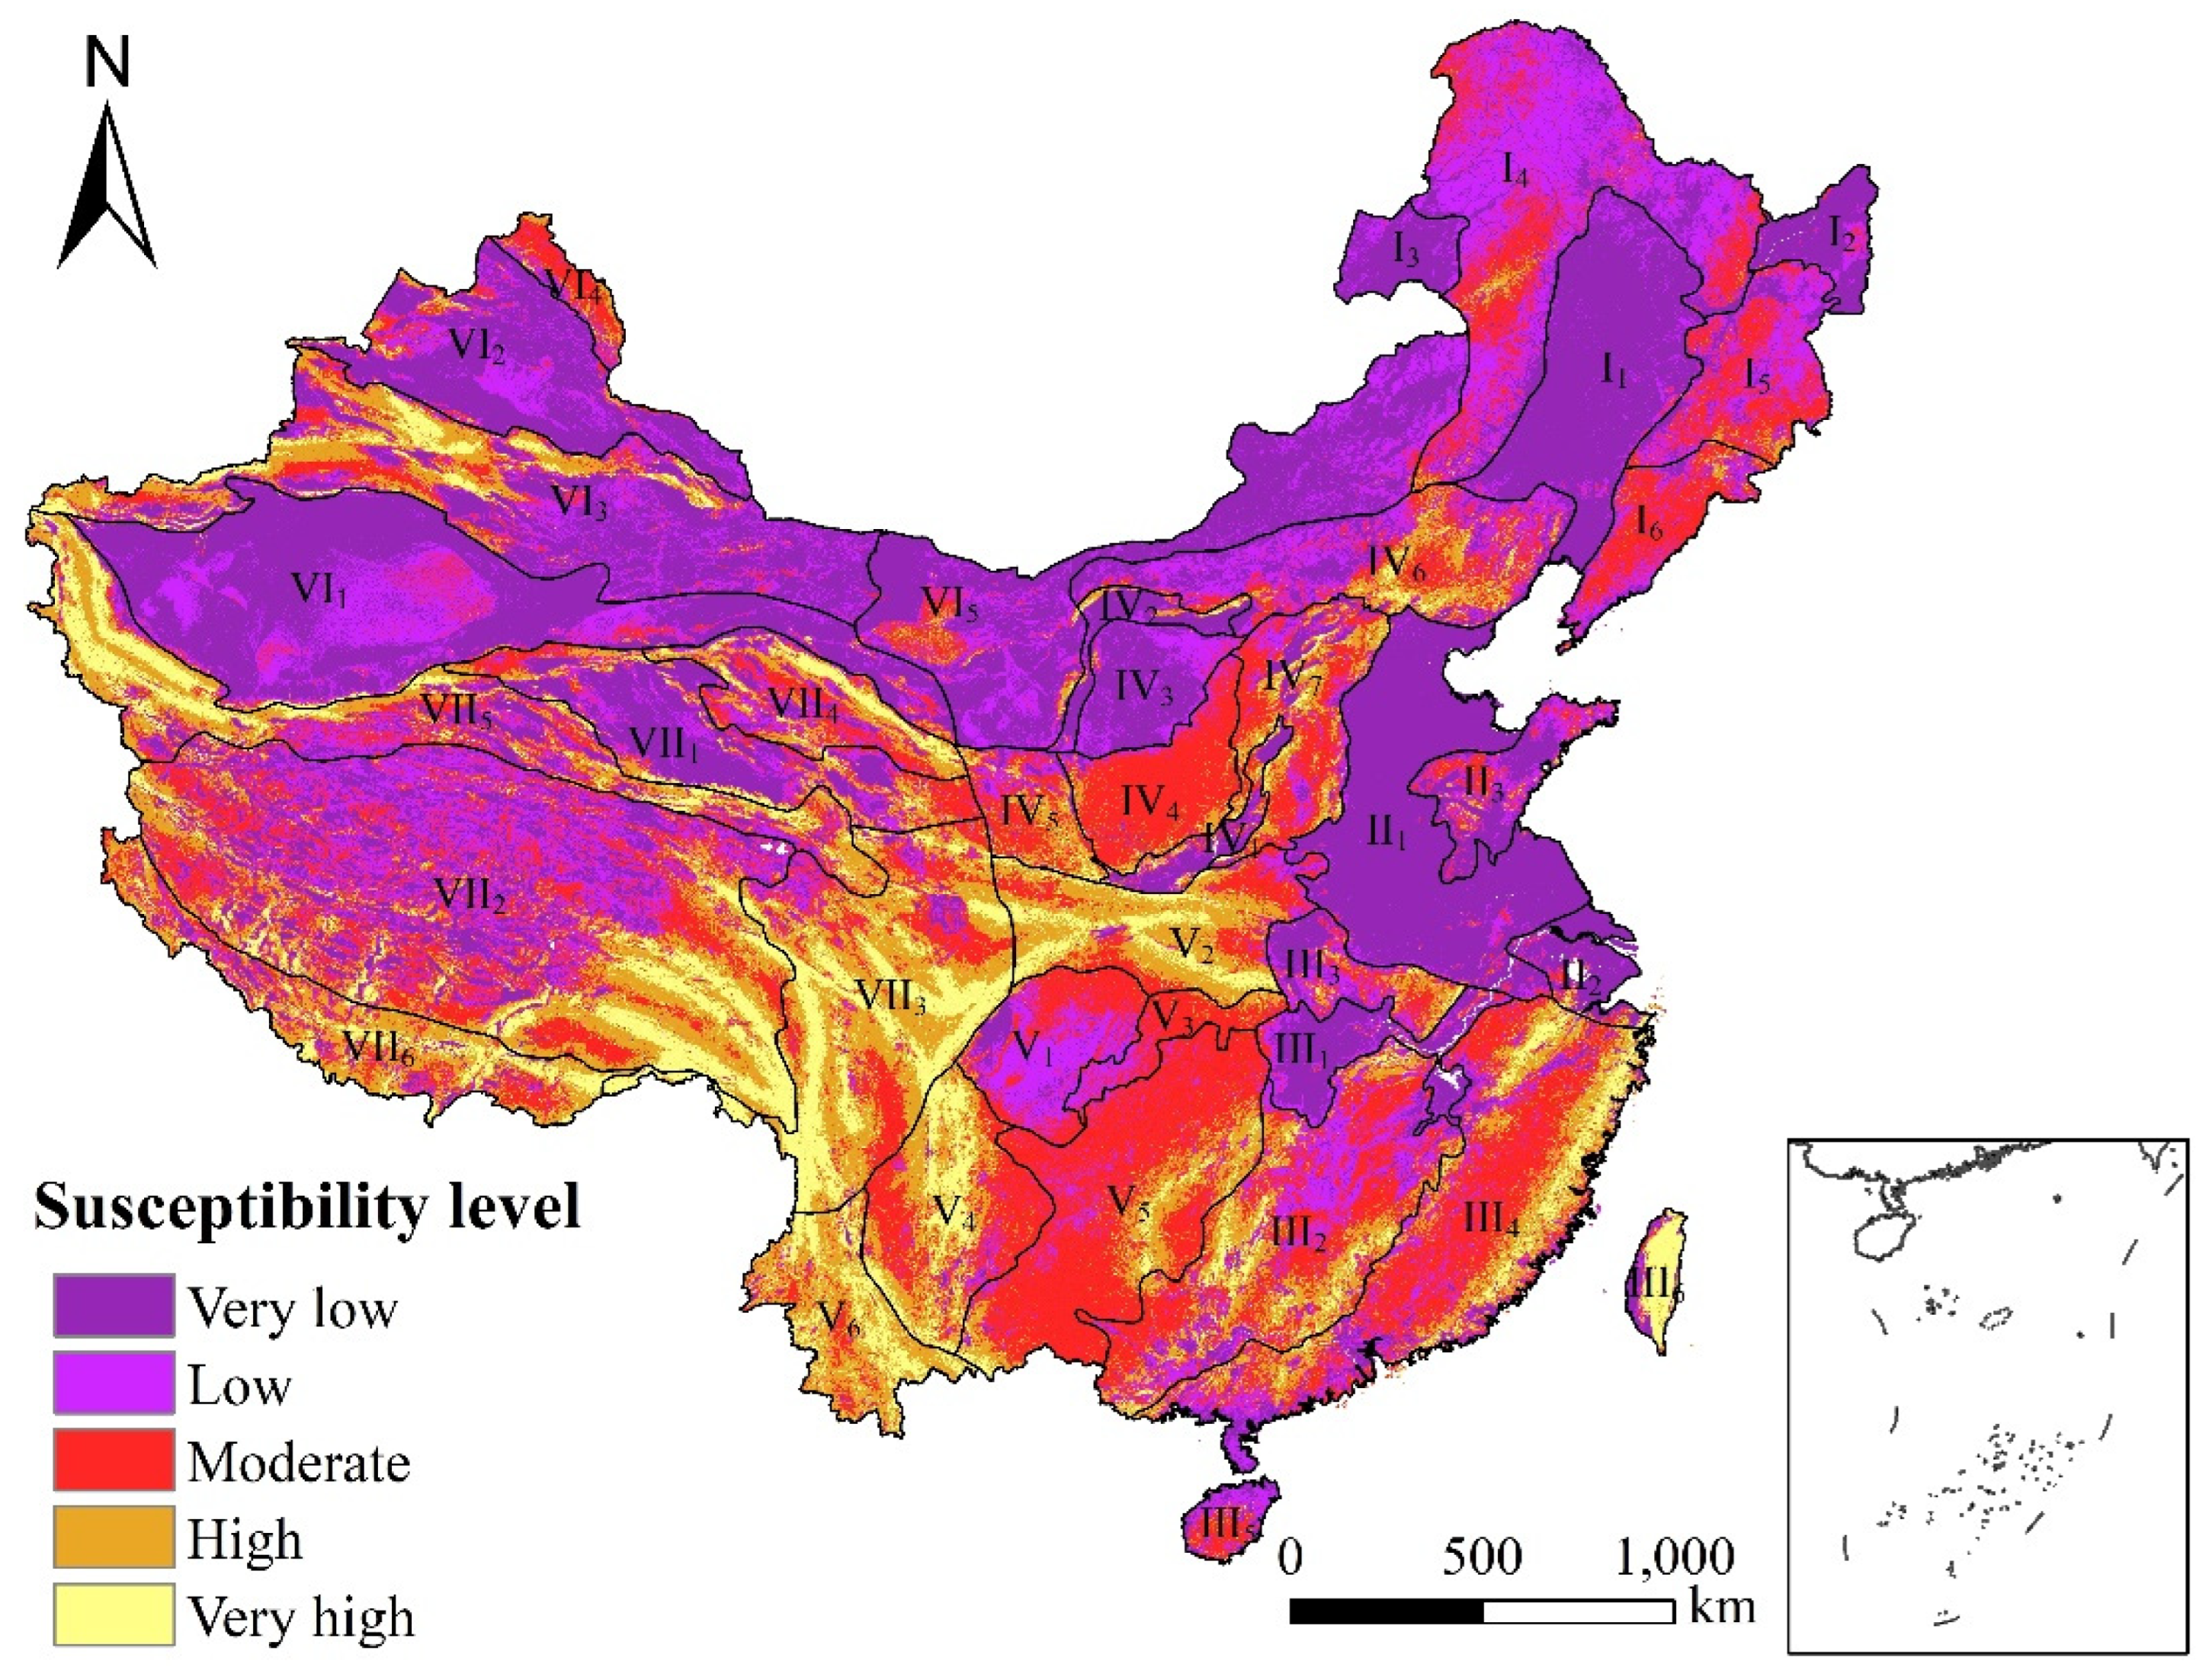
Due to the lack of comprehensive landslide records in China, we are unable to validate the prediction results of the two QNL models. Therefore, we have opted to compare the accuracy of the prediction results of the two QNL models with a new global susceptibility map calculated using global landslide data and a heuristic fuzzy approach. The National Aeronautics and Space Administration (NASA) launched the Global Landslide Catalog (GLC), in which records are available with occurrence dates and locations, types, triggers, and estimates of location accuracy since 2007. Stanley et al. [37] established a global landslide susceptibility model based on a global landslide database and fuzzy algorithm, presenting a global-scale susceptibility distribution map at a resolution of 1 km. The data pertaining to slope, faults, geology, forest loss, and road networks were amalgamated utilizing a heuristic fuzzy approach [37]. The resulting map underwent evaluation utilizing the Global Landslide Catalog (GLC) developed by the National Aeronautics and Space Administration (NASA) alongside several local landslide inventories. The fuzzy overlay model integrated data on the topographic index, faults, forests, and roads utilizing a fuzzy gamma operator, where the coefficient (c) was set at 0.9 [37]. The application of fuzzy logic within a Geographic Information System (GIS) entails two distinct steps. Firstly, a fuzzy membership function is assigned to each variable. This function serves to transform the values of the explanatory variable into a range between zero and one, reflecting the relationship between the variable and landslide susceptibility. To facilitate the interpretation of the global landslide susceptibility map, the susceptibility values outputted using the fuzzy overlay model were categorized into five classes: very low, low, moderate, high, and very high.
Figure 9 illustrates the landslide susceptibility distribution map for the Chinese region generated using this model. To facilitate comparison with the QNL model mentioned earlier, we designated areas with low and very low susceptibility levels as non-landslide-prone zones, as depicted in Figure 10. The comparison reveals a broad agreement between the susceptibility zoning results of this model and the non-landslide-prone zones based on landslide data from the East Asia region. However, local discrepancies are evident, particularly in regions such as parts of Sichuan and Yunnan provinces, Xinjiang, the Daxing’anling area, and Taiwan. Notably, the entire Sichuan and Yunnan region, including the geological subzones of the Western Sichuan-Tibetan Plateau (VII3), the Mountainous Geological Environment Subzone of Central-Southwestern Sichuan Plateau (V4), and the Central Geological Environment Subzone of Western Yunnan (V6), is predominantly identified as landslide-prone. Simultaneously, the central-eastern part of Taiwan (III6), located in the Central Mountain Range, is also classified as landslide-prone area. In contrast, the susceptibility zoning based on East Asia landslide data tends to underestimate the susceptibility of these regions to some extent.
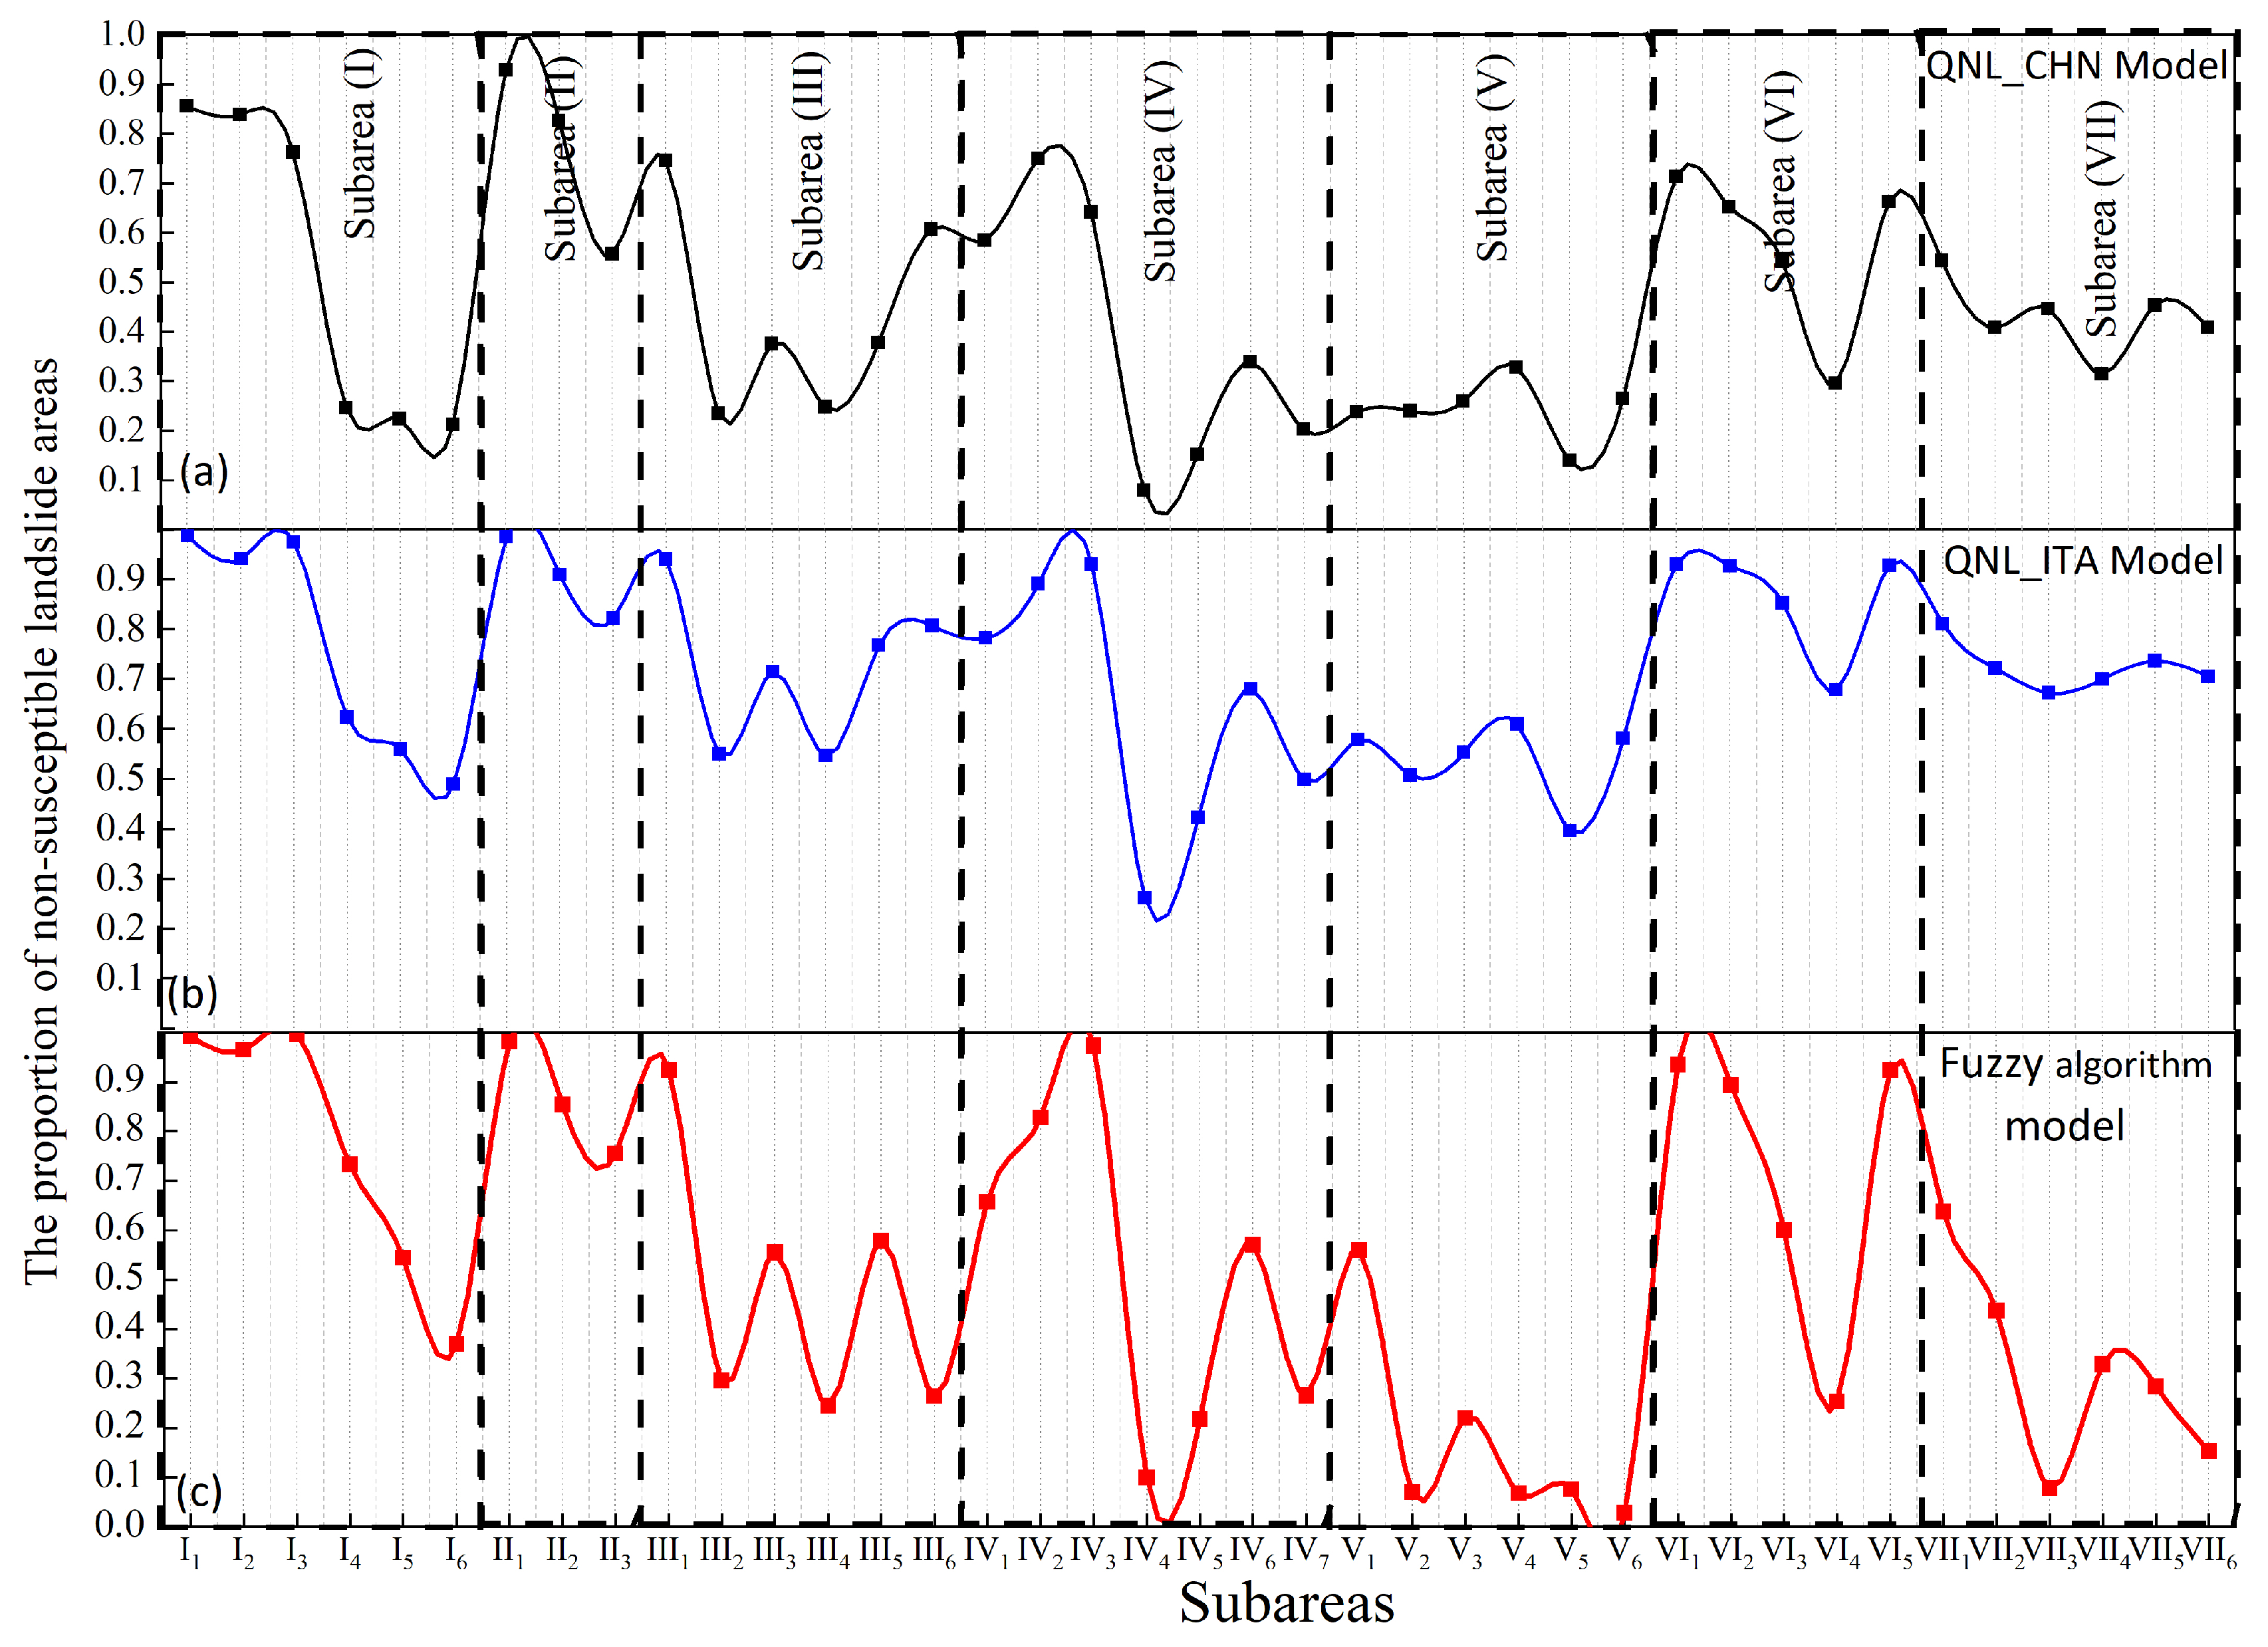
Godt et al. [33] emphasized that landslide spatial modeling based on terrain features complements and verifies traditional susceptibility analysis, enhancing understanding of the true distribution of landslide disasters. We conducted a statistical analysis of the non-landslide area proportions for three models across 39 geological environment subregions (Figure 11). While the overall distributions of the predictions from the two models align reasonably well with the potential landslide hazard zone, significant discrepancies persist in localized regions. For instance, in the Longmenshan tectonic zone of the Sichuan-Yunnan region, categorized under the geological environment subregion VII3 of the Western Sichuan-Eastern Tibetan Plateau, which is a high susceptibility zone for landslides, the QNL model designates it as a non-landslide susceptible area. The non-landslide susceptible areas predicted through the QNL model are 44.6% and 67.1%, while those obtained through statistical analysis are only 7.8%. Additionally, in the karst mountainous geological environment subregion (V) in the southwest, the fuzzy logic model consistently predicts non-landslide susceptibility areas at less than 15%, whereas the QNL_CHN model predicts proportions above 20%, and the QNL_ITA model yields significantly higher values, with most non-landslide susceptible areas exceeding 50%. Furthermore, in the Xianggan Gui Low Mountain and Hilly Geological Environment Subregion (III2) and the southeastern Hilly Mountain Geological Environment Subregion (III4), all three models exhibit noticeable deviations. In the rainy season, this area is a potential high susceptibility zone for landslides. Based on the fuzzy logic model and QNL_CHN model predictions, non-landslide susceptibility areas account for approximately 25%, while the QNL_ITA model estimates reach 50%, indicating a clear underestimation of landslide susceptibility through the QNL_ITA model. From the three models’ results, it can be observed that the non-susceptible landslide areas predicted via the QNL_CHN model and those derived from the fuzzy logic-based model are more consistent. In contrast, the QNL_ITA model, although exhibiting overall accurate predictions in non-susceptible landslide areas, demonstrates significant disparities in spatial distribution and subregional proportions compared to the actual conditions. Comparatively, within the QNL models, the QNL_CHN model demonstrates more accurate predictions of non-susceptible landslide areas within the China region.

5. Discussion

Accurate and comprehensive landslide records serve as the foundation for landslide simulation and assessment [46,47,48]. On the one hand, the spatial distribution of historical landslide data can reveal high-frequency/hotspot areas of landslide occurrences. On the other hand, historical landslide data can be utilized to fit and validate assessment models, thereby enhancing model applicability. The Global Landslide Catalog (GLC) has compiled main rainfall-induced landslide events worldwide since 2007, providing extensive information, including landslide occurrence time, location, fatalities, affected population, economic losses, landslide types, scale, and triggering factors. Both the QNL_CHN model and the fuzzy logic-based model are trained based on the GLC, utilizing consistent fundamental landslide data. However, they differ in the factors considered to be influencing. The QNL_CHN model only considers topographic relief and slope angle, the two most direct factors influencing landslide occurrence. In contrast, the fuzzy logic model considers additional factors such as faults, geology, forest loss, and road networks. The QNL_ITA model is developed based on 13 regional geomorphological, event, and multi-temporal inventory maps to fit non-susceptibility landslide models for Italy [34]. From the results of the three models, overall, the QNL_CHN model and the fuzzy logic-based model yield more consistent results in predicting non-susceptible landslide-prone areas (Table S1). However, the QNL_ITA model shows differences in the proportion of predicted non-susceptible areas for 39 subregions compared to the previous two models. We attribute this phenomenon mainly to the differences in the landslide data used during model fitting. As the likelihood of landslides occurring in a spatial region primarily depends on local geographic environmental conditions, the main influencing factors controlling landslide occurrence vary significantly across different regions, leading to differences in fitted model parameters [31,35]. Despite the differences in methods between the QNL_CHN model and the fuzzy logic-based model, their predicted results are closer, reflecting that landslide data, rather than the models themselves, are the primary determinant of predictive model accuracy. However, the landslide records in this database mainly rely on textual information channels such as relevant disaster reports and news, resulting in recorded landslide events mainly being catastrophic landslides while often neglecting other unrecorded landslide events. Additionally, this landslide database mainly consists of point data, with some datasets estimating the spatial range of landslide points based on the radius of administrative regions, leading to errors in the positional accuracy of some landslide geographical coordinate information. Therefore, in future research, constructing a complete and accurate regional landslide database is crucial for establishing accurate landslide susceptibility assessment models. However, the continuous iteration and optimization of assessment models may have a limited impact on improving model accuracy.
Both Godt et al. [33] and Marchesini et al. [34] assumed terrain slope and relief as key variables for selecting landslide non-susceptible locations at the pixel level. The key assumption of non-susceptibility analyses is that flat, low-relief regions are not prone to landslides, which is supported by the fact that topography is the main influencing factor in landslide susceptibility analysis. This method stands out for its simplicity, linking landslide susceptibility directly to terrain features, making the analysis more intuitive and practical. Selecting terrain slope and relief as key variables acknowledges the impact of natural topography on landslide risk, providing robust support for landslide risk assessment. Moreover, conducting analyses at the pixel level helps refine the study area at the spatial scale, enhancing analysis precision. However, this approach comes with certain potential limitations. Firstly, it overlooks other factors that could influence landslide occurrence, such as soil type, vegetation cover, human activities, and more. Secondly, its adaptability to climate change is limited, as shifting climate conditions may render past terrain features less accurate in reflecting landslide susceptibility. Additionally, terrain alone represents just one aspect of landslide susceptibility, and considering a broader range of factors may improve the predictive accuracy of the model. Therefore, when applying this method, it is essential to carefully balance its advantages and limitations, considering the introduction of additional factors for a more comprehensive landslide risk assessment. Such a comprehensive analysis contributes to a better understanding of landslide characteristics in non-susceptible areas, enhancing predictive accuracy and practical utility.

6. Conclusions

In conclusion, our study delves into the applicability and performance of the QNL model in landslide susceptibility assessment across various geological environments in China. By comparing QNL model outcomes utilizing landslide databases from Italy and East Asia, we unveil significant disparities in fitted curves and predicted slopes. Specifically, the East Asian model delineates smaller non-susceptible areas and larger landslide-prone areas compared to the Italian model, with notable variations observed across different geological zones. While broad alignment is evident, localized disparities persist, particularly in regions such as parts of Sichuan, Xinjiang, Daxing’anling, and Taiwan in different assessment models (QNL and fuzzy algorithm model). Otherwise, despite the overall agreement with observed landslide spatial distribution, significant discrepancies were noted in specific regions such as the Longmen Mountain Tectonic Zone of the Sichuan-Yunnan region, the Southwest Karst Mountain Geological Environment Zone, and the Southeast Hilly Mountain Geological Environment Zone. These discrepancies highlight the need for cautious interpretation of model outputs and the incorporation of additional factors such as soil type, vegetation cover, and human activities influencing landslides for enhanced predictive accuracy.
Within the QNL models, the QNL_CHN model demonstrates more accurate predictions of non-susceptible landslide areas within the China region compared with the QNL_ITA model. We attribute this phenomenon mainly to the differences in the landslide data used during model fitting. Therefore, in future research, constructing a complete and accurate regional landslide database is crucial for establishing a reliable susceptibility assessment model. Our study contributes valuable insights into landslide susceptibility modeling, emphasizing the intricate relationship between geological factors and model outcomes. These insights are vital for forest protection, guiding risk assessment, ecosystem management, vegetation restoration, water resource conservation, and public safety measures, ensuring informed decision-making and proactive interventions in landslide-prone areas.

Supplementary Materials

The following supporting information can be downloaded at https://www.mdpi.com/article/10.3390/f15040678/s1, Table S1: The proportion of non-susceptible landslide areas in different geological environment sub-regions.

Author Contributions

The research concept originated from C.X. and S.M., who additionally played a role in analyzing the data and was responsible for designing the research framework. S.M. processing relevant data, and drafting the manuscript. X.S. actively engaged in data analysis and made significant contributions to the manuscript revisions. X.S. and C.X. played a role in curating and analyzing the data. All authors have read and agreed to the published version of the manuscript.

Funding

This study was supported by the National Key Research and Development Program of China (2021YFB3901205).

Data Availability Statement

The data presented in this study are available on request from the corresponding author. The data are not publicly available due to the privacy of the participants.

Conflicts of Interest

The authors declare that they have no known competing financial interests or personal relationships that could have appeared to influence the work reported in this paper.

References

  1. Froude, M.J.; Petley, D.N. Global fatal landslide occurrence from 2004 to 2016. Nat. Hazards Earth Syst. Sci. 2018, 18, 2161–2181. [Google Scholar] [CrossRef]
  2. Lin, Q.; Wang, Y. Spatial and temporal analysis of a fatal landslide inventory in China from 1950 to 2016. Landslides 2018, 15, 2357–2372. [Google Scholar] [CrossRef]
  3. Petley, D. Global patterns of loss of life from landslides. Geology 2012, 40, 927–930. [Google Scholar] [CrossRef]
  4. Xue, Z.; Xu, C.; Gao, H.; Huang, Y. Disaster chain thinking improves the capabilities of disaster prevention, mitigation, and relief in China. Nat. Hazards Res. 2023. [Google Scholar] [CrossRef]
  5. Xue, Z.; Xu, C.; Xu, X. Application of ChatGPT in natural disaster prevention and reduction. Nat. Hazards Res. 2023, 3, 556–562. [Google Scholar] [CrossRef]
  6. National Bureau of Statistics of China. China Statistical Yearbook in 2018; China Statistics Press: Beijing, China, 2018.
  7. Fell, R.; Corominas, J.; Bonnard, C.; Cascini, L.; Leroi, E.; Savage, W.Z. Guidelines for landslide susceptibility, hazard and risk zoning for land use planning. Eng. Geol. 2008, 102, 85–98. [Google Scholar] [CrossRef]
  8. Guzzetti, F.; Reichenbach, P.; Ardizzone, F.; Cardinali, M.; Galli, M. Estimating the quality of landslide susceptibility models. Geomorphology 2006, 81, 166–184. [Google Scholar] [CrossRef]
  9. Van Westen, C.J.; Castellanos, E.; Kuriakose, S.L. Spatial data for landslide susceptibility, hazard, and vulnerability assessment: An overview. Eng. Geol. 2008, 102, 112–131. [Google Scholar] [CrossRef]
  10. Shao, X.; Xu, C. Earthquake-induced landslides susceptibility assessment: A review of the state-of-the-art. Nat. Hazards Res. 2022, 2, 172–182. [Google Scholar] [CrossRef]
  11. Yang, Z.; Xu, C.; Li, L. Landslide Detection Based on ResU-Net with Transformer and CBAM Embedded: Two Examples with Geologically Different Environments. Remote Sens. 2022, 14, 2885. [Google Scholar] [CrossRef]
  12. Huang, F.; Yan, J.; Fan, X.; Yao, C.; Huang, J.; Chen, W.; Hong, H. Uncertainty pattern in landslide susceptibility prediction modelling: Effects of different landslide boundaries and spatial shape expressions. Geosci. Front. 2022, 13, 101317. [Google Scholar] [CrossRef]
  13. Dai, F.; Lee, C. Landslide characteristics and slope instability modeling using GIS, Lantau Island, Hong Kong. Geomorphology 2002, 42, 213–228. [Google Scholar] [CrossRef]
  14. Allstadt, K.E.; Jibson, R.W.; Thompson, E.M.; Massey, C.I.; Wald, D.J.; Godt, J.W.; Rengers, F.K. Improving near-real-time coseismic landslide models: Lessons learned from the 2016 Kaikōura, New Zealand, earthquake. Bull. Seismol. Soc. Am. 2018, 108, 1649–1664. [Google Scholar] [CrossRef]
  15. Bălteanu, D.; Micu, M.; Jurchescu, M.; Malet, J.-P.; Sima, M.; Kucsicsa, G.; Dumitrică, C.; Petrea, D.; Mărgărint, M.C.; Bilaşco, Ş. National-scale landslide susceptibility map of Romania in a European methodological framework. Geomorphology 2020, 371, 107432. [Google Scholar] [CrossRef]
  16. Cao, J.; Zhang, Z.; Wang, C.; Liu, J.; Zhang, L. Susceptibility assessment of landslides triggered by earthquakes in the Western Sichuan Plateau. Catena 2019, 175, 63–76. [Google Scholar] [CrossRef]
  17. Shao, X.; Xu, C.; Ma, S.; Xu, X.; Shyu, J.B.H.; Zhou, Q. Calculation of landslide occurrence probability in Taiwan region under different ground motion conditions. J. Mt. Sci. 2021, 18, 1003–1012. [Google Scholar] [CrossRef]
  18. Broeckx, J.; Vanmaercke, M.; Duchateau, R.; Poesen, J. A data-based landslide susceptibility map of Africa. Earth-Sci. Rev. 2018, 185, 102–121. [Google Scholar] [CrossRef]
  19. Kirschbaum, D.; Stanley, T. Satellite-based assessment of rainfall-triggered landslide hazard for situational awareness. Earth’s Future 2018, 6, 505–523. [Google Scholar] [CrossRef] [PubMed]
  20. Nowicki Jessee, M.A.; Hamburger, M.W.; Allstadt, K.; Wald, D.J.; Robeson, S.M.; Tanyas, H.; Hearne, M.; Thompson, E.M. A global empirical model for near-real-time assessment of seismically induced landslides. J. Geophys. Res. Earth Surf. 2019, 123, 1835–1859. [Google Scholar] [CrossRef]
  21. Tanyas, H.; Rossi, M.; Alvioli, M.; van Westen, C.J.; Marchesini, I. A global slope unit-based method for the near real-time prediction of earthquake-induced landslides. Geomorphology 2019, 327, 126–146. [Google Scholar] [CrossRef]
  22. Kavzoglu, T.; Sahin, E.K.; Colkesen, I. An assessment of multivariate and bivariate approaches in landslide susceptibility mapping: A case study of Duzkoy district. Nat. Hazards 2015, 76, 471–496. [Google Scholar] [CrossRef]
  23. Shao, X.; Xu, C.; Ma, S.; Zhou, Q. Effects of Seismogenic Faults on the Predictive Mapping of Probability to Earthquake-Triggered Landslides. ISPRS Int. J. Geo-Inf. 2019, 8, 328. [Google Scholar] [CrossRef]
  24. Shao, X.; Ma, S.; Xu, C.; Xu, X. Effects of raster resolution on real probability of landslides. Remote Sens. Appl. Soc. Environ. 2020, 19, 100364. [Google Scholar] [CrossRef]
  25. Tanyu, B.F.; Abbaspour, A.; Alimohammadlou, Y.; Tecuci, G. Landslide susceptibility analyses using Random Forest, C4. 5, and C5. 0 with balanced and unbalanced datasets. Catena 2021, 203, 105355. [Google Scholar] [CrossRef]
  26. Wang, Y.; Fang, Z.; Hong, H. Comparison of convolutional neural networks for landslide susceptibility mapping in Yanshan County, China. Sci. Total Environ. 2019, 666, 975–993. [Google Scholar] [CrossRef]
  27. Xu, C.; Xu, X.; Dai, F.; Saraf, A.K. Comparison of different models for susceptibility mapping of earthquake triggered landslides related with the 2008 Wenchuan earthquake in China. Comput. Geosci. 2012, 46, 317–329. [Google Scholar] [CrossRef]
  28. Arabameri, A.; Chandra Pal, S.; Rezaie, F.; Chakrabortty, R.; Saha, A.; Blaschke, T.; Di Napoli, M.; Ghorbanzadeh, O.; Thi Ngo, P.T. Decision tree based ensemble machine learning approaches for landslide susceptibility mapping. Geocarto Int. 2022, 37, 4594–4627. [Google Scholar] [CrossRef]
  29. Hong, H.; Pradhan, B.; Xu, C.; Bui, D.T. Spatial prediction of landslide hazard at the Yihuang area (China) using two-class kernel logistic regression, alternating decision tree and support vector machines. Catena 2015, 133, 266–281. [Google Scholar] [CrossRef]
  30. Merghadi, A.; Yunus, A.P.; Dou, J.; Whiteley, J.; Pham, B.T. Machine learning methods for landslide susceptibility studies: A comparative overview of algorithm performance. Earth-Sci. Rev. 2020, 207, 103225. [Google Scholar] [CrossRef]
  31. Reichenbach, P.; Rossi, M.; Malamud, B.D.; Mihir, M.; Guzzetti, F. A review of statistically-based landslide susceptibility models. Earth-Sci. Rev. 2018, 180, 60–91. [Google Scholar] [CrossRef]
  32. Lin, Q.; Lima, P.; Steger, S.; Glade, T.; Jiang, T.; Zhang, J.; Liu, T.; Wang, Y. National-scale data-driven rainfall induced landslide susceptibility mapping for China by accounting for incomplete landslide data. Geosci. Front. 2021, 12, 101248. [Google Scholar] [CrossRef]
  33. Godt, J.W.; Coe, J.; Baum, R.; Highland, L.; Keaton, J.; Roth, R., Jr.; Godt, J.; Coe, J.; Baum, R.; Highland, L.; et al. Prototype Landslide Hazard Map of the Conterminous United States, Landslides and Engineered Slopes: Protecting Society through Improved Understanding; Taylor & Francis Group: London, UK, 2012. [Google Scholar]
  34. Marchesini, I.; Ardizzone, F.; Alvioli, M.; Rossi, M.; Guzzetti, F. Non-susceptible landslide areas in Italy and in the Mediterranean region. Nat. Hazards Earth Syst. Sci. 2014, 14, 2215–2231. [Google Scholar] [CrossRef]
  35. Jia, G.; Alvioli, M.; Gariano, S.L.; Marchesini, I.; Guzzetti, F.; Tang, Q. A global landslide non-susceptibility map. Geomorphology 2021, 389, 107804. [Google Scholar] [CrossRef]
  36. Farahmand, A.; Aghakouchak, A. A satellite-based global landslide model. Nat. Hazards Earth Syst. Sci. 2013, 13, 1259–1267. [Google Scholar] [CrossRef]
  37. Stanley, T.; Kirschbaum, D.B. A heuristic approach to global landslide susceptibility mapping. Nat. Hazards 2017, 87, 145–164. [Google Scholar] [CrossRef]
  38. Zhao, B.; Su, L.; Xu, Q.; Li, W.; Xu, C.; Wang, Y. A review of recent earthquake-induced landslides on the Tibetan Plateau. Earth-Sci. Rev. 2023, 244, 104534. [Google Scholar] [CrossRef]
  39. Huang, Y.; Xu, C.; Zhang, X.; Li, L.; Xu, X. Research in the Field of Natural Hazards Based on Bibliometric Analysis. Nat. Hazards Rev. 2023, 24, 04023012. [Google Scholar] [CrossRef]
  40. Huang, Y.; Li, L.; Xu, C.; Cheng, J.; Xu, X.; Zheng, T.; Zhang, X. Spatiotemporal distribution patterns of deadly geohazard events in China, 2013–2019. Nat. Hazards Res. 2022, 2, 316–324. [Google Scholar] [CrossRef]
  41. Guzzetti, F.; Mondini, A.C.; Cardinali, M.; Fiorucci, F.; Santangelo, M.; Chang, K.-T. Landslide inventory maps: New tools for an old problem. Earth-Sci. Rev. 2012, 112, 42–66. [Google Scholar] [CrossRef]
  42. Trigila, A.; Iadanza, C.; Spizzichino, D. Quality assessment of the Italian Landslide Inventory using GIS processing. Landslides 2010, 7, 455–470. [Google Scholar] [CrossRef]
  43. Kirschbaum, D.; Adler, R.; Hong, Y.; Lerner-Lam, A. Evaluation of a preliminary satellite-based landslide hazard algorithm using global landslide inventories. Nat. Hazards Earth Syst. Sci. 2009, 9, 673–686. [Google Scholar] [CrossRef]
  44. Kirschbaum, D.B.; Adler, R.; Hong, Y.; Hill, S.; Lerner-Lam, A. A global landslide catalog for hazard applications: Method, results, and limitations. Nat. Hazards 2010, 52, 561–575. [Google Scholar] [CrossRef]
  45. Gao, M.; Li, R.; Xu, H.; Zeng, Q.; Wang, Y.; Jin, J.; Li, X.; Yin, M.; Zhang, X. Database of Geological Environmental Map System of China Based on MapGIS. Geol. China 2019, 46, 130–156. [Google Scholar]
  46. Wen, H.; Li, W.; Xu, C.; Daimaru, H. Landslides in Forests around the World: Causes and Mitigation. Forests 2023, 14, 629. [Google Scholar] [CrossRef]
  47. Nhu, V.-H.; Mohammadi, A.; Shahabi, H.; Ahmad, B.B.; Al-Ansari, N.; Shirzadi, A.; Geertsema, M.; Kress, V.R.; Karimzadeh, S.; Valizadeh Kamran, K.; et al. Landslide Detection and Susceptibility Modeling on Cameron Highlands (Malaysia): A Comparison between Random Forest, Logistic Regression and Logistic Model Tree Algorithms. Forests 2020, 11, 830. [Google Scholar] [CrossRef]
  48. Tien Bui, D.; Shirzadi, A.; Shahabi, H.; Geertsema, M.; Omidvar, E.; Clague, J.J.; Thai Pham, B.; Dou, J.; Talebpour Asl, D.; Bin Ahmad, B.; et al. New Ensemble Models for Shallow Landslide Susceptibility Modeling in a Semi-Arid Watershed. Forests 2019, 10, 743. [Google Scholar] [CrossRef]
Figure 1. Geomorphological and geological environment regions of China (The blue Roman numerals represent seven geological environmental zones, and the black Roman numerals represent thirty-nine secondary geological environmental zones).
Forests 15 00678 g001
Figure 2. Map showing the distribution of slope angle in China; Arabic numerals represent different subareas of the geological environmental zone.
Forests 15 00678 g002
Figure 3. Map showing the distribution of topographic relief map in China; Arabic numerals represent different subareas of the geological environmental zone.
Forests 15 00678 g003
Figure 4. Average topographic relief, slope angle, and area of 39 geological environmental subzones. Colors represent the susceptibility levels of geological hazards in each subzone; Green indicates low Susceptibility, yellow indicates moderate Susceptibility, and red indicates high susceptibility. Arabic numerals represent different subareas of the geological environmental zone.
Forests 15 00678 g004
Figure 5. Map showing the average topographic relief and slope angle for 39 geological environmental subzones, along with corresponding QNL models.
Forests 15 00678 g005
Figure 6. A Chinese landslide non-susceptibility map based on the QNL model (based on local Chinese landslide data); Arabic numerals represent different subareas of the geological environmental zone.
Forests 15 00678 g006
Figure 7. A Chinese landslide non-susceptibility map based on the QNL model (Based on Italian Landslide Data); Arabic numerals represent different subareas of the geological environmental zone.
Forests 15 00678 g007
Figure 8. Statistical results of non-landslide susceptibility area percentage in seven geological environmental zones obtained from two QNL models.
Forests 15 00678 g008
Figure 9. Chinese landslide susceptibility level map based on the fuzzy algorithm model proposed by Stanley et al. [37].
Forests 15 00678 g009
Figure 10. Chinese landslide non-susceptibility map based on the fuzzy algorithm model proposed by Stanley et al. [37].
Forests 15 00678 g010
Figure 11. Percentage of non-landslide susceptibility in different geological environmental zones calculated using different models. (a) The statistical results of QNL_CHN model; (b) QNL_ITA model; (c) The statistical results of the fuzzy algorithm model.
Forests 15 00678 g011
Disclaimer/Publisher’s Note: The statements, opinions and data contained in all publications are solely those of the individual author(s) and contributor(s) and not of MDPI and/or the editor(s). MDPI and/or the editor(s) disclaim responsibility for any injury to people or property resulting from any ideas, methods, instructions or products referred to in the content.

