Article

Light Intensity: A Key Ecological Factor in Determining the Growth of Pseudolarix amabilis Seedlings

1
Key Laboratory of State Forestry Administration on Forest Ecosystem Protection and Restoration of Poyang Lake Watershed, College of Forestry, Jiangxi Agricultural University, Nanchang 330045, China
2
Jiangxi Key Laboratory of Subtropical Forest Resources Cultivation, College of Forestry, Jiangxi Agricultural University, Nanchang 330045, China
3
Xishuangbanna Tropical Botanical Garden, Chinese Academy of Sciences (CAS), Menglun 666303, China
4
Research Center of Forestry Remote Sensing & Information Engineering, Central South University of Forestry & Technology, Changsha 410004, China
*
Author to whom correspondence should be addressed.
These authors contributed equally to this work.
Forests 2024, 15(4), 684; https://doi.org/10.3390/f15040684
Submission received: 11 March 2024 / Revised: 4 April 2024 / Accepted: 5 April 2024 / Published: 10 April 2024
(This article belongs to the Special Issue Seedling Management in Temperate Forest Ecosystems)

Abstract

:
The notable absence of juvenile Pseudolarix amabilis trees in forest understories suggests their vulnerability to ecological niche competition, leading to limited survival prospects. This study examines the key factors limiting the growth of P. amabilis seedlings by investigating the effects of five ecological factors: light intensity, rainfall, groundwater level, soil type, and type of fertilization, on the growth of one-year-old P. amabilis seedlings. Our results demonstrate that increasing the light intensity promotes plant growth by augmenting the leaf count, leaf biomass, plant height, stem biomass, root biomass, and total biomass. Further analysis reveals that increased light intensity influences biomass allocation, reducing the specific leaf area and leaf–stem biomass ratio, and favoring root and stem growth over leaf investment. Rainfall, groundwater level, fertilization type, and rhizosphere soil type primarily influence root growth by impacting the soil’s physicochemical properties. Specifically, rising groundwater levels lower the soil temperature and increase the soil moisture, total potassium content, and soil pH, leading to reductions in root biomass, plant height, net height increment, leaf number, and total biomass. When groundwater levels reach 21 cm and 28 cm, submerging the surface soil layer, root biomass decreases by 1.6 g/plant (−51.6%) and 2.3 g/plant (−74.2%), respectively. Further analysis reveals a gradual decrease in the root–shoot ratio above the 14 cm groundwater level, while the specific leaf area and leaf–stem biomass ratio remains unaffected, indicating stronger belowground root stress compared to aboveground stem and leaf components. The results highlight light intensity as the key ecological factor determining the growth of P. amabilis seedlings. These findings underscore the importance of considering light intensity in the management of natural stands, the cultivation of artificial forests, and the nursery cultivation of endangered P. amabilis.

1. Introduction

The capacity of seedlings to mature into full-grown trees plays a crucial role in shaping a species’s ecological niche within an ecosystem, thereby exerting a direct influence on the trajectory of community succession [1,2]. The process of seedlings transitioning into adult plants necessitates adaptation to the continuously evolving ecological environment, where a myriad of both biotic and abiotic factors exerts short-term influences on seedling growth processes [3,4]. Additionally, these factors have enduring effects on the spatial distribution patterns of these seedlings [5].
In both natural forests and cultivated woodlands, the distinctive conditions of light and nutrient availability in the forest understory play a determining role in the growth, survival, and competition of seedlings, thereby steering the processes of forest regeneration and succession [5,6]. Previous studies have shown that modifications in canopy openings can influence the light conditions for seedlings [7,8]. Concurrently, variations in soil moisture dynamics resulting from throughfall and soil water evaporation [9], along with the decomposition of deceased trees, can alter soil nutrient availability [10]. These factors influence seedling interactions with other plants [11], affecting growth and shaping post-disturbance forest regeneration and succession processes [12]. Understanding the growth and survival of plant seedlings amidst varying inorganic environmental factors like light, water, and nutrients, along with considering inter-individual interactions, is crucial for predicting forest recovery potential [13,14].
Pseudolarix amabilis (Nelson) Rehder, widely recognized as the golden larch, is a renowned ancient plant often referred to as a “living fossil”. Climatic fluctuations, particularly the onset of the Pleistocene glaciations, led to the extinction of P. amabilis populations in various regions, with surviving remnants confined to scattered areas in the middle and lower reaches of the Yangtze River in China [15]. Following the latest criteria established by the International Union for Conservation of Nature and the standards outlined in the China Plant Red Data Book, P. amabilis has been designated as a vulnerable species and is recognized as a second-level protected plant in China [16], with the core range being situated from 24. 43° N to 33.35° N and 106.41° E to 123.42° E [17]. Due to the sporadic distribution and scarcity of P. amabilis individuals, their intermittent fruiting, and the urgent necessity for conservation measures, P. amabilis faces pressing challenges [18]. In its natural habitat, P. amabilis primarily reproduces through seed propagation. Field observations reveal the emergence of numerous seedlings around mature mother trees. However, conspicuously absent is the sapling layer within the community, a pattern similarly observed in natural P. amabilis forests in Changxing, Zhejiang [19]. Recent research indicates that P. amabilis seedlings contend with a disadvantageous position in competition with other plants [18]. Plant seedling competition typically manifests as competition for aboveground light; belowground resources, including water and nutrients; and the ensuing interactions, such as mycorrhizal symbiosis, allelopathy, and predation [20,21,22]. These abiotic and biotic factors influencing the growth of P. amabilis seedlings may play a pivotal role in determining their success in natural populations and afforestation endeavors, including in fengshui forests. Nonetheless, research in this field is still in its early stages [18].
It is widely accepted that seedlings in an understory environment experience varying levels of shading, leading to reduced light availability that can potentially hinder photosynthesis and impede plant growth [23]. However, the degree of light reduction depends on the inherent sensitivity of each plant species to shading [24]. Pseudolarix amabilis, being a deciduous tree, is likely categorized as light-demanding and shade-intolerant, suggesting that its seedlings may necessitate full sunlight for successful self-renewal. Nonetheless, previous research based on physiological indicators of P. amabilis seedlings has suggested that moderate shading can enhance their growth, while both full sunlight and heavy shading have adverse effects [25]. However, the representativeness of single photosynthetic indicators may be limited, underscoring the need for additional experimental data for validation. Furthermore, variations in leaf characteristics and resource allocation strategies among plant species influence their ability to access aboveground resources (e.g., light and carbon dioxide) and belowground resources (e.g., nutrients and water) [26].
Earlier research has found that Pseudolarix amabilis seedlings are sensitive to drought and water scarcity, leading to significant mortality; similarly, in horticultural maintenance, waterlogging should be avoided [27]. Nevertheless, the mechanisms underpinning its sensitivity to both drought and waterlogging remain uncertain. Furthermore, the plant seedlings are exceptionally responsive to moisture conditions, and there is a paucity of quantitative studies regarding the impact of water availability on the growth of P. amabilis seedlings, particularly concerning multi-gradient water effects. In forest ecosystems, plant growth is frequently influenced by water availability, which is influenced by both top-down rainfall input and bottom-up subirrigation [28]. Therefore, it is necessary to investigate the impacts of multi-gradient simulated rainfall and bottom-up subirrigation on the growth of P. amabilis seedlings. However, there is limited research in this area.
The application of fertilizers can significantly influence plant growth by modifying the physical, chemical, and biological attributes of the soil. Although inorganic fertilizers can initially enhance nutrient availability and stimulate short-term plant growth [29], prolonged use may lead to nutrient leaching, soil acidification, and compaction [30,31,32]. Conversely, organic fertilizers offer a comprehensive and prolonged nutrient supply for both plants and microorganisms, thereby enhancing soil aeration [33]. However, they exhibit slower nutrient release kinetics compared to their inorganic counterparts. For example, cattle primarily consume high-fiber forage, resulting in excreta rich in plant fibers, which can alleviate soil compaction [34]. Nevertheless, organic fertilizers may not be as effective as rapeseed cake, a byproduct of oilseed crop oil extraction, renowned for its high protein content and nutrient richness [35]. Prior research has delineated diverse strategies employed by plants in nutrient absorption, allocation, and utilization, indicating their adaptation to resource variability [14,26]. Field observations reveal a phenomenon where numerous P. amabilis seedlings emerge, yet only a few successfully surmount growth limitations to develop into young P. amabilis trees. This phenomenon may be attributed to soil nutrient availability and physicochemical properties within the growth environment of P. amabilis seedlings [33]. Nevertheless, limited research addresses these inquiries, underscoring the need for further investigation via gradient experiments.
A substantial body of research attests to the establishment of a close symbiotic relationship between higher plants and specific fungi known as mycorrhiza [36,37]. These mycorrhizal associations manifest in diverse types, with the most prevalent being arbuscular mycorrhizae (AM) and ectomycorrhiza (ECM) [37,38]. Nonetheless, be it AM or ECM, under carbon-restricted conditions during plant growth, for instance, low light levels or high-fertility circumstances during seedling stages, mycorrhizal associations may adopt a parasitic role, resulting in compromised plant growth [39]. Hence, mycorrhizal associations can be understood as a dynamic equilibrium between parasitic and mutualistic states, regulated rigorously by both partners. P. amabilis, a species stemming from the ancient and diverse pine family, has traditionally been assumed to form specific mycorrhizal associations, positively impacting its viability and post-transplantation growth. Nevertheless, these qualitative speculations still await empirical substantiation, and the specific types of symbiotic fungi that may be involved remain elusive.
In this investigation, our focus was directed towards the primary ecological factors that exert substantial influence on the growth of P. amabilis seedlings: namely, light intensity, soil water availability, and soil nutrient availability. The ultimate objective of our findings is to provide a scientifically grounded foundation for the preservation and cultivation of P. amabilis seedlings.

2. Materials and Methods

2.1. Experimental Materials and Treatments

The study began in April 2021 and ended in October of the same year, conducted in a greenhouse affiliated with Jiangxi Agricultural University, located in Nanchang City, Jiangxi Province, China (115°49′31″ E, 28°45′41″ N). The site features a subtropical moist monsoon climate, with an average annual precipitation of approximately 1600 mm and an air temperature of 17.9 °C [40]. Our research entailed the deliberate selection of one-year-old P. amabilis seedlings. A six-month controlled cultivation trial was conducted indoors using potted seedlings to replicate a range of environmental conditions. A controlled-environment greenhouse, with a light intensity of 1014.9 ± 44.8 µmol m−2s−1 at midday, was utilized to maintain precise control over the rainfall, temperature, and light conditions in our study.
The soil employed in this study was obtained from nearby weathered or partially weathered yellow loam. The fundamental physicochemical properties of the soil were as follows: pH 5.86, total nitrogen content 0.78 g/kg, total phosphorus content 0.82 g/kg, total potassium content 16.19 g/kg, ammonium nitrogen content 0.32 mg/kg, nitrate nitrogen content 0.055 mg/kg, and inorganic nitrogen content 0.375 mg/kg. This particular variety of yellow loam displayed approximately 50% porosity and featured relatively limited root systems, pathogens, and insect eggs, while demonstrating moderate water and nutrient retention properties. The gathered soil was subjected to high-temperature exposure and sieving (2 mm) to ensure uniformity. In the soil mixing process, a 0.05%–0.1% potassium permanganate solution was applied for disinfection. The soil was then transferred to the pots, and both the pots and the soil surface were sterilized through spraying them with a potassium permanganate solution. After a 48 h settling period, the sterilization process was completed, enabling the transplantation of one-year-old P. amabilis seedlings. A total of 150 P. amabilis seedlings were meticulously selected from a nursery, established through self-seeding (comprising 50 experimental pots, each hosting 3 seedlings). The average plant initial height and initial ground diameter were recorded as 13.26 and 1.45 cm, respectively. Each experimental pot (the “inner pot” mentioned below), with a volume of approximately 0.017 cm3, had a cylindrical shape with a diameter of 27 cm and a height of 30 cm. The soil column depth was maintained at 28 cm. The bare-root transplantation process was executed meticulously, leaving no residual soil in the pots. Following transplantation, the pots were extensively watered until turbid water overflowed from the bottom, ensuring adequate root irrigation. Subsequently, watering was conducted on a weekly basis with a uniform and moderate water volume (1.65 L/week). In the case of any seedling mortality, prompt replacement with seedlings of comparable sizes was executed. Once all seedlings had reached a stable growth stage, typically around 30 days, an orthogonal experimental design was implemented.
The experimental design followed an orthogonal approach, specifically based on the L25(56) orthogonal array (Table 1). The experiment entailed the manipulation of five environmental factors: water addition (A, in mm), groundwater level (B, in cm), rhizosphere soil type (C), fertilizer type (D), and light intensity (E). A total of 50 subplots were established, comprising 25 experimental units (pots) arranged in accordance with the L25(56) orthogonal array, with each experimental configuration being replicated twice. For effective management, the orthogonal array was systematically sorted, and the fifth column (corresponding to the light intensity factor E) was arranged in ascending order to ensure the grouping of treatments with identical light intensities (Table 2). The spacing between pots within each zone was fixed at 20 cm, and the separation between adjacent zones was consistently maintained at 100 cm.
The water addition treatment A mimicked the natural rainfall input by applying the local annual average rainfall of 1600 mm/a as the control for both the drought (800 mm/a and 1200 mm/a) and wet treatments (2000 mm/a and 2400 mm/a), constituting five gradients of the water addition factor. This method ensured the precise control of water distribution. Based on local data spanning 2011 to 2020, the rainfall distribution followed a seasonal pattern, with spring (February to April), summer (May to July), autumn (August to October), and winter (November to January) contributing approximately 30%, 45%, 15%, and 10% of the total annual precipitation, respectively. Monthly targeted rainfall amounts were equally divided into four portions and applied weekly.
The “B” treatment simulated the bottom-up subirrigation effects, with the soil depth in the planting pot being set at 28 cm as the maximum groundwater level, divided into five gradients: 0 cm, 7 cm, 14 cm, 21 cm, and 28 cm from the bottom of the pot. To achieve these treatments, a larger pot (referred to as the outer pot) was placed around the pot containing the P. amabilis seedlings (referred to as the inner pot). The inner pot featured a 0.5 cm diameter hole at the bottom to facilitate water percolation, connecting it with the impermeable outer pot. Throughout the experiment, the researchers adjusted the groundwater level using the law of connected vessels by controlling the groundwater level in the outer pot.
The “C” treatment consisted of five levels: a control (sterilized river sand), rhizosphere soil of Pinus massoniana (a coniferous species), rhizosphere soil of Cinnamomum camphora (a broad-leaved species), rhizosphere soil of a mixed coniferous and broad-leaved forest, and rhizosphere soil of P. amabilis. Rhizosphere soil, characterized by the presence of white mycelium, was collected by gently shaking off soil particles randomly adhered to the root system. Once the survival of the transplanted P. amabilis seedlings was confirmed, the collected 500 g of soil was promptly applied to the surface soil.
The “D” treatment comprised five levels: a control (5 g sterilized river sand), sterilized and well-rotted cow manure (20 g), sterilized and well-rotted rapeseed cake (20 g), compound fertilizer (5 g) with a “17:17:17” ratio (total nutrients N + P2O5 + K2O ≧ 51%), and urea (5 g). All fertilizer treatments were evenly divided into two applications, applied to the soil surface on 1 June and 1 July in the evening. To prevent nutrient loss, the fertilizers were thoroughly mixed with the surface soil and covered with a thin layer of soil. However, to avoid root burn, the urea and compound fertilizers were not directly applied to the roots of the P. amabilis seedlings.
The “E” treatment employed varying shading net densities to control the light intensity reaching the leaf surface. The five levels encompassed 100% natural light (1021.8 + 58.8 µmol m−2s−1), 75% natural light (752.4 ± 28.8 µmol m−2s−1), 28% natural light (281.4 ± 14.6 µmol m−2s−1), 15% natural light (149.6 ± 9.4 µmol m−2s−1), and 8.5% natural light (85.6 ± 3.5 µmol m−2s−1).

2.2. Experimental Methods

2.2.1. Determination of Morphological Characteristics of P. amabilis Seedlings

The experiment encompassed 25 distinct treatment combinations, with each pot containing three robust and notably homogeneous one-year-old P. amabilis seedlings. Each treatment was duplicated (Table 2). After the transplanted seedlings attained had achieved stability in growth, we examined various morphological traits of the P. amabilis seedlings, encompassing plant height (H, cm), ground diameter (GD, mm), and leaf count (LC). H was measured using a steel tape measure, and the GD was determined using digital calipers. To calculate the net height increment (NH) of the plant, we subtracted the original height from the current height (H) of the plant.
Measurements were conducted on a monthly basis, spanning from May to September, with each measurement being taken around the middle of the respective month. Each pot was evaluated by measuring three seedlings, and the average values were employed to evaluate the growth status.

2.2.2. Determination of Biomass in P. amabilis Seedlings

In early October, we harvested both the aboveground and belowground sections of the P. amabilis seedlings. The aboveground components were clipped close to the soil surface using scissors, while the belowground parts were meticulously excavated using a small shovel to safeguard the integrity of the root system. Labeled samples were sealed in self-sealing bags and temporarily stored at −20 °C. In the laboratory, the leaves were further isolated from the stem, and the LC was documented. The envelopes underwent a drying process in an oven set at 70 °C for 48 h until reaching a constant weight.
The final weight, including stem biomass (SB, g), leaf biomass (LB, g), aboveground biomass (AB, g), root biomass (RB, g), and total biomass (TB, g), was determined and recorded as the dry weight. The respective indices were calculated using the raw experimental data and the following formulas:
AB (g) = SB + LB
TB (g) = SB + LB + RB

2.2.3. Determination of Soil Physical and Chemical Properties

In order to track changes in the soil nutrient levels, surface soil samples (0–10 cm) were collected from the pots at the conclusion of the experiment. These soil samples were meticulously sealed within self-sealing bags and subsequently transported to the laboratory. Following the removal of stones and debris using a 2 mm sieve, the soil samples were stored at −20 °C. The soil temperature and soil water content at 10 cm depth were recorded simultaneously in the field using a portable soil temperature and humidity recorder (JM624 digital thermometer), and the soil pH was measured using a pH meter with a water-to-soil ratio of 5:1 (FE20–FiveEasy). Nitrate nitrogen (NO3-N) levels in the soil were assessed using the dual-wavelength colorimetric method. Ammonium nitrogen (NH4+-N) was extracted from the soil using the indophenol blue colorimetric method (GENESYS 150). Soil total nitrogen (STN, g kg−1) was analyzed using the Kjeldahl digestion procedure [41]. Soil total phosphorus (STP, g kg−1) was determined through alkaline digestion followed by molybdate colorimetric measurements [42]. Soil total potassium (STK) was measured using the NaOH fusion method (NY/T87-1988). STN, STP, and STK were measured with a flow injection auto-analyzer (FIA, Lachat Instruments, Milwaukee, WI, USA).

2.3. Statistical Analysis

For the orthogonal experiment, an analysis of variance (ANOVA) was applied to evaluate significant differences among the various combinations of factor levels. Data normality was examined with the K-test, and distinctions between different levels of the same factor were determined using the least significant difference (LSD) method. Subsequently, a structural equation model (SEM) was constructed to identify the key factors influencing the total biomass of the P. amabilis seedlings and assess their individual impacts. Graphical representations and curve fitting were realized using SigmaPlot 12.5. The analysis of inter-group differences was carried out using SPSS 21.0 and AMOS 21.0 (SPSS 21.0 for Windows, SPSS Inc., Chicago, IL, USA).

3. Results

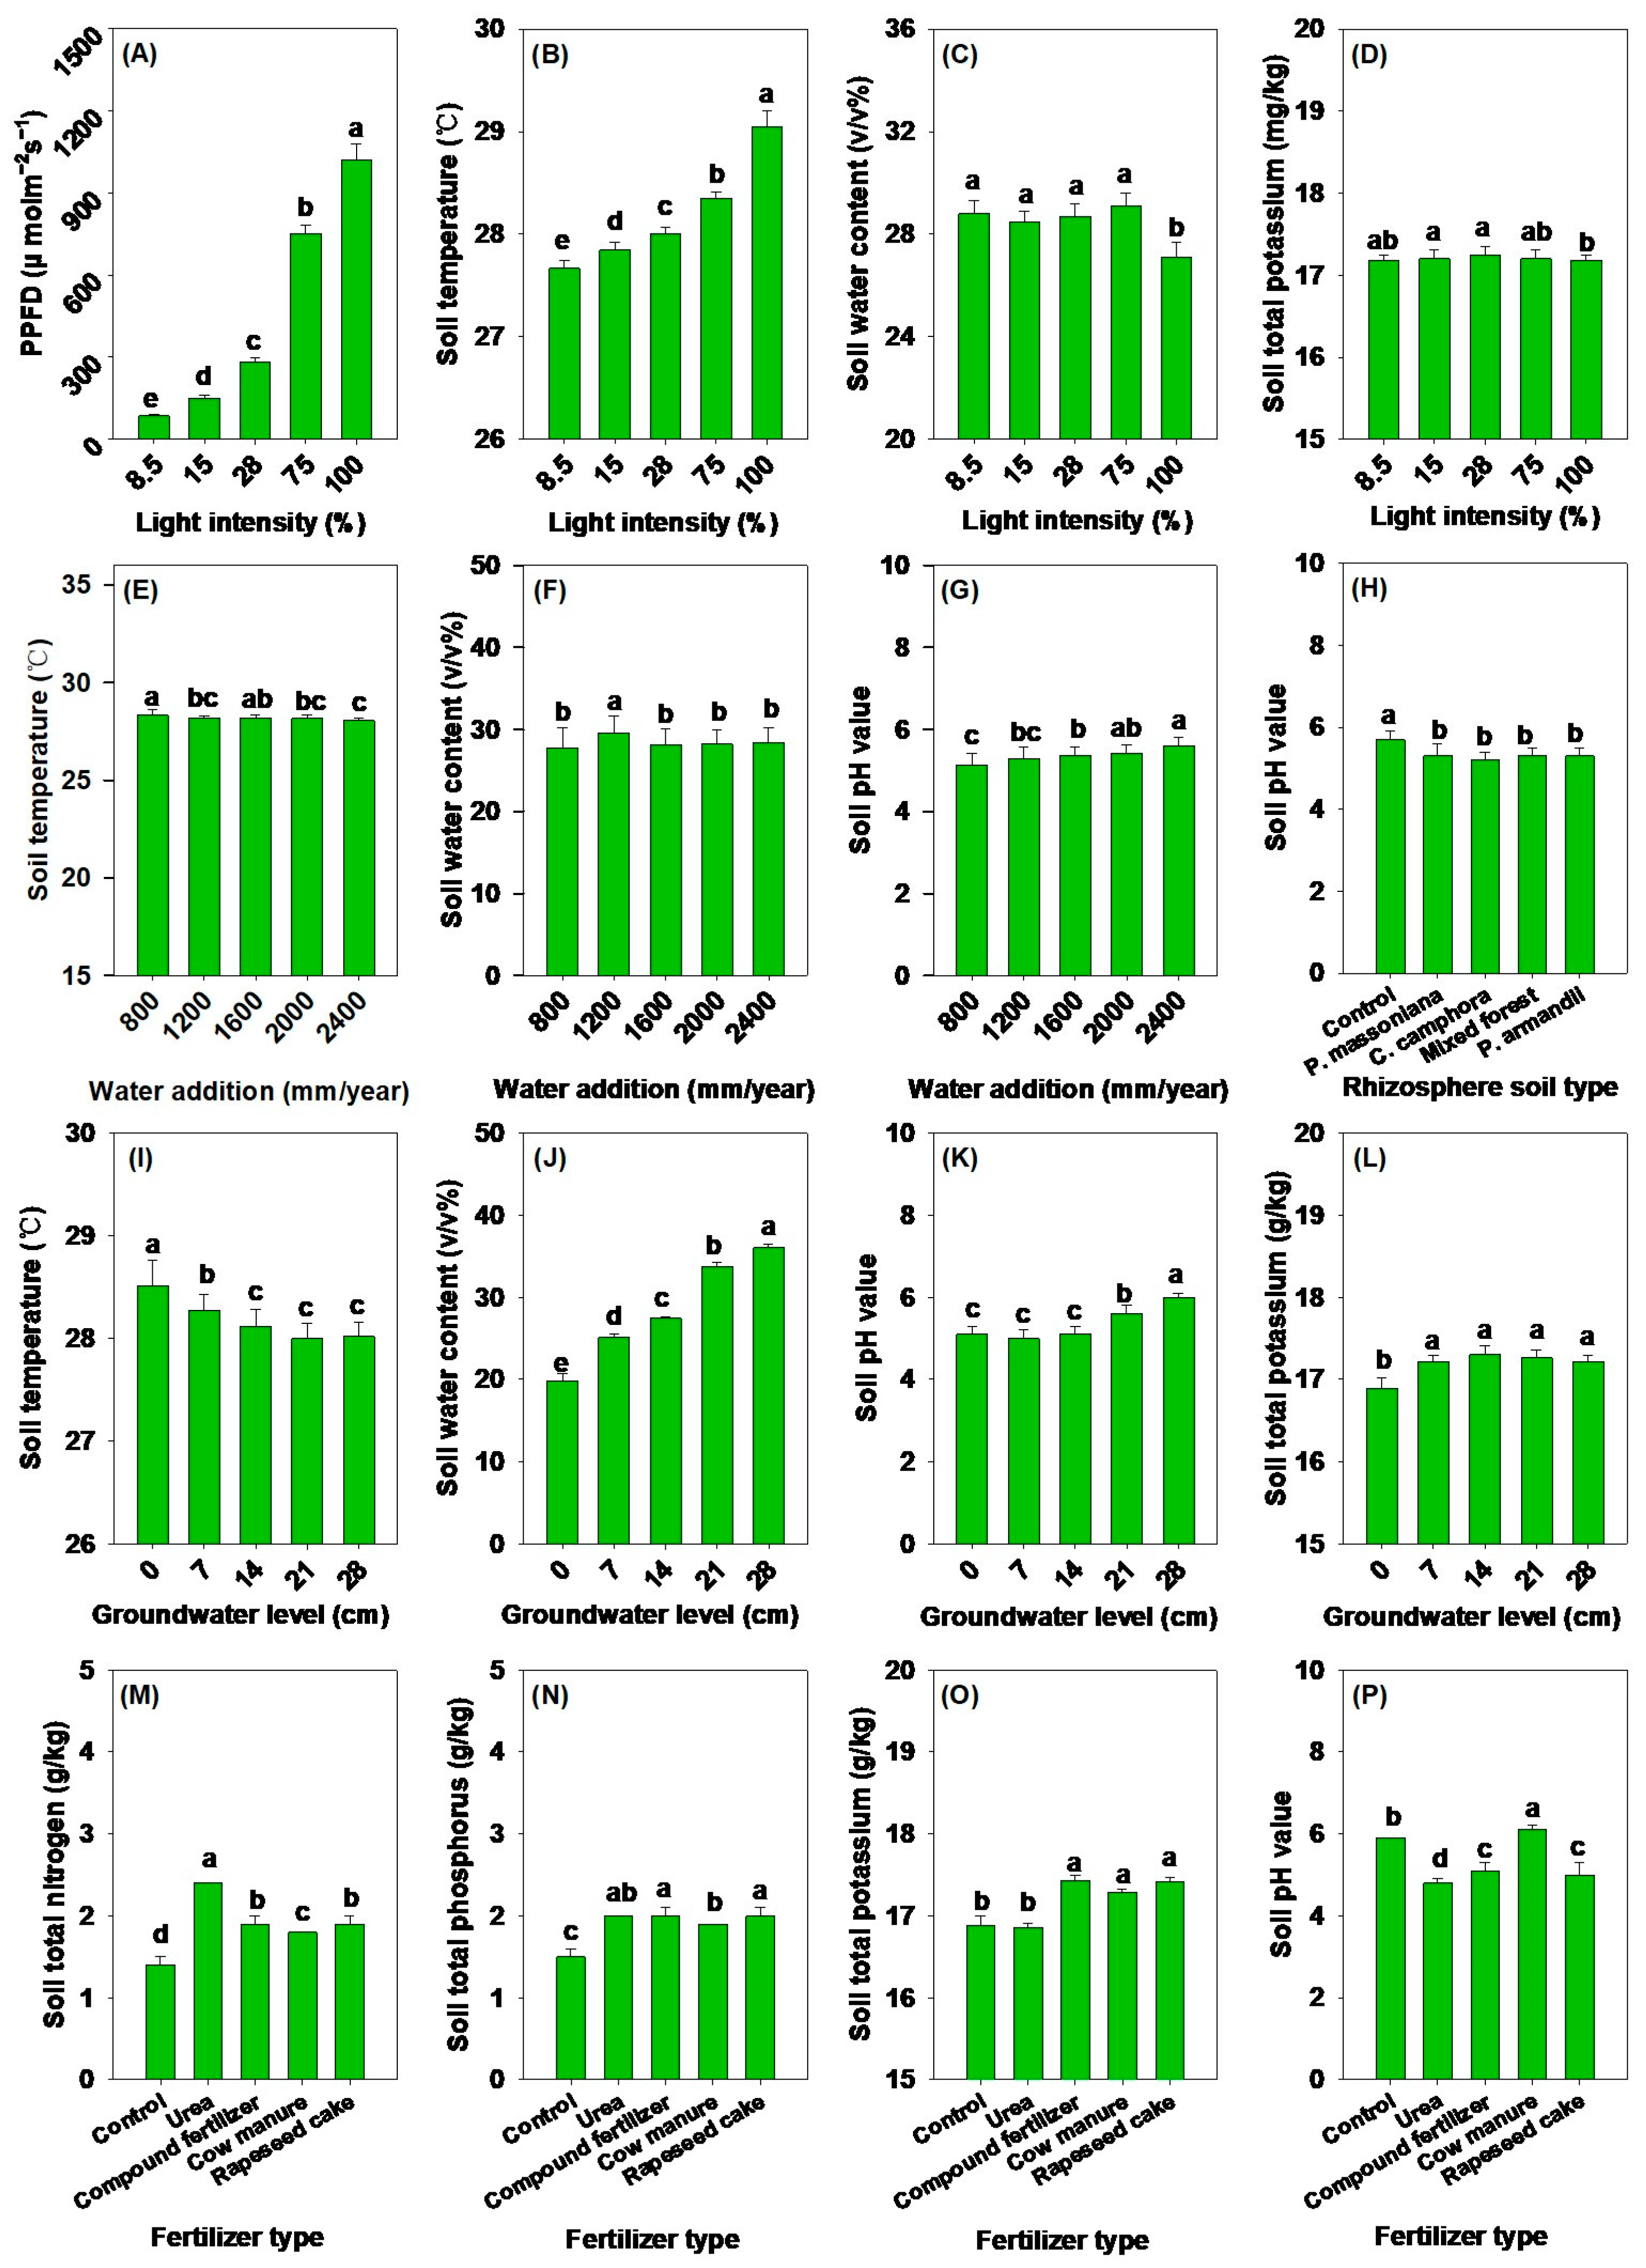
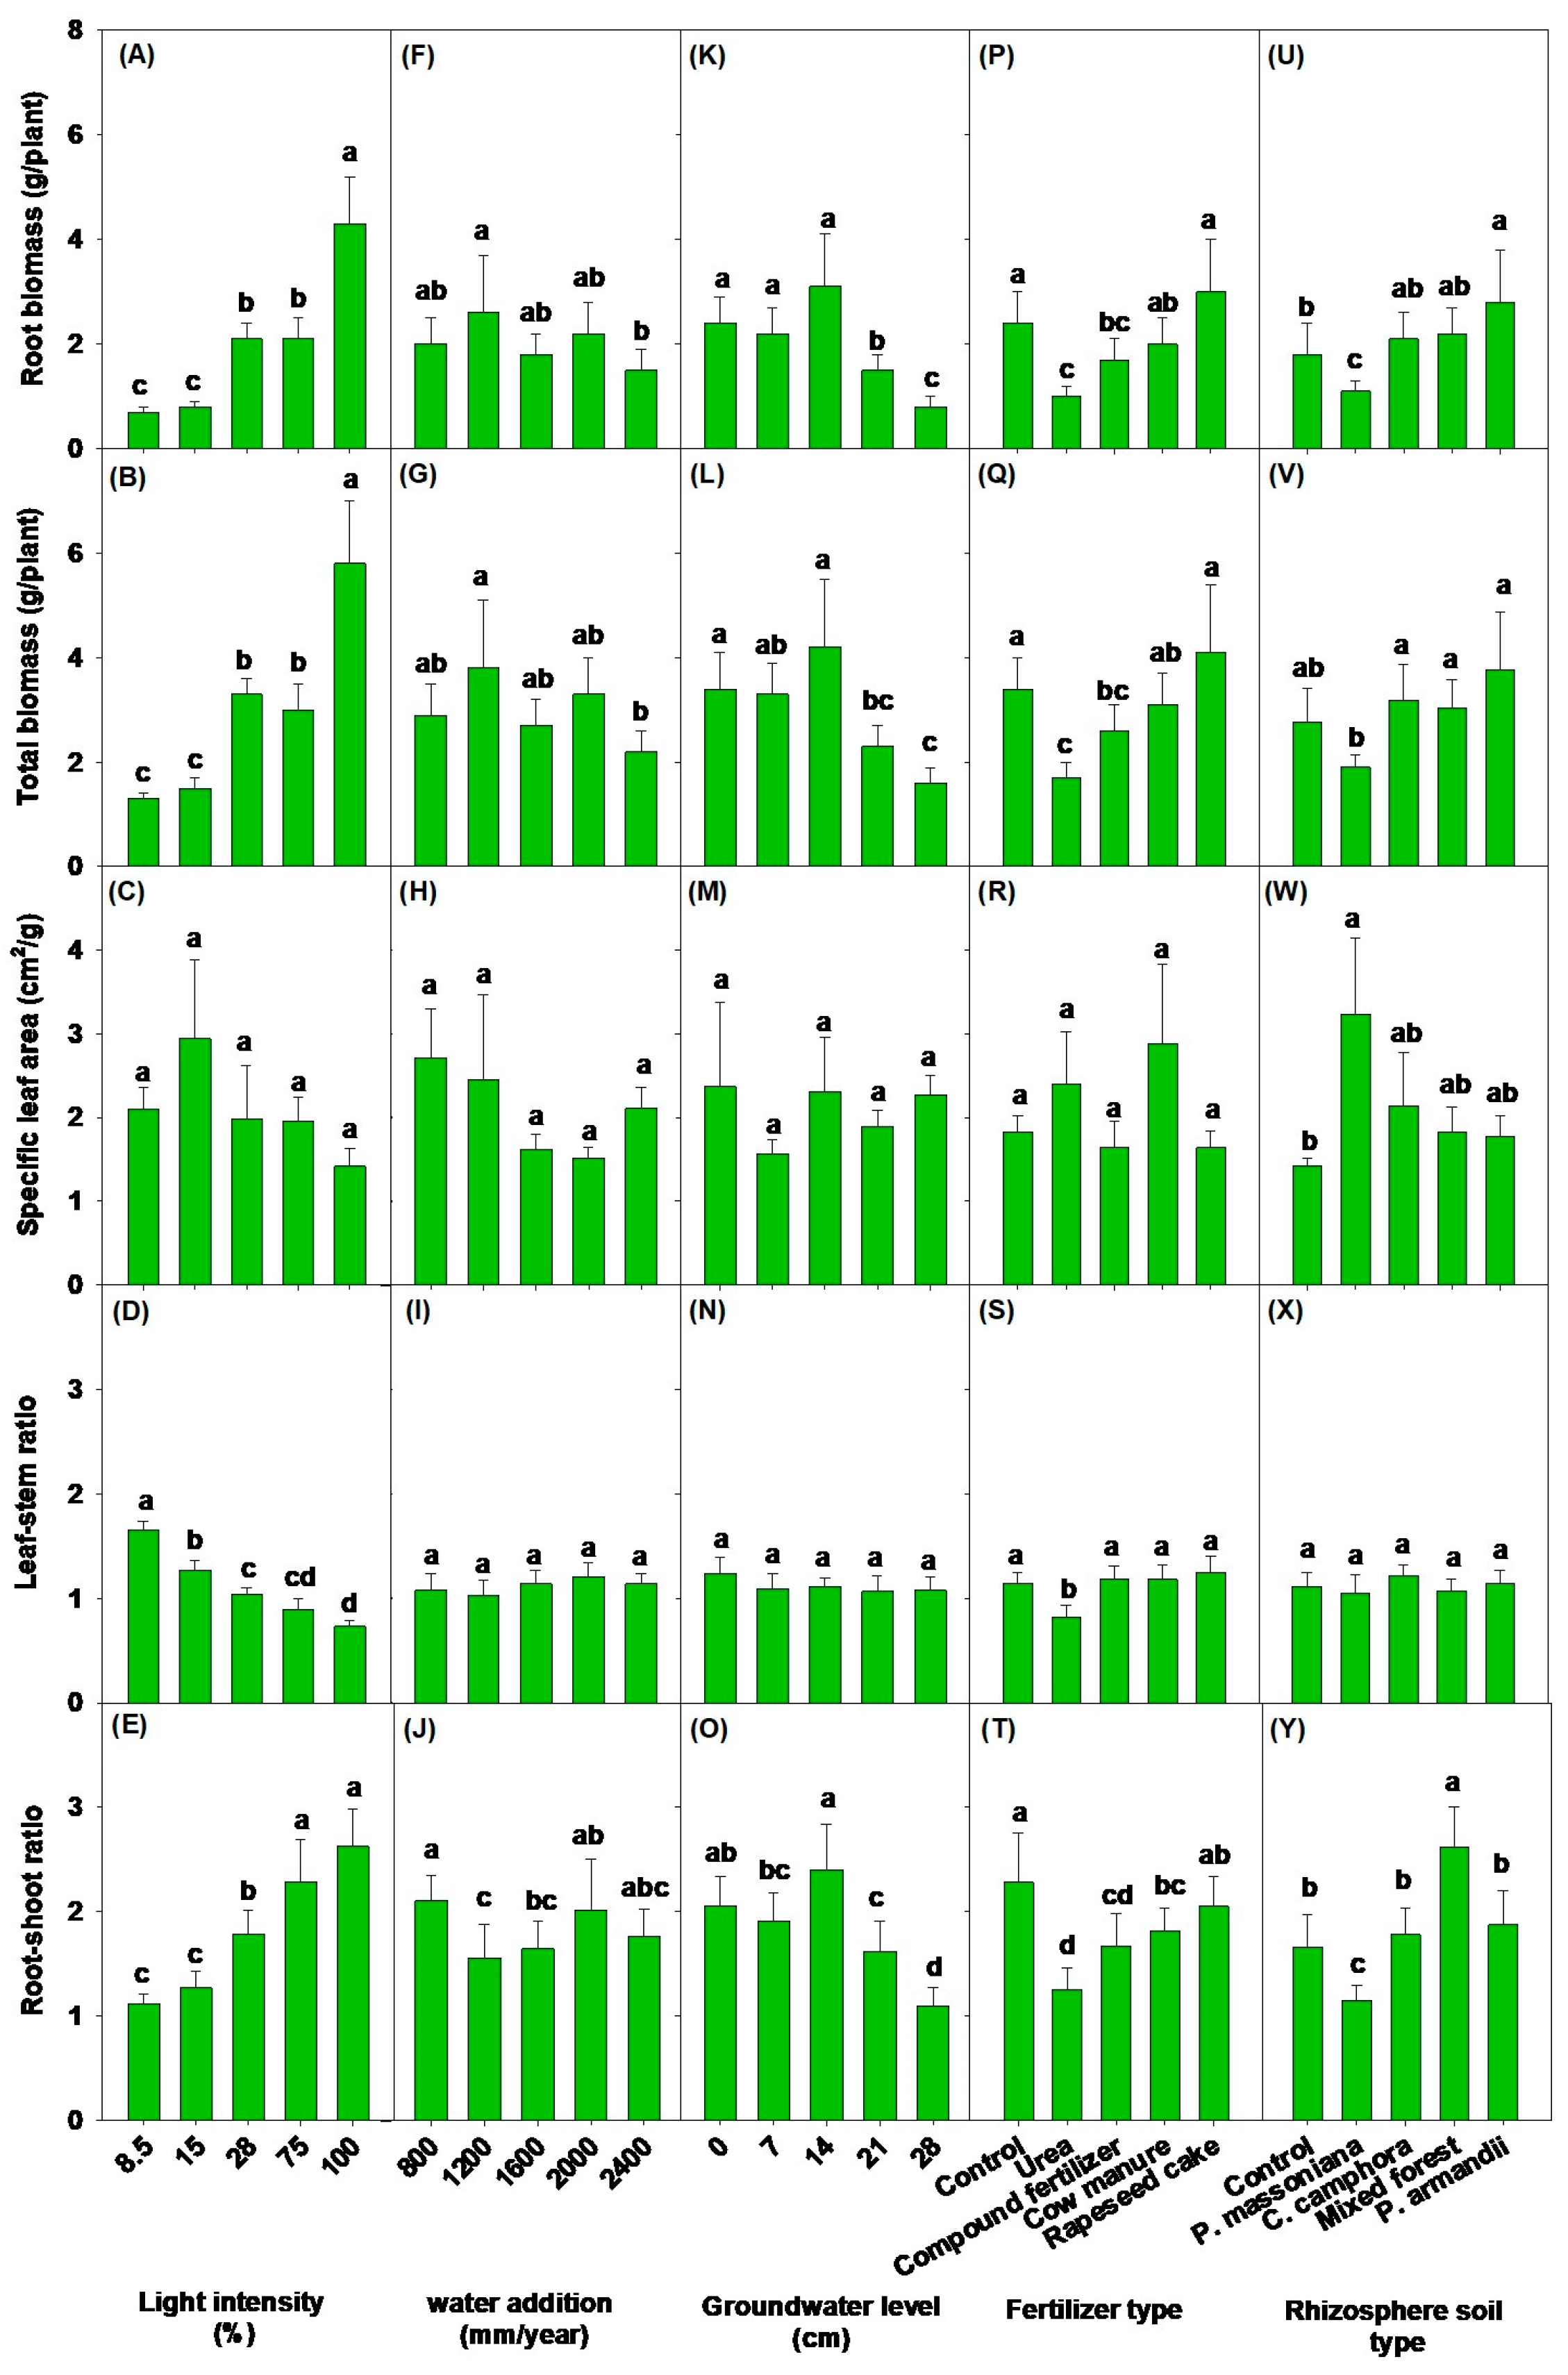
3.1. Effects of Light Intensity on Soil Physicochemical Properties, Aboveground Morphological Parameters, and Biomass

The shading treatments exerted a significant influence on the light intensity, soil temperature, and soil water content of the P. amabilis seedlings. Comparative analysis with the 100% natural light treatment revealed that the 75% natural light, 28% natural light, 15% natural light, and 8.5% natural light treatments resulted in proportional reductions of 26.4%, 72.5%, 85.4%, and 91.6% in the light intensity received by the P. amabilis seedlings. Additionally, the soil temperature exhibited decreases of 0.7 °C, 1.0 °C, 1.2 °C, and 1.4 °C, respectively, while the soil water content increased by 2.0%, 1.6%, 1.4%, and 1.7% (v/v%) (p < 0.05, Figure 1A–C). In terms of the soil total potassium content, under the 100% natural light treatment, the soil potassium content was significantly lower compared to the other four light intensities, with no significant differences being observed among the soil potassium contents under the four light intensities (p < 0.05, Figure 1D).
The effects of different light intensities on the GD, H, NH, and LC of P. amabilis seedlings were found to be statistically significant (p < 0.01, Table 3), with a clear trend of all four indicators increasing as the light intensity increased (p < 0.05, Table 4). In terms of the GD, the P. amabilis seedlings exhibited their lowest values under the 8.5% and 15% natural light treatments (1.7 mm and 1.8 mm, respectively), and their highest value under the 100% natural light treatment (2.8 mm), while the GD under the 28% and 75% natural light treatments (2.4 mm and 2.3 mm, respectively) fell between these extremes, with significant differences being observed between each pair, except for the GD under the 28% and 75% natural light treatments, where the difference was not significant (Table 4). The H and NH displayed similar patterns of variation with changing light intensity, except for the H and NH values under the 28% natural light treatment, which did not significantly differ from those under the 75% natural light treatment (Table 4). As for the LC, the values under 100% and 28% natural light were significantly higher than those under the 75%, 15%, and 8.5% natural light treatments (p < 0.05, Table 4).
The influence of varying the light intensity on the biomass of the P. amabilis seedlings exhibited a significant relationship (p < 0.01, Table 3). With an escalating light intensity, there was a gradual augmentation in the biomass of the stems, leaves, roots, and whole plants, culminating in peak values under the 100% natural light treatment (0.9 g/plant, 0.6 g/plant, 4.1 g/plant, and 5.9 g/plant, respectively). When compared to the biomass value observed under the 100% natural light treatment, the SB values under the 75%, 28%, 15%, and 8.5% natural light treatments accounted for 55.6%, 66.7%, 33.4%, and 22.2%, respectively. Similarly, the RB values under the latter four treatments constituted 50.1%, 52.2%, 20.2%, and 16.8% under the 100% natural light treatment, respectively. The total biomass values under the 75%, 28%, 15%, and 8.5% natural light treatments amounted to 53.1%, 59.6%, 26.8%, and 23.7% of the total biomass under the 100% natural light treatment (Table 3 and Table 4, Figure 2A,B). However, with the increasing light intensity, no significant differences were observed in the specific leaf area (p > 0.05, Figure 2C) and leaf–stem ratio from the 8.5% natural light treatment to the 100% natural light treatment of P. amabilis seedlings (p < 0.05, Figure 2D), whereas the root–shoot ratio progressively increased with the increasing light intensity (p < 0.05, Figure 2E).

3.2. Impacts of Different Water Addition and Groundwater Levels on Soil Physicochemical Properties, Aboveground Morphological Parameters, and Biomass

Our results demonstrate that increasing rainfall correlates with a significant decline in soil temperature (Figure 1E). In contrast, under a water addition rate of 1200 mm/a, the soil water content reached its maximum level (Figure 1F). Conversely, an elevation in the groundwater level was associated with a notable decrease in soil temperature (p < 0.05, Figure 1I) and an increase in the soil water content (p < 0.01, Figure 1J). The assessment of soil pH unveiled a substantial upward trend with escalating water addition and groundwater levels, particularly when the groundwater level exceeded 14 cm (p < 0.05, Figure 1G,K). At a groundwater level of 0 cm, the soil potassium content was minimal, at 16.98 g/kg. However, at groundwater levels of 7 cm, 14 cm, 21 cm, and 28 cm, there were increases, measuring 0.24 g/kg, 0.32 g/kg, 0.29 g/kg, and 0.23 g/kg, respectively, albeit without significant differences among them (p < 0.05, Figure 1L).
The analysis of variance identified a significant influence of water availability on the H, NH, LC and all biomass indexes of P. amabilis seedlings (p < 0.1, Table 3). The drought treatment (800 mm/year) resulted in an increase in the H and NH (p < 0.01, as outlined in Table 3 and Table 4). Regarding the LC, aboveground biomass (including LB and SB), RB, and TB of P. amabilis, the highest values were observed under the mild drought treatment (1200 mm/a). The most effective waterlogging treatment (2400 mm/year) markedly suppressed all indicators, encompassing the H, NH, LC, LB, SB, RB, and TB. Conversely, water addition treatments exhibited no notable impact on the GD (p < 0.01, Table 3 and Table 4, Figure 2F,G).
Different groundwater levels significantly influenced the soil temperature, soil water content, pH, soil total potassium content, GD, RB, TB, and root–shoot ratio, while having no significant effect on the H, NH, LB, LC, and SB (p < 0.01, Table 3). A rise in the groundwater level correlated with a progressive increase in the soil moisture content (p < 0.01, Figure 1J). Simultaneously, the soil pH gradually rose within the depth range of 14–28 cm (p < 0.01, Figure 1K). In the 0–14 cm depth range, the soil temperature decreased with rising groundwater levels, stabilizing as the groundwater level further increased (p < 0.01, Figure 1I). However, the GD, RB, TB, and root–shoot ratio show relatively high but nonsignificant values within the 0–14 cm groundwater level range. Following this, as the groundwater level rose, these indicators gradually declined within the 14–28 cm range (p < 0.01, Table 4, Figure 2K,L,O). However, the variations in the specific leaf area and leaf–stem ratio in response to different watering treatments (Figure 2H,I) and the influence of the groundwater level on the leaf–stem ratio were not substantial (Figure 2M,N).

3.3. Impacts of Different Fertilizer Types and Rhizosphere Soil Types on Soil Physicochemical Properties, Aboveground Morphological Parameters, and Biomass

Both fertilization and rhizosphere soil amendments significantly impacted the soil properties, specifically influencing the soil total nitrogen, total phosphorus, total potassium, nitrate nitrogen, and soil pH (p < 0.05, Table 3), while exhibiting no notable effects on the surface soil temperature, soil water content, and soil ammonium nitrogen (p > 0.05, Table 3).
Regarding nutrient availability, different fertilizer types substantially increased the soil total nitrogen, total phosphorus, total potassium, and nitrate nitrogen content (p < 0.05, Table 3). In comparison to the control treatment, urea, compound fertilizer, cow manure, and rapeseed cake organic fertilizer additions raised the soil total nitrogen content by 1.0 g/kg, 0.5 g/kg, 0.4 g/kg, and 0.5 g/kg, respectively, with the most significant increase being observed for the urea treatment at 71.4% (p < 0.05, Table 3, Figure 1M). The total phosphorus content in the soil was highest in the treatments with compound fertilizer and rapeseed cake organic fertilizer, followed by the urea and cow manure additions (Figure 1N). The soil’s total potassium content was highest in the treatments with the compound fertilizer, rapeseed cake organic fertilizer, and cow manure organic fertilizer, with increases of 195.9%, 186.7%, and 106.1%, respectively. However, the addition of urea had no significant effect on the soil total potassium content compared to the control treatment (Figure 1O). Only the cow manure fertilization treatment exhibited a higher soil pH compared to the control treatment. In contrast, the application of urea, compound fertilizer, and rapeseed cake organic fertilizer caused decreases in the soil pH by 1.1, 0.8, and 0.9 units, respectively (Figure 1P, Table S1).
In relation to fertilizer types, significant effects were observed on various seedling parameters, including the LC, RB, LB, and TB, although not on the GD, H, NH, and SB (p < 0.01, Table 3 and Table 4). Compound fertilizer notably decreased RB and TB levels, but had no significant impact on the LC and LB. Conversely, urea addition significantly lowered the LC, RB, LB, and TB. Cow dung and rapeseed cake fertilizer additions, in comparison to the control, did not notably influence the LC, RB, LB, and TB. Notably, the rapeseed cake fertilizer consistently increased these indicators, warranting attention (p < 0.05, Table 4, Figure 2P,Q).
Furthermore, when examining resource allocation strategies, various fertilizer treatments had no effect on the specific leaf area of P. amabilis seedlings (Figure 2R). However, the application of urea fertilizer significantly reduced both the leaf–stem ratio and root–shoot ratio (Figure 2S,T). Additionally, the compound fertilizer and cow manure organic fertilizer treatments significantly decreased the root–shoot ratio (Figure 2T).
The inclusion of rhizosphere soil had noteworthy implications for the soil temperature, soil water content, soil pH value, and soil nutrient availability (p < 0.05, Table 3). All rhizosphere soils increased the soil water content, total nitrogen, total phosphorus, and total potassium, while reducing the soil temperature and pH value (p < 0.05, Table 3 and Table S1, Figure 1H). Pinus massoniana rhizosphere soil showed the highest encouraging effect on the soil total nitrogen and total phosphorus, whereas P. massoniana rhizosphere soil had the least encouraging effect. Cinnamomum camphora and the mixed forest rhizosphere soil had intermediate encouraging effects. Furthermore, the encouraging effects of the C. camphora and mixed forest rhizosphere soils on the total nitrogen and total phosphorus did not significantly differ (p < 0.05, Table S1).
The influence of varying the rhizosphere soil type on the aboveground morphological parameters (GD, H, and LC) and biomass (RB, LB, and TB) of P. amabilis seedlings was statistically significant, with no significant effects being observed for the NH and SB (Table 3). P. massoniana decreased the GD and H, whereas P. amabilis increased them; the other rhizosphere soils showed no significant impact on these parameters (Table 4). The LC and LB exhibited minimal changes compared to the control across all four other rhizosphere soils. However, in the presence of P. massoniana and the mixed forest rhizosphere soil, the LC and LB were suppressed, whereas P. amabilis promoted their abundance. Consequently, LC and LB levels were significantly higher under the P. amabilis rhizosphere soil treatment compared to P. massoniana and the mixed forest soil. Additionally, the LC under C. camphora did not significantly differ from other rhizosphere soil types, while the LB under C. camphora was comparable to that under P. massoniana but significantly higher than the other three rhizosphere soil types (Table 4). Regarding the TB, this was significantly lower under the P. massoniana rhizosphere soil treatment compared to the other four rhizosphere soil types, with no significant differences being observed among these four soil types. (Figure 2V). Regarding the RB, the P. massoniana rhizosphere soil treatment significantly suppressed the RB, whereas P. amabilis significantly enhanced the RB. However, the effects of the C. camphora and mixed forest rhizosphere soils on the RB were not statistically significant (p < 0.05, Table 4, Figure 2U).
Nevertheless, in terms of resource allocation strategies, the specific leaf area of P. amabilis seedlings significantly increased with the addition of P. massoniana rhizosphere soil, whereas other types of rhizosphere soils did not show a significant difference compared to the control (Figure 2W). Under the P. massoniana rhizosphere soil treatment, the root-to-shoot ratio was significantly lower compared to the other four rhizosphere soil treatments. In contrast, the root-to-shoot ratio under the mixed forest rhizosphere soil treatment exhibited a significantly higher value than the other four treatments. Notably, statistical significance in the root-to-shoot ratio differences was absent only among the control (1.66), C. camphora (1.78), and P. amabilis (1.87) rhizosphere soil treatments, with values falling between those of the P. massoniana (1.15) and mixed forest (2.61) treatments (Figure 2Y). However, the addition of rhizosphere soil did not have a significant impact on the leaf–stem ratio (Figure 2X).

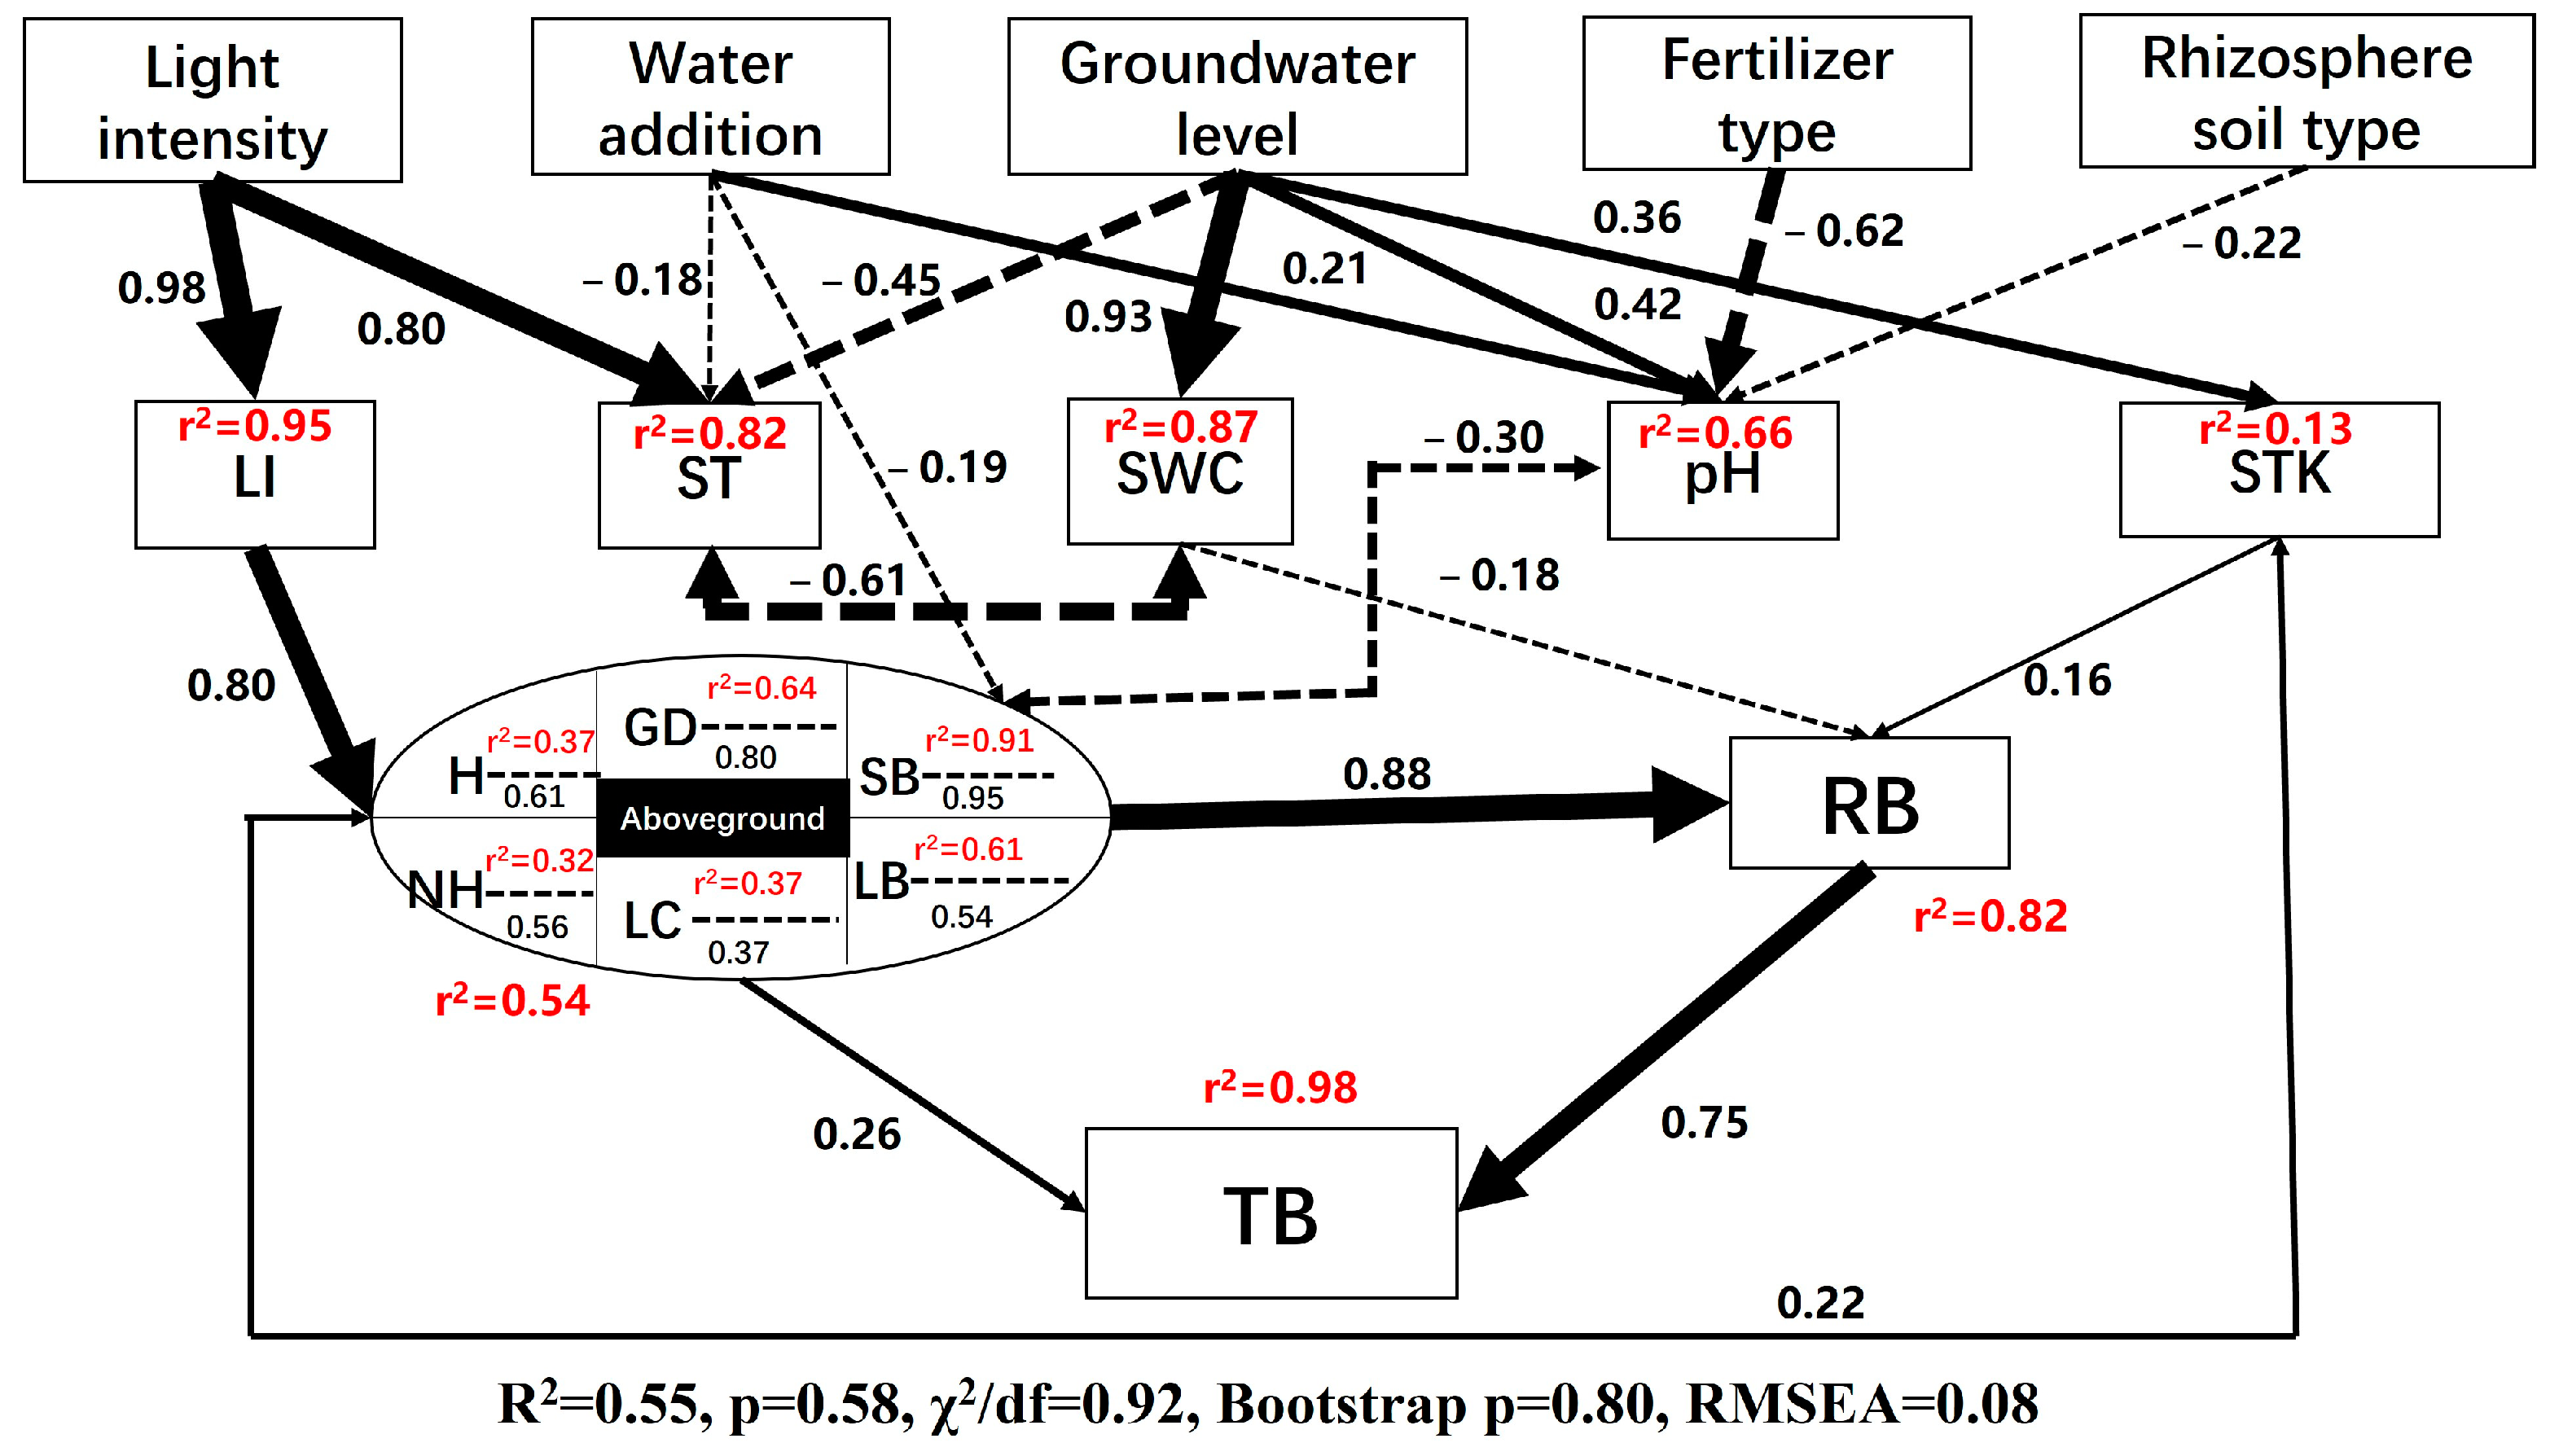
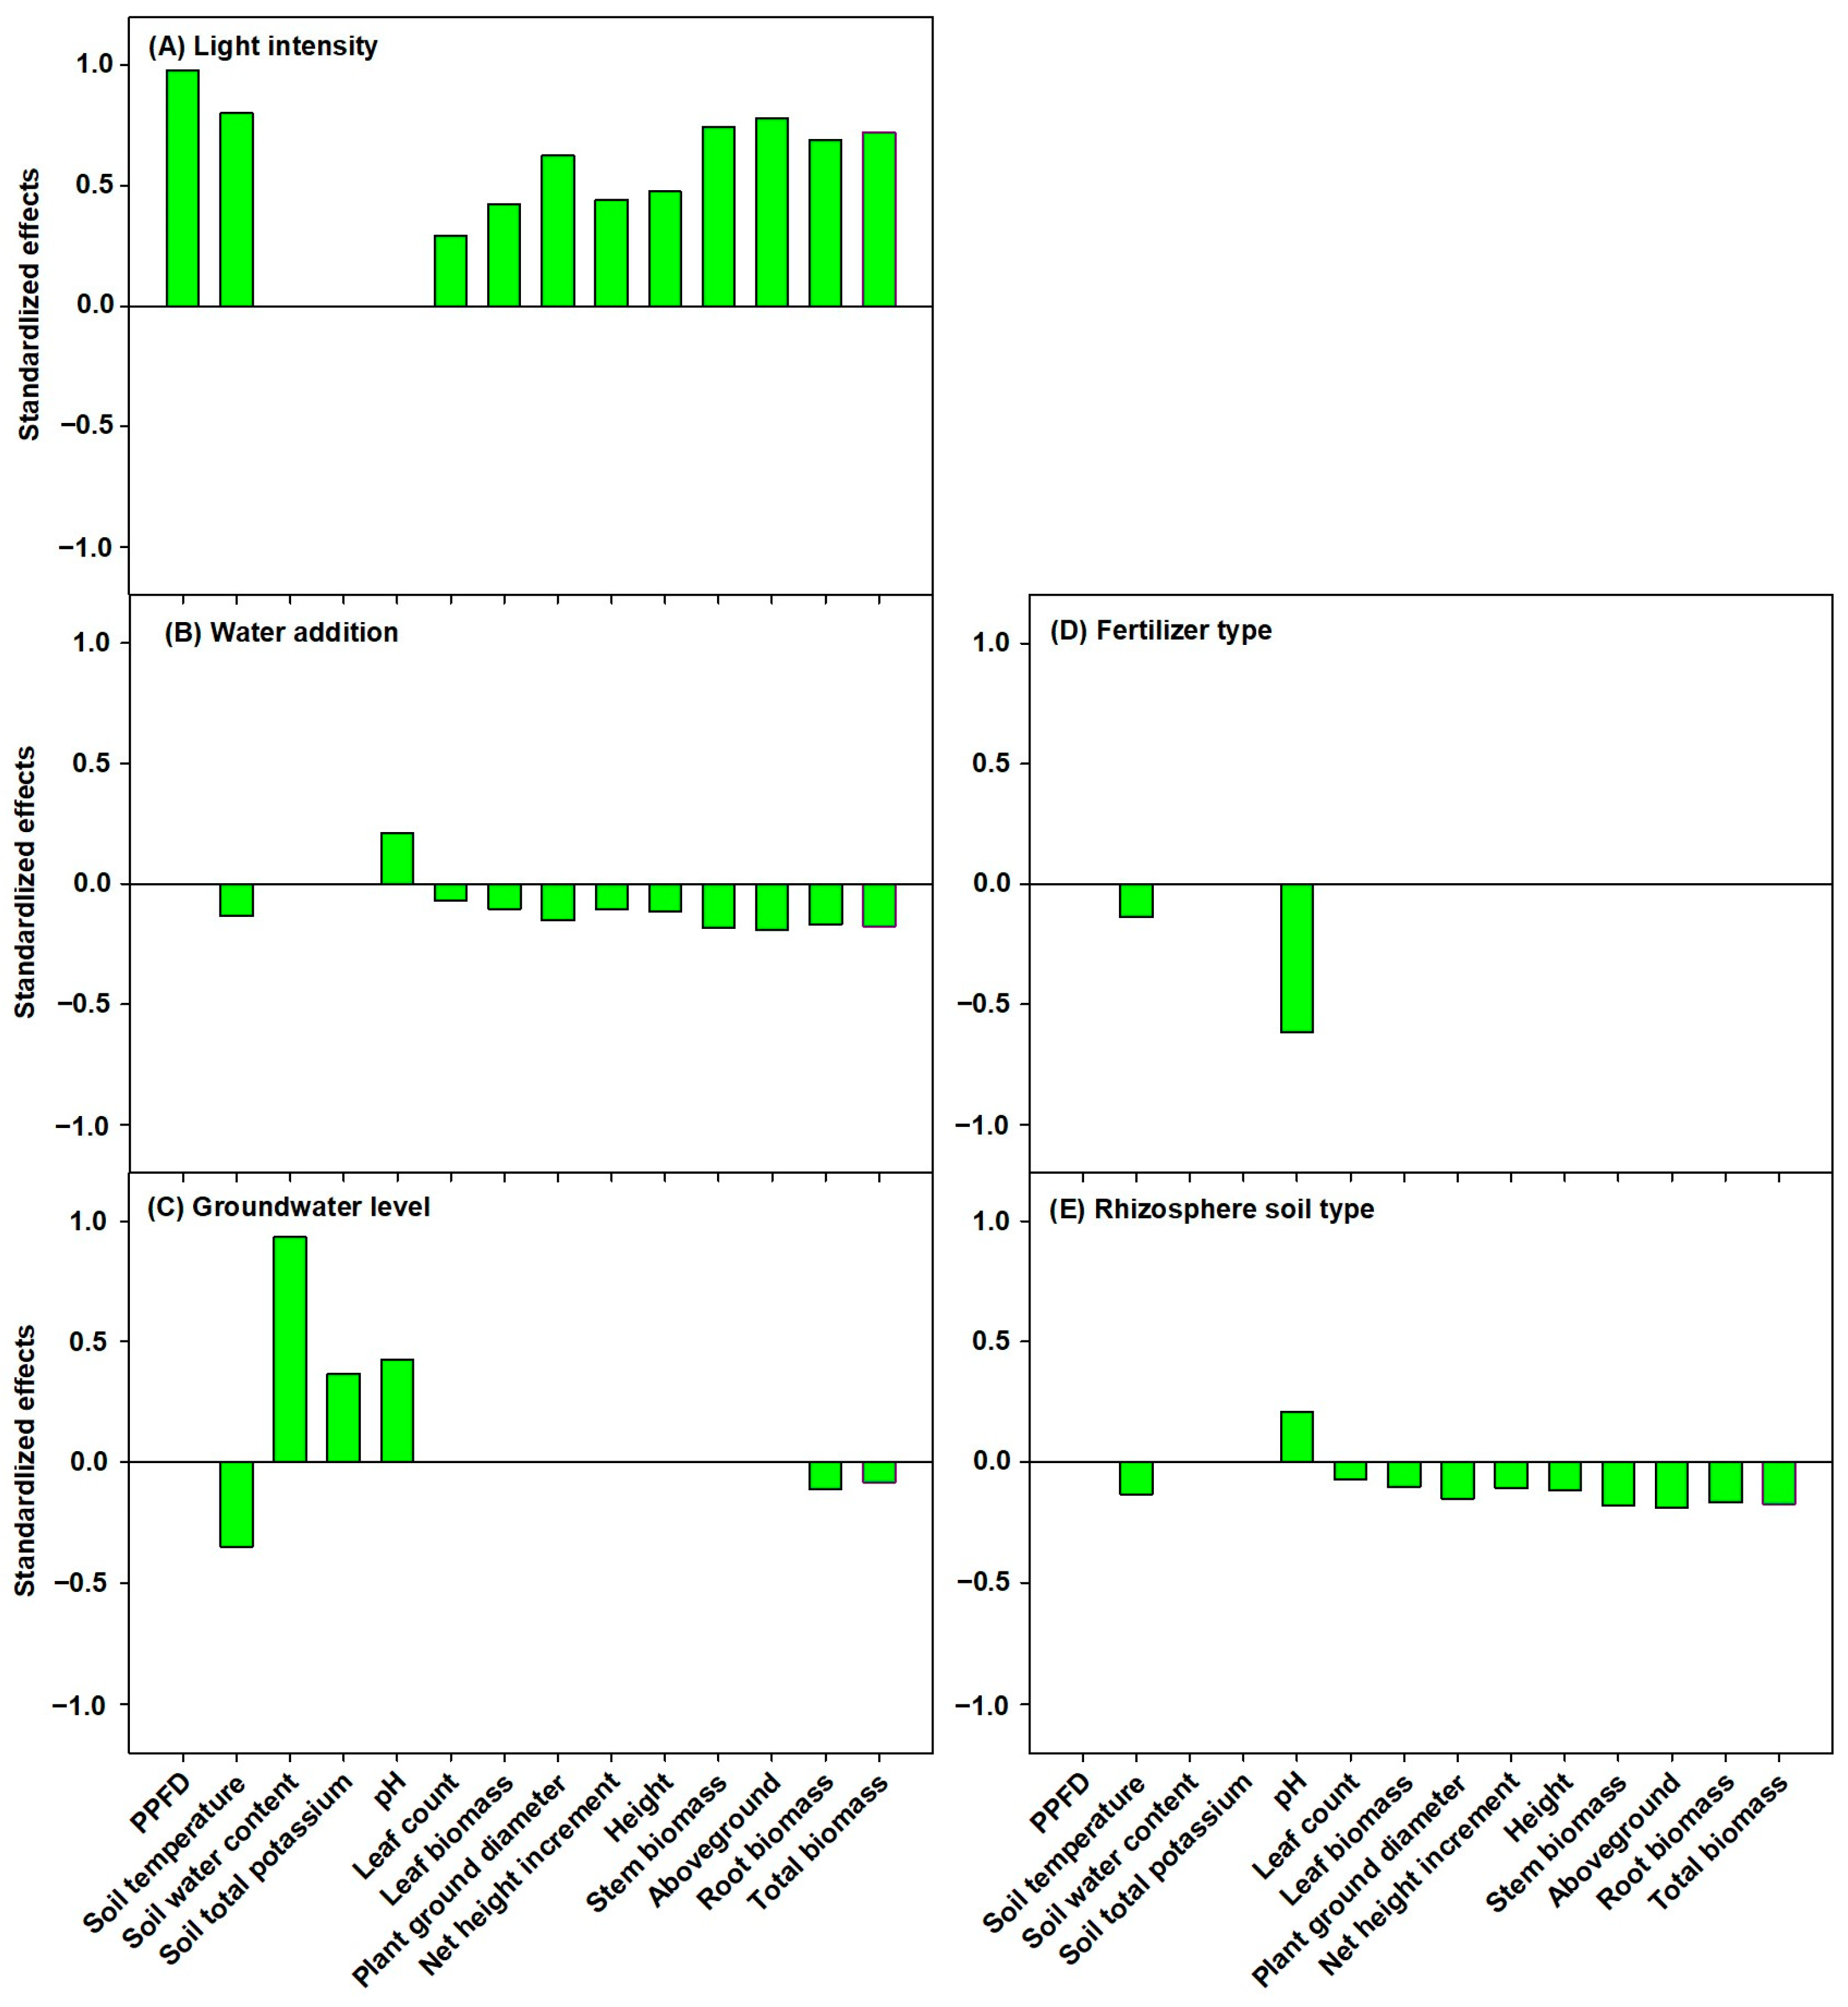
3.4. Path Analysis of Ecological Factors Influencing P. amabilis Seedlings

To understand how ecological factors influence biomass distribution in various organs of P. amabilis seedlings, we conducted a structural equation modeling (SEM) analysis (Figure 3). Light intensity consistently had positive effects (Figure 4A), directly impacting the available light resources and subsequently influencing biomass accumulation in both the aboveground and belowground parts. Additionally, light intensity influenced the soil temperature by regulating seedling photosynthesis, thereby affecting various growth indicators (Figure 3 and Figure 4A).
The analysis revealed direct impacts of water addition on the soil temperature, pH, aboveground biomass accumulation, and seedling morphological indicators. Among these factors, only the soil pH showed a positive effect, while the others had negative effects (Figure 4B). The groundwater level emerged as a key determinant, positively correlating with the soil water content. It also directly influenced the soil temperature, pH, and total potassium content, ultimately inhibiting root biomass accumulation and negatively impacting the overall biomass of P. amabilis seedlings (Figure 3 and Figure 4C).
The fertilizer type influenced the soil temperature to some extent and significantly affected both the readily available and total nutrient content in the soil. Notably, the most pronounced effect manifested as a negative impact on the soil pH, while no significant effect was observed on biomass allocation to different plant parts or the overall biomass (Figure 4D). The rhizosphere soil type exhibited a positive correlation solely with the soil pH, exerting varying degrees of inhibitory effects on the aboveground biomass, root biomass, and total biomass of the seedlings (Figure 4E).
In summary, light intensity had a significant positive effect on the biomass accumulation of aboveground photosynthetic organs and root biomass in P. amabilis seedlings. Water addition directly influenced the aboveground growth of the seedlings, while indirectly affecting root biomass accumulation. The groundwater level primarily impacted the biomass of the root systems, resulting in an overall effect on the biomass of the P. amabilis seedlings.

4. Discussion

4.1. P. amabilis Seedling Growth in Response to Light Intensity

Our analysis indicated a progressive decline in the growth performance of P. amabilis seedlings with increasing shading intensity. These results underscore the significant role of light conditions as a primary ecological factor influencing both the aboveground and belowground growth of P. amabilis seedlings, supporting the earlier hypothesis of their preference for light. Our discovery partially supports the conclusions of a previous study by Zhang and Wang [25]. This study suggests that the growth of P. amabilis seedlings is not inhibited when shaded by 30% to 50%, but only significantly suppressed under 95% shaded conditions. It was observed that when exposed to mild shading conditions, P. amabilis seedlings demonstrated the capacity to adapt to reduced light intensity through intrinsic self-regulatory mechanisms. However, when the shading intensity exceeded the species’s adaptive threshold, it resulted in notable changes in leaf chlorophyll composition, peroxidase activity, soluble protein content, and proline content. However, this assessment was based on a short-term (60-day) single-time evaluation of physiological indicators. This research enhances our understanding of the response patterns of P. amabilis seedlings to varying light intensities within the range of natural light conditions (746.3~895.5 µmol m−2s−1) [25].
Extensive research has explored the influence of light intensity on seedling growth and biomass accumulation [6,43]. For example, a study on Carpinus betulus seedlings reported markedly higher aboveground, belowground, and total biomass values, along with an increased root–shoot ratio, under high-light conditions [44]. In contrast, the seedling biomass of Changium smyrnioides and Anthriscus sylvestri reached its maximum under moderate light intensity [45]. Comparable light responses have been observed in other pine species, including P. massoniana seedlings under a 30% shading treatment [46] and Chinese larch seedlings under varying thinning intensities [47]. These responses primarily involve longer needles and a larger leaf area, alongside lower rates of photosynthesis, transpiration, and stomatal conductance. Additionally, there is an increase in the photosynthetic pigment content.
Pseudolarix amabilis belongs to the photophilic plant group, characterized by a high demand for light input. In our study, where we considered the late-season biomass of P. amabilis seedlings as the dependent variable, we observed an increase in photosynthetic biomass accumulation in response to higher light intensities. This increase was evident in terms of the GD, H, NH, LC, and aboveground biomass. Moreover, photosynthetic products were redistributed to facilitate growth in the root system, resulting in an overall increase in the biomass of the P. amabilis seedlings. In alignment with the findings of Zhou [6], our study reveals a substantial enhancement in the aboveground, belowground, and total biomass of P. amabilis seedlings, accompanied by an increase in their root–shoot ratio, in response to increasing light intensities.
These results indicate that light intensity plays a pivotal role in influencing the growth of P. amabilis during the juvenile life stage [48]. Optimal growth conditions are achieved when P. amabilis is exposed to natural light within its suitable distribution range.
Resource allocation patterns confirm that even slight shading hampers seedling growth by decreasing the light intensity. Consequently, shaded treatments result in reduced biomass across all plant components, including the whole plant and root–stem–leaf segments, accompanied by a decline in the root–shoot ratio. The preference for allocating resources aboveground becomes notably prominent when P. amabilis seedlings adapt to low-light conditions.
In low-light conditions, the P. amabilis seedlings exhibited a higher leaf–stem ratio and specific leaf area, suggesting a prioritized allocation of photosynthetic products to leaves, stems, and roots. This finding is consistent with previous research [49]. These findings imply that P. amabilis seedlings, along with other coniferous species and organisms, may prioritize the nearest resources when facing ecological constraints or stress. Moreover, as stress increases, this response may shift to allow the plants to prioritize resources in order from nearest to farthest. It is important to note that these observations apply specifically to the rapid growth stage of P. amabilis seedlings and require further research to be confirmed and given broader relevance. However, if this principle becomes a general rule, it could offer valuable insights into ecological factors. This could enhance our understanding of the cumulative impact of shading treatments on P. amabilis seedling growth, complementing traditional ecological theories.
It is worth noting that this study lacks high-frequency data tracking the photosynthetic physiological indicators of P. amabilis seedling growth throughout an entire growth season. Consequently, it cannot provide a comprehensive explanation for the disparities observed in comparison to the findings of Zhang and Wang [25]. Therefore, future research endeavors that focus on high-frequency measurements of photosynthetic physiological indicators will contribute to a more detailed understanding of how P. amabilis seedlings respond to varying light intensities.

4.2. P. amabilis Seedling Growth in Response to Water Heterogeneity

The results of both the water addition and groundwater level treatments reveal a clear response in the P. amabilis seedlings, highlighting their tolerance to drought but intolerance to waterlogging during the seedling stage. Our study emphasizes the importance of a waterlogging depth of around 14 cm below the soil surface as a critical threshold for supporting normal seedling growth.
Prior descriptive studies on the initial introduction and afforestation of P. amabilis have indicated its unsuitability for cultivation in waterlogged environments [45,50]. However, these claims lack robust validation, particularly due to the absence of the experimental research data covering diverse water-gradient conditions needed to address this scientific inquiry. In our study, we simulated rainfall by applying water from above the soil surface, contrasting with continuous bottom-up waterlogging treatment. This distinction led to varied effects on the P. amabilis seedlings.
Despite experiencing drought stress with an annual rainfall of 800mm, the seedlings did not show the ability to stimulate growth in their stems, leaves, and roots, but rather increased their root–shoot ratio. This adaptive strategy involves reallocating resources to underground root growth, improving water absorption and enhancing drought tolerance [51,52]. In our study, intense continuous waterlogging hindered root growth, affecting the overall growth of the P. amabilis seedlings due to oxygen depletion. This aligns with research indicating the rapid depletion of oxygen by soil microorganisms and roots under waterlogging stress [50]. Consequently, anaerobic fermentation for ATP synthesis becomes inefficient, leading to a depletion of carbohydrate reserves. This depletion results in hypoxia, malnutrition, compromised membrane integrity, and the infiltration of phytotoxic compounds from the waterlogged soil. These cumulative effects can ultimately lead to reduced biomass or crop failure [50,53]. Our research shows that despite the increased soil nutrient content, the soil was not able to counteract the limitations of waterlogging stress and elevated pH on the P. amabilis seedlings’ root growth. This study suggests that the 14 cm groundwater threshold for the normal growth of P. amabilis seedlings may not be highly applicable due to limitations posed by their root system depth, making it challenging to implement in cultivation practices.

4.3. P. amabilis Seedling Growth in Response to the Fertilizer Type

Fertilization significantly affects soil nutrient availability, yet its impact on the growth of P. amabilis seedlings appears to be insignificant, suggesting that soil nutrient conditions may not be the primary limiting factor. Generally, conventional soils within the reforestation range of P. amabilis provide adequate support for its growth. However, a more detailed comparative analysis revealed noteworthy variations in the growth performance of P. amabilis seedlings when urea and rapeseed cake fertilizers were applied. Notably, while urea exhibited a pronounced inhibitory trend during the cultivation of P. amabilis seedlings, the opposite effect was observed with rapeseed cake fertilizer. In general, both chemical and organic fertilizers can supply essential plant growth elements such as nitrogen, phosphorus, and potassium [33,34]. Proper fertilizer application in nutrient-deficient soils typically results in increased seedling biomass [54], improved photosynthetic efficiency [44], and an enhanced accumulation of osmoregulatory substances, thereby boosting drought resistance [55].
It is important to note that, although our study revealed significant effects of both chemical and organic fertilizers on the soil nutrient availability, soil nutrient conditions may not be the primary ecological factor limiting the growth of P. amabilis seedlings. However, it is worth acknowledging that the introduction of nutrients into the rhizosphere soil in our study was an unavoidable limitation, albeit relatively minor in comparison to the added fertilizers. Consequently, additional fertilizer application is often unnecessary, and if required, organic fertilizers should be prioritized, with cautious consideration being given to the use of chemical fertilizers, particularly urea.

4.4. P. amabilis Seedling Growth in Response to the Type of Added Rhizosphere Soil

Out of the five types of added rhizosphere soil, it was only the seedlings cultivated in P. amabilis rhizosphere soil that exhibited increased biomass. Conversely, the treatment involving the addition of P. massoniana rhizosphere soil showed certain inhibitory effects, while the other rhizosphere soil types had no significant impact on the growth of the P. amabilis seedlings. These results align with earlier investigations [56], which suggested that transplanting with native soil enhances the survival rate and growth of P. amabilis seedlings. In contrast, our structural equation modeling analysis revealed that rhizosphere soil addition can influence the growth of P. amabilis seedlings by modulating the soil pH and nutrient conditions. These results differ from the observations of Qian et al. [27], who reported that topsoil from P. massoniana forests promoted the growth of P. amabilis in terms of survival rate and biomass. This disparity between the studies may be attributed to the absence of specific fungi capable of forming ectomycorrhizal associations with P. amabilis in the P. massoniana rhizosphere soil. On the other hand, the addition of topsoil from P. massoniana forests, while lacking specific fungi for P. amabilis, may provide favorable nutrient conditions in the topsoil, potentially explaining its growth-promoting effects. However, it is important to acknowledge a limitation of our study, specifically the lack of direct observations of specific fungi associated with P. amabilis. This limitation primarily stems from the absence of isolation and identification of these specific fungi in the laboratory.

5. Conclusions and Future Perspectives

We found that light intensity is the key ecological factor affecting P. amabilis seedling growth. To optimize growth, we recommend avoiding shaded conditions, keeping the groundwater levels below 14 cm, encouraging moderate drought conditions, applying well-rotted rapeseed cake organic fertilizer as needed, and incorporating rhizosphere soil during transplantation. In summary, this study offers practical recommendations for on-site protection to mitigate declining population numbers, address population isolation, and alleviate potential habitat loss within wild P. amabilis populations. Mitigation measures may include thinning to reduce the population density, selectively thinning coexisting tree species’ canopies to alleviate competition, improving understory light conditions, and facilitating seedling growth to ensure population continuity.
The influence of light, soil moisture, and nutrients on P. amabilis growth is mainly seen through interspecific competition. Subsequent research should focus on native habitat competition dynamics. These findings can aid in implementing ex situ conservation for surviving populations and provide standardized approaches for artificial planting, especially considering potential habitat loss.

Supplementary Materials

The following supporting information can be downloaded at: https://www.mdpi.com/article/10.3390/f15040684/s1, Table S1: Responses of aboveground variables of P. amabilis to light intensity, water addition, groundwater level, fertilizer type, and rhizosphere soil type.

Author Contributions

J.L. developed the idea. J.W., J.T., X.Y., R.F. and D.O. carried out the experiment. J.T., D.O. and J.L. analyzed the dataset. J.W. contributed to interpretation of data. J.T. and D.O. wrote the manuscript with substantial contributions from J.L., F.C., X.F., W.B. and X.L. All authors have read and agreed to the published version of the manuscript.

Funding

This research was funded by Natural Science Foundation of Jiangxi Province (20232BAB215049), Research Project of Jiangxi Provincial Department of Forestry (No. 202124), and National Natural Science Foundation of China (31901197).

Data Availability Statement

The data presented in this study are available on request from the corresponding author. The data are not publicly available due to some sections must remain confidential to support the publication of other thematic articles.

Conflicts of Interest

The authors declare no conflict of interest.

References

  1. Green, P.T.; Harms, K.E.; Connell, J.H. Nonrandom, Diversifying Processes Are Disproportionately Strong in the Smallest Size Classes of a Tropical Forest. Proc. Natl. Acad. Sci. USA 2014, 111, 18649–18654. [Google Scholar] [CrossRef] [PubMed]
  2. Marchin, R.M.; Yuan, Z. Editorial: Natural Tree Seedling Establishment and Forest Regeneration under Climate Change. Front. For. Glob. Chang. 2023, 6, 1256577. [Google Scholar] [CrossRef]
  3. Dodd, A.N.; Salathia, N.; Hall, A.; Kévei, E.; Tóth, R.; Nagy, F.; Hibberd, J.M.; Millar, A.J.; Webb, A.A.R. Plant Circadian Clocks Increase Photosynthesis, Growth, Survival, and Competitive Advantage. Science 2005, 309, 630–633. [Google Scholar] [CrossRef]
  4. Yukich Clendon, O.M.M.; Carpenter, J.K.; Kelly, D.; Timoti, P.; Burns, B.R.; Boswijk, G.; Monks, A. Global Change Explains Reduced Seeding in a Widespread New Zealand Tree: Indigenous Tūhoe Knowledge Informs Mechanistic Analysis. Front. For. Glob. Chang. 2023, 6, 1172326. [Google Scholar] [CrossRef]
  5. Soubeyrand, M.; Gennaretti, F.; Blarquez, O.; Bergeron, Y.; Taylor, A.R.; D’Orangeville, L.; Marchand, P. Competitive Interactions under Current Climate Allow Temperate Tree Species to Grow and Survive in Boreal Mixedwood Forest. Ecography 2023, 2023, e06525. [Google Scholar] [CrossRef]
  6. Zhou, L.; Thakur, M.P.; Jia, Z.; Hong, Y.; Yang, W.; An, S.; Zhou, X. Light Effects on Seedling Growth in Simulated Forest Canopy Gaps Vary across Species from Different Successional Stages. Front. For. Glob. Chang. 2023, 5, 1088291. [Google Scholar] [CrossRef]
  7. Sylvester, O.; Avalos, G. Influence of Light Conditions on the Allometry and Growth of the Understory Palm Geonoma undata Subsp. Edulis (Arecaceae) of Neotropical Cloud Forests. Am. J. Bot. 2013, 100, 2357–2363. [Google Scholar] [CrossRef]
  8. Westerband, A.C.; Horvitz, C.C. Interactions between Plant Size and Canopy Openness Influence Vital Rates and Life-History Tradeoffs in Two Neotropical Understory Herbs. Am. J. Bot. 2015, 102, 1290–1299. [Google Scholar] [CrossRef]
  9. Caselli, M.; Urretavizcaya, M.F.; Loguercio, G.Á.; Contardi, L.; Gianolini, S.; Defossé, G.E. Effects of Canopy Cover and Neighboring Vegetation on the Early Development of Planted Austrocedrus chilensis and Nothofagus dombeyi in North Patagonian Degraded Forests. For. Ecol. Manag. 2021, 479, 118543. [Google Scholar] [CrossRef]
  10. Xi, W.; Peet, R.K.; Lee, M.T.; Urban, D.L. Hurricane Disturbances, Tree Diversity, and Succession in North Carolina Piedmont Forests, USA. J. For. Res. 2019, 30, 219–231. [Google Scholar] [CrossRef]
  11. Wright, J.S. Plant Diversity in Tropical Forests: A Review of Mechanisms of Species Coexistence. Oecologia 2002, 130, 1–14. [Google Scholar] [CrossRef]
  12. Kneeshaw, D.D.; Bergeron, Y. Canopy Gap Characteristics and Tree Replacement in the Southeastern Boreal Forest. Ecology 1998, 79, 783–794. [Google Scholar] [CrossRef]
  13. Grubb, P.J. The Maintenance of Species-Richness in Plant Communities: The Importance of the Regeneration Niche. Biol. Rev. 1977, 52, 107–145. [Google Scholar] [CrossRef]
  14. Hu, J.; Herbohn, J.; Chazdon, R.L.; Baynes, J.; Wills, J.; Meadows, J.; Sohel, M.d.S.I. Recovery of Species Composition over 46 years in a Logged Australian Tropical Forest Following Different Intensity Silvicultural Treatments. For. Ecol. Manag. 2018, 409, 660–666. [Google Scholar] [CrossRef]
  15. Fu, L.K.; Jin, J.M. China Plant Red Data Book—Rare and Endangered Plants 1; Science Press: Beijing, China, 1992. [Google Scholar]
  16. Christian, E.T.; Yang, Y. IUCN Red List of Threatened Species: Pseudolarix amabilis; International Union for Conservation of Nature (IUCN): Cambridge, UK, 2010. [Google Scholar]
  17. Wang, G.; Gen, Q.; Xiao, M.; Zhang, M.; Zhang, Y.; Wang, Z. Predicting Pseudolarix Amabilis Potential Habitat Based on Four Niche Models. Acta Ecol. Sin. 2020, 40, 6096–6104. [Google Scholar] [CrossRef]
  18. Zhou, L.; Huang, L.; Jin, C.; Hu, S.; Long, Y.; Qian, S.; Shang, K.; Song, K.; Song, Y.-B.; Lin, D.; et al. Fengshui Forests as a Conservation Paradigm of the Golden Larch in China. For. Ecol. Manag. 2022, 520, 120358. [Google Scholar] [CrossRef]
  19. Xie, C.P.; Liu, D.W.; Huang, C.Y.; He, J. Study on the Intraspecific and Interspecific Competition of Pseudolarix amabilis in Changxing County, Zhejiang Province. Pol. J. Environ. Stud. 2021, 30, 3317–3345. [Google Scholar] [CrossRef] [PubMed]
  20. Freschet, G.T.; Violle, C.; Bourget, M.Y.; Scherer-Lorenzen, M.; Fort, F. Allocation, Morphology, Physiology, Architecture: The Multiple Facets of Plant above- and below-Ground Responses to Resource Stress. New Phytol. 2018, 219, 1338–1352. [Google Scholar] [CrossRef]
  21. Wang, B. Seed Density Affects Post-Dispersal Seed Predation: Evidence from a Seed Removal Experiment of 62 Species. Integr. Zool. 2020, 15, 135–143. [Google Scholar] [CrossRef]
  22. Zhang, H.; Yan, C.; Wu, S.; Si, J.; Yi, X.; Li, H.; Zhang, Z. Effects of Masting on Seedling Establishment of a Rodent-Dispersed Tree Species in a Warm-Temperate Region, Northern China. Integr. Zool. 2021, 16, 97–108. [Google Scholar] [CrossRef]
  23. Palow, D.T.; Oberbauer, S.F. Soil Type Affects Seedling Shade Response at Low Light for Two Inga Species from Costa Rica. Plant Soil 2009, 319, 25–35. [Google Scholar] [CrossRef]
  24. Felsmann, K.; Baudis, M.; Kayler, Z.E.; Puhlmann, H.; Ulrich, A.; Gessler, A. Responses of the Structure and Function of the Understory Plant Communities to Precipitation Reduction across Forest Ecosystems in Germany. Ann. For. Sci. 2018, 75, 3. [Google Scholar] [CrossRef]
  25. Zhang, J.; Wang, X. Effects of Shading on Physiological Characteristics of Pseudolarix kaempferi Seedlings. North. Hortic. 2012, 2012, 81–84. [Google Scholar]
  26. Xie, X.-F.; Hu, Y.-K.; Pan, X.; Liu, F.-H.; Song, Y.-B.; Dong, M. Biomass Allocation of Stoloniferous and Rhizomatous Plant in Response to Resource Availability: A Phylogenetic Meta-Analysis. Front. Plant Sci. 2016, 7, 186064. [Google Scholar] [CrossRef] [PubMed]
  27. Qian, H.; Zhang, J.; Song, J.; Zhang, T.; Yan, J.; Shi, J. Effects of transplant measurements on growth of seedlings Pseudolarix amabilis (Nelson) Rehd. J. For. Eng. 2005, 19, 58–60. [Google Scholar] [CrossRef]
  28. Jani, A.D.; Meadows, T.D.; Eckman, M.A.; Ferrarezi, R.S. Automated Ebb-and-Flow Subirrigation Conserves Water and Enhances Citrus Liner Growth Compared to Capillary Mat and Overhead Irrigation Methods. Agric. Water Manag. 2021, 246, 106711. [Google Scholar] [CrossRef]
  29. Chen, D.; Li, J.; Lan, Z.; Hu, S.; Bai, Y. Soil Acidification Exerts a Greater Control on Soil Respiration than Soil Nitrogen Availability in Grasslands Subjected to Long-Term Nitrogen Enrichment. Funct. Ecol. 2016, 30, 658–669. [Google Scholar] [CrossRef]
  30. Guo, J.H.; Liu, X.J.; Zhang, Y.; Shen, J.L.; Han, W.X.; Zhang, W.F.; Christie, P.; Goulding, K.W.T.; Vitousek, P.M.; Zhang, F.S. Significant Acidification in Major Chinese Croplands. Science 2010, 327, 1008–1010. [Google Scholar] [CrossRef]
  31. Li, J.; Huang, Y.; Xu, F.; Wu, L.; Chen, D.; Bai, Y. Responses of Growing-Season Soil Respiration to Water and Nitrogen Addition as Affected by Grazing Intensity. Funct. Ecol. 2018, 32, 1890–1901. [Google Scholar] [CrossRef]
  32. Fang, X.; Zhang, X.; Chen, F.; Zong, Y.; Bu, W.; Wan, S.; Luo, Y.; Wang, H. Phosphorus Addition Alters the Response of Soil Organic Carbon Decomposition to Nitrogen Deposition in a Subtropical Forest. Soil Biol. Biochem. 2019, 133, 119–128. [Google Scholar] [CrossRef]
  33. Marinari, S.; Masciandaro, G.; Ceccanti, B.; Grego, S. Influence of Organic and Mineral Fertilisers on Soil Biological and Physical Properties. Bioresour. Technol. 2000, 72, 9–17. [Google Scholar] [CrossRef]
  34. Lal, B.; Sharma, S.C.; Meena, R.L.; Sarkar, S.; Sahoo, A.; Balai, R.C.; Gautam, P.; Meena, B.P. Utilization of Byproducts of Sheep Farming as Organic Fertilizer for Improving Soil Health and Productivity of Barley Forage. J. Environ. Manag. 2020, 269, 110765. [Google Scholar] [CrossRef] [PubMed]
  35. Zhou, T.; Chen, L.; Wang, W.; Xu, Y.; Zhang, W.; Zhang, H.; Liu, L.; Wang, Z.; Gu, J.; Yang, J. Effects of Application of Rapeseed Cake as Organic Fertilizer on Rice Quality at High Yield Level. J. Sci. Food Agric. 2022, 102, 1832–1841. [Google Scholar] [CrossRef] [PubMed]
  36. Parniske, M. Arbuscular Mycorrhiza: The Mother of Plant Root Endosymbioses. Nat. Rev. Microbiol. 2008, 6, 763–775. [Google Scholar] [CrossRef] [PubMed]
  37. Bonfante, P.; Genre, A. Mechanisms Underlying Beneficial Plant–Fungus Interactions in Mycorrhizal Symbiosis. Nat. Commun. 2010, 1, 48. [Google Scholar] [CrossRef] [PubMed]
  38. van Der Heijden, M.G.; Francis, M.M.; Marc-André, S.; Ian, R.S. Mycorrhizal Ecology and Evolution: The Past, the Present, and the Future. New Phytol. 2015, 205, 1406–1423. [Google Scholar] [CrossRef] [PubMed]
  39. Koide, R.T. Nutrient Supply, Nutrient Demand and Plant Response to Mycorrhizal Infection. New Phytol. 1991, 117, 365–386. [Google Scholar] [CrossRef]
  40. Chen, F.-S.; Niklas, K.J.; Liu, Y.; Fang, X.-M.; Wan, S.-Z.; Wang, H. Nitrogen and Phosphorus Additions Alter Nutrient Dynamics but Not Resorption Efficiencies of Chinese Fir Leaves and Twigs Differing in Age. Tree Physiol. 2015, 35, 1106–1117. [Google Scholar] [CrossRef] [PubMed]
  41. Bremner, J.M.; Tabatabai, M.A. Use of an Ammonia Electrode for Determination of Ammonium in Kjeldahl Analysis of Soils. Commun. Soil Sci. Plant Anal. 1972, 3, 159–165. [Google Scholar] [CrossRef]
  42. Murphy, J.; Riley, J.P. A Modified Single Solution Method for the Determination of Phosphate in Natural Waters. Anal. Chim. Acta 1962, 27, 31–36. [Google Scholar] [CrossRef]
  43. Sevillano, I.; Short, I.; Grant, J.; O’Reilly, C. Effects of Light Availability on Morphology, Growth and Biomass Allocation of Fagus sylvatica and Quercus robur Seedlings. For. Ecol. Manag. 2016, 374, 11–19. [Google Scholar] [CrossRef]
  44. Zhou, Q.; Feng, Z.; Zhang, H.; Zhu, Z. Responses of the Growth, Photosynthetic Characteristics, Endogenous Hormones and Antioxidant Activity of Carpinus betulus L. Seedlings to Different Light Intensities. Front. Plant Sci. 2022, 13, 1055984. [Google Scholar] [CrossRef]
  45. Sheng, H.; Li, W.; Chang, J. Comparison of Plasticity of Seedling Growth of Two Umbellaceae Species in Response to Light Intensity. Acta Ecol. Sin. 2006, 26, 1854–1861. [Google Scholar] [CrossRef]
  46. Deng, X.; Shi, Z.; Xiao, F.; Zeng, L.; Lei, L. Effects of drought and shading on growth and photosynthetic characteristics of Pinus massoniana seedlings. Acta Ecol. Sin. 2019, 40, 2735–2742. [Google Scholar] [CrossRef]
  47. Feng, Y.; Yan, J.; Guo, Y.; Zhao, Y.; Dong, Y.; Liang, W.; Wei, X.; Bi, H. Effect of thinning intensity on natural regeneration of Larix principis-rupprechtii. Chin. J. Appl. Ecol. 2023, 34, 1169–1177. [Google Scholar] [CrossRef]
  48. Zhou, T.; Wang, L.; Li, S.; Gao, Y.; Du, Y.; Zhao, L.; Liu, W.; Yang, W. Interactions Between Light Intensity and Phosphorus Nutrition Affect the P Uptake Capacity of Maize and Soybean Seedling in a Low Light Intensity Area. Front. Plant Sci. 2019, 10, 183. [Google Scholar] [CrossRef] [PubMed]
  49. Allan Powelson, R.; Lieffers, V.J. Effect of Light and Nutrients on Biomass Allocation in Calamagrostis canadensis. Ecography 1992, 15, 31–36. [Google Scholar] [CrossRef]
  50. Bailey-Serres, J.; Lee, S.C.; Brinton, E. Waterproofing Crops: Effective Flooding Survival Strategies. Plant Physiol. 2012, 160, 1698–1709. [Google Scholar] [CrossRef] [PubMed]
  51. Anderegg, W.R.L.; Kane, J.M.; Anderegg, L.D.L. Consequences of Widespread Tree Mortality Triggered by Drought and Temperature Stress. Nat. Clim. Chang 2013, 3, 30–36. [Google Scholar] [CrossRef]
  52. Ma, Z.; Yin, J.; Yang, Y.; Sun, F.; Yang, Z. Effect of Water and Nitrogen Coupling Regulation on the Growth, Physiology, Yield, and Quality Attributes and Comprehensive Evaluation of Wolfberry (Lycium barbarum L.). Front. Plant Sci. 2023, 14, 1130109. [Google Scholar] [CrossRef]
  53. Minami, A.; Yano, K.; Gamuyao, R.; Nagai, K.; Kuroha, T.; Ayano, M.; Nakamori, M.; Koike, M.; Kondo, Y.; Niimi, Y.; et al. Time-Course Transcriptomics Analysis Reveals Key Responses of Submerged Deepwater Rice to Flooding. Plant Physiol. 2018, 176, 3081–3102. [Google Scholar] [CrossRef] [PubMed]
  54. Johnson, C.R.; Joiner, J.N.; Crews, C.E. Effects of N, K, and Mg on Growth and Leaf Nutrient Composition of Three Container Grown Woody Ornamentals Inoculated with Mycorrhizae. J. Am. Soc. Hortic. Sci. 1980, 105, 286–288. [Google Scholar] [CrossRef]
  55. Yahaya, S.M.; Mahmud, A.A.; Abdullahi, M.; Haruna, A. Recent Advances in the Chemistry of Nitrogen, Phosphorus and Potassium as Fertilizers in Soil: A Review. Pedosphere 2023, 33, 385–406. [Google Scholar] [CrossRef]
  56. Li, W.; Wu, W.; Zhang, Z.; Lu, Z. Introduction Assessment of Pseudolarix amabilis and Psedotsuga menziesii in the Loess Hilly Region of Shaanxi. J. Northwest For. Univ. 2006, 21, 94–96. [Google Scholar]
Figure 1. The responses of P. amabilis to various environmental factors were investigated. These factors comprised photosynthetic photon flux density (PPFD) (A), soil temperature (B), soil water content (C), and soil total potassium (D) under different light intensities. Additionally, responses to soil temperature (E), soil water content (F), and soil pH (G) were examined under various water addition treatments. Furthermore, the response to soil pH (H) was analyzed concerning rhizosphere soil type, and evaluations were made on responses to soil temperature (I), soil water content (J), soil pH (K), and soil total potassium (L) under different groundwater levels. Lastly, responses to soil total nitrogen (M), soil total phosphorus (N), soil total potassium (O), and soil pH (P) were investigated in relation to fertilizer type. Significant differences among treatment levels were denoted by different letters above the columns (one-way ANOVA, p < 0.05).
Forests 15 00684 g001
Figure 2. The responses of P. amabilis to various environmental factors were investigated in this study. These factors encompassed changes in light intensity, water addition, groundwater level, fertilizer type, and rhizosphere soil type. Specifically, the study examined the responses of root biomass (A,F,K,P,U), total biomass (B,G,L,Q,V), specific leaf area (C,H,M,R,W), leaf-stem ratio (D,I,N,S,X), and root–shoot ratio (E,J,O,T,Y). The bars represent the means (+SE) of ten replicate plots, and significant differences among the levels of each treatment are indicated by different letters above the columns (one-way ANOVA, p < 0.05).
Forests 15 00684 g002
Figure 3. Structural equation model (SEM) demonstrating the pathways of changes in light intensity, water addition, groundwater level, fertilizer type, and rhizosphere soil type affecting the physicochemical properties (LI, light intensity; ST, soil temperature; SWC, soil water content; pH, soil pH; STK, soil total potassium), morphology indexes (H, height; NH, net height increment; GD, ground diameter; LC, leaf count), and biomass (SB, stem biomass; LB, leaf biomass; RB, root biomass) residues of P. amabilis seedlings. Square boxes indicate variables included in the model. The direct and indirect associations of factors with the TB (total biomass) are shown. Results of model fitting: R2 = 0.55, p = 0.58, χ2/df = 0.92, Bootstrap p = 0.80, RMSEA = 0.08, n = 50 (a high Bootstrap p-value associated with an χ2 test and RMSEA ≤ 0.08 indicates a good fit of the model to the data, with no significant difference). The width of the arrows is proportional to the potential causal effects between variables, and standardized path coefficients are indicated by the numbers adjacent to each box. Paths with significant positive effects (p < 0.05) are depicted as black solid lines, and significant negative effects (p < 0.05) are shown as black dotted lines, while insignificant paths are omitted. The r2 values (in red) associated with response variables indicate the proportion of variation explained by relationships with other variables. The standardized path coefficients are represented by values associated with solid arrows.
Forests 15 00684 g003
Figure 4. Partitioning of the standardized total effects of light intensity (A), water addition (B), groundwater level (C), fertilizer type (D), and rhizosphere soil type (E) on total biomass of P. amabilis seedlings via photosynthetic photon flux density (PPFD), soil temperature, soil water content, soil total potassium, soil pH, aboveground biomass (including leaf count, leaf biomass, ground diameter, net height increment, height, stem biomass), and, root biomass. Total biomass is the standardized total effect of treatment. The values for standardized effects were derived from the SEM analysis in Figure 3.
Forests 15 00684 g004
Table 1. L25(56) orthogonal factors and level assignments.
Treatment LevelWater Addition
(A, mm)
Groundwater Level
(B, cm)
Rhizosphere Soil Type (C)Fertilizer Type (D)Light Intensity (E, %)
18000Control (sterilized river sand)Control (sterilized river sand)100% natural light
212007Pseudolarix armandii rhizosphere soilWell-rotted cow manure75% natural light
3160014Pinus massoniana rhizosphere soilWell-rotted rapeseed cake28% natural light
4200021Cinnamomum camphora rhizosphere soilCompound fertilizer15% natural light
5240028Mixed forest rhizosphere soilUrea8.5% natural light
Table 2. Orthogonal test of the treatment of each pot.
OrderABCDEVacant ColumnTreatment
1111111A1B1C1D1E1
2232314A2B3C2D3E1
3353512A3B5C3D5E1
4424215A4B2C4D2E1
5545413A5B4C5D4E1
6122523A1B2C2D5E2
7243221A2B4C3D2E2
8314424A3B1C4D4E2
9435122A4B3C5D1E2
10551325A5B5C1D3E2
11133435A1B3C3D4E3
12254133A2B5C4D1E3
13325331A3B2C5D3E3
14441534A4B4C1D5E3
15512232A5B1C2D2E3
16144342A1B4C4D3E4
17215545A2B1C5D5E4
18331243A3B3C1D2E4
19452441A4B5C2D4E4
20523144A5B2C3D1E4
21155254A1B5C5D2E5
22221452A2B2C1D4E5
23342155A3B4C2D1E5
24413353A4B1C3D3E5
25534551A5B3C4D5E5
Note: The assignments in this table are derived from Table 1, and the different numbers represent different levels of processing for the same factor.
Table 3. ANOVA of the effects of changes in light intensity, water addition, groundwater level, fertilization type, and rhizosphere soil type on the growth of P. amabilis seedlings.
IndexesF-Value/Treatments
Light Intensity
(%)
Water Addition
(mm)
Groundwater Level (cm)Fertilizer TypeRhizosphere Soil Type
Physical and chemical indexes
PPFD323.69 *** 1.14 ns3.50 **2.92 *2.00 ns
Soil temperature23.46 ***4.65 **23.01 ***0.73 ns5.19 **
Soil water content 3.98 *4.59 **409.21 ***0.95 ns8.22 **
Soil pH value6.72 ***6.19 **28.94 ***65.92 ***6.05 **
Soil total nitrogen 0.58 ns5.23 **25.95 ***117.05 ***11.70 ***
Soil total phosphorus 4.23 **3.19 *26.23 ***48.98 ***12.63 ***
Soil total potassium 7.71 ***3.14 *16.86 ***45.32 ***10.34 ***
Soil NO3-N5.33 **0.86 ns18.53 ***32.14 ***5.58 **
Soil NH4+-N1.74 ns0.58 ns1.53 ns0.37 ns0.31 ns
Morphology indexes
Ground diameter (GD) 30.84 *** 1.04 ns3.38 *1.22 ns3.06 *
Height (H)4.65 **2.90 *1.46 ns1.31 ns2.80 *
Net height increment (NH) 2.92 *3.35 *1.38 ns1.45 ns0.72 ns
Leaf count (LC)4.42 **5.82 **1.98 ns4.64 **4.00 *
Biomass indexes
Root biomass (RB)25.33 *** 2.15 11.02 ***6.95 ***5.90 **
Stem biomass (SB)22.24 ***3.66 *1.156 ns1.11 ns1.64 ns
Leaf biomass (LB)4.05 *2.93 *1.53 ns3.05 *3.22 *
Root–shoot ratio21.84 ***3.97 *16.16 ***9.52 ***18.17 ***
Total biomass (TB)22.59 ***2.41 *8.08 **5.61 **4.48 **
Note: Numbers are the F-values. Stars indicate the level of significance (ns p > 0.1,  p < 0.1, * p < 0.05, ** p < 0.01, *** p < 0.001).
Table 4. Responses of the aboveground variables of P. amabilis to light intensity, water addition, groundwater level, fertilization type, and rhizosphere soil type.
Response
Variable
Level
of Treatment
Aboveground Variables of P. amabilis
Ground Diameter (GD, mm)Height
(H, cm)
Net Height Increment (NH, cm)Stem Biomass (SB, g)Leaf Count
(LC)
Leaf Biomass (LB, g)
Light intensity
(%)
8.51.7 ± 0.1 c17.2 ± 0.3 c7.7 ± 0.4 b0.2 ± 0.0 c110.6 ± 10.6 b0.4 ± 0 b
151.8 ± 0.1 c16.8 ± 0.4 c8.1 ± 0.8 b0.3 ± 0.0 c97.7 ± 8.4 b0.4 ± 0 b
282.4 ± 0.1 b19.8 ± 0.5 ab9 ± 0.7 ab0.6 ± 0.0 b145.7 ± 14.1 a0.6 ± 0.1 a
752.3 ± 0.1 b17.6 ± 0.7 bc9.6 ± 1.3 ab0.5 ± 0.1 b110 ± 12.5 b0.4 ± 0.1 b
100 (control)2.8 ± 0.1 a20.8 ± 0.6 a10.7 ± 0.8 a0.9 ± 0.1 a156.7 ± 25.1 a0.6 ± 0.1 a
Water addition
(mm)
8002.3 ± 0.2 a19.9 ± 0.8 a9.7 ± 0.7 a0.5 ± 0.1 b95.8 ± 13.1 c0.4 ± 0.1 c
12002.2 ± 0.2 a17.7 ± 1.5 ab8.7 ± 1.2 ab0.6 ± 0.1 a158.7 ± 26.1 a0.6 ± 0.1 a
16002.2 ± 0.1 a19.5 ± 0.7 a10.6 ± 0.8 a0.5 ± 0.1 ab120.8 ± 11.7 bc0.5 ± 0.1 abc
20002.1 ± 0.2 a18.3 ± 1.2 ab9.1 ± 0.7 ab0.5 ± 0.1 ab140.2 ± 7.1 ab0.5 ± 0.1 ab
24002.2 ± 0.1 a16.7 ± 0.6 b7.1 ± 0.5 b0.4 ± 0.0 b105.1 ± 11.1 c0.4 ± 0.1 bc
Groundwater level
(cm)
0 (control)2.3 ± 0.2 a19.4 ± 1.1 a9.9 ± 1.1 a0.5 ± 0.1 a136.3 ± 12.9 a0.6 ± 0.1 a
72.4 ± 0.1 a19.7 ± 1.1 a9.9 ± 1.0 a0.6 ± 0.1 a129.7 ± 13.0 a0.5 ± 0.1 a
142.3 ± 0.2 a18.1 ± 1.1 a9.2 ± 0.9 a0.6 ± 0.1 a135.1 ± 26.9 a0.5 ± 0.1 a
212.1 ± 0.1 ab17.9 ± 1.2 a8.3 ± 0.6 a0.5 ± 0.1 a105.4 ± 9.7 a0.4 ± 0.0 a
282 ± 0.2 b17.1 ± 0.7 a7.8 ± 0.7 a0.4 ± 0.1 a114.2 ± 15.0 a0.4 ± 0.1 a
Fertilizer typeRiver sand (control)2.3 ± 0.2 a18.2 ± 0.9 a8.1 ± 0.5 a0.5 ± 0.1 a141.9 ± 11.8 a0.5 ± 0.0 a
Urea2.1 ± 0.1 a19.3 ± 1.2 a10.2 ± 1.0 a0.4 ± 0.1 a83.8 ± 9.7 b0.3 ± 0.1 b
Compound fertilizer 2.2 ± 0.2 a18.5 ± 0.8 a9.3 ± 1.0 a0.4 ± 0.1 a122.5 ± 12.8 ab0.5 ± 0.1 ab
Cow manure2.2 ± 0.2 a17.0 ± 1.3 a8.3 ± 0.7 a0.5 ± 0.1 a128.1 ± 13.0 a0.5 ± 0.1 a
Rapeseed cake2.3 ± 0.2 a19.3 ± 1.0 a9.3 ± 1.0 a0.6 ± 0.1 a144.4 ± 25.2 a0.6 ± 0.1 a
Rhizosphere soil typeRiver sand (control)2.4 ± 0.2 a19.0 ± 1.0 a8.6 ± 0.7 a0.5 ± 0.1 ab126.3 ± 8.8 ab0.5 ± 0.0 ab
P. massoniana2.0 ± 0.1 b16.8 ± 1.0 b8.1 ± 0.7 a0.5 ± 0.0 ab104.3 ± 11.9 b0.4 ± 0.1 b
C. camphora2.2 ± 0.2 ab19.1 ± 1.1 ab9.4 ± 1.1 a0.5 ± 0.1 ab135.5 ± 18.5 ab0.6 ± 0.1 a
Mixed forest2.2 ± 0.2 ab17.5 ± 1.0 ab9.1 ± 0.7 a0.4 ± 0.1 b104.5 ± 10.1 b0.4 ± 0.0 b
P. armandii2.2 ± 0.2 ab19.7 ± 1.1 ab9.9 ± 1.1 a0.6 ± 0.1 a150.0 ± 24.9 a0.6 ± 0.1 a
Note: All values represent the means ± standard error (n = 10) of five replicate plots for each light intensity level, water addition level, groundwater level, fertilization type, and rhizosphere soil type. Different letters indicate significant differences among the levels of the five treatments (one-way ANOVA, p < 0.05). The aboveground variables of P. amabilis include the ground diameter (GD), height (H), net height increment (NH), stem biomass (SB), leaf count (LC), and leaf biomass (LB).
Disclaimer/Publisher’s Note: The statements, opinions and data contained in all publications are solely those of the individual author(s) and contributor(s) and not of MDPI and/or the editor(s). MDPI and/or the editor(s) disclaim responsibility for any injury to people or property resulting from any ideas, methods, instructions or products referred to in the content.

