Article

Cutting with Circular Saw of Traversal-Structured Panels Obtained from Spruce (Picea abies L.) Branches

Wood Processing and Design Wooden Product Department, Transilvania University of Brasov, 500036 Brasov, Romania
*
Author to whom correspondence should be addressed.
Forests 2024, 15(4), 685; https://doi.org/10.3390/f15040685
Submission received: 14 February 2024 / Revised: 29 March 2024 / Accepted: 8 April 2024 / Published: 10 April 2024
(This article belongs to the Special Issue Engineered Wood Products: From the Latest Perspective)

Abstract

:
Finding new wood resources is a permanent challenge nowadays, especially due to the fact that there is a crisis of these resources through the continuous degradation of forest areas that can be exploited. In this general context, the use of spruce (Picea abies L.) branches to create panels with a transverse texture becomes the main purpose of this research. Going beyond the current stage of research in the field, this research highlights the particularities of cutting panels with a transverse texture made from spruce branches, especially due to the cutting direction compared to the wood grain. In addition to the activities of collecting and sorting the branches, processing and joining, in order to obtain dimensionally stable panels, the workability of these panels with a transverse texture represents a new challenge in this field. The work methodology was based on the effective measurement of the cutting and advance power during cutting with a circular blade. The obtained results referred to the comparison of 10 working regimes from the point of view of the electrical power consumed, according to the two main parameters taken into account, which are the rotational speed of the circular blade and the advance speed. The final conclusion of the work highlighted the fact that the processing of panels with a transverse structure requires specific work regimes, namely an optimal regime of electric consumption of 2.2 kW, at a cutting speed of 79.2 m/s and an advance speed of 3.7 m/min.

1. Introduction

The branches of different trees, whether from the forest or from orchards, have been used over time for different household activities as the simplest form of use. In this sense, in addition to the classic use as firewood [1,2], these branches were used for fences and other types of enclosures, small shelters for birds and domestic animals, classic floors and subfloors, roofing felt, etc. [3,4,5]. A more efficient use of branches is that in the industry of agglomerated composite boards such as boards made of wood chips, as raw material, from which chips superior in quality to other types of lignocellulosic resources are obtained [4,6,7,8,9]. That is why branches are considered a basic raw material in the chipboard, wood paper and fiber industry, with timber [10,11] having the percentage of participation in a raw material recipe/consumption of over 50%.
The physical–mechanical properties of the wood from the spruce (Picea abies L.) branches are similar to the wood from the trunk [12,13,14], with the exception of the fact that they contain a lot of compression and tension wood [15,16,17]. However, some chemical differences [18,19,20] have been sporadically reported [21,22,23]. Based on international standards [24,25], many branch properties [26,27] and its qualities were determined [28,29]. The compression wood from the spruce branches is less homogeneous, has areas with different densities within it and swells and contracts differently [30,31,32]. That is why, when forming the prisms from the spruce branches, it is recommended to use the prism with compression wood on the same panel [8,9], in order to obtain stable panel structures. The panel structures made of branches can have sides with the longitudinal texture of the wood, or with the highlighting of the transverse texture of the wood [9]. Despite the fact that the transverse structures are less stable and subject to multiple cracks, they present a pleasant appearance, and the highlighting of the cracks sometimes considerably increases the aesthetic appearance of the panel [9,33].
From a microscopic point of view, the diameter of the cell, the thickness of the cell wall and the diameter of the lumen of the axial tracheid of Scots pine [8] are much smaller in the branches than in the trunk. Also, the density and other chemical and mechanical characteristics of pine are different from those of spruce, which make pine much more difficult to be processed than spruce. Contrary to the data from the specialized literature [18,19], the number of vessels per surface unit is about 25% higher than those in the trunk. Regarding the volume of medullary rays that exist in the branches, it was found that they do not differ significantly compared to the trunk area, even if there is a slight tendency to increase. From a macroscopic point of view, a slight increase of about 10% in the density of the branches compared to that of the trunk was found, especially due to the compression wood [12] with a higher percentage of late wood [9]. Although the branches are considered woody remains [33], they are ecological [34,35,36], and the procedures for processing and using them belong to eco-design procedures [36,37,38].
During the processing of softwood branches, in order to create panels with a transverse texture, a number of disturbing factors must be taken into account, such as the use of prisms with the same dimensions within a panel [9], the prisms should not have longitudinal faces with the heart on them and to use strong adhesives for gluing the prisms in the panel (to eliminate the possibility of cracks and deformations) [39,40]. Several researchers [40,41,42,43] have studied the machinability of branch wood and panels obtained from wood branches, but no researchers have studied the panels that use the transverse texture of the spruce, even more, the cutting of them with circular discs.
The critical analysis of previous researches in the field showed that there are no studies related to the cutting of panels with the transverse texture of the wood from the spruce branches. This work is the continuation of two other previous papers, which presented the technology and the properties of traversed-texture boards obtained from spruce branches. Therefore, the aim of this work is the cutting of panels with a transverse texture, made from spruce branches, on circular saws. In this sense, the main machinability parameters, specified to this kind of panel, would be the panel cutting parameters (such as the cutting power, advance power, cutting force, specific mechanical work of cutting, etc.), but also the influencing factors of the processing (such as the advance speed and the cutting speed).

2. Materials and Methods

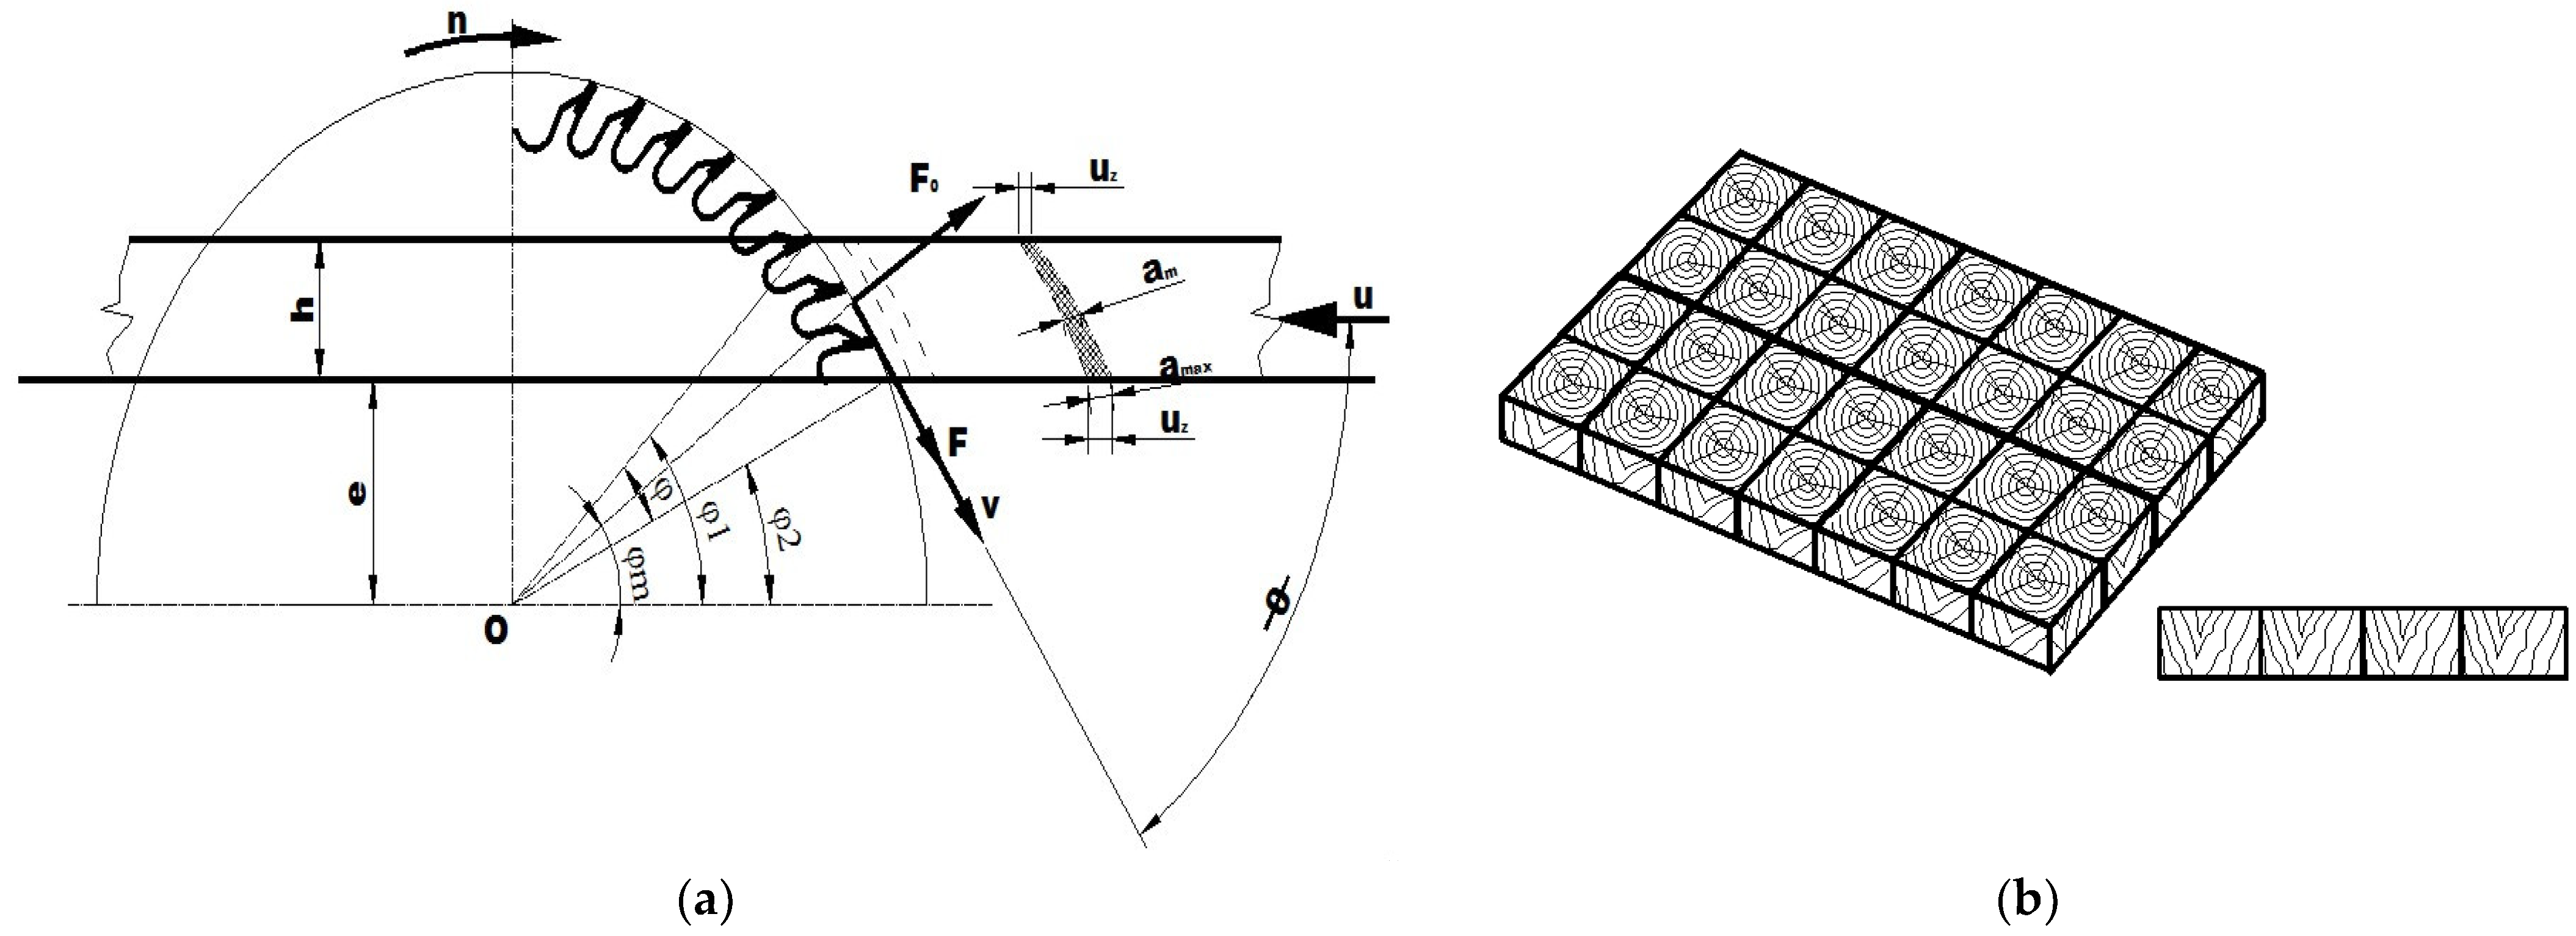
2.1. Theoretical Aspects

The wood chipping process, including cutting panels with a transverse texture, is generally valid for the processing of all wood species, but with some particularities specific to the direction of longitudinal–parallel, longitudinal–perpendicular and transverse processing. When cutting panels with a transverse texture, the longitudinal–perpendicular cut is identified (Figure 1), with a direct influence of the joining areas of the branches. Therefore, cutting panels with a transverse texture obtained from spruce branches is very different from other wood cuts, both by the direction of the cut against the wood grain, but also by the existence of gluing areas in the way of the circular disc.
As can be seen in Figure 1, the main influencing factors of the cutting process for panels with a transverse texture are the cutting speed, denoted by v, and the advance speed, denoted by u. The cutting speed is the peripheral cutting speed of the teeth of the circular blade and is determined according to the diameter of the circular blade and its speed, and the advance speed is the speed of the advance roller and is determined according to the diameter and speed of the roller, as shown in Equation (1)
v = π D n 60 1000 m s ;   u = π D r n r [ m / min ]
where v is the cutting speed, in m/s; D is the diameter of the circular disc, in [mm]; n is the rotation of the circular blade, in rotation/min; u is the advance speed, in m/min, Dr is the roll diameter, in m; and nr is the roll speed, in rot/min.
The advance per tooth is the ratio between the advance at one rotation of the circular blade and its number of teeth, and is determined with the following relationship:
u z = 1000 · u n z [ m m / t o o t h ]
where uz is the advance per tooth, in mm/tooth; u is the advance speed, in m/min; n is the speed or rotation of the circular blade, in rot/min; and z is the number of teeth.
During cutting, the wood panel is in permanent contact with the toothed area of the blade along the length of a circular arc, which corresponds to the contact angle, determined as the difference between the contact angle at the entrance of blade to the panel and the one at the exit from the panel, as shown in Equation (3)
l = π D φ 360 [ m m ] φ = φ 1 φ 2 φ 1 = arcsin e + h R φ 2 = arcsin e R
where l is the length of the circular arc, in mm; D is the diameter of the circular blade, in mm; φ is the contact angle between wood and tooth, in sexagesimal degrees; φ1 is the contact angle at the entrance of the tooth into the wood panel, in °; φ2 is the contact angle at the exit from the wood of the tooth, in sexagesimal degrees; e is the distance from the center of rotation of the blade to the base of the piece, in mm; h is the cutting height, in mm; and R is the radius of the circular blade, in mm.
At the interaction between the cutting edges of the circular blade and the panel that are to be processed, some forces arise due to the penetration of the cutting edges into the wood, the deformation of the detached layer and the wood area from which it detaches, all forces that must overcome the cohesive forces of the panel. Since the complexity of all the processes that take place during cutting makes it difficult to establish all these forces in the calculations, the total cutting force is taken into account, which is necessary to overcome all the resisting forces that oppose the movement of the cutting edges of the tools. This force, called the “cutting force,” is denoted by F (Figure 1), and is different from other cutting types, even more so for cutting panels with a transverse texture. The average contact angle between the teeth of the circular blade corresponding to the point of application of the cutting force is determined similarly to the two previously calculated angles (Equation (3)), and the number of teeth that simultaneously cut the entire height of the panel is calculated according to their pitch as follows:
θ m = arcsin e + h 2 R z s = π D φ 360 p
where θm is the average contact angle between tooth and wood, in sexagesimal degrees; e is the distance from the center of rotation of the blade to the base of the piece, in mm; h is the cutting height, in mm; R is the radius of the circular blade, in mm; D is the diameter of the circular blade, in mm; φ is the contact angle between wood and tooth, in degrees; and p is the tooth pitch, in mm.
The minimum thickness of the chip is the one corresponding to the entry of the tooth into the wood, the maximum thickness of the chip is that of the exit of the tooth from the wood and the average thickness of the chip is given by the average contact angle between the tooth and the wood, the calculation being carried out with the following relationship:
a min = u z cos ϕ 1 [ mm ]     a max = u z cos ϕ 2 [ mm ]     a m = u z cos ϕ m [ mm ]
As a physical quantity, the cutting power is defined as the speed with which the mechanical cutting work is performed. The average power developed by the cutting tool is equal to the total mechanical work carried out by the cutting tool divided by the total time interval. The mechanical work performed by a force on a particle is defined as being equal to the product of the magnitude of the force (F) and the distance that the particle moves (d). Replacing the mechanical work in the cutting power relation, the final expression of the power in the case of cutting panels with a circular blade will be obtained as follows:
P = W t   [ W ]     W = F · d   [ J ]         P = F v [ W ]         P = K V 100 [ k W ] ,     P = F v 100 k W    
where P is the cutting power, in kW; W is the mechanical work carried out by a force on a particle, in [J]; v is the cutting speed, in [m/s]; K is the specific mechanical work of chipping, defined as the mechanical work consumed for chipping a cm3 of material, in [daN·m/cm3]; V is the volume of sawed wood in the unit of time, in [cm3/s]; and F is the chipping force, in [daN].
The volume of wood cut in the unit of time is calculated according to the cutting surface and the advance speed, with the following relationship:
V = b h u 60 [ c m 3 / s ]
where b is the width of the cut, in mm; h is the cutting height, in [mm]; and u is the advance speed, in [m/min].
From Equations (6) and (7) results the expression of the specific mechanical work of cutting, respectively, of the cutting force, depending on the cutting power:
K = P 100 V [ d a N · m / c m 3 ]     K 1 = F b h [ d a N / m m 2 ]     F = P 100 v [ d a N ]
Therefore, according to Equation (8), the specific cutting resistance, K, is defined as the ratio between the cutting force, F, and the specific area of 1 mm2 of the chip section, measured normal to the cutting direction at each point of the cutting edge. It is denoted by K and is measured in [daN·m/mm2].

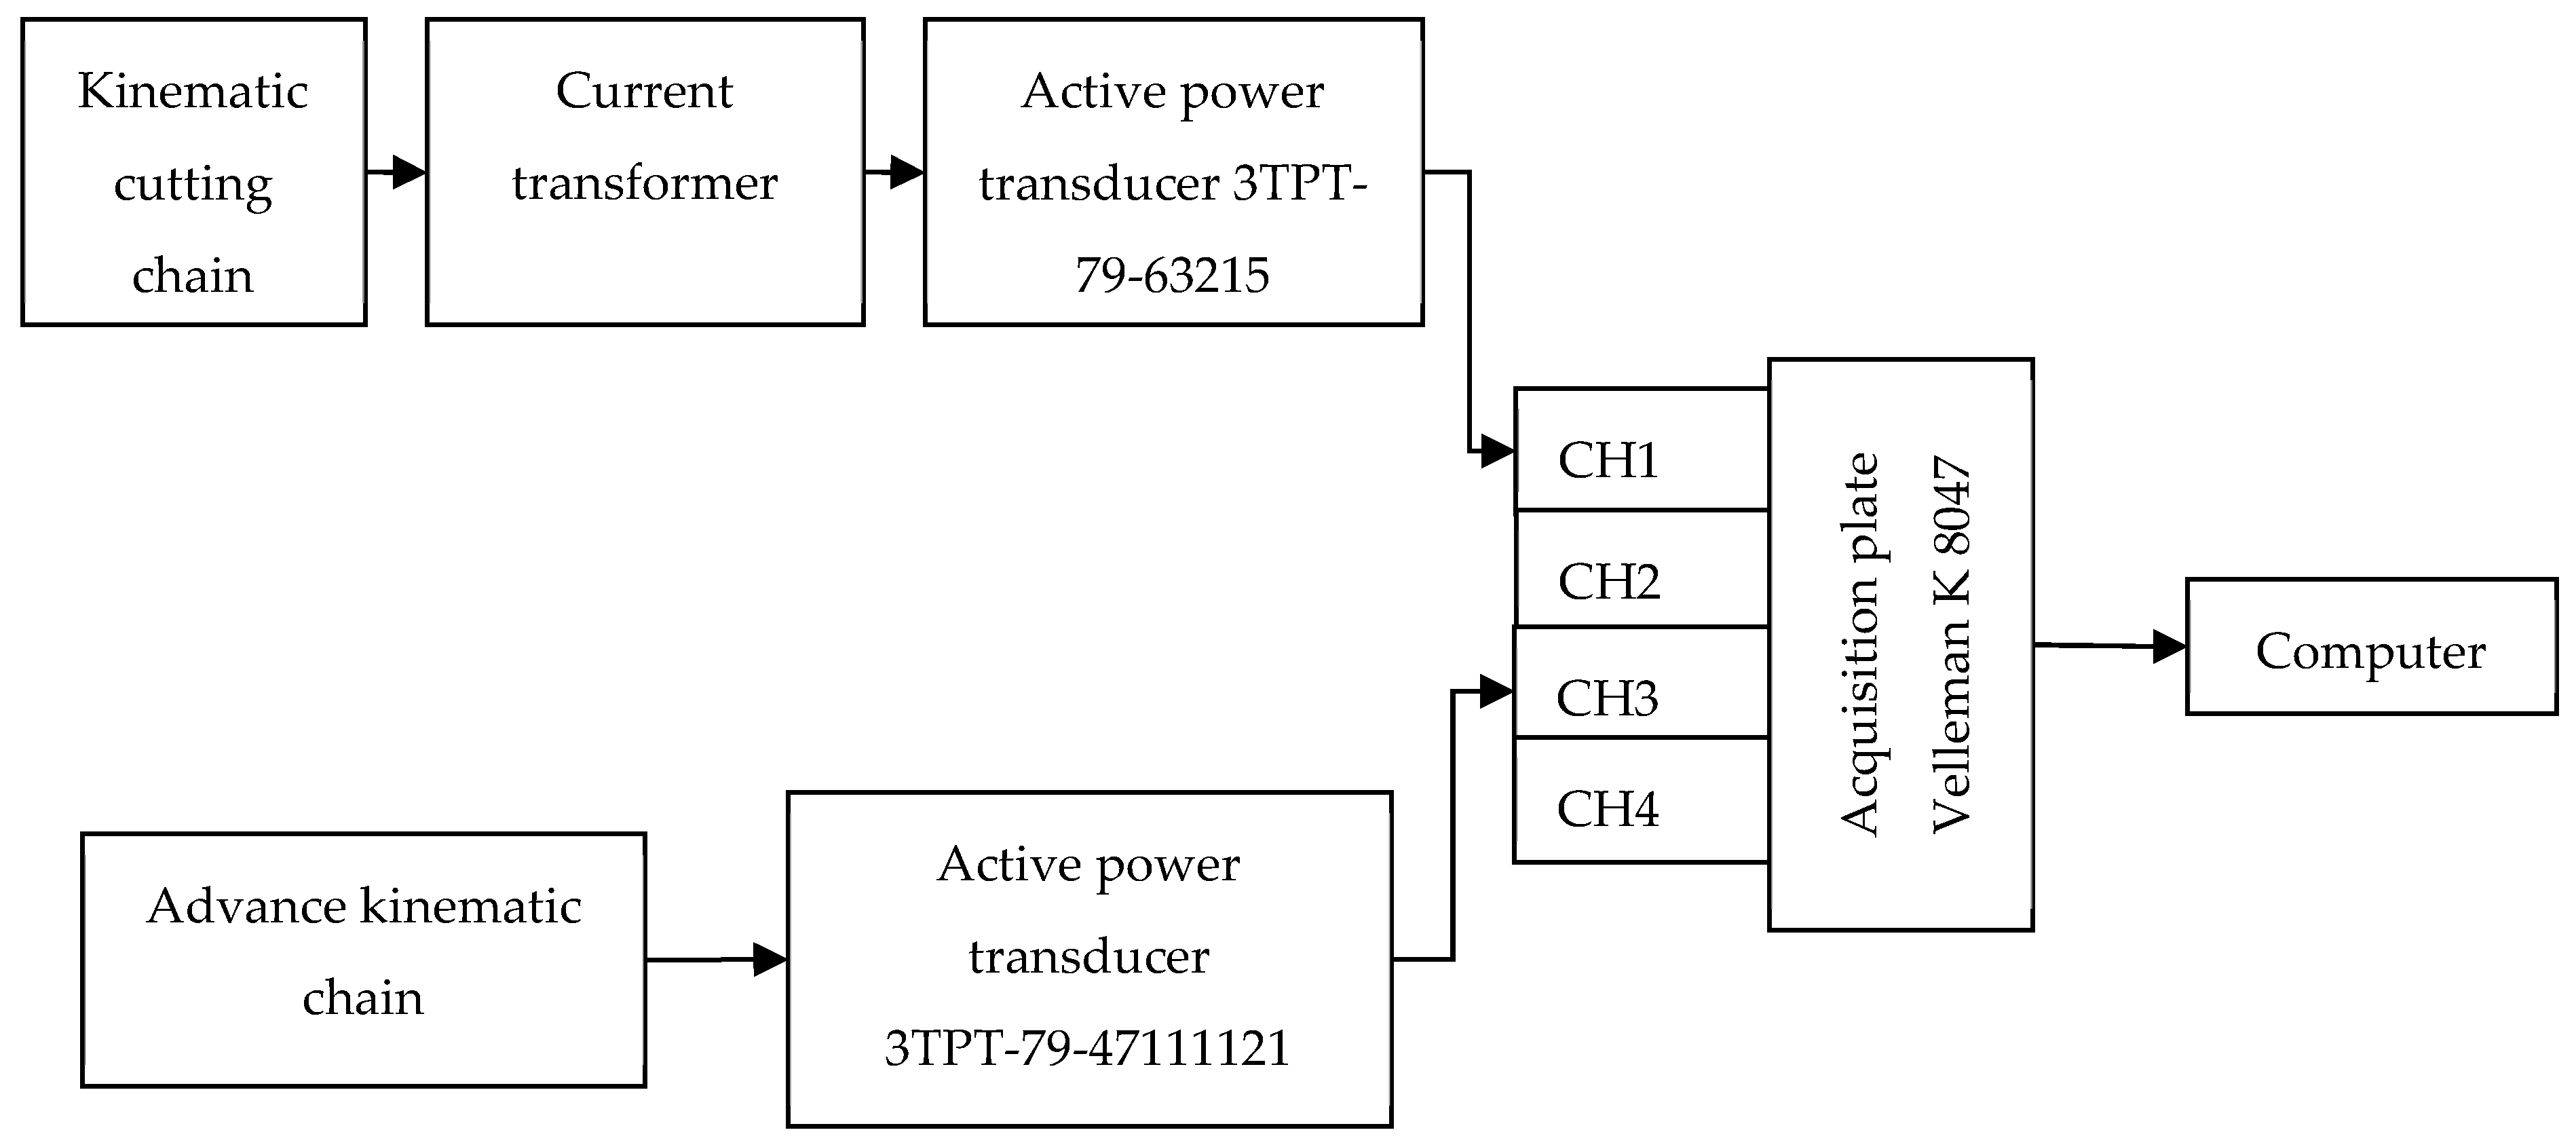
2.2. Measurement Method

The principle of the working method consists in measuring, recording and storing the values of the active power when panels with a transverse texture made of spruce branches are being cut. Also, based on the calculation formulas known from the theory of chipping, the specific mechanical work of cutting, the specific resistance of cutting, and the average cutting force were determined. The recording and storage of the values of the active power when cutting panels with a transverse texture made of spruce branches was achieved by using a system of measurement, recording and storage of experimental data. Such a system is made up of the following components: the signal generator (the component that provides the input quantity to the system), the data measurement and conversion element (represented by a transducer of electrical quantities), the data recording element (that allows data to be recorded in real time and is usually represented by a data acquisition board) and the element of data storage and processing (that allows memorizing the data obtained as a result of the measurement as well as their processing, which is, currently, an electronic computer) (Figure 2).
The actual tests were carried out on the FCT-type circular saw, produced by the Mechanical Enterprise (Roman, Romania), with the following characteristics: supply voltage 380 V; frequency 50 Hz; installed power 4 kW; control voltage 220 V. A Festol circular blade code 488289 brand (Lebanon, Indiana, North America) was mounted on the circular saw with the following characteristics: blade diameter D = 225 mm; bore diameter d = 30 mm; number of teeth, 48; cutting width, b = 2.6 mm; the seating angle α = 15°; the sharpening angle β = 65°; clearance angle γ = 10°; tooth pitch p = 14.76 mm. The distance from the center of rotation of the work shaft to the base of the workpiece, denoted by “e” in the diagram of circular saw cutting (Figure 1) was 76.51 mm.
The measurement of the working shaft speed was made with the Chauvin Arnoux tachometer model CA 27 (Chauvin Arnoux Metrix, Paris, France) with the following characteristics for the measurement: a range between 1000 and 9999.9 rpm and a resolution of 0.6 rpm; an accuracy 10−4 of the read value; a measurement time less than 0.5 s. The measured speed of the working shaft for the two speed steps was n1 = 4216 rpm and n2 = 6722 rpm. A mechanical roller feed device manufactured by Co-Matic, Model AF38 (Co-Matic Machinery, Taychung City, Taiwan), with eight feed speeds and a 380 V supply voltage, was installed on the circular saw.
A three-phase active power transducer with the code 3TPT-79-63215 manufactured by I.A.E.M. (Timisoara, Romania) was used to measure the cutting power. The transducer was electronic and has achieved the conversion of the active power absorbed in the three-phase circuit of the electric motor into a signal with a voltage variation of 0–10 V, which is applied to the input of the analog-to-digital converter (as acquisition board). The technical characteristics of the three-phase active power transducer were as follows: accuracy class 1%; nominal values of input voltages 220/380 V; nominal values of input current 5 A; input range for built-in power factor transducer 0–1; input frequency range 45–55 Hz; output signal 0–10 V, max. 20 mA; and the supply voltage of the transducer 220 V/6 VA.
To measure the active power absorbed by the advance motor, an active power transducer type 3TPT-79-63215 manufactured by I.A.E.M. (Timisoara, Romania) was used. The technical characteristics of the three-phase active power transducer were as follows: accuracy class 1%; nominal values of input voltages Un = 3 × 220/380 V; nominal values of input current In = 5 A; input range for built-in power factor transducer 0–1; input frequency range 45–55 Hz; output signal 0–10 V, max. 20 mA; and the supply voltage of the transducer Un = 220 V/6 VA.
A Velleman K8047 acquisition board was used for data acquisition, with the following hardware characteristics: connection and power via USB; four DC-coupled input channels (load + ground); input resistance 1 MOhm; maximum number of records per second: 100; four input channels: 3 V, 6 V, 15 V, and 30 V; sensitivity 10 mV; accuracy ±3% of the maximum scale; led for power and recording signaling, and also a Software: analog digital data output; four simultaneous recording channels; recording and saving data in the form of a diagram and/or text file; long-term automatic data recording option; time and voltage marker.
Since the output signal was a voltage in the range 0–10 V, it was necessary to measure the active power with a wattmeter and establish a correlation factor between this voltage value and power as follows:
P = V u f c [ k W ]     f c = P V u
where P is the active power (measured with the wattmeter), in [kW]; Vu is the value of the output signal (voltage recorded by the acquisition board), in [V]; and fc is the correlation factor.
The wattmeter produced by Gossen Metrawatt Camille Bauer, model Manowatt 4 (Wohlen, Switzerland) was used to measure the power. The measurements were made for each advance speed (u1–u5) and for each cutting rotation (n1 and n2). For each of these, the idle power was measured after each cutting of each specimen. In Table 1, the values of the correlation factor for the advance speeds and the cutting speeds are shown.

2.3. Statistical Analysis

The statistical processing of the data obtained from the experiments was carried out with the help of Microsoft Excel 2019 software, and the coefficients of the regression equations were checked with the DataFit 9 program (Bioxing, Danville, CA, USA). For each sample, the arithmetic mean and the standard deviation of data were determined (Equation (10)), with the mention that the standard deviation (s) in this form is also used by the Microsoft Excel software, with the STDEV function
x m = 1 n i = 1 n x i   ;   s = n i = 1 n x i 2 i = 1 n x i 2 n ( n 1 )
where xm is the arithmetic mean of the values; n is the number of values taken into account; xi is effective values, respectively, x1, x2,…, xn; and s is the standard deviation of the calculated values.
By calculating the confidence interval of each value, the errors that may appear during the processing process are statistically eliminated. The confidence intervals were 95%; in other words, a value of the parameter can be calculated with an error of 5%. Through this calculation, two values are obtained from the equation contained in the relation (ISO 2602, 1980) [43]: the lower value and the upper value
x m t n s V 5 % q x m + t n s ;   L 5 % q = x m t n s ;   U 5 % q = x m + t n s     t n = t 0.95 n
where xm is the arithmetic mean of the data recorded for each sample; n is the number of recorded data for each sample; xi is individual recorded values, (i = 1, 2, …, n); s is the standard deviation from the average of the recorded data for each sample; V 5 % q is the value corresponding to the 95% confidence interval;   L 5 % q is the lower value of the confidence interval;   U 5 % q is the upper value of the confidence interval; m is the number of samples for each regime; and t0.95 is the value of Student’s t-distribution with n + 1 degrees of freedom, where its value depends on the number of data recorded for each sample and its values are tabulated in ISO 2602: 1980.
From the point of view of the dispersion of the results, it is important that 95% of the resulting values are found in the confidence interval. Since, in most cases, the European norms impose the condition shown by an inequation with minimal value, the lower value of the confidence interval was calculated with the result expressing the size of the measured parameter for the respective specimen
L 5 % q V a d m i s i b i l   X = L 5 % q = x m t n s

3. Results

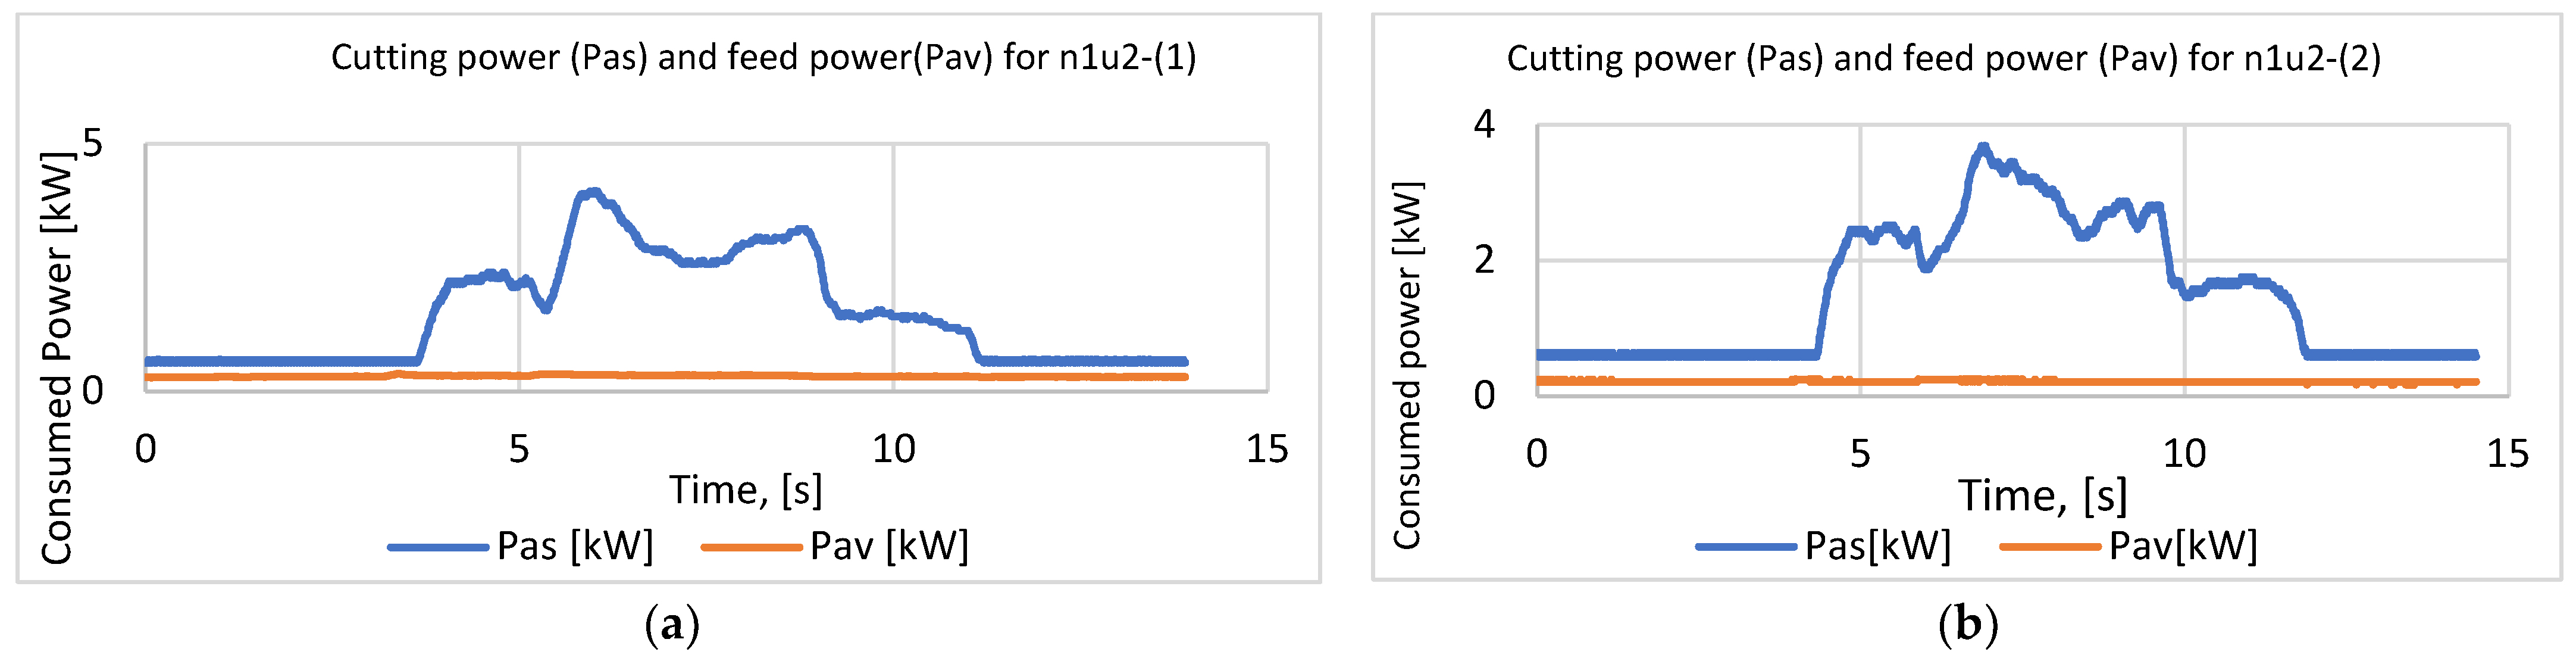
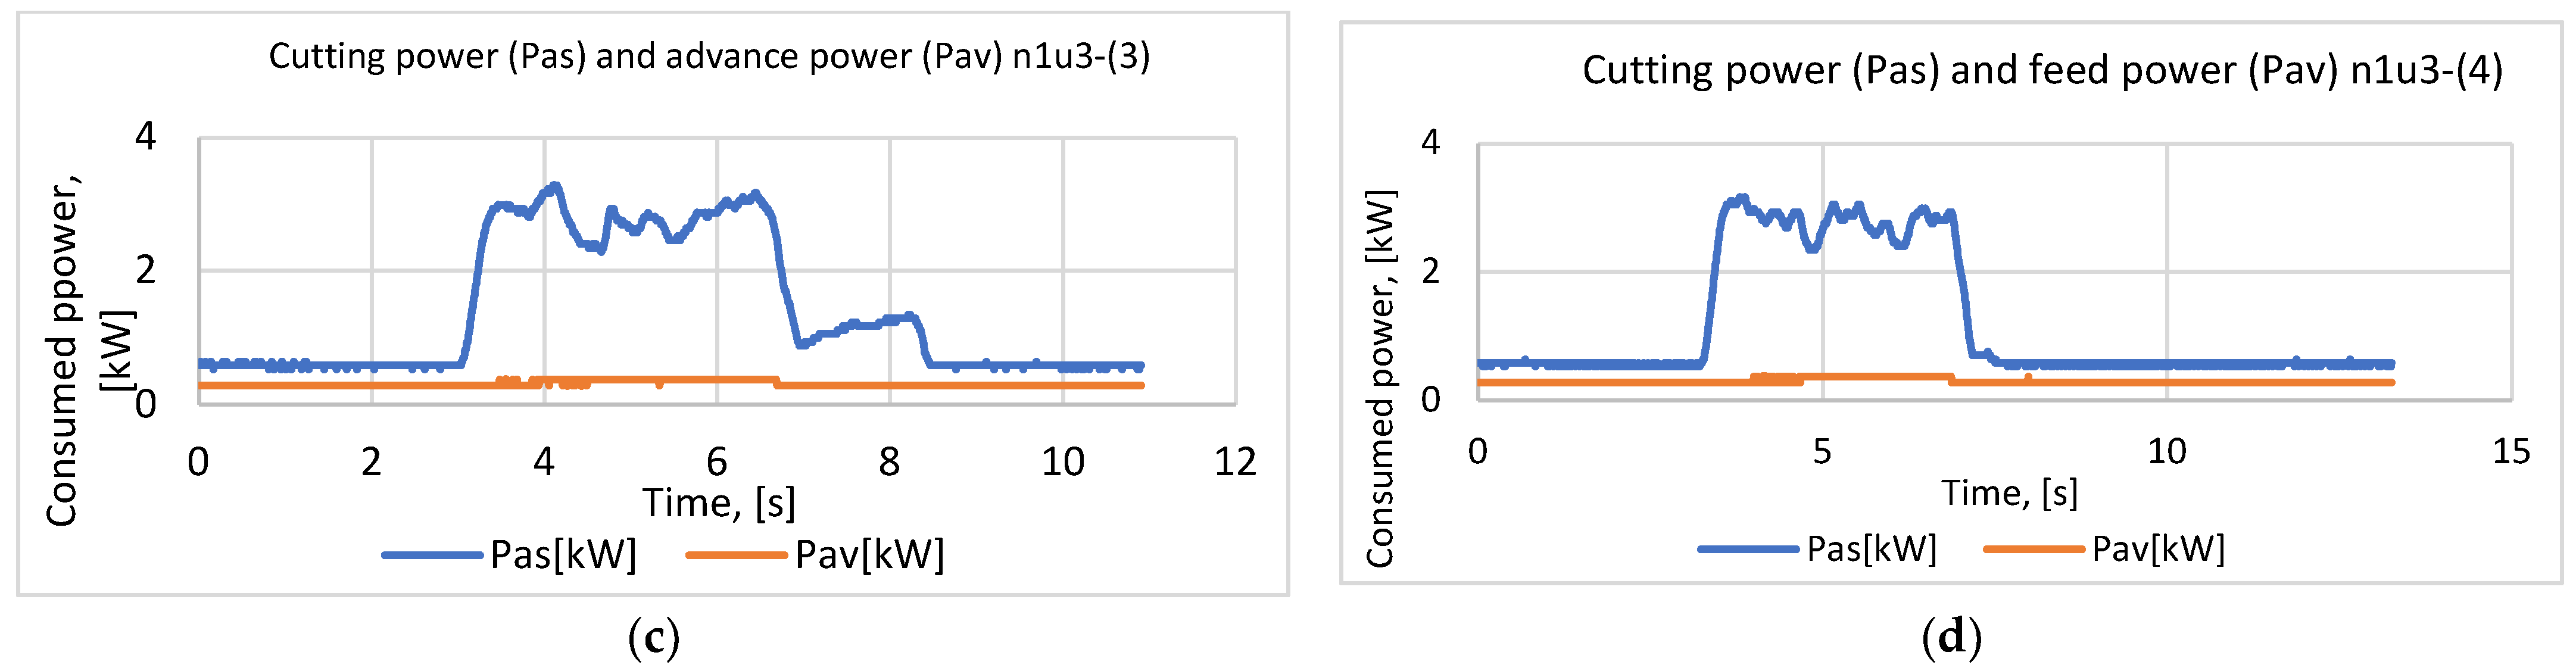
3.1. Panel Cutting Parameters for All 10 Working Regimes

Bearing in mind that the research is based on a new type of cutting, specific to the processing of panels with a transverse texture, all 10 cutting regimes were chosen taking into account this specificity (Table 2). All parameters for R1 and R2 regimes are found in Table 3.
From the analysis of the Table 3 data, the following can be seen:
-
The advance power at idle represents 96.86% of the forward power at load for the R1 regime and 88.96% for the R2 regime.
-
The cutting power at idle represents 25.11% of the cutting power at load for the R1 regime and 27.39% for the R2 regime.
-
The advance power when running under load represents 33.32% of the cutting power when running empty and 8.36% of the cutting power when running under load for the R1 regime, and 54.89% and 15.03% for the R2 regime, respectively.
Putting the advance and cutting speeds into graph form, the following two variation diagrams for the n1u2-(1) and n1u2-(2) panels can be identified for the R1 regime, and n1u3-(3) and n1u3-(4) panels for the R2 regime (Figure 3).
From the analysis of the Table 4 data, corresponding to R3 and R4 regimes, the following can be seen:
-
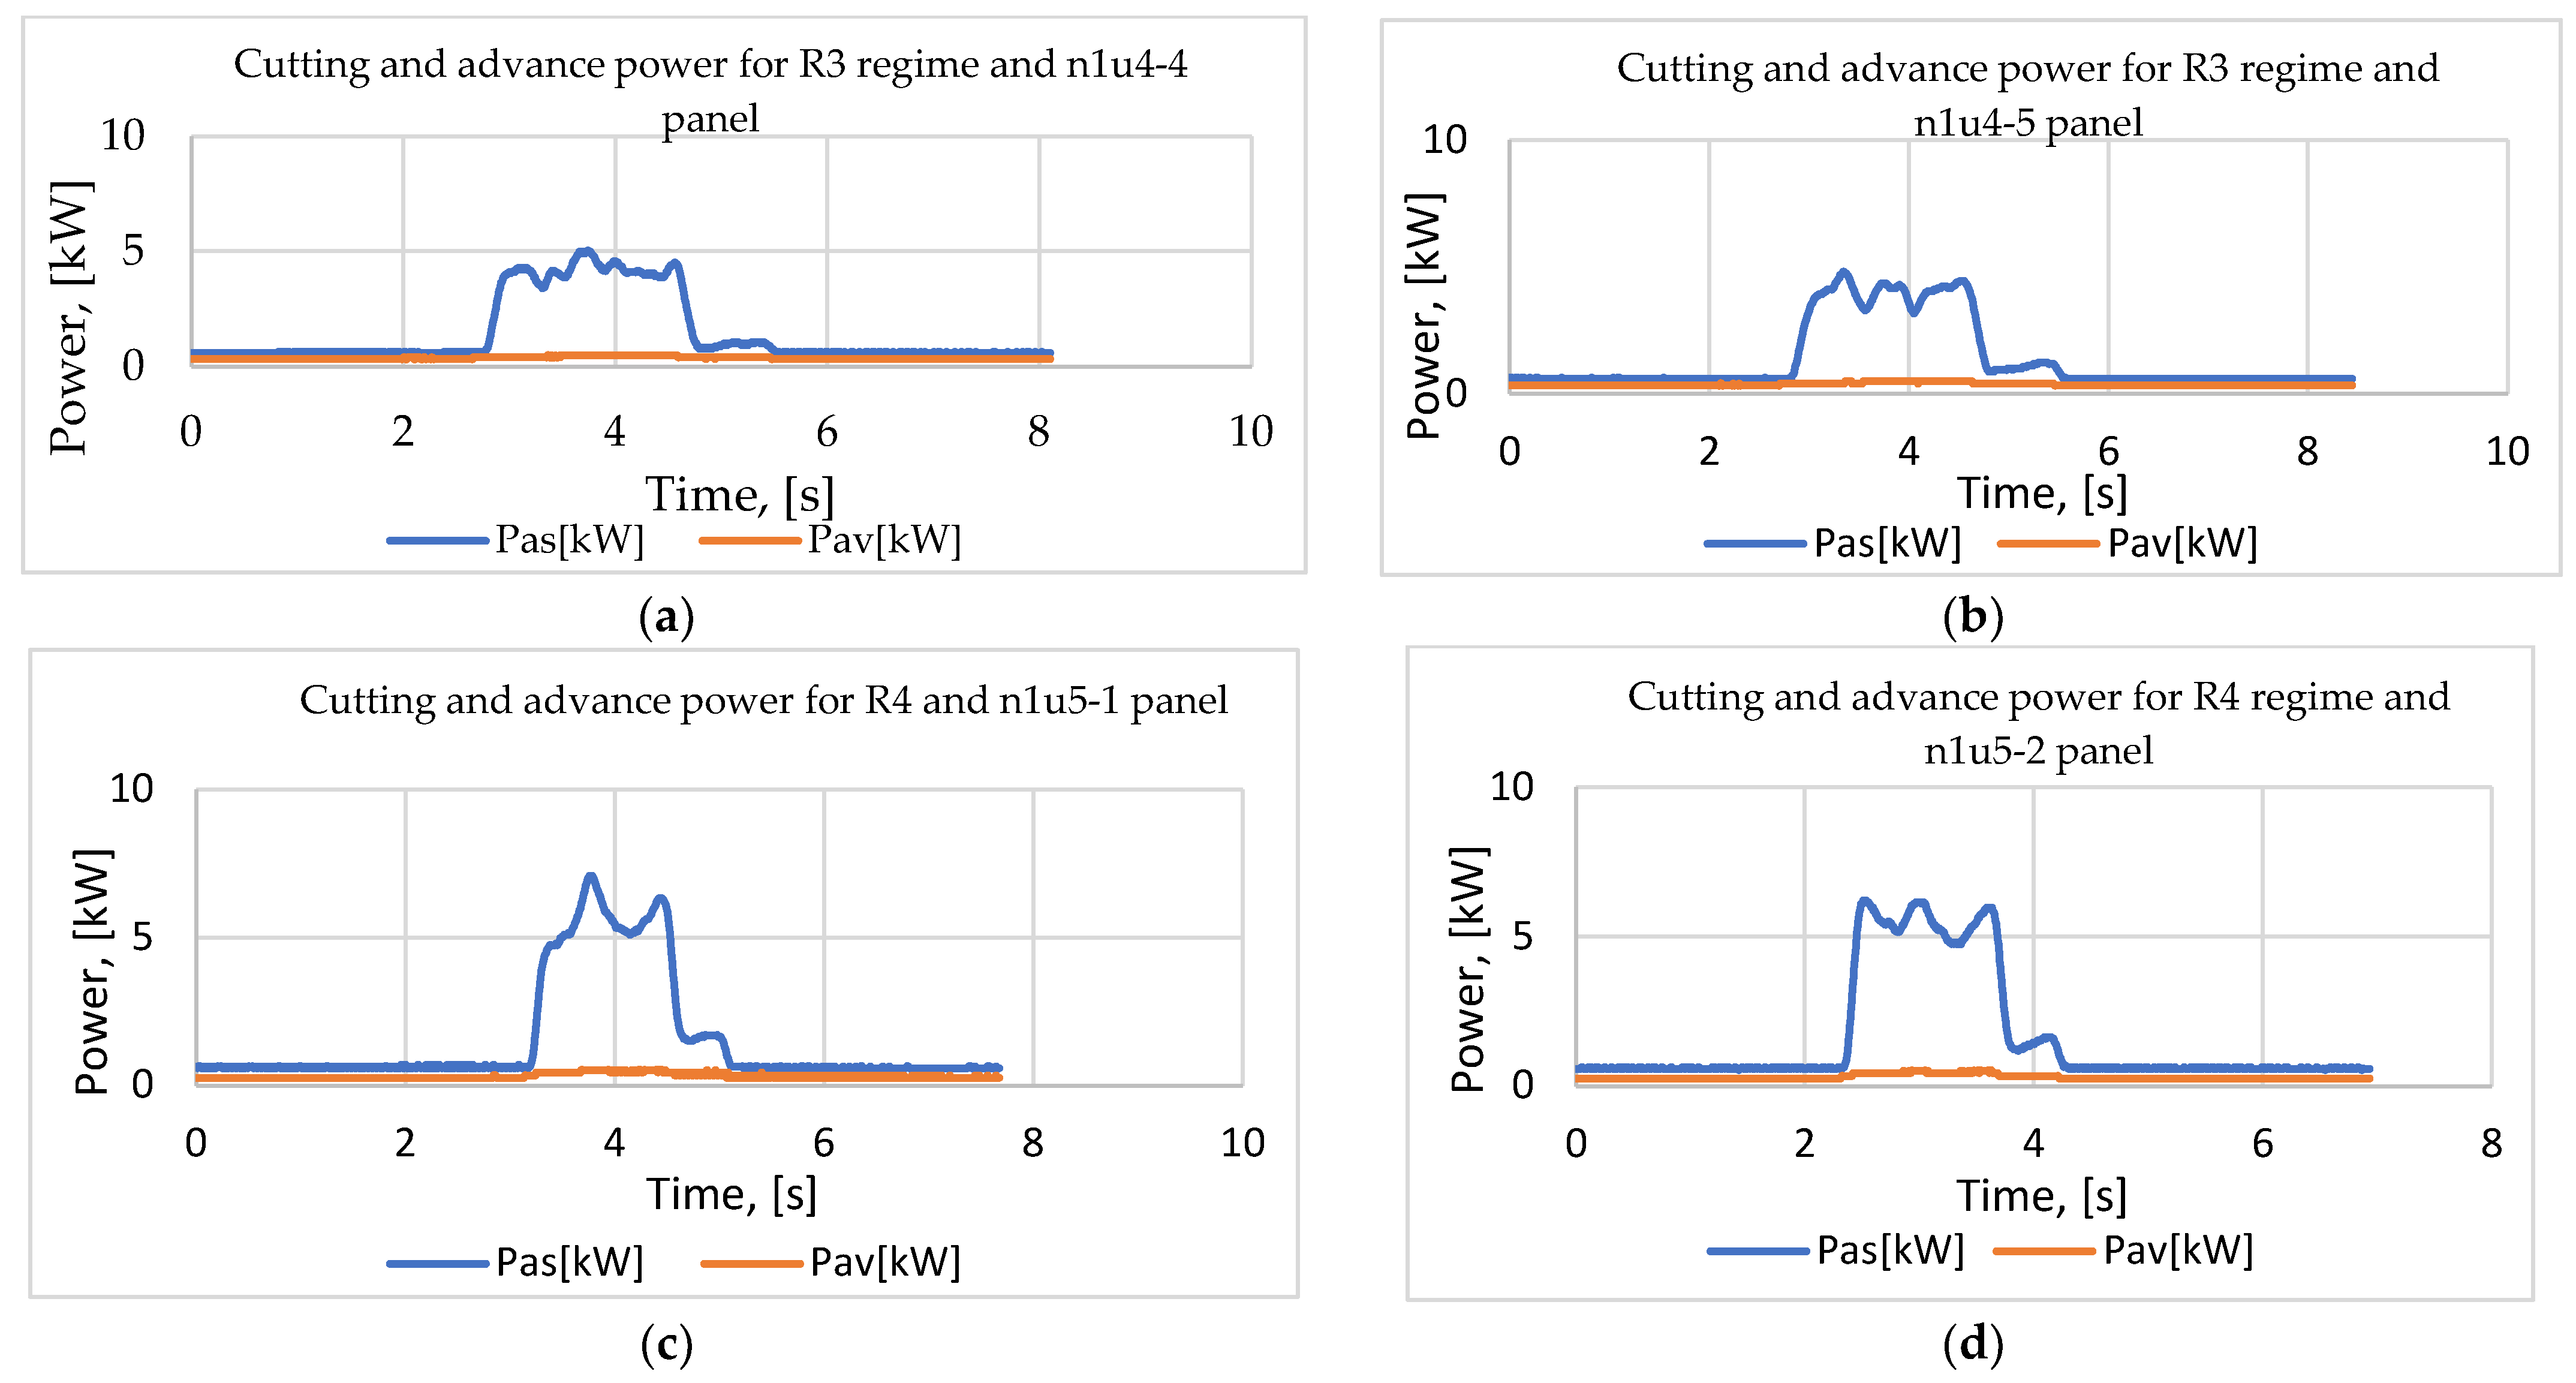
The advance power at idle represents 75.58% of the forward power at load for the R3 regime and 66.96% for the R4 regime.
-
The cutting power at idle represents 20.06% of the cutting power at load for the R3 regime and 14.99% for the R4 regime.
-
The advance power when running under load represents 75.85% of the cutting power when running at idle and 15.22% of the cutting power when running under load when the R3 regime is taken in consideration, and 66.88% and 10.03% for the R4 regime, respectively (Figure 4).
Table 4. Parameters of R3 and R4 regimes.
Cutting CodeRegime R3 (n1 = 4216 rot/min; u4 = 7.269 m/min)
Feed Power, [kW]Cutting Power, [kW]Mechanical Work, K, [daNm/cm3]Cutting Force,
F, [daN]
Specifical Force, K1,
[N/mm2]
On EmptyOn WorkOn EmptyOn Work
n1u4-(1)0.3350.4380.5823.12544.7186.2921.119
n1u4-(2)0.3280.4350.5722.99742.8036.0341.071
n1u4-(3)0.3250.4300.5623.31747.2146.6781.182
n1u4-(4)0.3270.4310.5992.90248.8655.8431.140
n1u4-(5)0.3260.4300.5872.77746.3665.5921.090
Mean0.3280.4330.5803.02345.9936.0881.120
SD0.0030.0030.0140.2072.3280.4170.043
V-5%0.3250.4300.5672.82643.7755.6901.079
Cutting CodeRegime R4 (n1 = 4216 rot/min; u5 = 10.629 m/min)
n1u5-(1)0.2700.4190.6083.78137.1877.6141.364
n1u5-(2)0.260.4060.6003.84338.5797.7381.387
n1u5-(3)0.260.3920.6024.42044.1568.9001.595
n1u5-(4)0.260.3800.5774.40850.0488.8761.588
n1u5-(5)0.2630.4360.5724.24940.0388.5551.513
Mean0.2620.4070.5924.14042.0028.3371.489
SD0.0040.0220.0160.3075.1990.6190.109
V-5%0.2580.3850.5773.84737.0467.74651.385
From the analysis of the Table 5 data, corresponding to R5 and R6 regimes, the following can be seen:
-
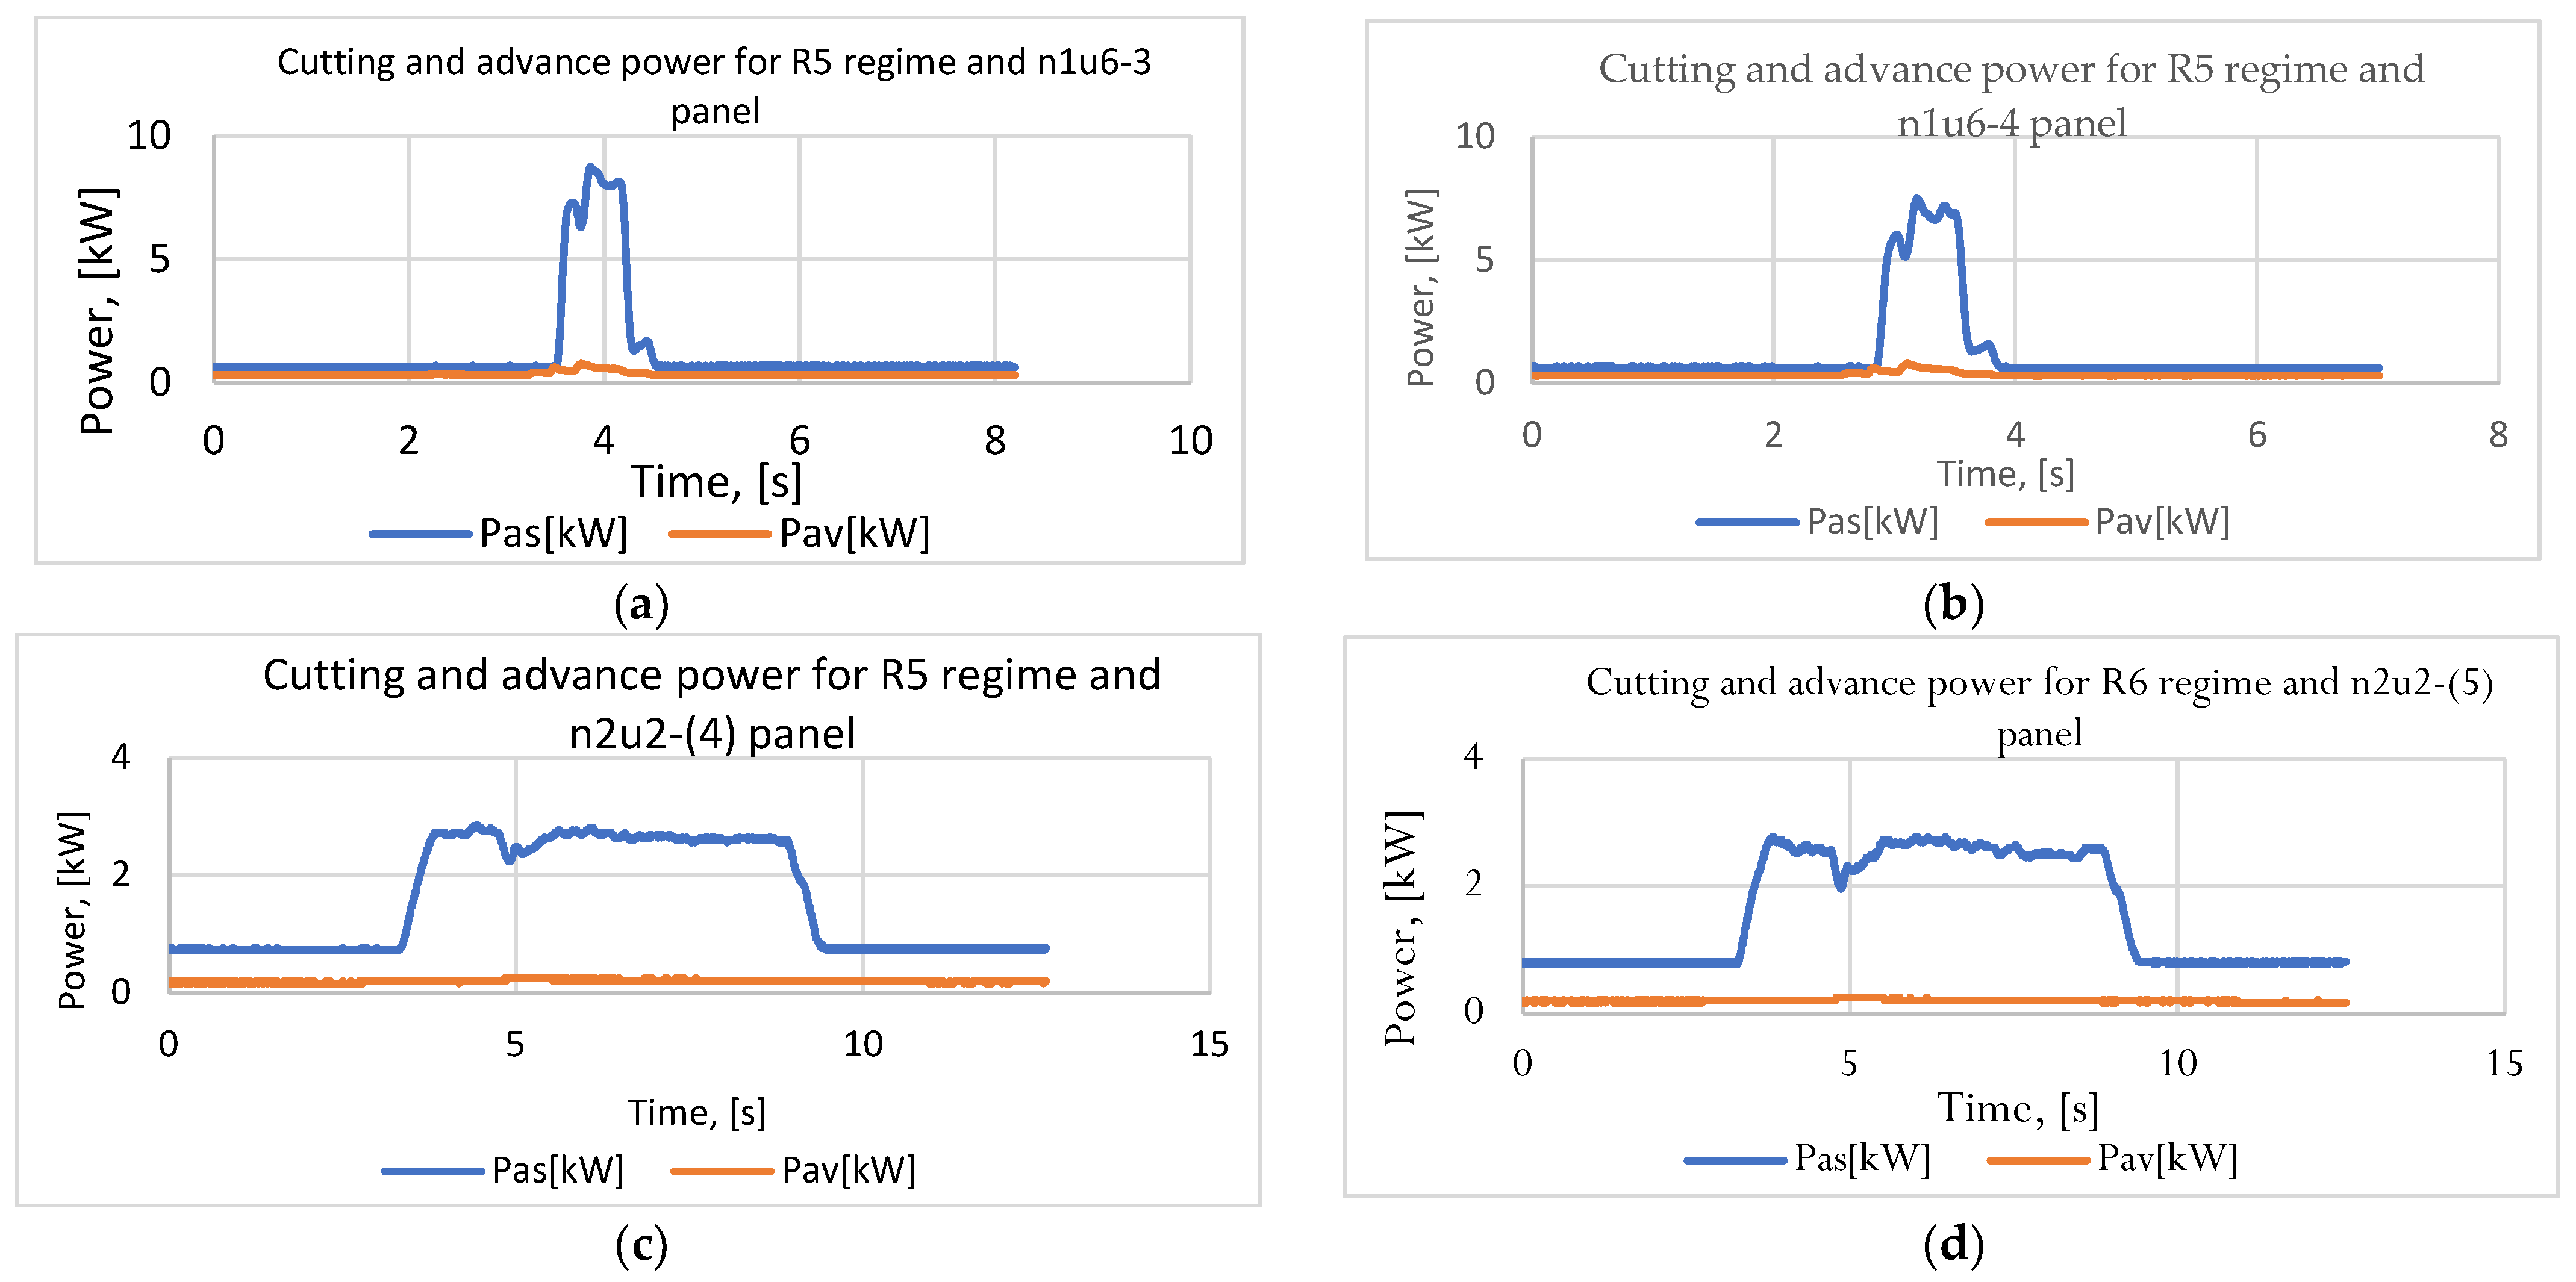
The forward power at idle represents 62.89% of the forward power at load for the R5 regime and 88.53% for the R6 regime.
-
The cutting power at idle represents 14.25% of the cutting power at load for the R5 regime and 35.01 for the R6 regime.
-
The feed power when running under load represents 77.20% of the cutting power when running empty, and 11.00% of the cutting power when running under load when the R5 regime is taken in consideration and 30% and 10.50%, respectively, when the R6 regime is taken in consideration (Figure 5).
Table 5. Cutting parameters of R5 and R6 regimes.
Cutting CodeRegime R5 (n1 = 4216 rot/min; u6 = 20.233 m/min)
Feed Power, [kW]Cutting Power, [kW]Mechanical Work, K, [daNm/cm3]Cutting Force,
F, [daN]
Specifical Force, K1,
[N/mm2]
On EmptyOn WorkOn EmptyOn Work
n1u6 (1)0.3330.5430.6465.38828.19110.8491.917
n1u6 (2)03320.5240.6425.59329.58211.2611.992
n1u6 (3)0.3180.5030.6544.84025.4719.74561.732
n1u6 (4)0.3160.4970.6474.14821.7148.3521.491
n1u6 (5)0.3110.5060.6495.79330.91211.6652.082
Mean0.3220.5150.6485.15327.17410.3741.843
SD0.0090.0180.0040.6643.6571.3380.235
V-5%0.3120.4970.6444.51923.6889.0991.6195
Cutting CodeRegime R6, (n2 = 6722 rot/min; u2 = 3.705 m/min)
n2u2-(1)0.2110.2380.6892.05457.3342.5930.456
n2u2-(2)0.2000.2220.7372.10361.5842.6550.467
n2u2-(3)0.1870.2150.7442.03558.3462.5700.451
n2u2-(4)0.1940.2160.7442.45468.7893.0990.543
n2u2-(5)0.1900.2140.7952.40268.0453.0330.531
Mean0.1960.2210.7422.20962.8202.7900.490
SD0.0090.0100.0370.2015.3520.2540.044
V-5%0.1870.2110.7062.01757.71952.5470.448
From the analysis of the Table 6 data, the following can be seen:
-
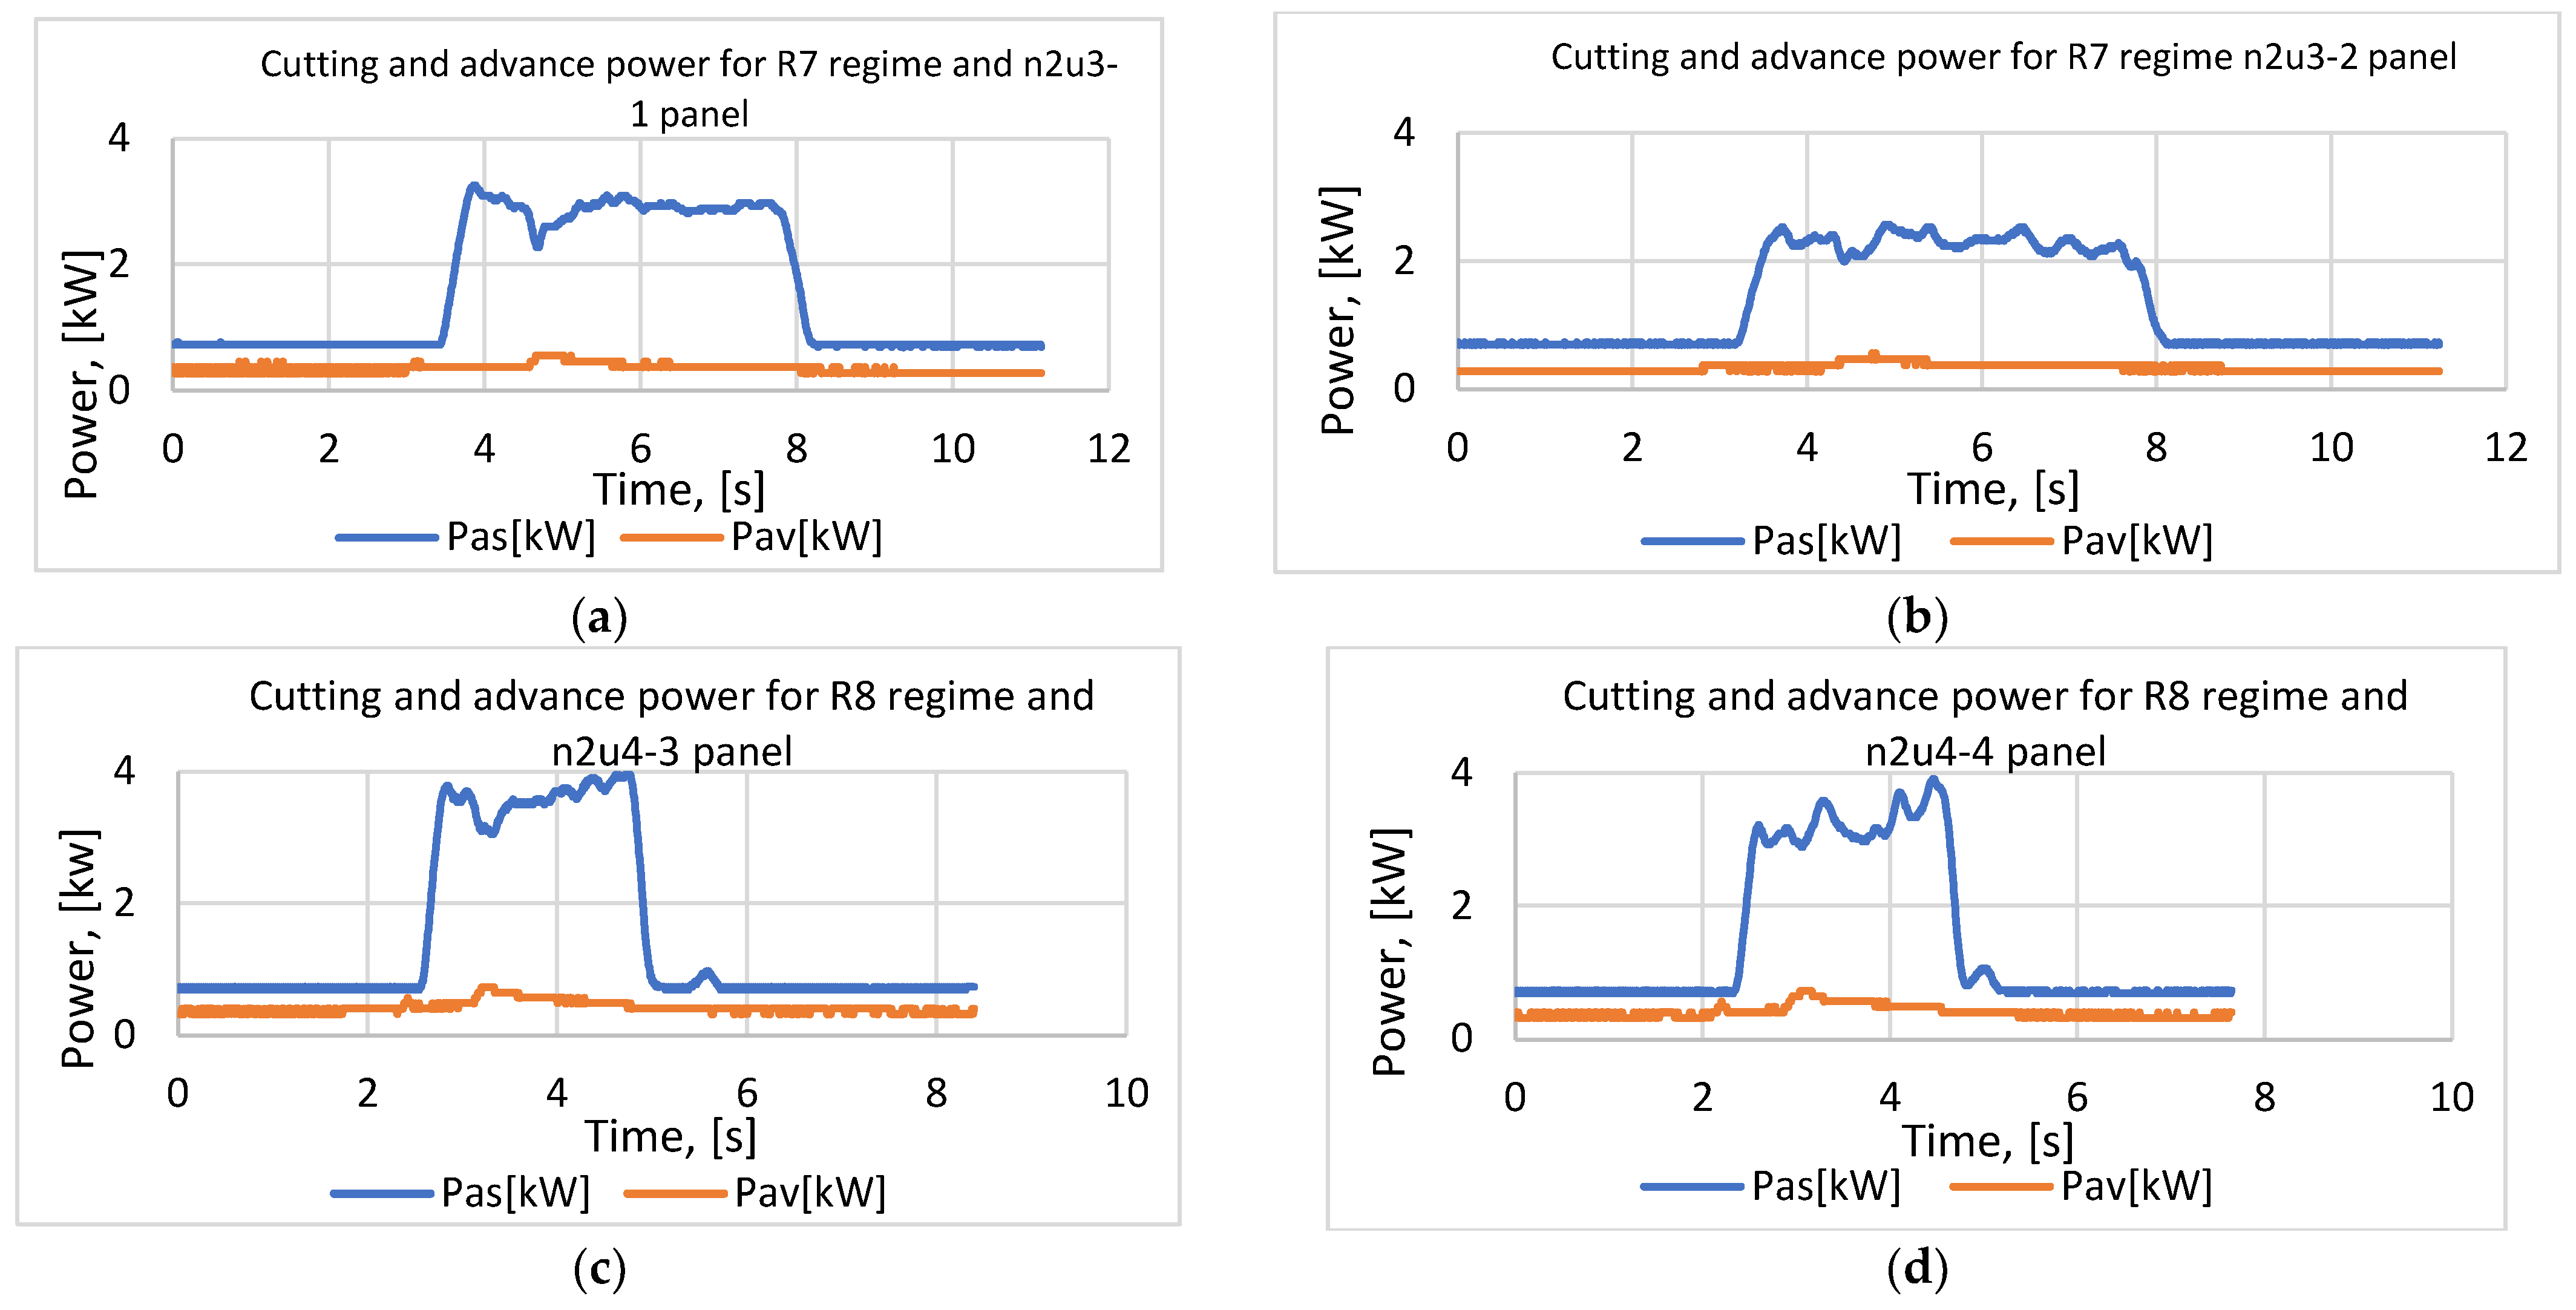
The forward power at idle represents 76.48% of the forward power at load for the R7 regime and 73.60% for the R8 regime.
-
The cutting power at idle represents 31.29% of the cutting power at load for the R7 regime and 27.78 for the R8 regime.
-
The advance power when running under load represents 53.48% of the cutting power when idle running and 16.74% of the cutting power when running under load when the R7 regime is taken in consideration, and 68.02 and 18.89%, respectively, for the R8 regime (Figure 6).
Table 6. Cutting parameters of R7 and R8 regimes.
Cutting CodeRegime R7 (n2 = 6722 rot/min; u3 = 4.798 m/min)
Feed Power, [kW]Cutting Power, [kW]Mechanical Work, K, [daN·m/cm3]Cutting Force,
F, [daN]
Specifical Force, K1,
[N/mm2]
On EmptyOn WorkOn EmptyOn Work
n2u3 (1)0.3030.3990.7312.72159.2173.4360.603
n2u3 (2)0.2900.3760.7032.12547.2952.6830.470
n2u3 (3)0.2910.3810.7092.49255.0493.1470.553
n2u3 (4)0.2890.3760.7042.52255.2313.1850.561
n2u3 (5)0.2870.3840.7082.37152.2132.9950.528
Mean0.2920.3830.7112.44653.80130890.543
SD0.0060.0090.0110.2194.4090.2760.048
V-5%0.2860.3740.7002.23749.5982.8250.497
Cutting CodeRegime R8, (n2 = 6722 rot/min; u4 = 7.937 m/min)
n2u4-(1)0.4040.5130.7062.83140.7333.5760.632
n2u4-(2)0.3900.4900.7093.02943.5413.8250.676
n2u4-(3)0.3780.5110.7193.24036.9004.0910.725
n2u4-(4)0.3600.4870.7112.68634.6723.3920.600
n2u4-(5)0.3460.4770.7192.42935.1023.0670.543
Mean0.3760.4960.7132.84338.1903.5900.635
SD0.0230.0150.0060.3113.8290.3930.069
V-5%0.3540.4810.7072.54634.5403.2150.569
From the analysis of the Table 7 data, the following can be seen:
-
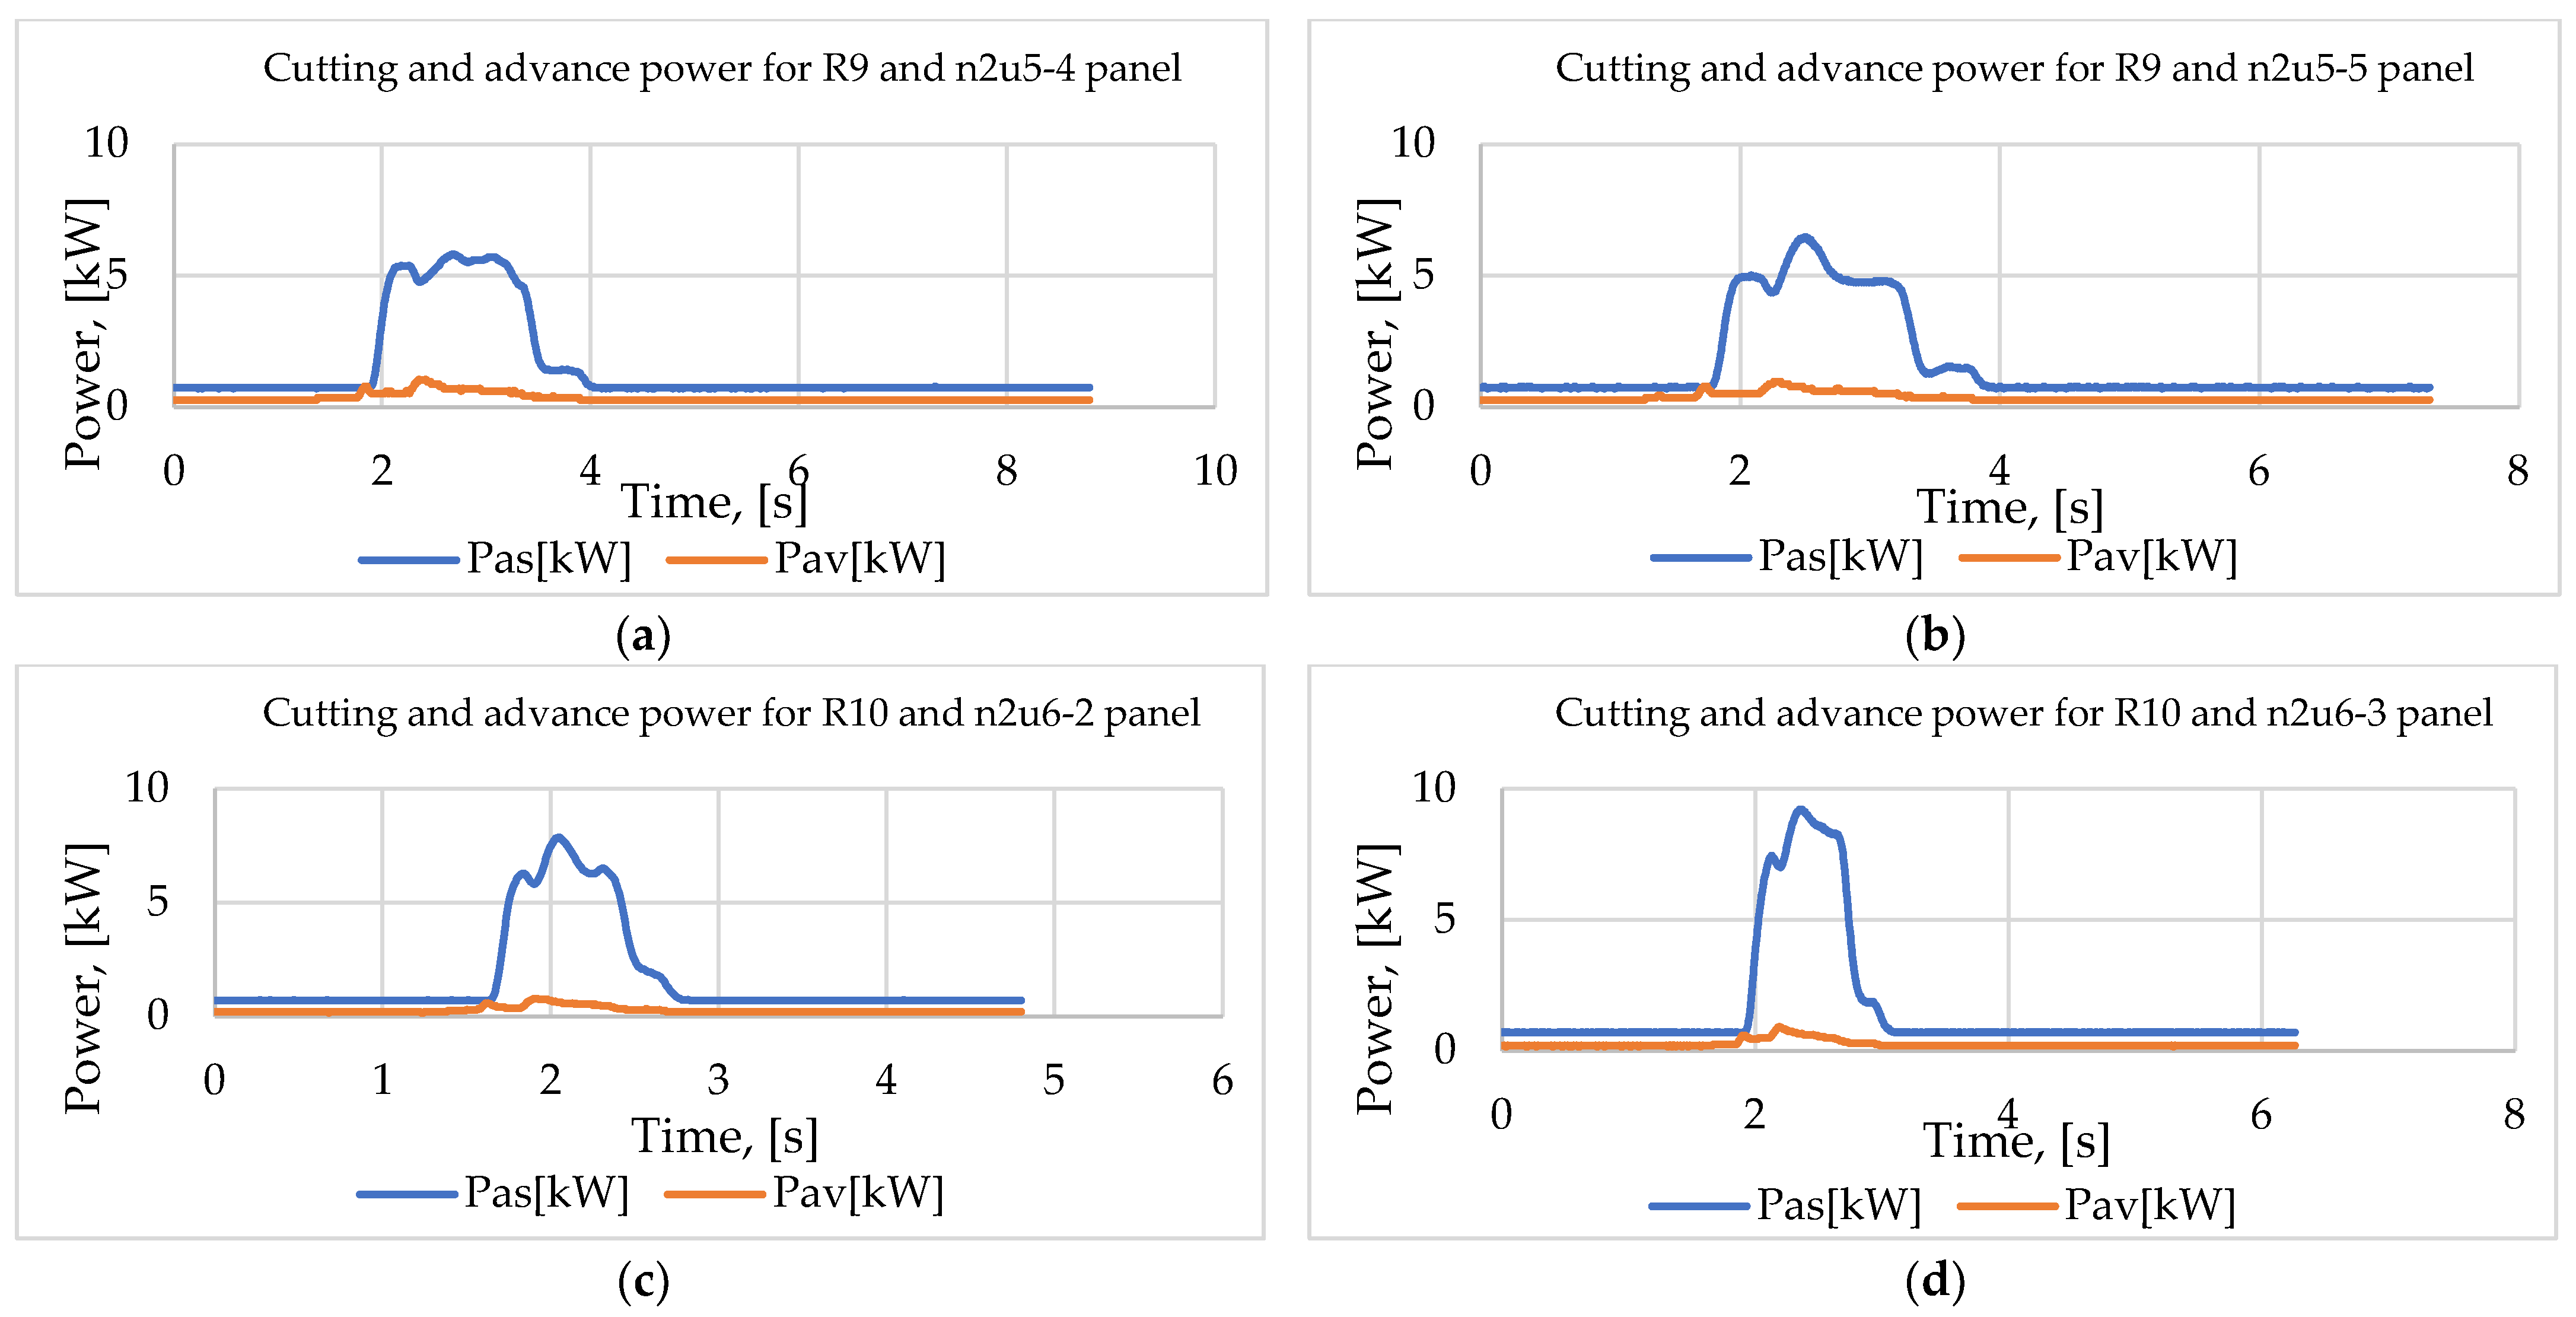
The advance power when idling represents 51.37% of the advance power when it is running under load for the R9 regime, and 49.86% for the R10 regime.
-
The cutting power at idle running represents 21.37% of the cutting power when running under load for the R9 regime, and 16.22% for the R10 regime.
-
The feed power when running under load represents 72.22% of the cutting power when running idle and 15.43% of the cutting power when running under load for the R9 regime, and 58.42% and 9.47%, respectively, for the R10 regime (Figure 7).
Table 7. Parameters of R9 and R10 regimes.
Cutting CodeRegime R9 (n2 = 6722 rot/min; u5 = 10.962 m/min)
Feed Power, [kW]Cutting Power, [kW]Mechanical Work, K, [daNm/cm3]Cutting Force,
F, [daN]
Specifical Force, K1,
[N/mm2]
On Un-LoadOn LoadOn EmptyOn Work
n2u5 (1)0.2770.5260.7293.23831.1234.0890.724
n2u5 (2)0.2700.5450.7233.62935.1684.5830.811
n2u5 (3)0.2710.5460.7323.84137.4714.8500.860
n2u5 (4)0.2710.5170.7353.63735.6414.5920.814
n2u5 (5)0.2710.5350.7283.59534.9064.5400.805
Mean0.2680.5220.7233.38732.6944.2760.758
SD0.0030.0120.0050.2192.3200.2760.049
V-5%0.2690.5390.7243.63235.1264.5860.814
Cutting CodeRegime R10, (n2 = 6722 rot/min; u6 = 20.324 m/min))
n2u6-(1)0.2060.4050.7074.10121.0485.1790.918
n2u6-(2)0.2060.4210.6934.37523.2575.5240.978
n2u6-(3)0.2040.4530.7065.23127.8456.6061.172
n2u6-(4)0.2040.4200.6995.04926.1576.3751.130
n2u6-(5)0.2000.4120.6944.91325.6616.2041.099
Mean0.2040.4220.7004.73424.7945.9781.059
SD0.0020.0180.0060.4762.6600.6010.107
V-5%0.2020.4050.6944.28022.2585.4050.957

3.2. Synthesis of Results

Due to the structural particularities of the spruce branch transverse texture panels, especially due to the transverse structure of the faces, the case of cutting them with circular discs is a special case of windowing the wood, because the cutting carried out by dividing and breaking the bonds between the fibers along them. In this way, the specific mechanical cutting resistance is modified, in the sense of its reduction.
The theoretical and experimental model of the total power diagram for circular blade cutting of a specimen is shown in Figure 8.
If compression wood appears in the area where the teeth exit the material on the test piece, a jump appears in the power diagram (Figure 8). This jump represents an additional consumption of power caused by the increased hardness of the compression wood and the fact that the effort is distributed over a smaller and smaller number of teeth. If the compression wood zone is in the entry zone of the teeth in the material on the power diagram, no jump is recorded because the effort is taken successively by all the teeth compared to the exit zone where the effort is taken by only a part of the teeth. This model of the power diagram when cutting with circular blades is characteristic of these types of panels, with a frequency of occurrence in 80% of the cases, with the only exception being the specimens that do not have compression wood in the area where the teeth exit the material (e.g., R6 and R7 processing regimes).
From the analysis of the data obtained following the interpretation of the results of the tests on the cutting with a circular saw of the panels with transverse texture of spruce branches, it follows that the cutting power is directly influenced by the advance speed and the cutting speed.

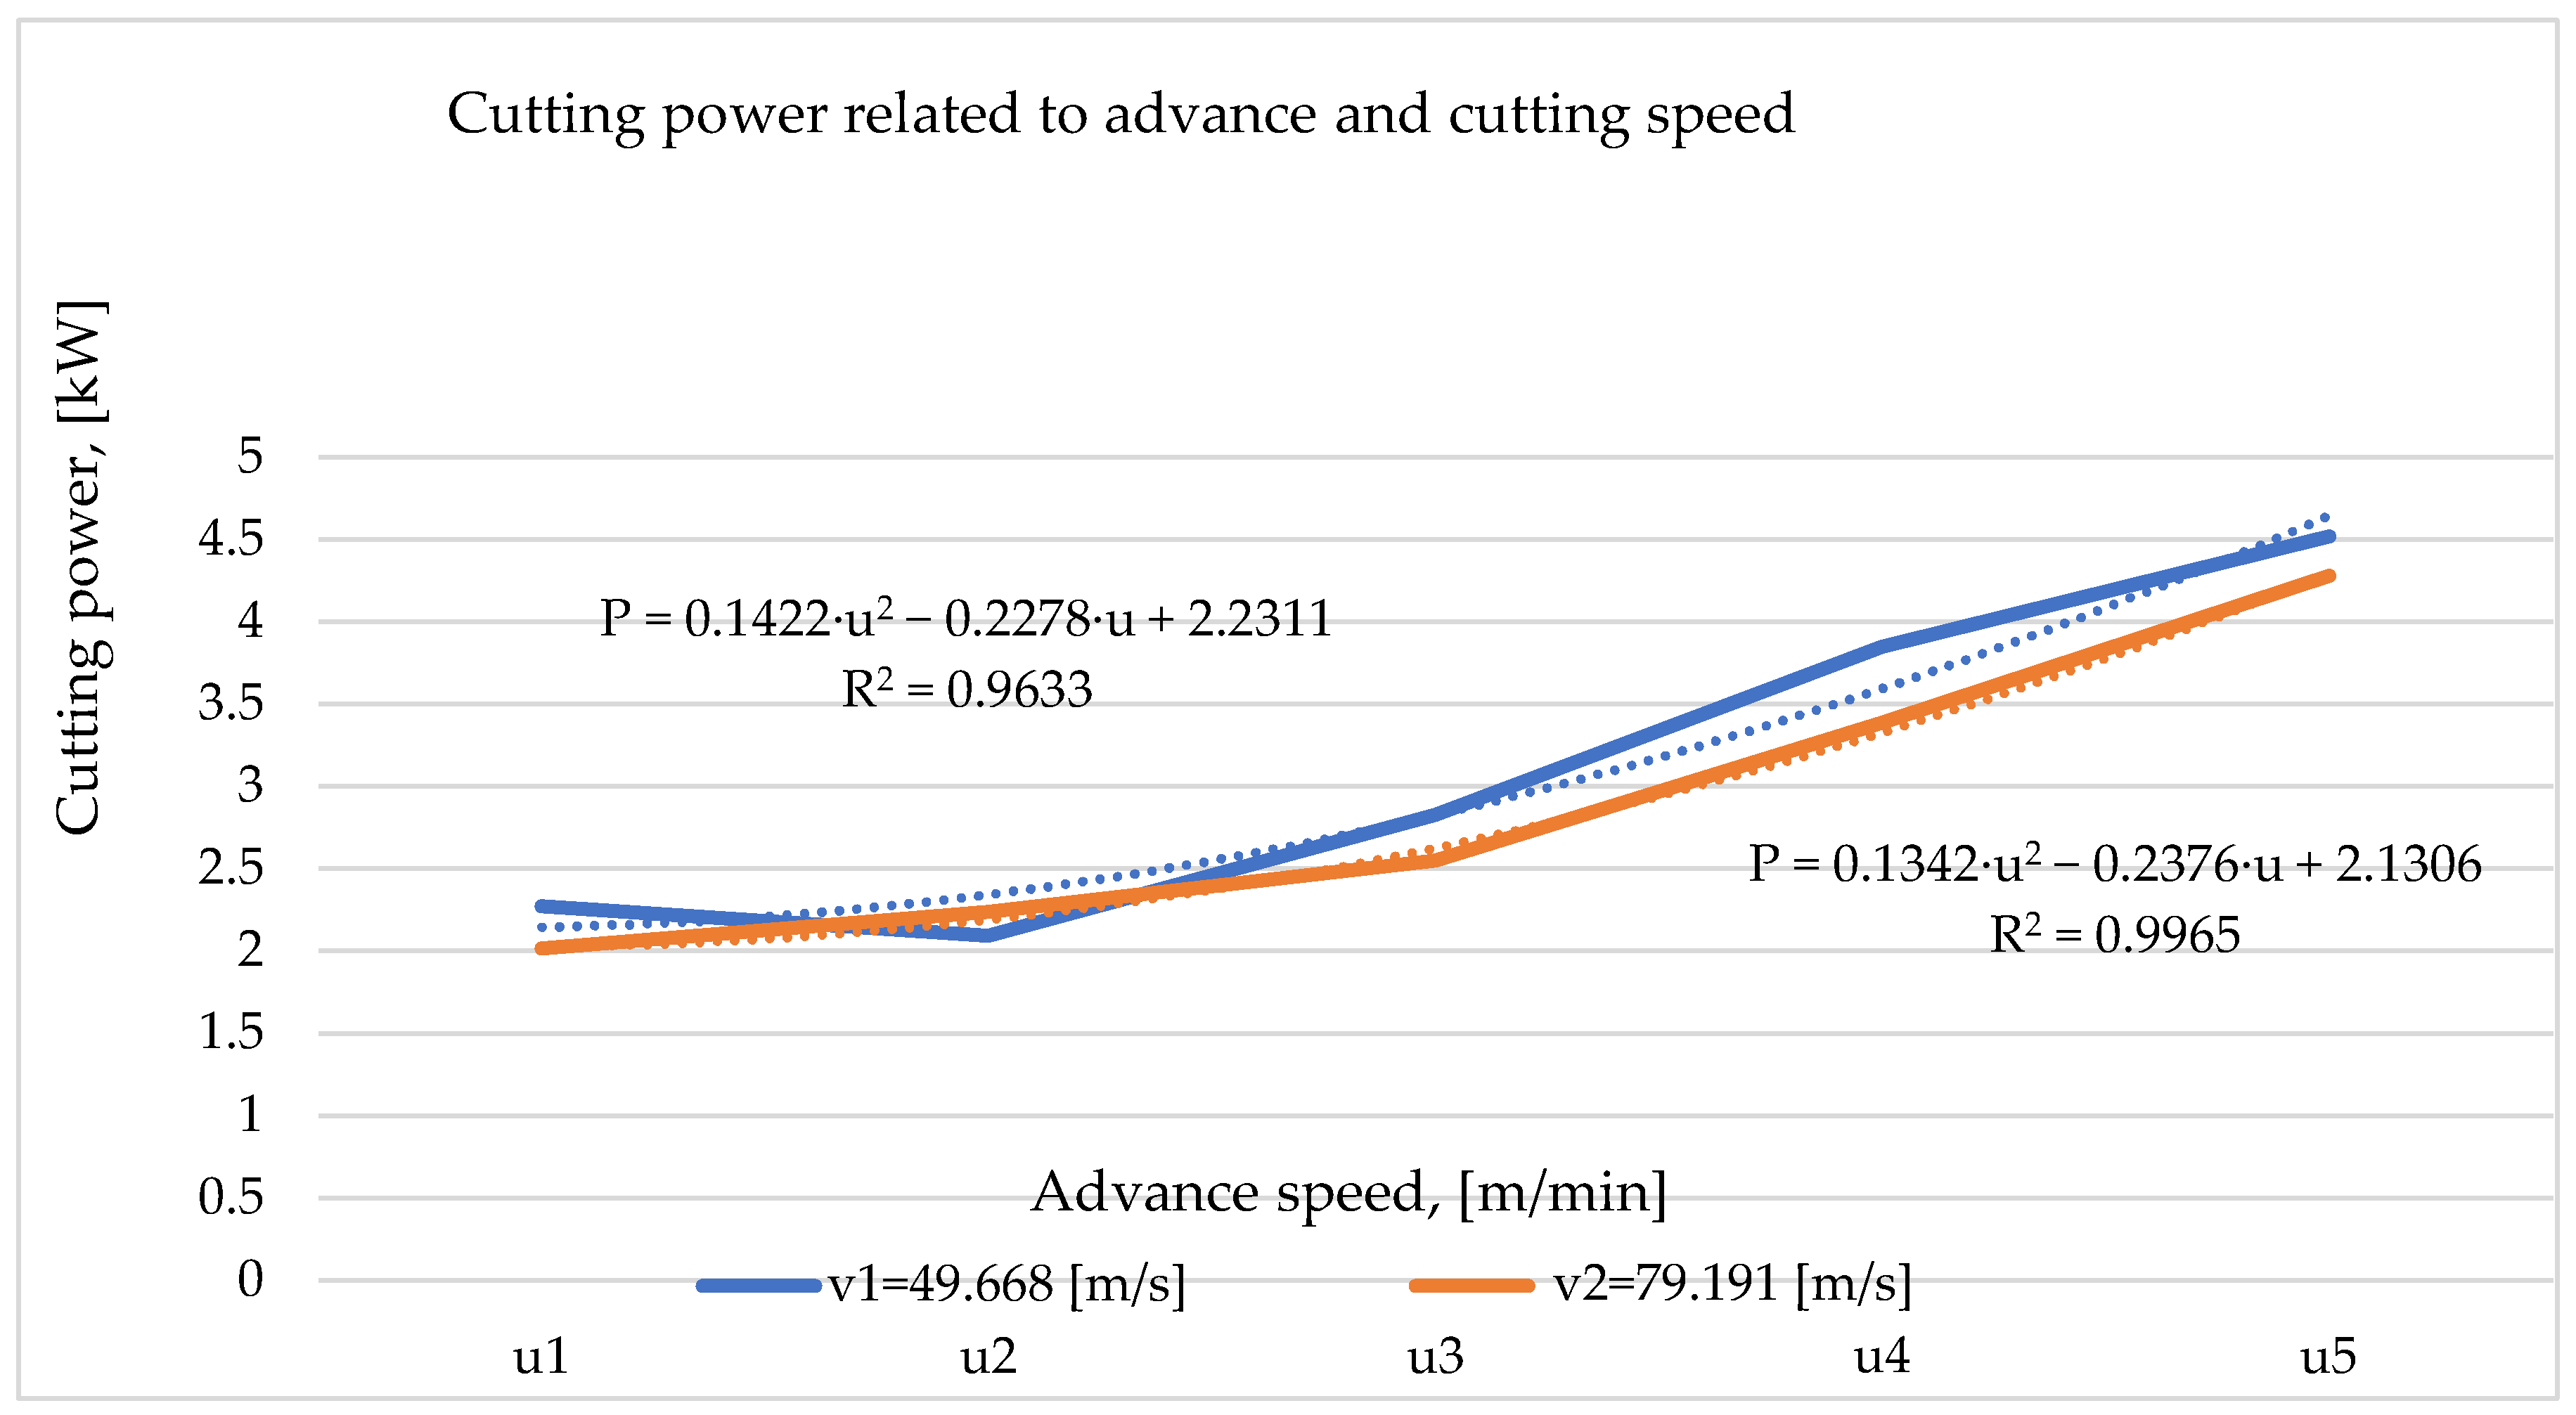
3.3. Results on Cutting Power

The cutting power varies directly in proportion with the advance speed and inversely in proportion with the cutting speed (Table 8). The regression relationship between the cutting power and the feed speed for the speed n1 = 4216 rpm is represented by the polynomial equation of the second degree, with a coefficient of determination R2= 0.9633, and the speed n2 = 6722 rpm is represented by the other polynomial equation of the second degree, with a coefficient of determination R2 = 0.9633 (Figure 9).

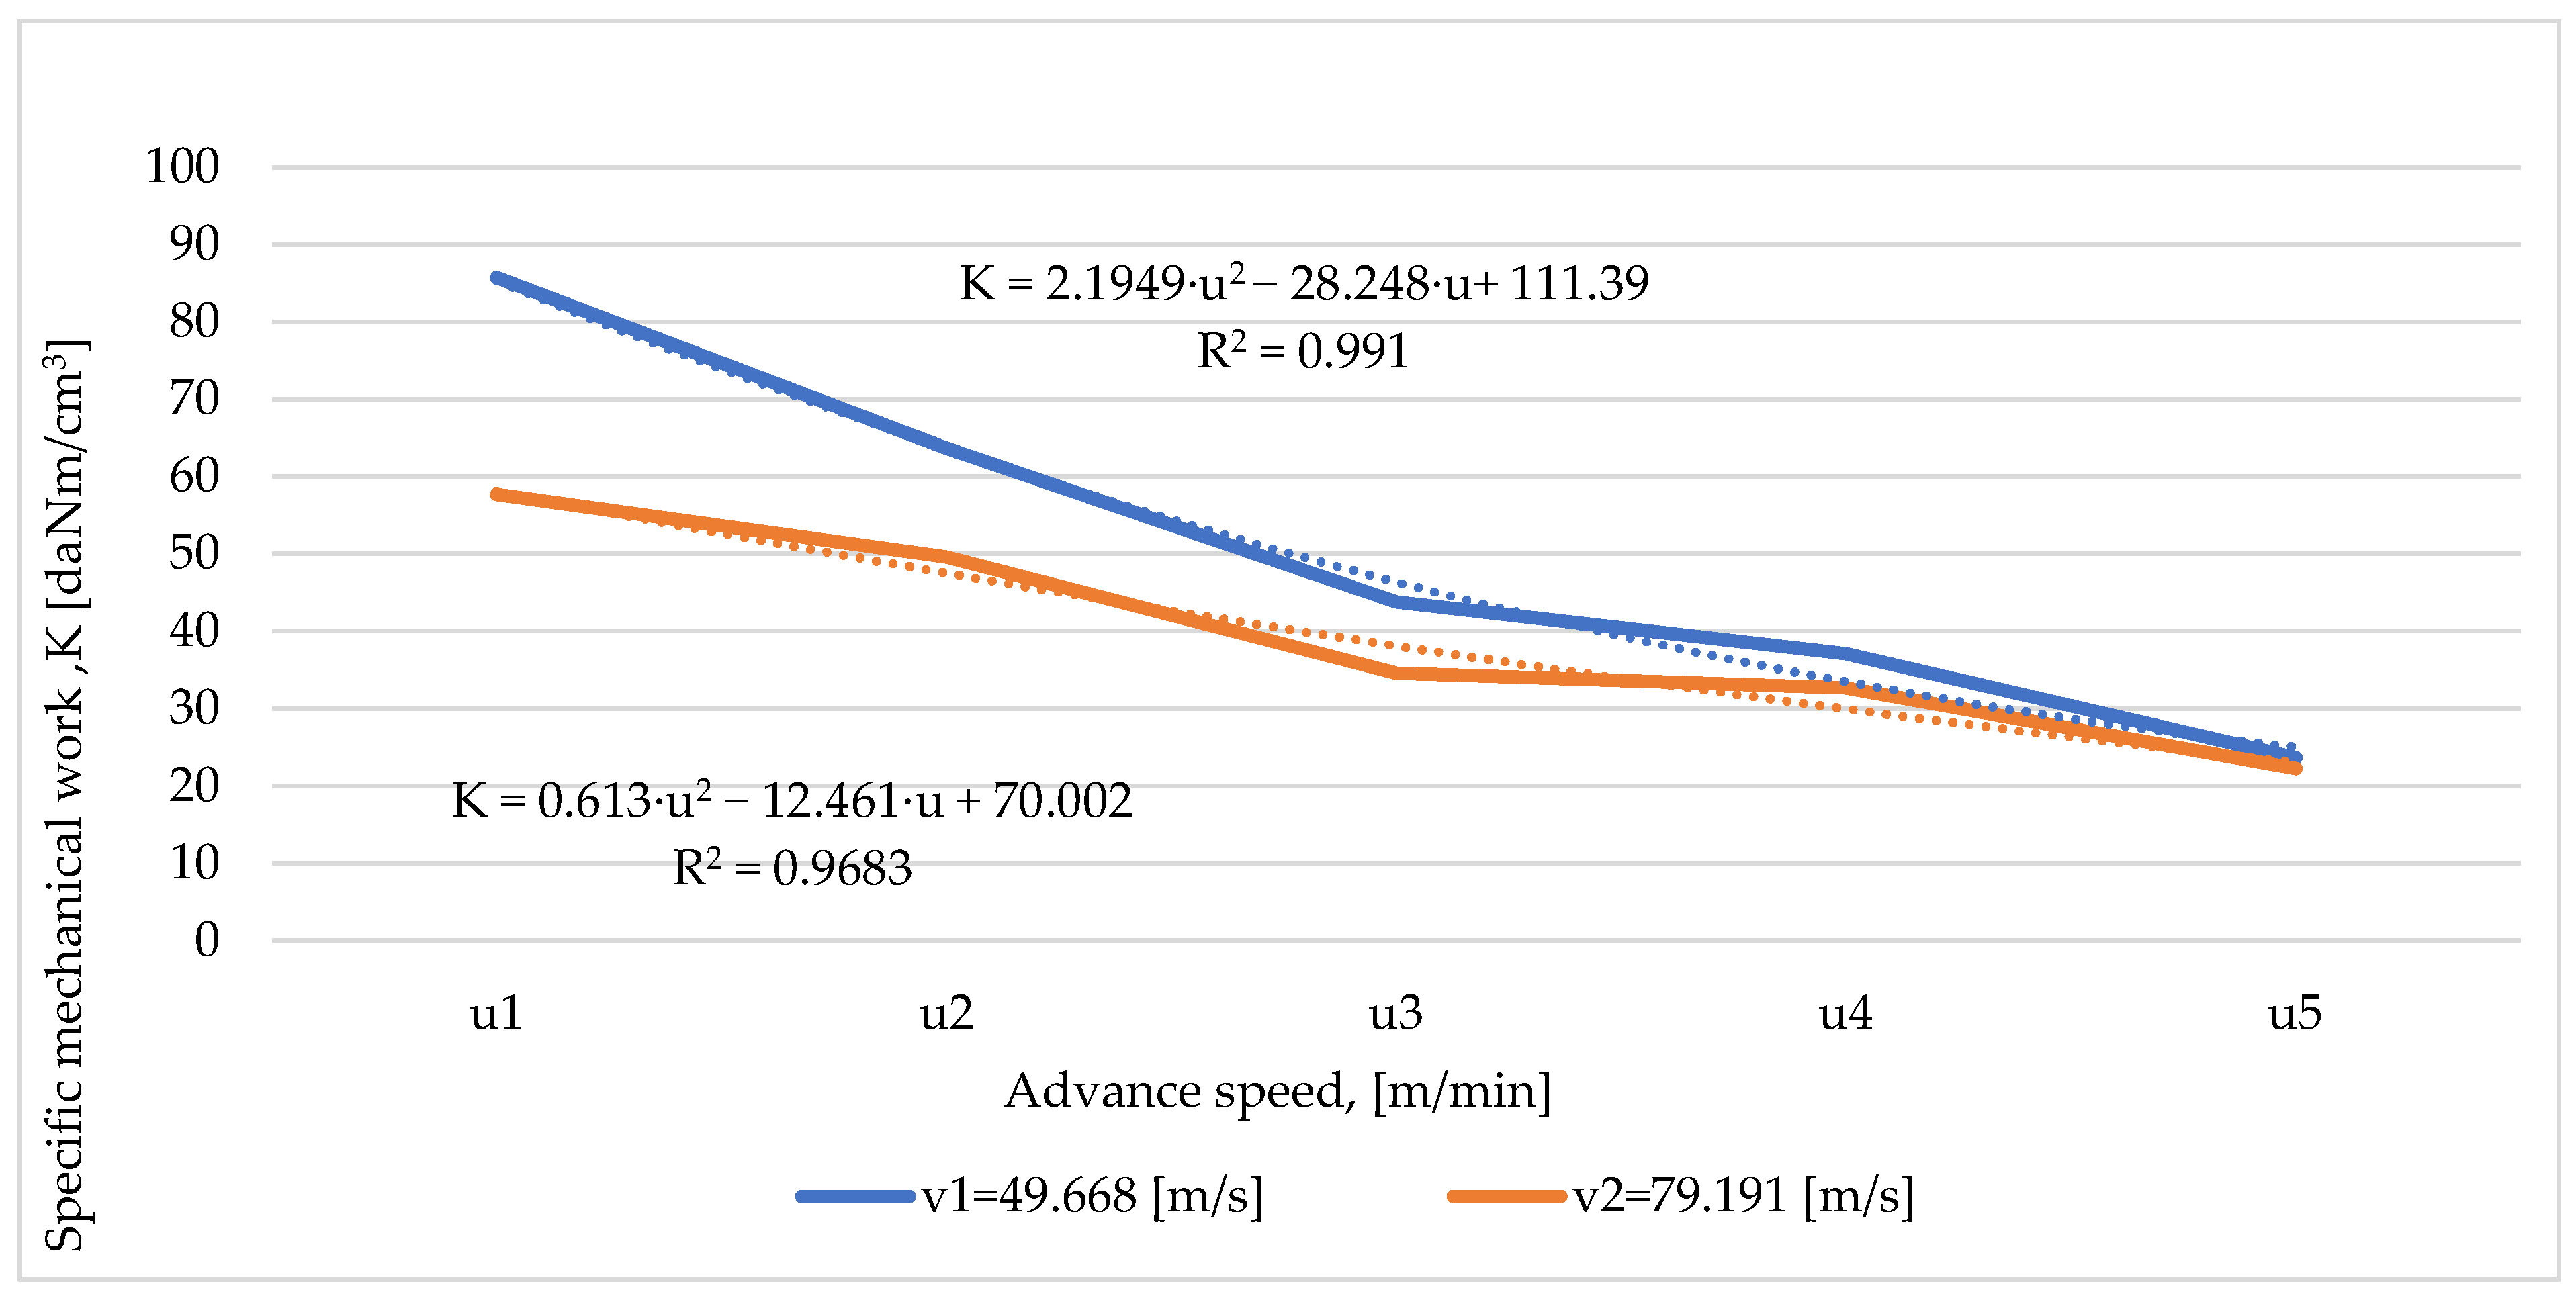
3.4. Results on Mechanical Work of Cutting
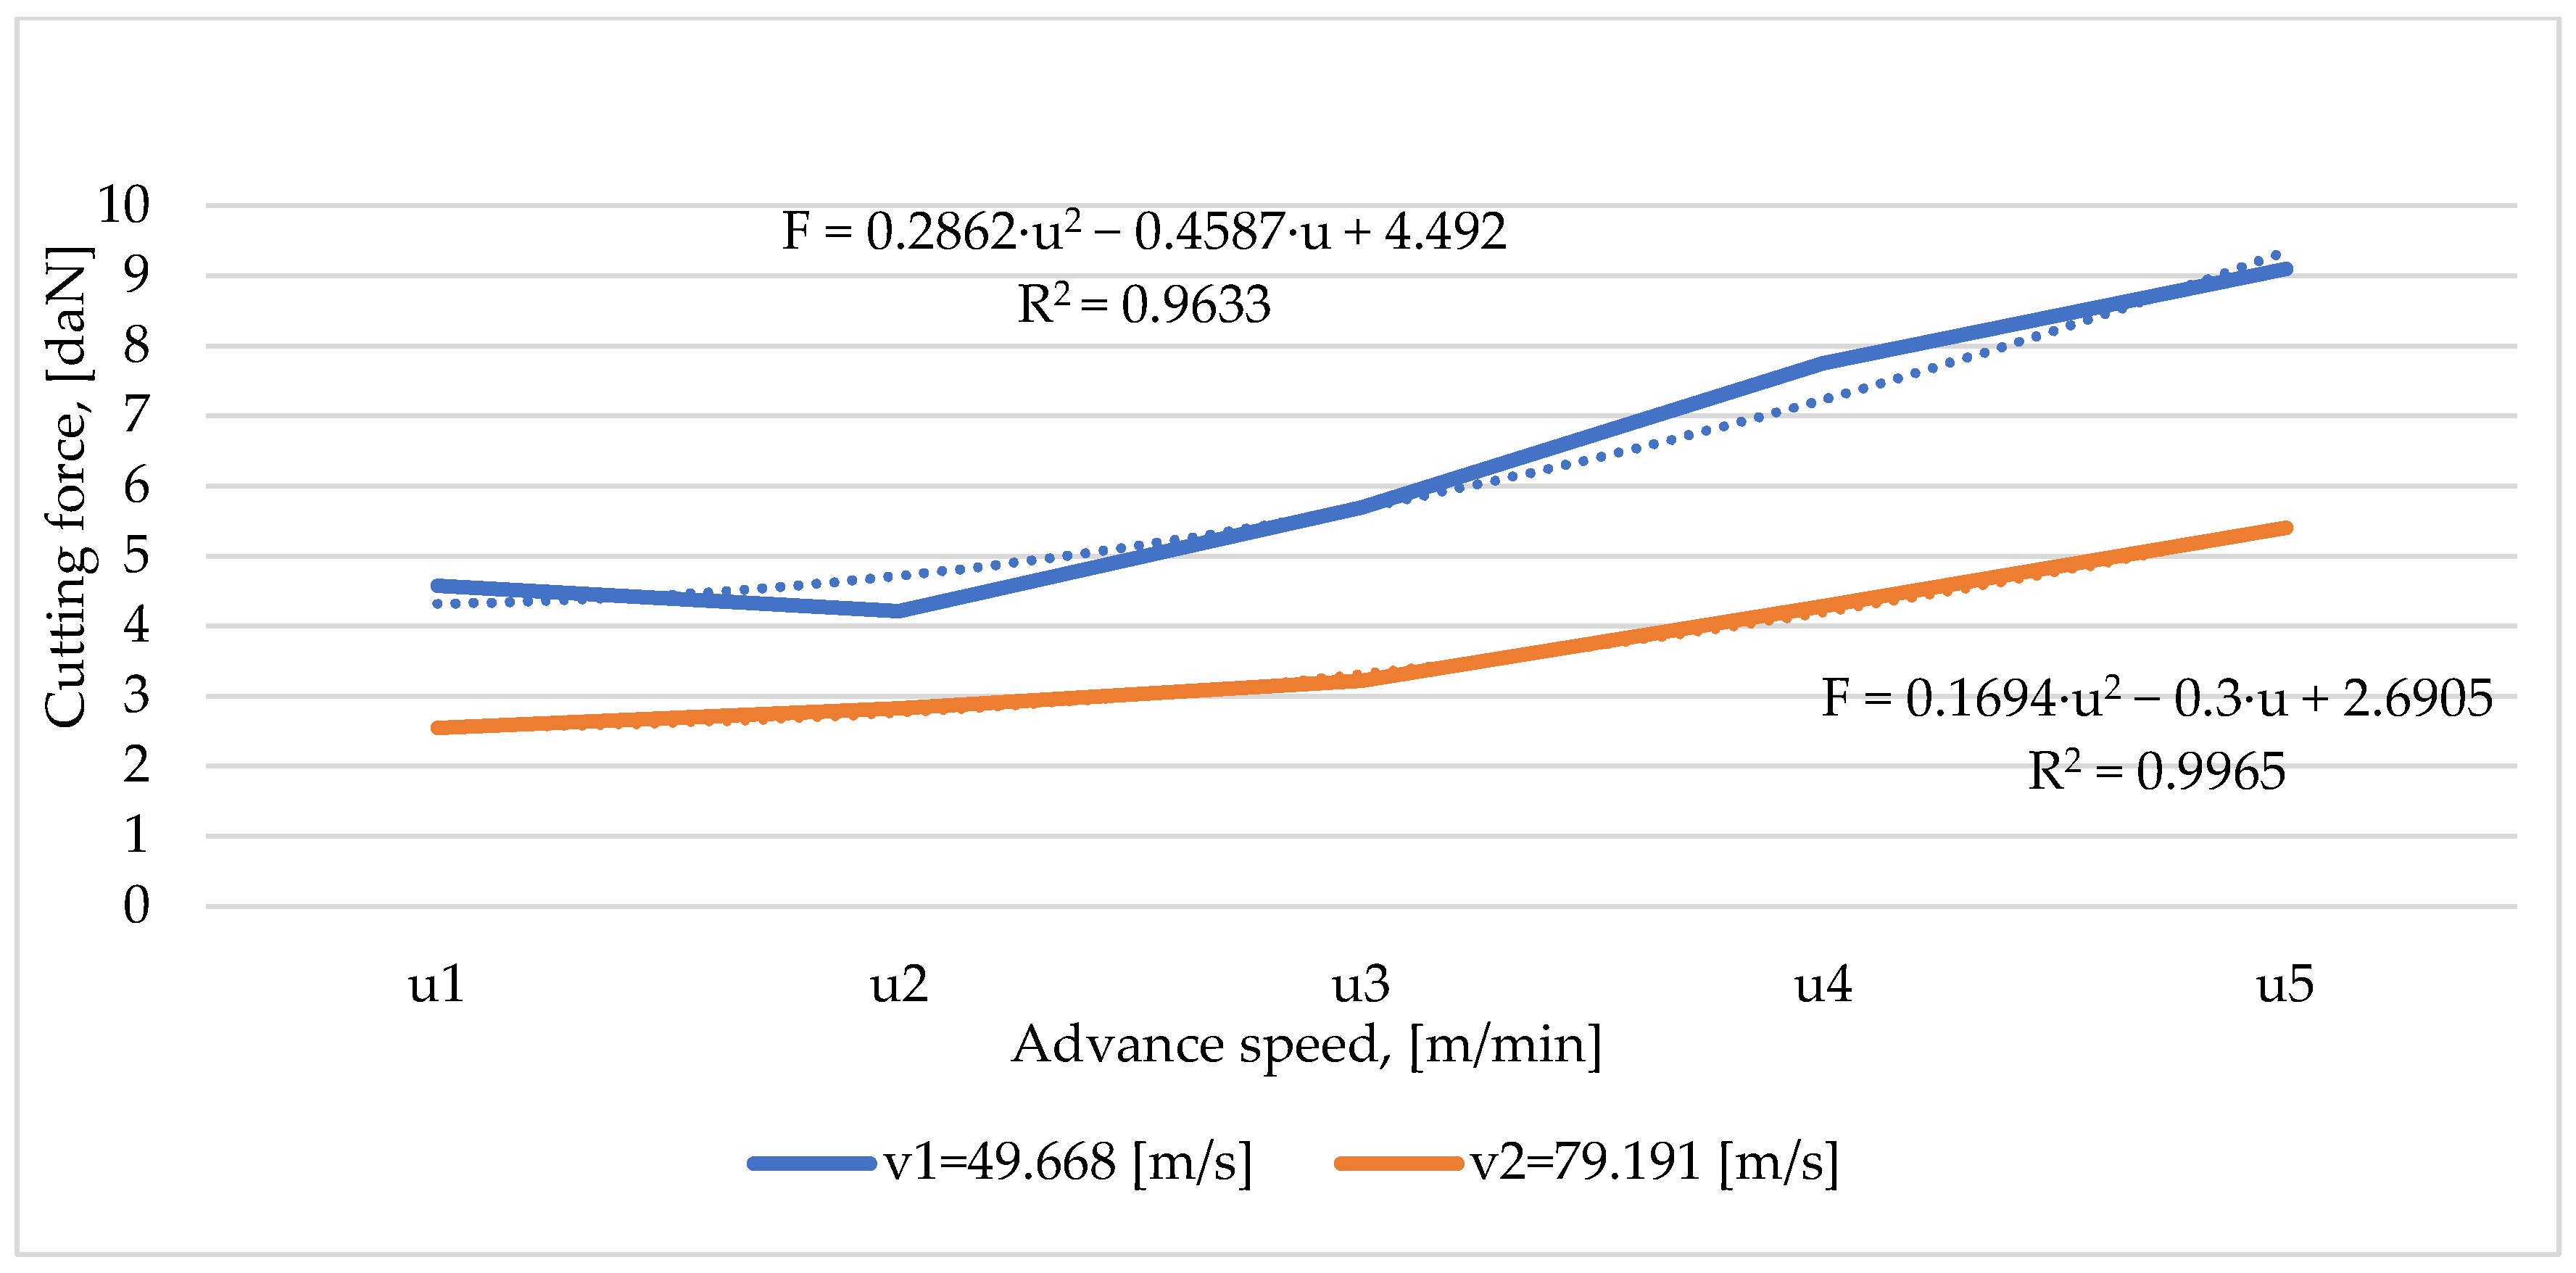
The specific mechanical work of cutting decreases with the increase in the advance speed and increases with the decrease in the tool speed and the cutting speed, respectively (Table 8 and Figure 9). The regression relationship between the specific mechanical work and the advance speed for the speed n1 = 4216 rpm is represented by the second-degree polynomial equation, with a coefficient of determination R2 = 0.991, and for the speed n2 = 6722 rpm, it is also represented by a polynomial equation of the second degree, with a coefficient of determination lower than the previous one, namely R2 = 0.9683.

3.5. Cutting Force

The cutting force varies directly proportionally with the increase in the advance speed and inversely proportionally with the revolution of the tool and the cutting speed, respectively (Figure 10 and Figure 11). The regression relationship between the cutting force and the advance speed for the rotation n1 = 4216 rpm is represented by the polynomial equation of the second degree, with a coefficient of determination R2 = 0.9633, and for the speed n2 = 6722 rpm, it is represented by the polynomial equation of the second degree, with a higher coefficient of determination, R2 = 0.9965.

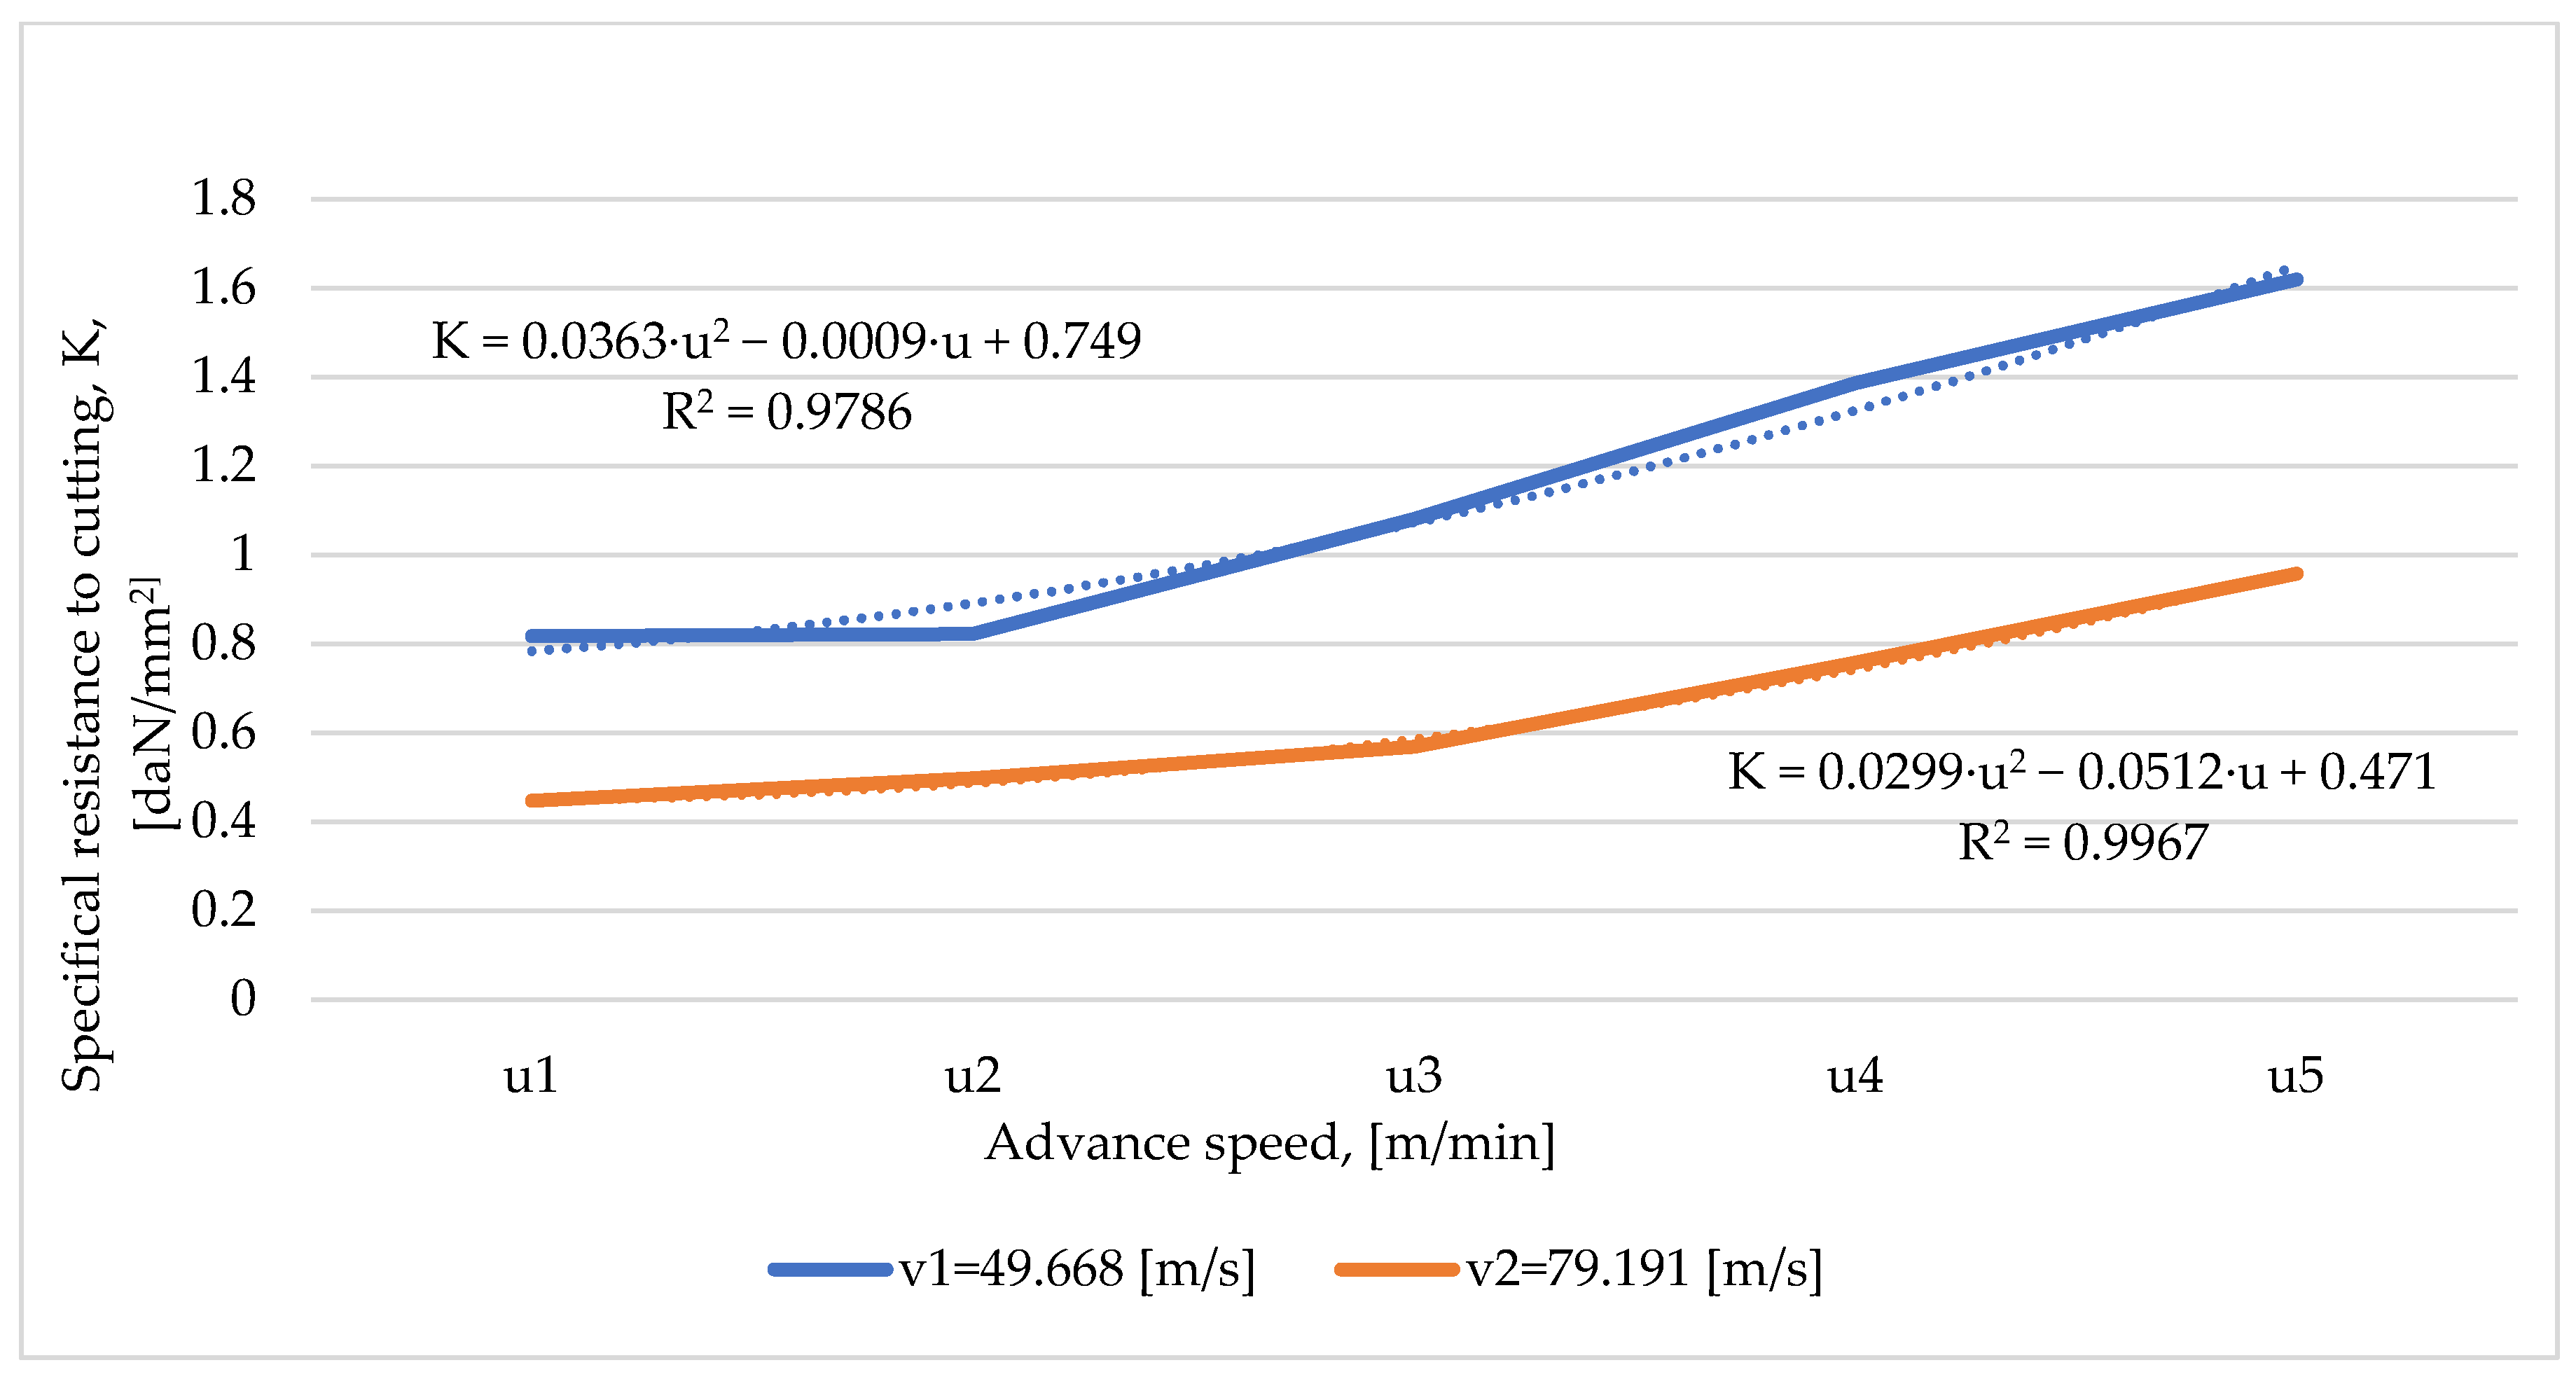
3.6. The Specific Resistance to Cutting

The specific resistance to cutting increased with the advance speed and decreased with the increase in the cutting speed (Figure 12).
The regression relationship between the specific cutting resistance and the advance speed for the cutting speed v1 = 49.66859 m/s is represented by a second-degree polynomial equation (Figure 12), with a coefficient of determination R2 = 0.9786, and the cutting speed v2 = 79.191696 m/s is given by another polynomial equation of the second degree with a higher coefficient of determination, R2= 0.9967.

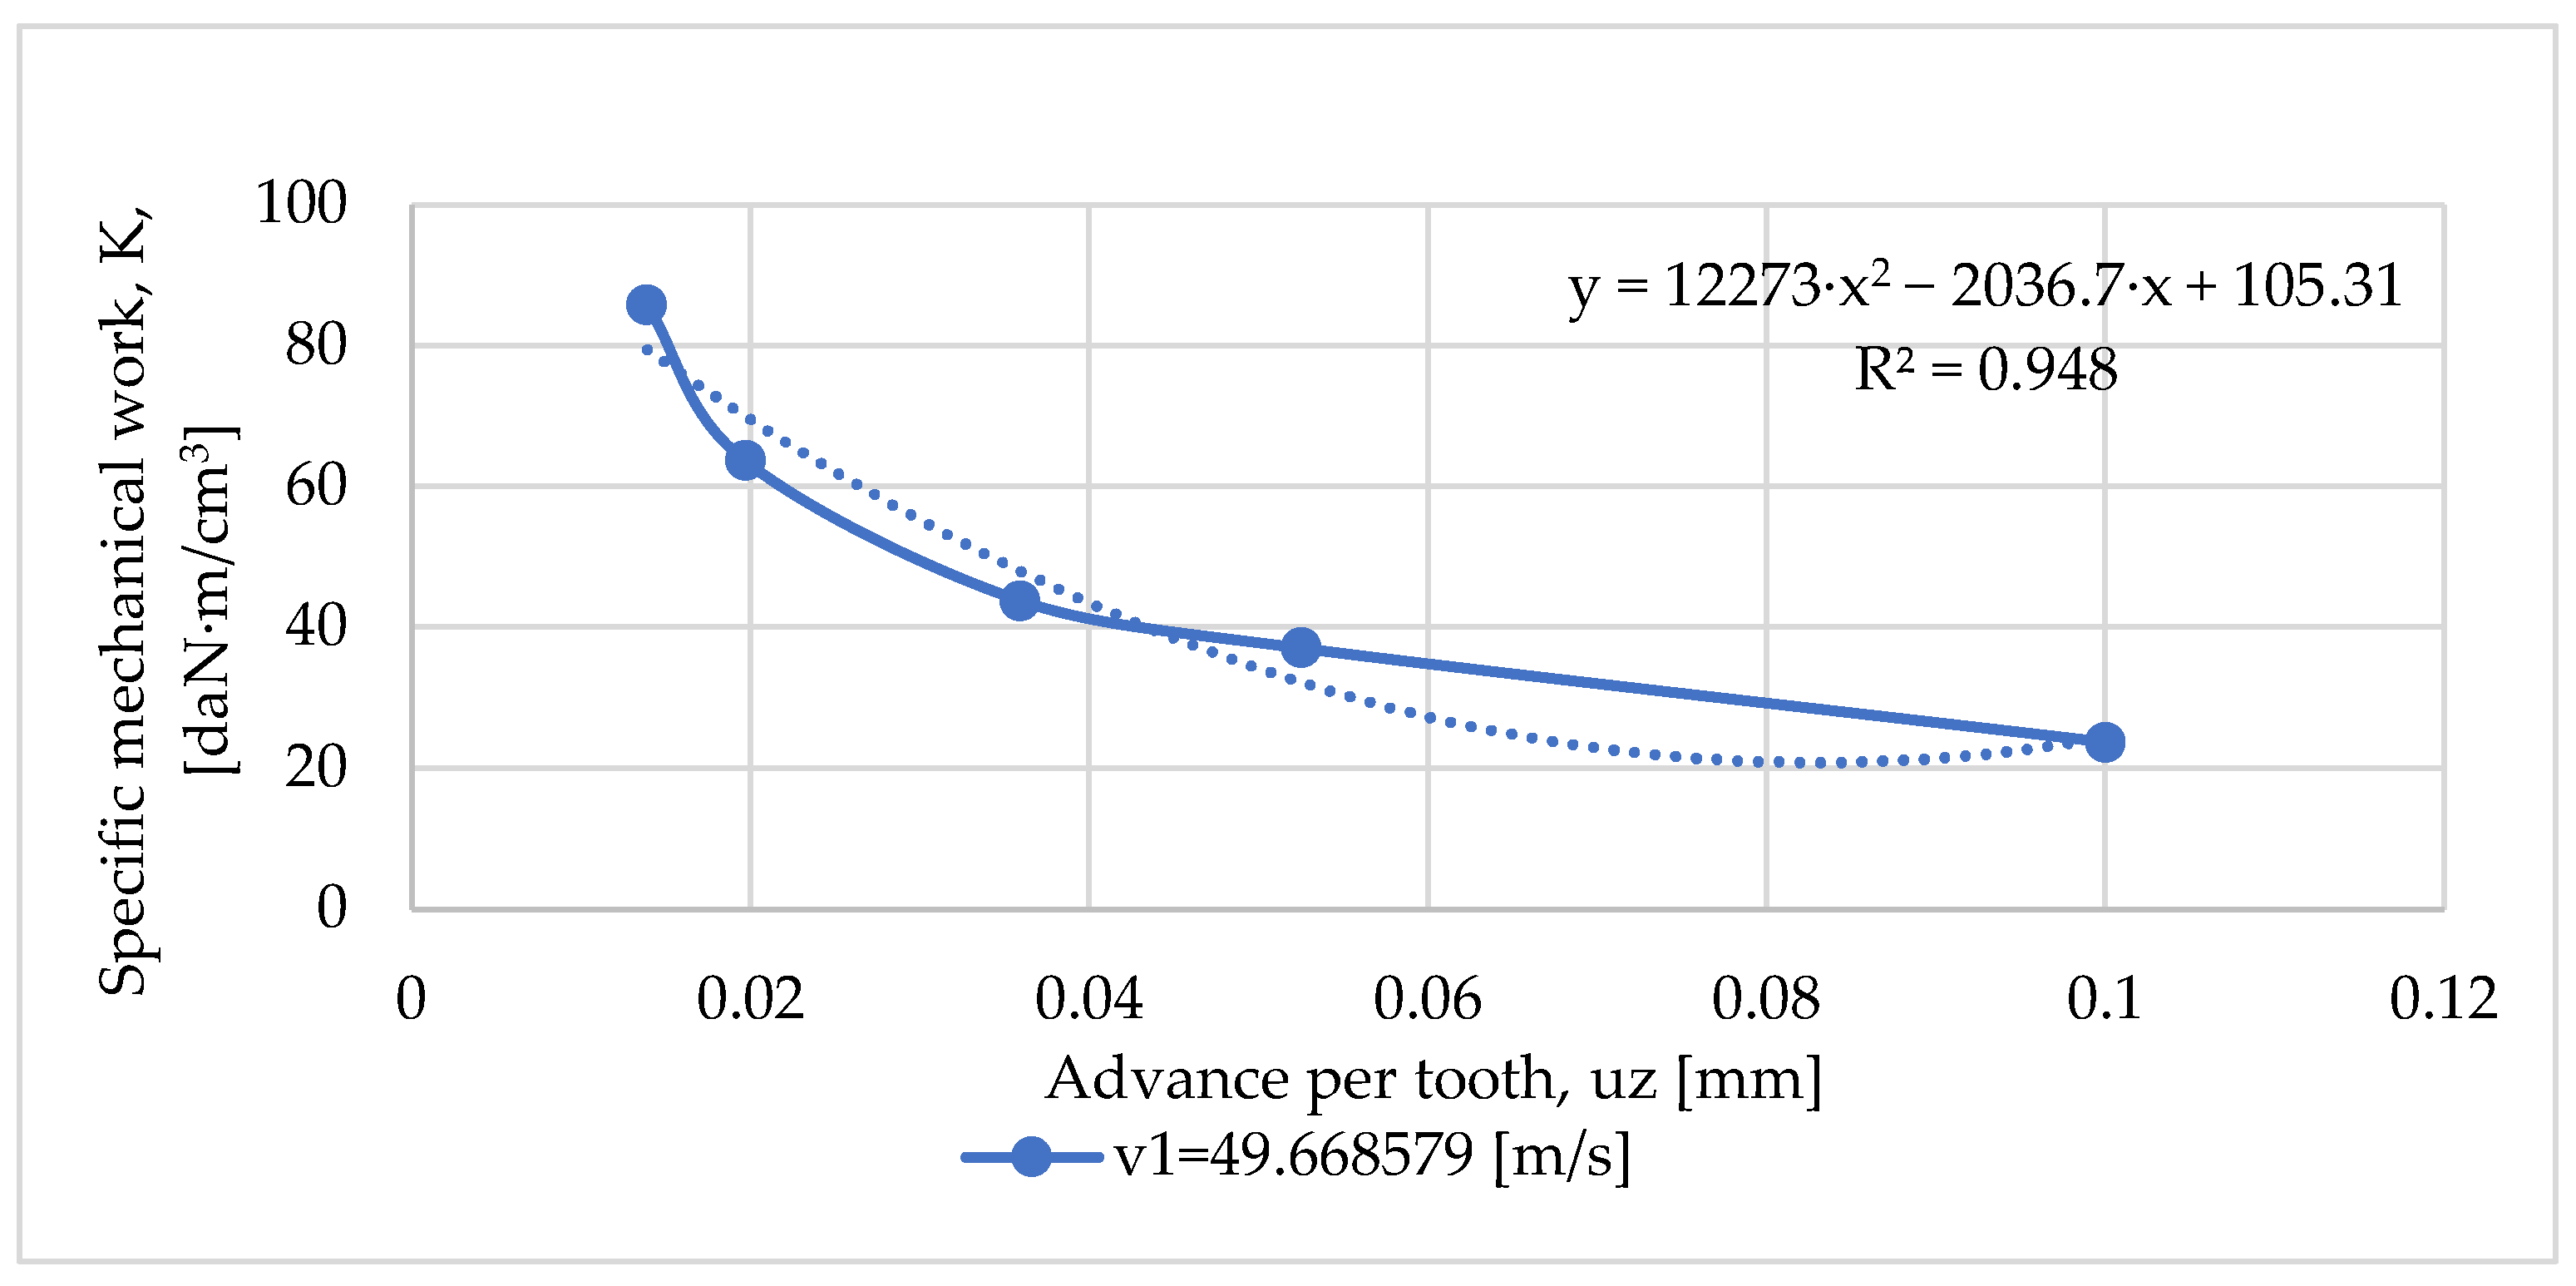
3.7. The Specific Mechanical Work

The specific mechanical work decreased as the advance on the tooth increased (Figure 13). The regression relationship between the specific mechanical work and the advance on the tooth for the cutting speed v1 = 49.66859 m/s is represented by a polynomial equation of the second degree, with a coefficient of determination R2 = 0.948 (Figure 12), and the cutting speed v2 = 79.191696 m/s is represented by another polynomial equation of the second degree, with a higher coefficient of determination, R2 = 0.9641 (Figure 14).

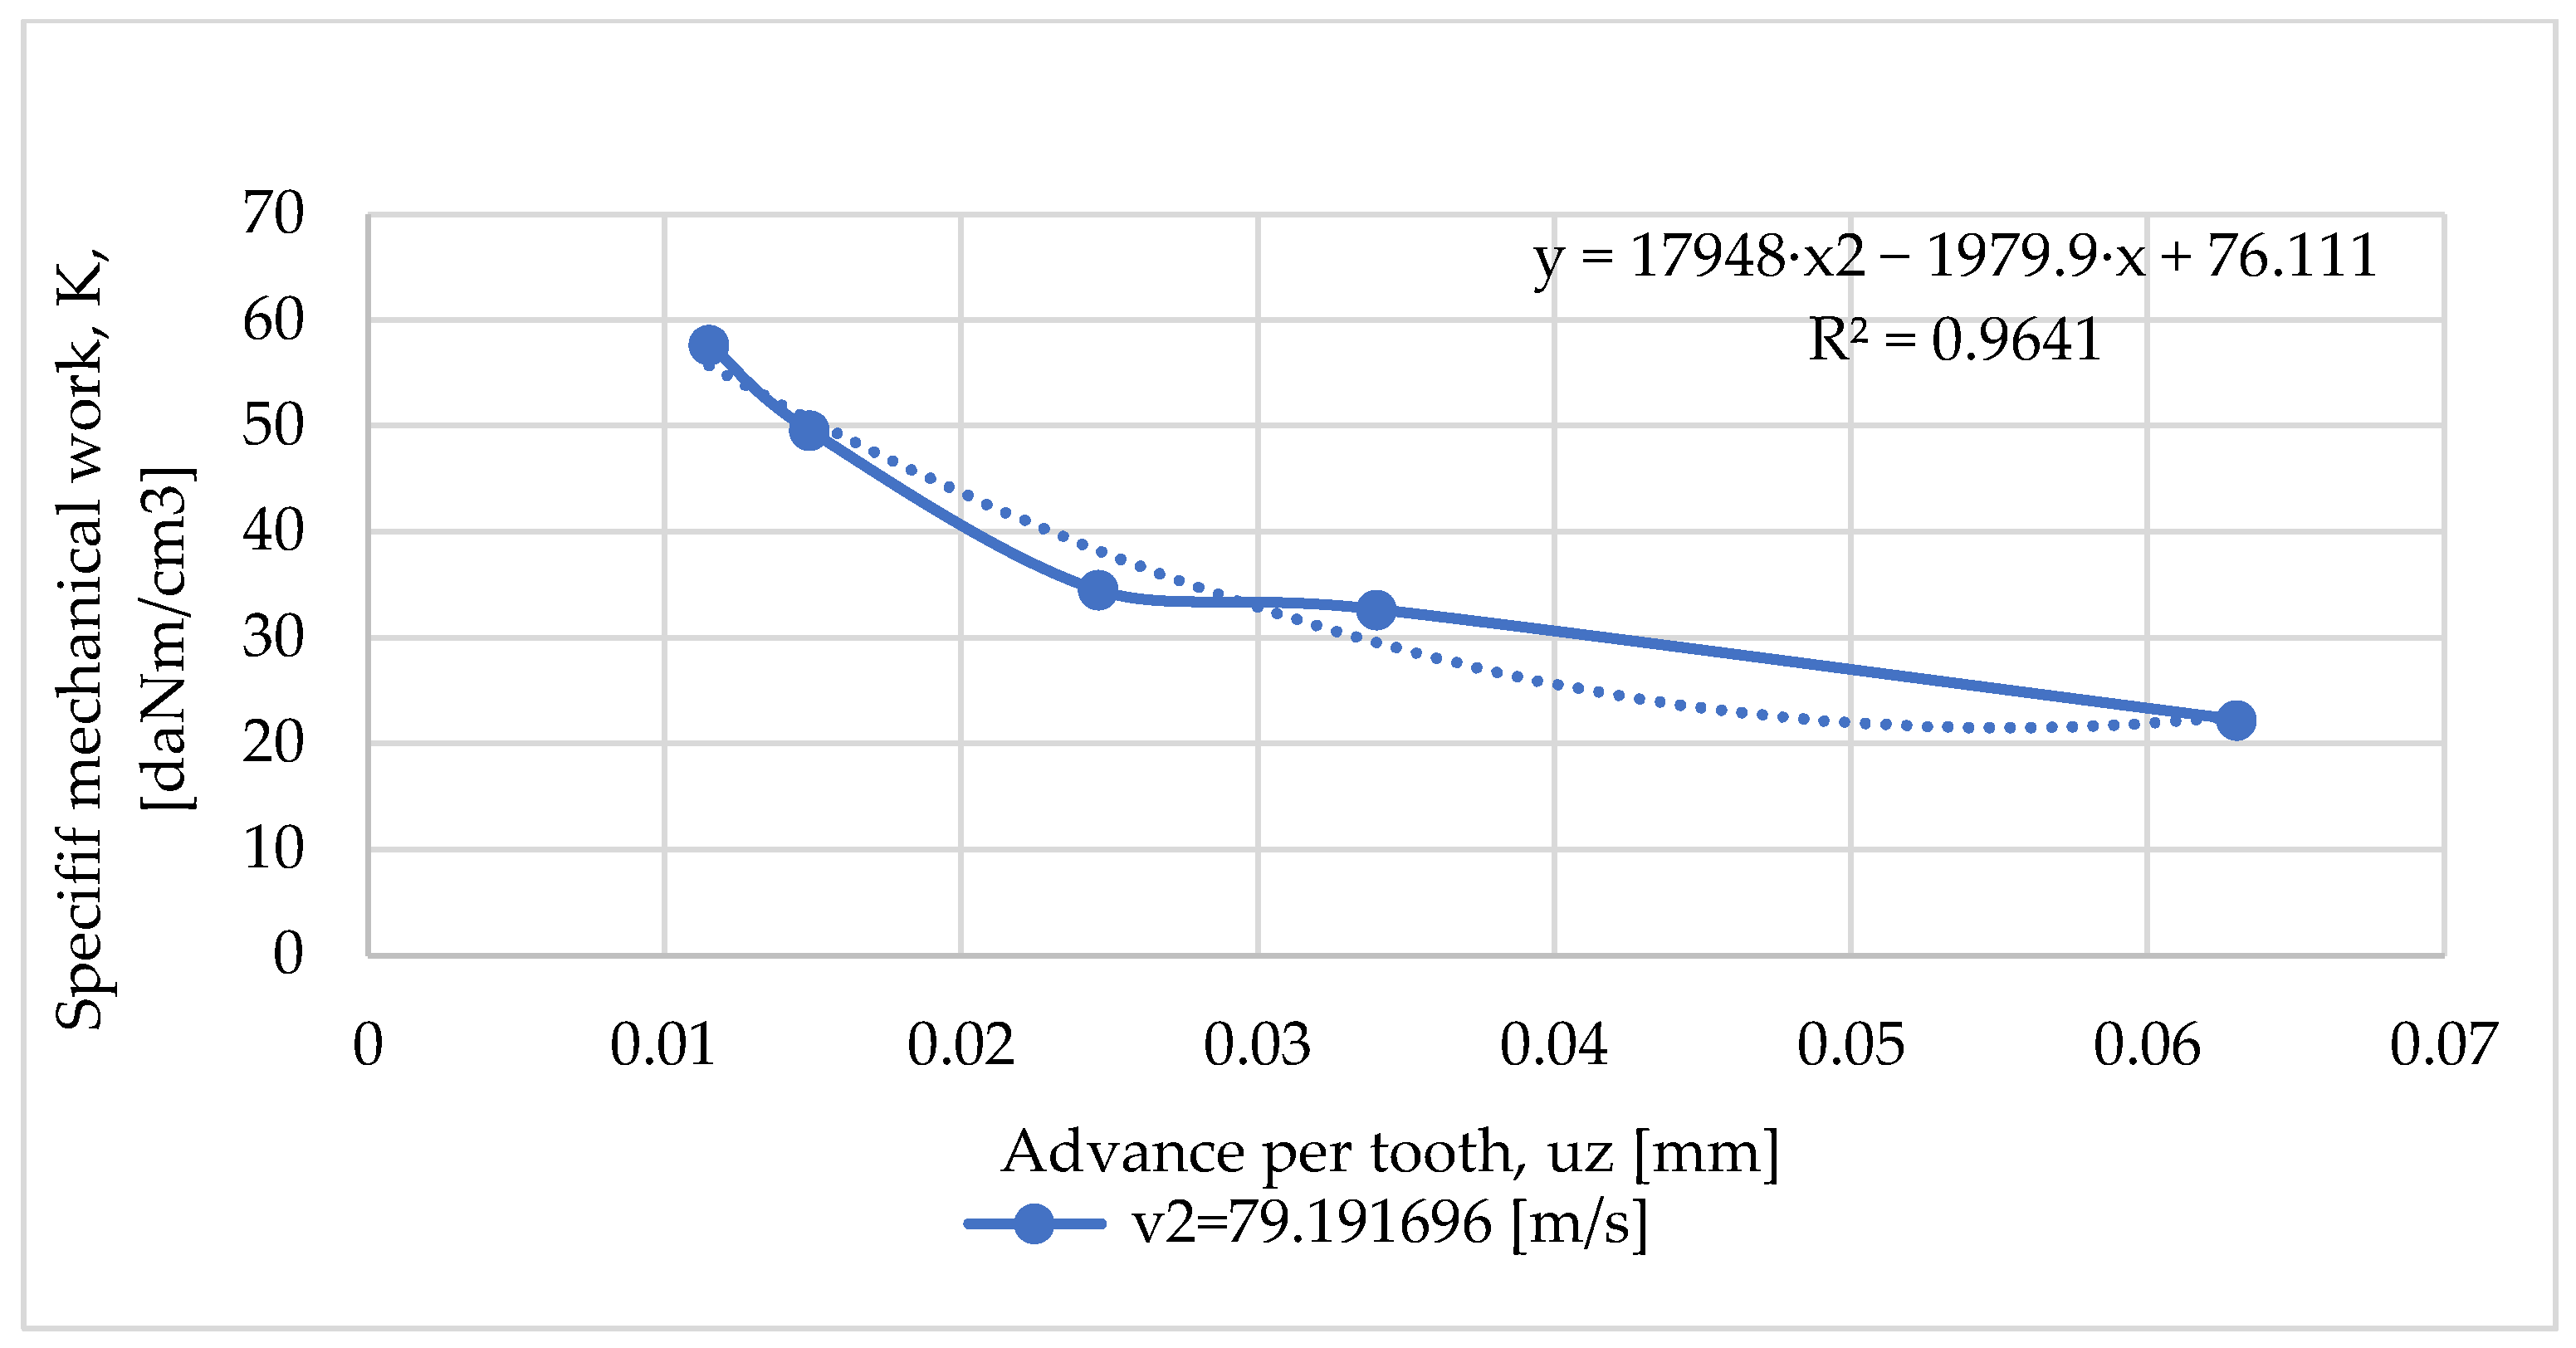
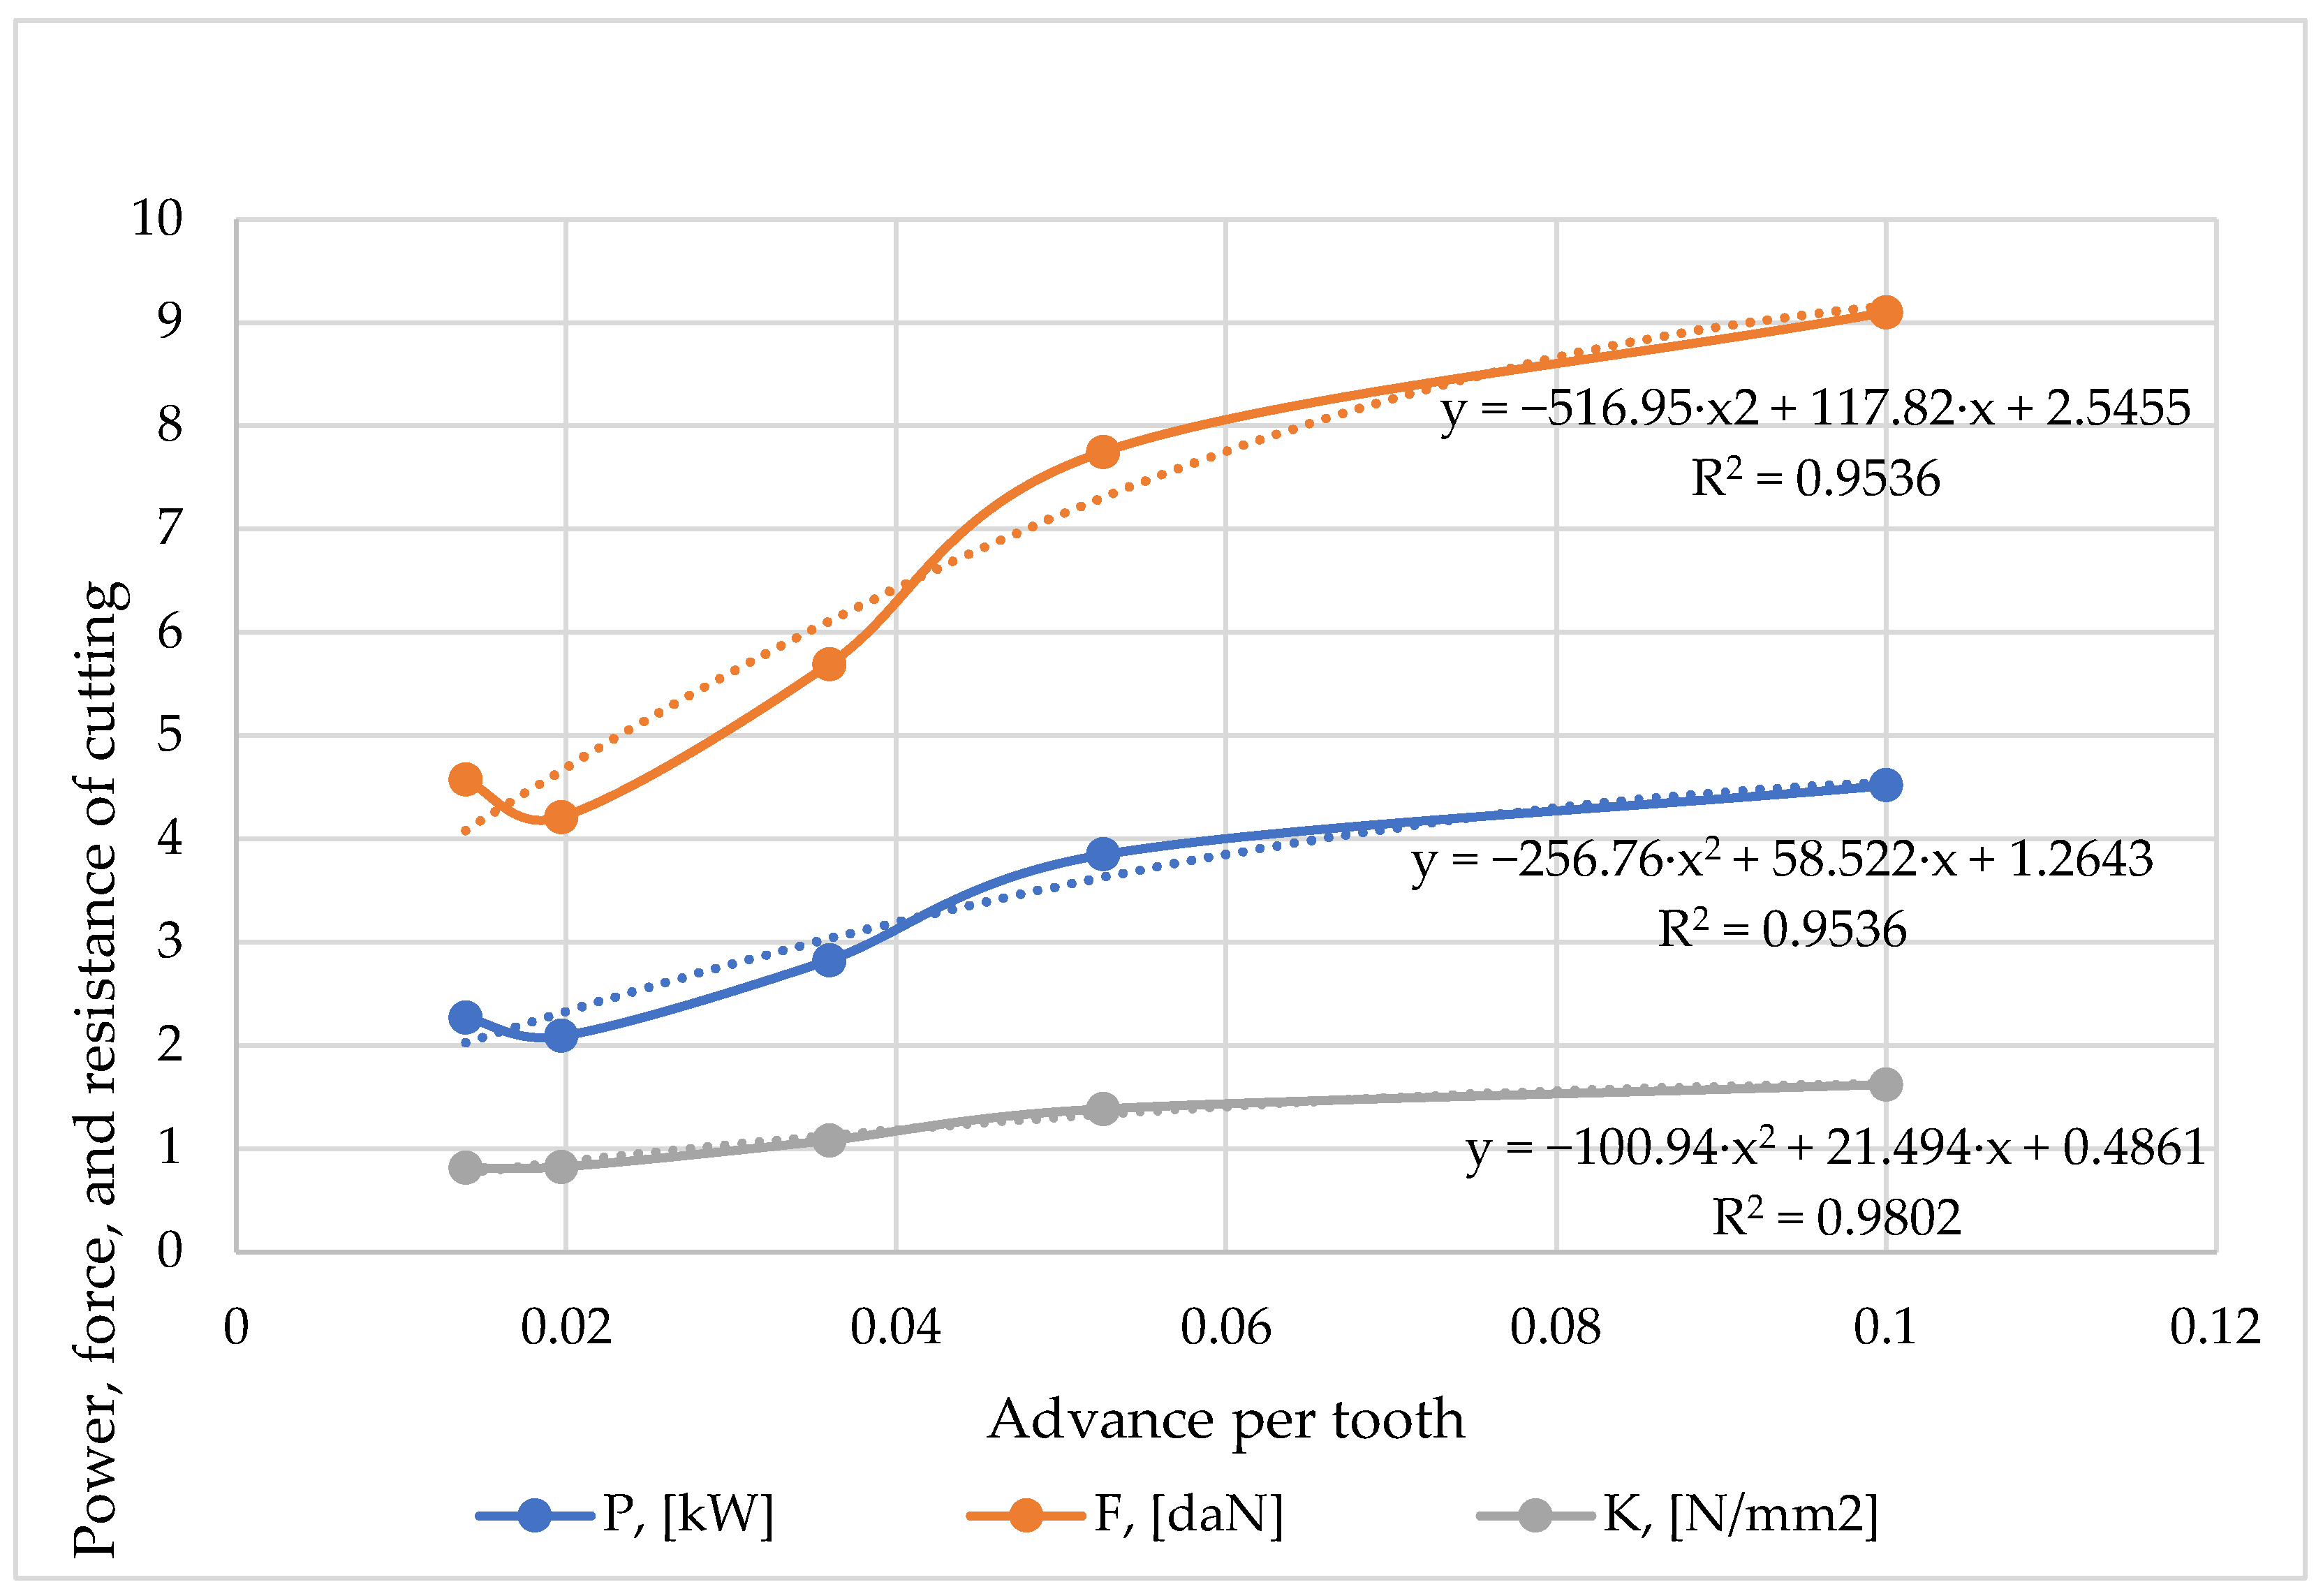
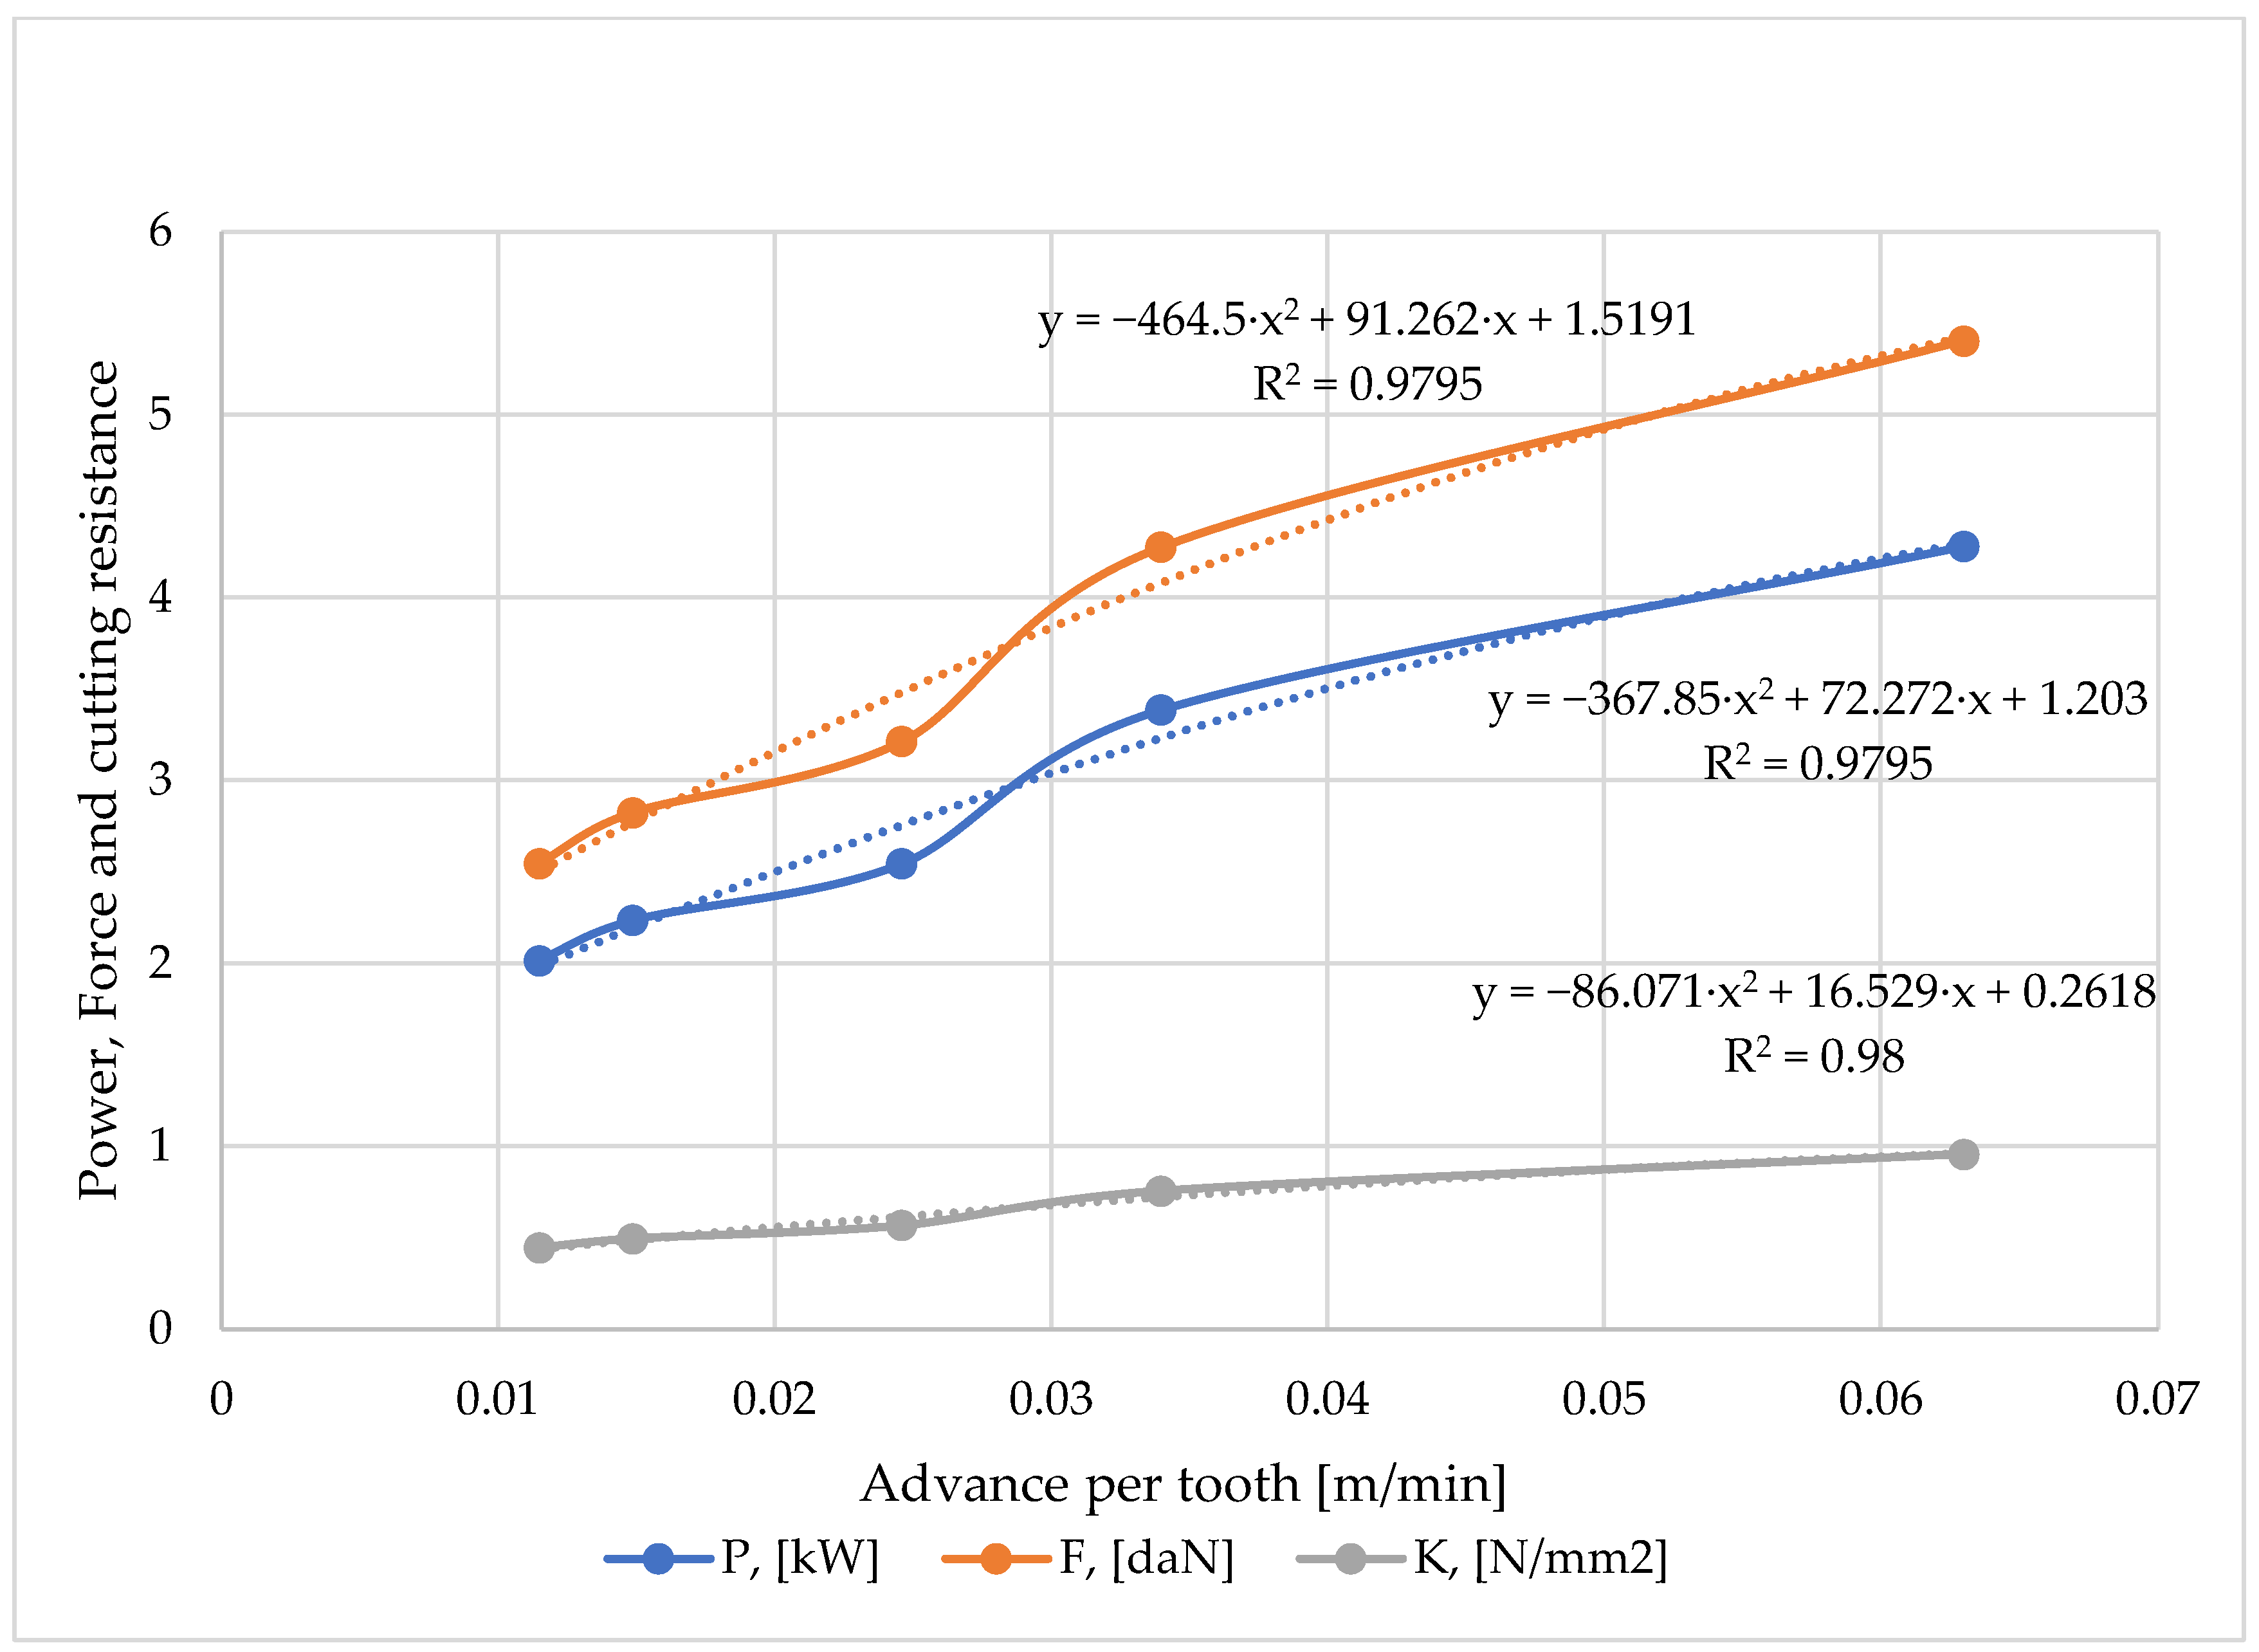
3.8. Cutting Power, Cutting Force and Specific Cutting Resistance Relating to Advance per Tooth

Cutting power, cutting force and specific cutting resistance increased with the increase in the advance on the tooth and are shown in Figure 15 and Figure 16.
The regression equations between these tree parameters and the advance on the tooth for the cutting speed v = 49.668 m/s was given by the polynomial relations of the second degree (visible in Figure 15), and for the cutting speed v = 79.191 m/s by other relations (visible in Figure 16).

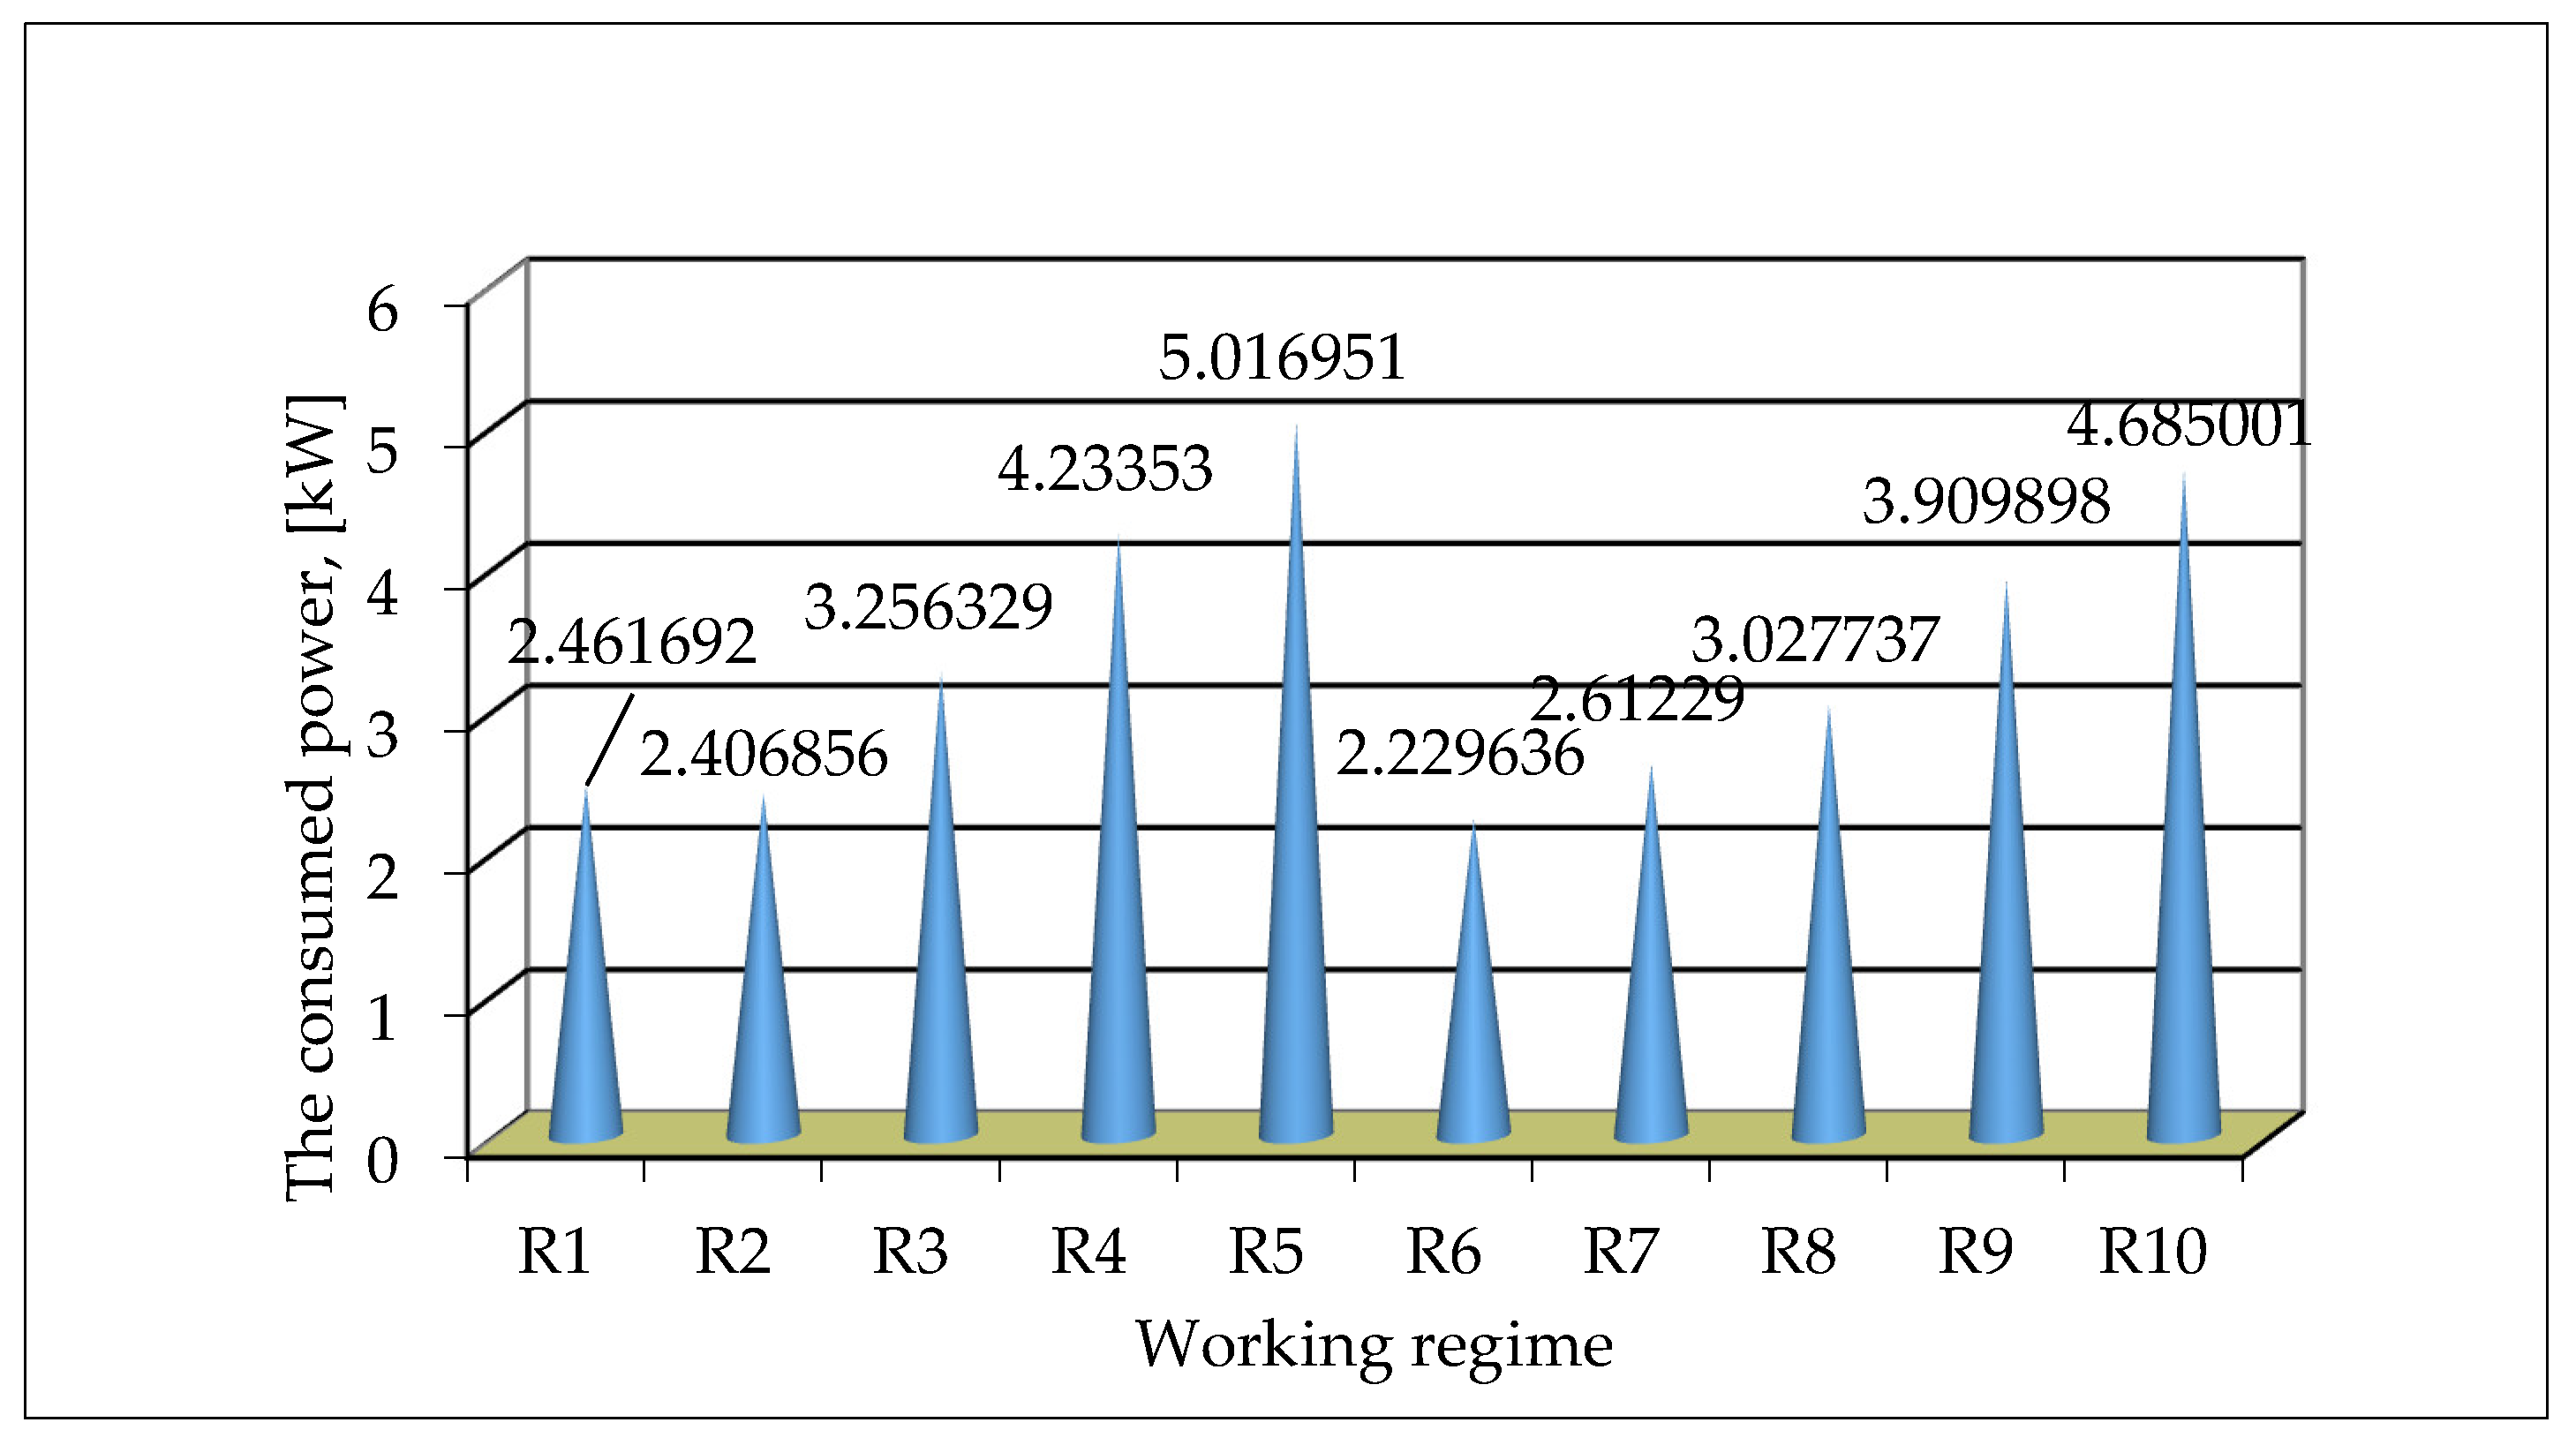
3.9. The Total Power That Was Consumed When the Panels Were Being Cut

The total power that was consumed when the panels were being cut was a sum of advance and cutting power, and is shown in Figure 17.
Based on the principle of reducing energy consumption, it can be observed that the optimal regime of cutting with circular discs of panels with a transverse texture made of spruce branches was the regime R6 characterized by the speed of the tool shaft 6722 rpm, the cutting speed of 79.191 m/s and the advance speed of 3.705 m/min.

4. Discussion

The working hypothesis from which this research started were multiple. First of all, it started from the hypothesis that the transverse structure of the wood offers a more pleasant image to the finished product [9], and the combination of several transverse structures of the wood complemented and intensified the general image of the finished product [8,9]. Also, a second research hypothesis was related to spruce branches, which are processed similarly to any other piece of softwood timber [10], and the gluing of dry slats is acceptable from the point of view of gluing resistance and deformation of obtained panels [4]. These simplifying hypotheses of the research led to the realization of panels from spruce branches [7] and, above all, their processing with cutting discs.
The second aspect of the discussions was about previous studies and comparisons with the results of actual research. Warguła et al. [39] found that when cutting wood, the average energy consumed per hour of operation was 1.67 kWh, and relative to the ton of wood cut, the electricity consumption was 11 kWh/t. If the necessary correlations are made (by transforming the speed into working hours and the dimensions of the panel used in tons of wood material), comparative values of the consumption of electrical energy can be found in the results of these authors and this study. Oliveira Guedes et al. [40] found different values of the specific mechanical work, depending on the wood species processed, as follows: 406 KJ/cm3 for Pinus taeda, 429 kJ/cm3 for Goupia glabra and 435 kJ/cm3 for Dypterix alata. If the transformation from kJ/cm3 to kWh/cm3 is made and the cutting duration is taken into account in the two cases, values of the specific mechanical work between 80 and 100 daN·m/cm3 are obtained, which are slightly higher than the results of the present work, which is on average 50 daN·m/cm3. The lower values obtained in this paper are due to the fact that the spruce wood used in this research is softer and less dense than the three species studied by Guedes et al. [40], and the direction of the cut also favors the reduction of specific mechanical work. Cristóvão et al. [42] studied the influence of the advance per tooth on the total energy consumption, finding for an advance per tooth of 0.45 mm a total energy consumption of 8 kW, and for an advance per tooth of 0.55 mm a total energy consumption of a 10 kW boiler. The current values of 2–4 kW energy consumption, specific to this research, were much lower than those obtained by the previous authors, being primarily due to a small advance per tooth, up to 0.1 mm, but mainly due to the longitudinal cutting of the wood. Differences between the values of the current research and those of other authors are due to the different type of cutting taken into consideration in this work, namely that of cutting with circular discs the panels with a transverse texture obtained from spruce branches. Also, the presence of a considerable number of adhesive layers in the path of the circular disc has a major influence on these differences.
The third approach to the discussions is the one related to findings and their implications. The first problem is related to the fact that panels with a transverse structure are particularly sensitive to processing, requiring tools with metal carbides that are well sharpened. Otherwise, the processing of these types of panels will be carried out with scraps of chips and fibers, reducing the quality of the processed surfaces. The second problem is that of the compression wood [8,9,13,14,15] that was at the exit end of the circular blade from the panel, which increased the chipping power and created chippings. Therefore, it is recommended to watch the panel carefully in order to identify the compression wood [14], in order to insert it with this end into the circular disc or to reduce the advance speed when compression wood is encountered, in order to reduce the cutting power and obtain a clean surface, without the plucking of chips and fibers.
Directions of future research could be multiple. First of all, the research of some hard deciduous species (such as hornbeam, beech, acacia, etc.), which show greater contractions and deformations to size, but also require greater cutting powers [41], could be the first direction of future research. In addition to this, the following could be used: epoxy or polyurethane adhesives, half prisms when making the panels (changing the image of the panel) and inclined cutting of the panel blocks, in order to elongate a section to the elliptical cross-sectional image of the branches.

5. Conclusions

Regarding the quality of the surfaces cut with circular blades, it is given by the value of the advance on the tooth. According to the experimental data, the advance on the tooth had values between 0.01 and 0.09 mm. These values lead to the classification of the cut surface in quality class 7–8, corresponding to a degree of fine-finished surface.
In order to reduce energy consumption, it is recommended that the idling time be as short as possible, because the advance power when idling represents between 49.86% and 96.86% of the advance power when the processing is under load, and the cutting power at idle represents between 14.12% and 35.01% of the cutting power when the processing is under load.
By finding the limitations of the specialized literature, the proposed objectives, the results obtained and the discussions on the topic addressed, the present research brings to the fore innovative and novel aspects in the field of cutting wood from spruce branches with circular discs.
Based on all experiments, it can be generally considered that panels with a transverse texture made of spruce branches can be successfully used in the production of small furniture and interior decoration items, because the workability with a circular saw gives them this specific quality when the advance per tooth is respected.

Author Contributions

Conceptualization, A.L. and A.M.O.; methodology, A.M.O.; software, A.L.; validation, A.M.O. and A.L.; formal analysis, A.L.; investigation, A.M.O.; resources, A.M.O.; data curation, A.M.O.; writing—original draft preparation, A.L.; writing—review and editing, A.L.; visualization, A.M.O.; supervision, A.M.O.; project administration, A.L.; funding acquisition, A.L. All authors have read and agreed to the published version of the manuscript.

Funding

This research received no external funding.

Data Availability Statement

Data are contained within the article.

Acknowledgments

We would like to thank the Transilvania University of Brasov for the logistical and administrative support given in carrying out this research.

Conflicts of Interest

The authors declare no conflicts of interest.

References

  1. Shmulsky, R.; Jones, P.D. Forest Products and Wood Science: An Introduction, 7th ed.; Wiley-Blackwell Publishing: Ames, IA, USA, 2011. [Google Scholar]
  2. Hakkila, P. Utilization of Residual Forest Biomass; Springer Series in Wood Science; Springer: Berlin/Heidelberg, Germany, 1989. [Google Scholar] [CrossRef]
  3. Swift, M.J.; Healey, I.N.; Hibberd, J.K.J.M.; Sykes, V.; Bampoe, M.E. The decomposition of branch-wood in the canopy and floor of a mixed deciduous woodland. Oecologia 1976, 26, 139–149. [Google Scholar] [CrossRef] [PubMed]
  4. English, B. Wastes into wood: Composites are a promising new resource. Environ. Health Perspect. 1994, 102, 168–170. [Google Scholar] [CrossRef] [PubMed]
  5. FAO. Wood Handbook. Available online: https://www.fpl.fs.fed.us/documnts/fplgtr/fpl_gtr190.pdf (accessed on 25 April 2022).
  6. Jahan-Latibari, A.; Roohnia, M. Potential of utilization of the residues from poplar plantation for particleboard production in Iran. J. For. Res. 2010, 21, 503–508. [Google Scholar] [CrossRef]
  7. Suansa, N.I.; Al-Mefarrej, H.A. Branch wood properties and potential utilization of this variable resource. BioResources 2020, 15, 479–491. [Google Scholar] [CrossRef]
  8. Olarescu, A.; Lunguleasa, A.; Radulescu, L. Using deciduous branch wood and conifer spindle wood to manufacture panels with transverse structure. BioResources 2022, 17, 6445–6463. [Google Scholar] [CrossRef]
  9. Olarescu, A.; Lunguleasa, A.; Radulescu, L.; Spirchez, C. Manufacturing and Testing the Panels with a Transverse Texture Obtained from Branches of Norway Spruce (Picea abies L. Karst.). Forests 2023, 14, 665. [Google Scholar] [CrossRef]
  10. Ramage, M.H.; Burridge, M.; Busse-Wicher, G.; Fereday, T.; Reynolds, D.U.; Shah, G.; Wu, L.; Yuc, P.; Densley-Tingleye, D.; Allwoode, J.; et al. The wood from the trees: The use of timber in construction. Renew. Sustain. Energy Rev. 2017, 68, 333–359. [Google Scholar] [CrossRef]
  11. Hassanpoor Tichi, A. Investigation of the use of old railroad ties (Fagus orientalis) and citrus branches (orange tree) in the particleboard industry. BioResources 2021, 16, 6984–6992. [Google Scholar] [CrossRef]
  12. Wilsson, B.F. Apical control of compression wood action in white pine branches. Wood Sci. Technol. 1986, 20, 111–117. [Google Scholar] [CrossRef]
  13. Li, X.; Yang, X.; Wu, H.X. Transcriptome profiling of radiata pine branches reveals new insights into reaction wood formation with implications in plant gravitropism. BMC Genom. 2013, 14, 768. [Google Scholar] [CrossRef]
  14. Hung, L.F.; Tsai, C.C.; Chen, S.J.; Huang, Y.-S.; Kuo-Huang, L.-L. Strain distribution, growth eccentricity, and tension wood distribution in the plagiotropic and orthotropic branches of Koelreuteria henryi Dummer. Trees 2017, 31, 149–164. [Google Scholar] [CrossRef]
  15. Aiso-Sanada, H.; Ishiguri, F.; Irawati, D.; Wahyudi, I.; Yokota, S. Reaction wood anatomy and lignin distribution in Gnetum gnemon branches. J. Wood Sci. 2018, 64, 872–879. [Google Scholar] [CrossRef]
  16. Tsai, C.C.; Hung, L.F.; Chien, C.T.; Chen, S.-J.; Huang, Y.-S.; Kuo-Huang, L.-L. Biomechanical features of eccentric cambial growth and reaction wood formation in broadleaf tree branches. Trees 2012, 26, 1585–1595. [Google Scholar] [CrossRef]
  17. Westing Arthur, H. Formation and function of compression wood in gymnosperms. Bot. Rev. 1965, 31, 381–480. [Google Scholar] [CrossRef]
  18. Petrovici, V.; Popa, V. Chemistry and Chemical Processing of Wood; Lux Libris Print-House: Brasov, Romania, 1997. [Google Scholar]
  19. Zhao, X.; Guo, P.; Zhang, Z.; Wang, X.; Peng, H.; Wang, M. Wood density and fiber dimensions of root, stem, and branch wood of Populus ussuriensis Kom. Trees. BioResources 2018, 13, 7026–7036. [Google Scholar] [CrossRef]
  20. Chaffey, N.J. Wood Formation in Trees. Cell Land Molecular Biology Techniques; CRC Press: Boca Raton, FL, USA, 2019; 384p. [Google Scholar]
  21. Vurdu, H.; Bensend, D.W. Proportions and Types of Cells in Stems, Branches, and Roots of European Black Alder (Alnus glutinosa L. Gaertn.). J. Wood Sci. 1980, 13, 36–40. [Google Scholar]
  22. Salem, M.Z.M.; Zayed, M.Z.; Ali, H.M.; Abd El-Kareem, M.S.M. Chemical composition, antioxidant and antibacterial activities of extracts from Schinus molle wood branch growing in Egypt. J. Wood. Sci. 2016, 62, 548–561. [Google Scholar] [CrossRef]
  23. Pulido-Rodríguez, E.; López-Camacho, R.; Tórres, J. Traits and trade-offs of wood anatomy between trunks and branches in tropical dry forest species. Trees 2020, 34, 497–505. [Google Scholar] [CrossRef]
  24. ISO 13061-2; Physical and Mechanical Properties of Wood—Test Methods for Small Clear Wood Specimens—Part 2: Determination of Density for Physical and Mechanical Tests. International Organization for Standardization: Geneva, Switzerland, 2014.
  25. EN 325; Wood-Based Panels—Determination of Dimensions of Test Pieces. European Committee for Standardization: Brussels, Belgium, 2012.
  26. EN 310; Wood-Based Panels—Determination of Modulus of Elasticity in Bending and of Bending Strength. European Committee for Standardization: Brussels, Belgium, 1993.
  27. ISO 13061-4; Physical and Mechanical Properties of Wood—Test Methods for Small Clear Wood Specimens—Part 4: Determination of Modulus of Elasticity in Static Bending. International Organization for Standardization: Geneva, Switzerland, 2014.
  28. Gonçalves, R.; Garcia, G.H.L.; Brazolin, S.; Bertoldo, C.; Ruy, M. Methodology for the characterization of elastic constants of wood from tree branches. BioResources 2019, 14, 8439–8454. [Google Scholar] [CrossRef]
  29. Luan, S.; Yang, R. Predetermination stem wood quality with the branch wood index of Korean pine. J. N. For. Univ. 1992, 3, 54–61. [Google Scholar] [CrossRef]
  30. Schweingruber, F.H. Trees and Wood in Dendrochronology; Springer Series in Wood Science; Springer: Berlin/Heidelberg, Germany, 2009; p. 402. [Google Scholar]
  31. Schweingruber, F.H.; Börner, A.; Schulze, E. Atlas of Stem Anatomy in Herbs, Shrubs and Trees; Springer: Berlin/Heidelberg, Germany, 2011; Volume 1, p. 495. [Google Scholar]
  32. Kucera, L.J.; Philipson, W.R. Growth eccentricity and reaction anatomy in branch wood of Drimys winteri and five native New Zealand trees. N. Z. J. Bot. 1977, 15, 517–524. [Google Scholar] [CrossRef]
  33. Burgert, I.; Jungnikl, K. Adaptive Growth of Gymnosperm Branches- Ultrastructural and Micromechanical Examinations. J. Plant Growth Regul. 2004, 23, 76–82. [Google Scholar] [CrossRef]
  34. Brezet, H.; van Hemel, C. Ecodesign—A Promising Approach to Sustainable Production and Consumption; United Nations Environment Program: Paris, France, 1997. [Google Scholar]
  35. Bras, B. Incorporating Environmental Issues in Product Design and Realization. Ind. Environ. 1997, 20, 7–13. [Google Scholar]
  36. Zeng, Y. Environment-Based Design (EBD): A Methodology for Transdisciplinary Design+. JIDPS 2015, 19, 5–24. [Google Scholar] [CrossRef]
  37. Nielsen, P. Integration of Environmental Aspects in Product Development: A Stepwise Procedure Based on Quantitative Lifecycle Assessment. J. Clean. Prod. 2002, 10, 247–257. [Google Scholar] [CrossRef]
  38. Hlásková, L.; Orlowski, K.A.; Kopecký, Z.; Jedinák, M. Sawing processes as a way of determining fracture toughness and shear yield stresses of wood. BioResources 2015, 10, 5381–5394. [Google Scholar] [CrossRef]
  39. Warguła, Ł.; Kukla, M.; Wieczorek, B.; Krawiec, P. Energy Consumption of the Wood Size Reduction Processes with Employment of a Low-power Machines with Various Cutting Mechanisms. Renew. Energy 2022, 181, 630–639. [Google Scholar] [CrossRef]
  40. Guedes, O.J.T.; da Silva, R.M.; Gherardi Hein, P.R.; Fereira, S.C. Cutting energy required during the mechanical processing of wood species at different drying stages. Maderas Cienc. Tecnol. 2020, 22, 477–482. [Google Scholar] [CrossRef]
  41. Chuchala, D.; Ochrymiuk, T.; Orlowski, K.; Lackowski, M.; Taube, P. Predicting Cutting Power for Band Sawing Process of Pine and Beech Wood Dried with the Use of Four Different Methods. BioResources 2020, 15, 1844–1860. [Google Scholar] [CrossRef]
  42. Cristóvão, L.; Ekevad, M.; Grönlund, A. Industrial sawing of Pinus sylvestris L.: Power Consumption. BioResources 2013, 8, 6044–6053. [Google Scholar] [CrossRef]
  43. ISO 2602; Statistical Interpretation of Test Results—Estimation of the Mean—Confidence Interval Interpretation. International Organization for Standardization: Geneva, Switzerland, 1980.
Figure 1. (a) Cutting scheme with circular discs plated with metal carbides: h is the cutting height equal to the thickness of the panel, in mm; n is the speed, in rotation per minute (rpm); u is the advance speed, in mm/min; e is the distance from the axis of rotation of the circular blade to the machine’s ground; uz is the advance per tooth, in mm; v is the cutting speed, in m/s; F is the cutting force, in N; (b) panel from spruce branches.
Forests 15 00685 g001
Figure 2. Scheme of measuring the cutting and advance power when the panels are cut.
Forests 15 00685 g002
Figure 3. Cutting power (Pas) and feed power (Pav) for R1 and R2 regimes: (a) for regime R1 and sample number 1; (b) for regime R1 and sample number 2; (c) for regime R2 and sample number 3; (d) for regime R2 and sample number 4.
Forests 15 00685 g003aForests 15 00685 g003b
Figure 4. Cutting power (Pas) and advance power (Pav) for R3 and R4 regimes: (a) for regime R3 and panel 4; (b) for regime R3 and panel 5; (c) for regime R4 and panel 1; (d) for regime R4 and panel 2.
Forests 15 00685 g004
Figure 5. Cutting power (Pas) and advance power (Pav) for R5 and R6 regimes: (a) for regime R5 and panel 6; (b) for regime R5 and panel 4; (c) for regime R6 and panel 4; (d) for regime R6 and panel 5.
Forests 15 00685 g005
Figure 6. Cutting power (Pas) and advance power (Pav) for R7 and R8 regimes: (a) for regime R7 and panel 1; (b) for regime R7 and panel 2; (c) for regime R8 and panel 3; (d) for regime R8 and panel 4.
Forests 15 00685 g006
Figure 7. Cutting and advance consumed power for R9 and R10 regimes: (a) for regime R9 and panel 4; (b) for regime R9 and panel 5; (c) for regime R10 and panel 2; (d) for regime R10 and panel 3.
Forests 15 00685 g007
Figure 8. The T-TPfSB characteristic power diagram model. Zmg is the idling zone before the start of the cut and after the end of the cut; Zin is the entry zone of the blade into the material characterized by the successive entry of the teeth into the material, in which at the end of this zone, each blade tooth cuts only once from the material; Zms is the load walking zone, in which the blade cuts successively with all the teeth; Zie is the teeth exit zone characterized by the successive exit of the teeth from the cutting process.
Forests 15 00685 g008
Figure 9. Variation of cutting power depending on advance speed and cutting speed.
Forests 15 00685 g009
Figure 10. The variation of the specific mechanical work of cutting depending on the advance rate and the cutting speed.
Forests 15 00685 g010
Figure 11. The variation of the cutting force depending on the advance rate and the cutting speed.
Forests 15 00685 g011
Figure 12. The variation of the specific cutting resistance depending on the advance rate and the cutting speed.
Forests 15 00685 g012
Figure 13. The variation of the specific mechanical work of cutting depending on the advance on the tooth for v1 = 49.668579 m/s.
Forests 15 00685 g013
Figure 14. The variation of the specific mechanical work of cutting depending on the advance on the tooth for v2 = 79.191696 m/s.
Forests 15 00685 g014
Figure 15. Correlation between cutting power (P), force (F), specific cutting resistance (K) and feed per tooth for v = 49.660 m/s.
Forests 15 00685 g015
Figure 16. Correlation between cutting power (P), force (F), specific cutting resistance (K) and advance per tooth for v = 79.191 m/s.
Forests 15 00685 g016
Figure 17. Total power when a circular saw cuts the panels from cross-textured spruce branches.
Forests 15 00685 g017
Table 1. Correlation factor between the output signal value Vu and the measured active power P, for advance speeds (u1,…,u5) and cutting speeds (v1 and v2).
CharacteristicsActive Power Measured with the Wattmeter, [kW]Output Signal Value (Acquisition Board) Vu, [V]The Correlation Factor, fc
u10.300.8380.357
u20.280.3530.793
u30.340.4930.688
u40.260.3530.736
u50.330.9400.350
v10.560.2242.492
v20.680.3921.730
Table 2. Working regimes and coding of samples.
RegimeCode of Sample
R1 (n1 = 4216 rot/min; u1 = 2.811 m/min)n1u1-(i) (i = 1,2,3,4,5)
R2 (n1 = 4216 rot/min; u2 = 3.981 m/min)n1u2-(i) (i = 1,2,3,4,5)
R3 (n1 = 4216 rot/min; u3 = 7.269 m/min)n1u3-(i) (i = 1,2,3,4,5)
R4 (n1 = 4216 rot/min; u4 = 10.629 m/min)n1u4-(i) (i = 1,2,3,4,5)
R5 (n1 = 4216 rot/min; u5 = 20.233 m/min)n1u5-(i) (i = 1,2,3,4,5)
R6 (n2 = 6722 rot/min; u1 = 3.705 m/min)n2u1-(i) (i = 1,2,3,4,5)
R7 (n2 = 6722 rot/min; u2 = 4.798 m/min)n2u2-(i) (i = 1,2,3,4,5)
R8 (n2 = 6722 rot/min; u3 = 7.937 m/min)n2u3-(i) (i = 1,2,3,4,5)
R9 (n2 = 6722 rot/min; u4 = 10.962 m/min)n2u4-(i) (i = 1,2,3,4,5)
R10 (n2 = 6722 rot/min; u5 = 20.324 m/min)n2u5-(i) (i = 1,2,3,4,5)
Table 3. Parameters of regime R1 and R2.
Cutting CodeRegime R1 (n1 = 4216 rot/min; u2 = 2.8 m/min)
Feed Power, [kW]Cutting Power, [kW]Mechanical Work, K, [daN·m/cm3]Cutting Force,
F, [daN]
Specifical Force, K1,
[N/mm2]
On EmptyOn WorkOn EmptyOn Work
n1u2 (1)0.3000.3250.6142.32188.4134.6730.834
n1u2 (2)0.2110.2160.6072.28887.8314.6080.825
n1u2 (3)0.2080.2180.5862.35791.2964.7460.848
n1u2 (4)0.2090.2120.5882.34289.9964.7150.843
n1u2 (5)0.1940.2110.5582.25184.2074.5320.810
Mean0.2240.2370.5912.31288.3494.6550.832
SD0.0420.0490.0210.0422.6840.0850.015
V-5%0.1840.1900.5702.27185.7904.5730.817
Cutting CodeRegime R2 (n1 = 4216 rot/min; u3 = 3.981 m/min)
n1u3-(1)0.280.3130.5772.13869.6954.3050.840
n1u3-(2)0.280.3140.5862.10968.7184.2480.829
n1u3-(3)0.280.32340.5842.15870.5744.3450.848
n1u3-(4)0.2800.3290.5682.43462.4984.9010.956
n1u3-(5)0.2790.3290.5912.50663.9495.0460.983
Mean0.2790.3220.5812.26967.0874.5690.891
SD0.000070.0070.0080.1863.6230.3740.072
V-5%0.2790.3140.5732.09263.6344.2120.822
Table 8. Synthesis of the cutting parameters obtained after processing the experimental data.
Cutting speed, v = 49.668 [m/s]
ParameterAdvance per Tooth, uz, [mm/tooth]
0.0130.0190.0350.0520.099
Cutting power, Pas, [kW]2.2712.0922.8263.8474.519
Advance power, Pav, [kW]0.1900.3140.4300.3850.497
Cutting force, F, [daN]4.5734.2125.6907.7469.099
Specific mechanical strength, K, [N/mm2]0.8170.8221.0791.3851.619
Specific mechanical work, K1, [daNm/cm3]85.79063.63443.77537.04623.688
Cutting speed, v = 79.191 [m/s]
ParameterAdvance per tooth, uz, [mm/tooth]
0.0110.0140.0240.0330.062
Cutting power, Pas, [kW]2.0172.2372.5463.3874.280
Advance power, Pav, [kW]0.2110.3740.4810.5220.404
Cutting force, F, [daN]2.5472.8253.2154.2765.405
Specific mechanical strength, K, [N/mm2]0.4480.4970.5690.7580.957
Specific mechanical work, K1, [daNm/cm3]57.71949.59834.54032.69422.258
Disclaimer/Publisher’s Note: The statements, opinions and data contained in all publications are solely those of the individual author(s) and contributor(s) and not of MDPI and/or the editor(s). MDPI and/or the editor(s) disclaim responsibility for any injury to people or property resulting from any ideas, methods, instructions or products referred to in the content.

